Association of dietary patterns with serum phosphorus in maintenance haemodialysis patients: a cross sectional study - Nature
←
→
Page content transcription
If your browser does not render page correctly, please read the page content below
www.nature.com/scientificreports
OPEN Association of dietary patterns
with serum phosphorus
in maintenance haemodialysis
patients: a cross‑sectional study
Ban‑Hock Khor1, Ayesha Sualeheen2, Sharmela Sahathevan2, Karuthan Chinna3,
Abdul Halim Abdul Gafor1, Sunita Bavanandan4, Bak‑Leong Goh5, Zaki Morad6,
Zulfitri Azuan Mat Daud7, Pramod Khosla8, Angela Yee‑Moon Wang9,
Tilakavati Karupaiah10* & PaTCH Investigators*
Sources of dietary phosphate differentially contribute to hyperphosphatemia in maintenance
haemodialysis (MHD) patients. This cross-sectional study in Malaysia investigated association
between dietary patterns and serum phosphorus in MHD patients. Dietary patterns were derived by
principal component analysis, based on 27 food groups shortlisted from 3-day dietary recalls of 435
MHD patients. Associations of serum phosphorus were examined with identified dietary patterns.
Three dietary patterns emerged: Home foods (HFdp), Sugar-sweetened beverages (SSBdp), and Eating
out noodles (EO-Ndp). The highest tertile of patients in HF (T3-HFdp) pattern significantly associated
with higher intakes of total protein (p = 0.002), animal protein (p = 0.001), and animal-based organic
phosphate (p < 0.001), whilst T3-SSBdp patients had significantly higher intakes of total energy
(p < 0.001), inorganic phosphate (p < 0.001), and phosphate:protein ratio (p = 0.001). T3-EO-Ndp
patients had significantly higher intakes of total energy (p = 0.033), total protein (p = 0.003), plant
protein (p < 0.001), but lower phosphate:protein ratio (p = 0.009). T3-SSBdp patients had significantly
higher serum phosphorus (p = 0.006). The odds ratio of serum phosphorous > 2.00 mmol/l was
significantly 2.35 times higher (p = 0.005) with the T3-SSBdp. The SSBdp was associated with greater
consumption of inorganic phosphate and higher serum phosphorus levels.
Hyperphosphatemia is associated with increased mortality and morbidity in maintenance haemodialysis (MHD)
patients1,2. The high incidence of hyperphosphatemia in MHD patients is attributed to imbalance between
phosphate intake and clearance, as dialysis remains the main route for removing excessive phosphate in patients
with minimal kidney f unction3. Therefore, restriction of dietary phosphate intake in conjunction with the use
of phosphate binders, is an important aspect of therapy for hyperphosphatemia4. However, restricting dietary
phosphate often leads to a concomitant reduction of protein-rich foods intake, which inadvertently compromises
dietary protein adequacy, thus increasing risk for protein energy w asting5.
There is a growing awareness in the variability of dietary phosphate bioavailability, both by source (plant or
animal) and type (organic or inorganic). As such, bioavailability is lowest for phosphate derived from plants
1
Department of Medicine, Faculty of Medicine, Universiti Kebangsaan Malaysia, Cheras, 56000 Kuala Lumpur,
Malaysia. 2Dietetics Program, Faculty of Health Sciences, Universiti Kebangsaan Malaysia, 50300 Kuala Lumpur,
Malaysia. 3School of Medicine, Faculty of Health and Medical Science, Taylor’s University Lakeside Campus,
Subang Jaya, 47500 Selangor, Malaysia. 4Department of Nephrology, Hospital Kuala Lumpur, 50586 Kuala Lumpur,
Malaysia. 5Clinical Research Center, Hospital Serdang, 43000 Kajang, Selangor, Malaysia. 6National Kidney
Foundation Malaysia, 46100 Petaling Jaya, Selangor, Malaysia. 7Department of Nutrition and Dietetics, Faculty of
Medicine and Health Science, Universiti Putra Malaysia, Seri Kembangan, 43400 Selangor, Malaysia. 8Department
of Nutrition and Food Science, Wayne State University, Detroit, MI 48202, USA. 9Department of Medicine, Queen
Mary Hospital, The University of Hong Kong, Hong Kong, China. 10School of BioSciences, Faculty of Health and
Medical Science, Taylor’s University, Lakeside Campus, Subang Jaya, 47500 Selangor, Malaysia. *A list of authors
and their affiliations appears at the end of the paper. *email: tilly_karu@yahoo.co.uk
Scientific Reports | (2020) 10:12278 | https://doi.org/10.1038/s41598-020-68893-4 1
Vol.:(0123456789)www.nature.com/scientificreports/
(10–30%), followed by phosphate derived from animals (40–60%), while it is highest (100%) for inorganic
phosphates found in food additives6. The phosphate derived from plants is not readily digested and absorbed, as
humans lack the necessary enzyme phytase to hydrolyse phytate to release phosphate. On the other hand, inor-
ganic phosphates are salts that readily disassociate in the stomach, and as a result > 90% are absorbed7. Based on
this understanding, the current approach in patient education should focus on choosing fresh food that contains
phosphate with lower bioavailability, whereas avoiding food products with phosphate-containing a dditives4,8. It is
also known that potential nutrient interactions in the digestive tract can affect dietary phosphate b ioavailability9.
Dietary pattern is defined by the quantity, variety, or combination of different foods and beverages in a diet,
and the frequency with which they are habitually consumed10. Dietary pattern analysis has emerged as a valu-
able approach to investigate associations between overall diet and health outcomes in human nutrition studies.
In contrast to a singular nutrient/food-based approach, the dietary pattern-based approach takes into account
that human food consumption falls into patterns reflecting a complex combination of dietary components and
nutrients that are likely to have synergistic and competitive i nteractions11.
There are two approaches in dietary pattern analysis, namely à priori and à posteriori. An à priori approach
evaluates the overall diet quality using scores or indices based on guidelines for a healthy diet or diets known to
confer health benefits, whilst an à posteriori approach uses statistical methods to identify existing dietary patterns
within a study population12. The à posteriori approach generates information on the population-specific dietary
patterns, which facilitates a better understanding of health outcomes associated with locally relevant dietary pat-
terns and development of culturally tailored nutrition intervention13. Appropriately, some studies have examined
the association between the à posteriori derived dietary patterns and health related outcomes in MHD patients,
such as nutritional r isk14 and m ortality15,16. A controlled feeding study in a non-chronic kidney disease (CKD)
population has also reported that dietary phosphate bioavailability assessed using urinary phosphate excretion
varies by dietary p atterns17.
It is clear that the possible association between dietary patterns and serum phosphorus level in MHD patients
remains unknown. Therefore, this study aimed to investigate the association between à posteriori derived dietary
pattern and serum phosphorus level in MHD patients.
Methods
Study design and population. This was a cross-sectional study, which utilized data collected between
October 2015 and November 2018 during screening of MHD patients for recruitment into the Palm Tocotrien-
ols in Chronic Haemodialysis study, as described elsewhere14,18. Patients were recruited from 14 dialysis centres
within the urban area of Klang Valley, Malaysia. Inclusion criteria included MHD patients aged at least 18 years
old and dialyzed for at least 3 months. Exclusion criteria were patients with poor adherence toward haemodialy-
sis treatment, unfit for assessment due to physical or mental disability, or with terminal illness such as HIV/AIDS
or malignancy. Ethical approval was obtained from the Medical Research and Ethics Committee, Ministry of
Health, Malaysia (reference number: NMRR-15-865-25260). All eligible patients gave written informed consent
and all research procedures were conducted in accordance with relevant guidelines and regulations.
Variables and data collection. Patients’ sociodemographic data, medical history, and the most recent
drug prescription were retrieved from medical records. Patients’ self-reported compliance to phosphate binder
prescriptions was assessed via face-to-face interviews. Biochemical results were extracted from in-centre patient
laboratory reports relevant to within 2 weeks of collection of dietary data information. All analyses were per-
formed by accredited laboratories19 in accordance with the operating procedures mandated by the Ministry of
Health, Malaysia.
Dietary assessment was performed by research dieticians using the 3-day dietary recall (3-DDR) method,
which included a dialysis day, a non-dialysis day, and a weekend d ay20. Common household measurement tools
(bowls, spoons, and glasses) were used to optimize the portion size estimation. In addition, patients were asked
about their weekly frequency of eating out. Food and beverages consumed in household units were transformed
into absolute weight (g) and volume (ml) before analysis for nutrient composition using the Nutritionist Pro
Software (First DataBank Inc., USA), which references the Malaysian Food Composition21 and Singapore Food
Composition22 databases. The Goldberg’s index was used to identify 3DDRs of acceptable reporters to ensure the
quality of dietary data. In brief, patients’ basal metabolic rate (BMR) was estimated using the Harris–Benedict
equation23. Based on the reported energy intake (EI), EI:BMR ratios of < 1.2, 1.2–2.4, and > 2.4 were considered
as under-, acceptable-, and over-reporting of 3DDRs r espectively24.
Food items from the 3DDRs were classified into either animal or plant protein categories25. The animal protein
group consisted of the following food items: fish, shellfish, eggs, poultry, red meat, milk, dairy products, processed
or preserved meat, seafood, and eggs. The food sources of plant protein group were rice, cereals, beans, legumes,
fruits, leafy vegetables, and starchy vegetables. An individual food item was directly assigned to the respective
food group. For cooked dishes with a mixture of ingredients consisting of animal and plant proteins, recipes
from the Malaysian Food Composition21 were referenced to determine the protein content of each ingredient,
which was then assigned to the corresponding protein group.
The total dietary phosphate intake derived from the nutrient composition analysis of 3DDRs was categorized
into organic phosphates (plant and animal foods), or inorganic phosphates (processed food or beverages). This
categorization was based on the assumption that organic phosphate is naturally found in food, while inorganic
phosphate is an additive in processed f oods26. Accordingly, all food items from 3DDRs were divided into two food
groups according to the source of phosphate. Food groups as the source of organic phosphate included cooked
rice, soda crackers, fresh or frozen vegetables and fruits, eggs, beans, legumes, nuts, milk, fresh or frozen poultry,
seafood, meats, and plain tea or coffee. The phosphate content of these food groups was further subdivided into
Scientific Reports | (2020) 10:12278 | https://doi.org/10.1038/s41598-020-68893-4 2
Vol:.(1234567890)www.nature.com/scientificreports/
either organic phosphate from plant or animal, based on the protein category as mentioned previously. Food
groups as sources of inorganic phosphate were processed cheese, frozen meals, ready-to-eat cereals, cookies,
canned, processed, and luncheon meat, poultry or seafood, canned soups, fast food, cola beverages, and bever-
ages added with sweetened condensed milk. As these food groups might contain a combination of organic and
inorganic phosphates, an assumption model was used to derive the added inorganic phosphate based on the
difference of total phosphate content and protein content of foods in the unprocessed form. For composite dishes,
standard recipes were referred to determine the content and source of phosphate of each constituent ingredient,
which was then assigned to the corresponding group.
As the 3DDR method was chosen to assess dietary intake instead of a food frequency questionnaire, aggrega-
tion of food items into food groups was first carried out as previously described14 prior to performing the dietary
pattern analysis. All food items from 3DDRs were extracted and sorted by alphabetical order. Then, duplicates
were removed, and the food items were grouped based on similarity, food preparation method, and nutrient
content. Initially, 47 food groups were developed and then, based on the consumption of each food group, food
groups with consumption by less than 5% of patients were either excluded or collapsed with similar food groups.
This narrowed the final food listing to 27 food groups.
The Diet Monotony Index (DMI) was calculated as described by Zimmerer et al.27 to assess food variety. From
the 27-food group listing developed, the total quantity of each food group consumed was converted into servings
according to the Malaysian Dietary Guideline 2 01028. A diet consumed with a wide variety of food groups resulted
in smaller proportions of total servings for each food group, and a smaller index value was derived, or vice versa.
Statistical analyses. Continuous variables were presented as mean ± SD or median [interquartile range
(IQR)], while categorical variables were presented as frequency (percentages). Non-normally distributed
variables were log-transformed before statistical analyses. Chi-square test was used to determine associations
between two categorical variables. Simple linear regression was used to determine the correlation between
serum phosphorus (dependent variable) and clinical and dietary parameters (independent variables). Variables
with p-value < 0.1 on univariate analysis were included in the subsequently multiple linear regression analysis.
Tolerance and variance inflation factor were used to check for multicollinearity.
Dietary patterns were derived using à posteriori approach as previously d escribed14. The input variable for
factor analysis was the weight of each food group. Principal component analysis (PCA) was used to derive dietary
patterns and the derived patterns were orthogonally rotated (varimax rotation) to enhance the difference between
loadings to improve the interpretability of factors. The number of dietary patterns retained was determined
based on eigenvalue > 2.029, scree plot examination, and interpretability of the derived p atterns30. The eigenvalue
indicates the total variance explained by a given factor30. Dietary patterns were named in accordance to the food
group with the highest factor loading. Patients were assigned to factor scores computed for each pattern identi-
fied, which indicated adherence to that pattern. Based on the factor score, patients were categorized into tertiles
(T1–T3) for each dietary pattern, where tertile 1 (T1) represented the lowest adherence while tertile 3 (T3) was
the highest adherence to that pattern.
One-way ANOVA was used to compare nutrient intakes by tertiles of identified dietary patterns, with Bon-
ferroni test for post hoc analyses. Kruskal–Wallis with Dunn’s post hoc test was used for comparison of non-
normally distributed variables. One-way analysis of covariance adjusted for covariates was used to compare serum
phosphorus by tertiles of each dietary pattern, and Bonferroni test was used for multiple comparisons. Multiple
logistic regressions were used to estimate the odds ratios (ORs) of hyperphosphatemia (serum phosphorus above
1.78 mmol/l and 2.00 mmol/l) associated with T3 of each dietary pattern. Missing covariate data (less than 2%)
were imputed using the mean of the existing value of all patients. All analyses were computed using the SPSS
version 25 (IBM, Chicago, IL, USA). Statistical significance was set at p-value < 0.05 for all evaluated parameters.
Results
The flow of patient enrolment is shown in Fig. 1. Of 800 eligible patients, 497 consented and completed all assess-
ments. The 303 eligible patients who refused consent were reluctant to commit time for research procedures,
as they were exposed to many research study in their settings. In addition, they were also experiencing fatigue
when reporting dietary data. Out of 497 patients who completed the assessment, 62 (12.5%) were excluded due
to implausible dietary data. Therefore, the final data analyses included 435 MHD patients, whose characteris-
tics are shown in Table 1. This was a multiethnic population with Malay (42.3%), Chinese (39.8%), and Indian
(17.9%) patients, with a mean age of 55 ± 13 years, median dialysis vintage of 56 months, and with 54.8% males.
All patients were dialyzed thrice weekly for four hours per session as per the clinical practice guideline by the
Ministry of Health, Malaysia31. Majority of the patients were recruited from dialysis centres of non-governmental
organizations (46.4%). The mean serum phosphorus was 1.78 ± 0.50 mmol/l and 47.8% patients had serum
phosphorus above 1.78 mmol/l. Patients with serum phosphorus level above 1.78 mmol/l were mainly from
non-governmental dialysis centres (p = 0.024) and did not comply to using phosphate binder (p = 0.002) (Sup-
plementary Table S1). Phosphate binders were prescribed to 98.2% patients and the type of phosphate binder was
mainly calcium-based (92.9%). However, only 59.5% reported adhering to the phosphate binder prescription.
The median frequency of eating out weekly was 8 (IQR = 10).
Three dietary patterns emerged with a total of 27 food groups using PCA (Table 2). The Kaiser–Meyer–Olkin
value of PCA was 0.538, indicating acceptable sampling adequacy for factor analysis. The first dietary pattern
was labelled as “Home FoodDP” as it represented a high intake of white rice, non-starchy vegetables, fish and
shellfish, poultry, pork, refined bread, bun, roll, and biscuit, fresh and dried fruit, and soybean curd and legume,
along with a low intake of fried rice and coconut milk rice (Fig. 2). The second dietary pattern was labelled as
“Eating-out NoodlesDP” as it reflected a high intake of fried noodle dishes, pau, dim sum and yong tau foo, and
Scientific Reports | (2020) 10:12278 | https://doi.org/10.1038/s41598-020-68893-4 3
Vol.:(0123456789)www.nature.com/scientificreports/
Figure 1. Study flow chart for patient recruitment.
processed fish products, along with a low intake of fried rice and nasi lemak. The third dietary pattern was char-
acterized by a high intake of sugar-sweetened beverages, along with candies and chips, beef, refined traditional
cereal meal, poultry, refined bread, bun, roll and biscuit, and fried rice and nasi lemak. This pattern was labelled
as “Sugar-Sweetened BeveragesDP (SSBDP)”. These three dietary patterns explained 72.1% of the total variance
among 27 food groups, with the SSBDP accounting for the highest variance (45.3%), followed by Home FoodDP
(13.8%), and Eating-out N oodlesDP (13.0%) patterns.
The linear regression analyses of serum phosphorus are shown in Table 3. In the model accounting for all
variables, dialysis adequacy (Kt/V, β = − 0.223, p = 0.001), adherence to phosphate binders (β = − 0.184, p < 0.001),
BMI (β = 0.016, p = 0.001), and age (β = − 0.005, p = 0.009) were negatively correlated to serum phosphorus level,
whilst normalization of protein nitrogen appearance (β = 0.242, p = 0.005) was positively correlated to serum
phosphorus level.
The nutrient profiles of three identified dietary patterns are presented in Table 4. The upper tertile (T3)
of Home F oodDP indicated significantly higher intakes of total protein (p = 0.002), animal protein (p = 0.001),
animal-based organic phosphate (p < 0.001), and total fluid (p = 0.003). On the other hand, the T3 of S SBDP
indicated significantly higher intakes of total energy (p < 0.001), inorganic phosphate (p < 0.001), phosphate
to protein ratio (p = 0.001), and total fluid (p = 0.010). The T3 of Eating-out N oodlesDP indicated significantly
greater intakes of total energy (p = 0.033), total protein (p = 0.003), plant protein (p < 0.001) but lower phosphate
to protein ratio (p = 0.009). Of note, the frequency of eating out was significantly greater in T3 of S SBDP (p = 0.002)
and Eating-out N oodlesDP (p = 0.009). Patients of T3 of Eating-out n oodleDP were mostly Chinese and from non-
governmental dialysis centers while patients of T3 of S SBDP were younger, consisted of mostly men and Malay,
and from governmental dialysis centers (Supplementary Table S2). The Home F oodDP was not associated with
age, gender, ethnic, and sector of dialysis provider.
Serum phosphorus level by tertiles for each dietary pattern is presented in Table 5. After adjustment for
confounders, serum phosphorus levels were found to be significantly higher for T3 vs T1 of S SBDP (p = 0.006).
Although, no T3 of any dietary pattern significantly was associated with a higher OR for serum phosphorus
level > 1.78 mmol/l (p > 0.05), still a non-significant trend (p = 0.067) was observed with the S SBDP (OR = 1.64;
95% CI 0.97, 2.79), which could be considered significant for p value < 0.10. We found, however, that the OR for
elevating serum phosphorous > 2.00 mmol/l, a cut-off that is clinically relevant, significantly increased by 2.35
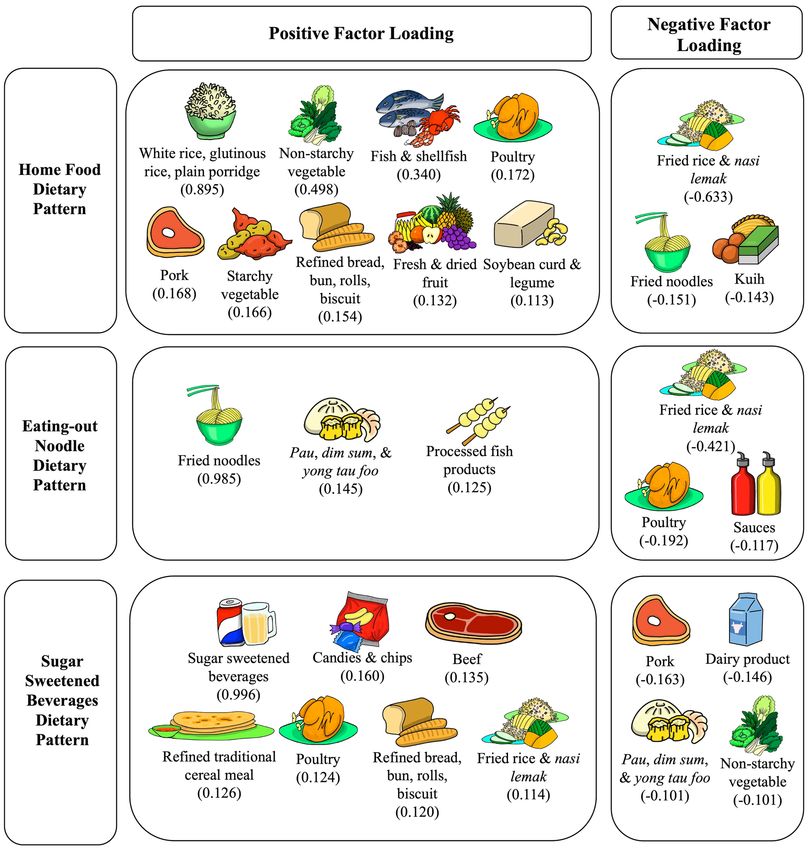
times (95% CI 1.30, 4.28, p = 0.005) with T3 of SSBDP. Coffee or tea added with sugar was the most common SSB
(39.0%) consumed by patients in T3 of S SBDP, followed by coffee or tea added with condensed milk or evaporated
milk (24.3%), and syrup or cordial or tetra pak beverages (13.3%) (Fig. 3).
A total of 105 patients of T3 of Home FoodDP and 101 patients of T3 of SSBDP were identified and comparison
between these two groups was made (Table 6). The T3 patients of SSBDP were younger (p = 0.001); mainly men
(p = 0.037) and likely Malay patients (p < 0.011) compared to T3 patients of Home FoodDP. The total energy intake
(p < 0.011), inorganic phosphate intake (p < 0.011) and phosphate to protein ratio (p = 0.001) were significantly
higher while total protein intake (p = 0.044), animal protein intake (p = 0.004), and organic phosphate from
animal sources (p = 0.003) were significantly lower in T3 patients of SSBDP compared to T3 patients of Home
FoodDP. The serum phosphorus level of T3 patients of S SBDP was significantly greater than T3 patients of Home
FoodDP (1.87 ± 0.49 vs. 1.71 ± 0.47 mmol/l, p = 0.021), and remained significant (p = 0.014) after adjustment for
confounding factors.
Scientific Reports | (2020) 10:12278 | https://doi.org/10.1038/s41598-020-68893-4 4
Vol:.(1234567890)www.nature.com/scientificreports/
Characteristics Mean ± SD n (%)
Age (year) 54.6 ± 13.4
Sex
Male 239 (54.9)
Female 196 (45.1)
Ethnicity
Malay 184 (42.3)
Chinese 173 (39.8)
Indian 78 (17.9)
Sector of dialysis provider
Government 165 (37.9)
Non-governmental organization 202 (46.5)
Private 68 (15.6)
Anthropometry
Weight (kg) 62.5 ± 14.2
Height (cm) 158.1 ± 8.8
Body mass index (kg/m2) 24.9 ± 5.0
Biochemistry
Pre-dialysis urea (mmol/l) 19.2 ± 5.4
Pre-dialysis creatinine (μmol/l) 820 (271)*
Serum potassium (mmol/l) 5.0 ± 0.8
Serum phosphorus (mmol/l) 1.78 ± 0.50
1.78 mmol/l 208 (47.8)
Serum corrected calcium (mmol/l) 2.26 ± 0.24
Serum alkaline phosphatase (IU/l) 103 (76)*
Serum albumin (g/l) 39.3 ± 4.0
Medical background
Co-morbidities
Diabetes mellitus 190 (43.7)
Hypertension 349 (80.2)
Hepatitis B/C 47 (10.8)
Dialysis vintage (month) 56 (73)*
Kt/V 1.6 ± 0.4
nPNA (g/kg) 1.0 ± 0.3
Parathyroidectomy history 69 (15.9)
Medication prescriptions
Phosphate binder prescription 427 (98.2)
Calcium based phosphate binder 404 (92.9)
Lanthanum carbonate 17 (3.9)
Sevelamer carbonate 6 (1.4)
Activated vitamin D prescription 299 (68.7)
Self-reported adherence to phosphate binder 254 (59.5)
Dietary intake
Energy (kcal) 1524 ± 343
Energy (kcal/kg) 25.2 ± 6.5
Total protein (g) 52.5 (20.6)*
Total protein (g/kg) 0.9 (0.4)*
Animal protein (g) 28.2 (19.5)*
Plant protein (g) 23.7 (10.0)*
Total phosphate (mg) 634.8 (268.0)*
Animal organic phosphate (mg) 236.6 (206.0)*
Plant organic phosphate (mg) 269.7 (160.0)*
Inorganic phosphate (mg) 80.7 (137.0)*
Continued
Scientific Reports | (2020) 10:12278 | https://doi.org/10.1038/s41598-020-68893-4 5
Vol.:(0123456789)www.nature.com/scientificreports/
Characteristics Mean ± SD n (%)
Phosphate to protein ratio (mg/g) 12.0 (3.4)*
Total fluid (ml) 1246 (830)*
Eating out frequency (per week) 8 (10)*
Diet Monotony Index 30 (12)*
Table 1. Characteristics of patients (n = 435). nPNA normalization of protein nitrogen appearance. *Data is
presented as median with interquartile range (IQR).
Components
Food groups Home food Eating out noodles Sugar sweetened beverages
Beef − 0.022 − 0.044 0.135
Candies and chips − 0.013 − 0.010 0.160
Chicken egg 0.093 − 0.038 0.025
Dairy products − 0.021 − 0.027 − 0.146
Fish and shellfish 0.340 0.011 − 0.027
Fresh and dried fruit 0.132 − 0.061 − 0.092
Fried rice and nasi lemak − 0.633 − 0.421 0.114
Kuih − 0.143 − 0.088 0.003
Non-starchy vegetables 0.498 − 0.053 − 0.101
Noodles, fried − 0.151 0.958 − 0.010
Noodles, soup 0.079 0.056 − 0.026
Pau, dim sum and yong tau foo − 0.046 0.145 − 0.110
Pork 0.168 0.058 − 0.163
Poultry 0.172 − 0.192 0.124
Preserved fish, shell fish, poultry, egg, and meat 0.067 − 0.001 0.016
Preserved vegetables 0.048 0.074 − 0.059
Processed chicken and red meat products − 0.023 0.003 − 0.030
Processed fish products − 0.008 0.125 0.053
Refined bread, bun, roll and biscuit 0.154 − 0.079 0.120
Refined traditional cereal meal 0.039 − 0.083 0.126
Sauces − 0.023 − 0.117 0.066
Soybean curd and legume 0.113 0.014 − 0.006
Spreads (fat) 0.077 − 0.024 0.008
Spreads (sweet) − 0.027 − 0.010 0.076
Starchy vegetables 0.166 − 0.025 − 0.100
Sugar sweetened beverages − 0.028 − 0.080 0.996
White rice, glutinuous rice, and plain rice porridge 0.895 − 0.043 0.074
Table 2. Factor loadings for three dietary patterns derived by principal component analysis. Data expressed as
factor loading (correlation coefficient between each food group and dietary pattern); foods groups with factor
loadings ≥ 0.1 were bolded to indicate main food groups in each factor; principal component analysis with
eigenvalue > 2.0 and orthogonal rotation for derivation of dietary patterns. Local ethnic-based food names
are Kuih—local sweet or savory bite sized snacks; Pau—filled steamed bun; Dim Sum—bite-sized dumpling
filled with meat or seafood; Yong Tau Hoo—soybean curd or vegetables filled with fish paste or ground meat;
Nasi Lemak—rice cooked in coconut milk.
Discussion
In this cross-sectional study of 435 MHD patients, three dietary patterns emerged through the à posteriori
approach, namely Home FoodDP, SSBDP, and Eating-out N oodleDP. The empirically derived dietary patterns
reflected the habitual dietary intake within this MHD population. Similar dietary patterns were also reported
in an earlier study with a smaller population14. In the data reported by Sulaheen et al.14, the first 382 patients
enrolled were used in the primary analyses, which focused on malnutrition. In the present study, we assessed the
subsequent 497 enrolled patients for hyperphosphatemia risk. However, dietary patterns reported were different
due to sample size, ethnicity proportion, and analyses. In the study by Sualeheen et al.14, four dietary patterns
were identified, namely Home Food, Eating-out Noodle, Eating-out Rice, and Eating-out SSB. The dietary pat-
tern with the highest variance was Eating-out Noodle (17.0%). Contrarily, we used eigenvalue > 2.0 in the PCA
Scientific Reports | (2020) 10:12278 | https://doi.org/10.1038/s41598-020-68893-4 6
Vol:.(1234567890)www.nature.com/scientificreports/
Figure 2. Food groups with factor loading within each dietary pattern. The factor loading indicates correlations
of the food group with the dietary pattern. Local ethnic-based food names are Kuih—local sweet or savoury bite
sized snacks; Pau—filled steamed bun; Dim Sum—bite-sized dumpling filled with meat or seafood; Yong Tau
Hoo—soybean curd or vegetables filled with fish paste or ground meat; Nasi Lemak—rice cooked in coconut
milk.
for the present study, which led to retention of only three dietary patterns, with the SSBDP accounting for the
highest variance (45.3%). It should be also noted that the patients in the study by Sualeheen et al.14 were mainly
Chinese (45%), followed by Malay (36%) and Indian (19%) whilst an almost equal number of Malay and Chinese
patients were recruited in the present study. The trend of studies examining dietary patterns for CKD populations
does note that these patterns reflect local food habits. The DIET-HD study identified “fruits and vegetables” and
“Western” dietary patterns for 8,110 MHD patients across 10 European countries and A rgentina16. These dietary
patterns are also consistent with reported patterns for the general population within these same countries32.
The Reasons for Geographic and Racial Differences in Stroke study conducted for CKD populations in the South-
eastern United States, identified a “Southern” dietary pattern characterized by fried foods, organ meats, and
sweetened beverages, which is typical of Southern cuisine33. Similarly, the PROGREDIR study conducted among
pre-dialysis CKD patients in São Paulo, Brazil identified a “traditional” dietary pattern (composed of white rice,
beans, and coffee) typical to the local c ommunity34.
Scientific Reports | (2020) 10:12278 | https://doi.org/10.1038/s41598-020-68893-4 7
Vol.:(0123456789)www.nature.com/scientificreports/
Simple linear regression Multiple linear r egression†
Variables β (95% CI) P value adjusted β (95% CI) P value
Age (year) − 0.004 (− 0.008, − 0.001) 0.016 − 0.005 (− 0.008, − 0.001) 0.009
Sex (male) 0.071 (− 0.024, 0.165) 0.144 − 0.010 (− 0.110, 0.091) 0.852
BMI (kg/m2) 0.018 (0.009, 0.027) < 0.001 0.016 (0.006, 0.026) 0.001
Dialysis vintage (month)* 0.018 (− 0.030, 0.065) 0.465 –
Parathyroidectomy (yes) − 0.006 (− 0.136, 0.123) 0.923 –
Adherence to phosphate binder (yes) − 0.158 (− 0.252, − 0.063) 0.001 − 0.184 (− 0.276, − 0.092) < 0.001
Kt/V − 0.214 (− 0.327, − 0.101) < 0.001 − 0.223 (− 0.357, − 0.089) 0.001
nPNA (g/kg) 0.164 (0.000, 0.329) 0.050 0.242 (0.073, 0.411) 0.005
Total protein (g)* 0.205 (0.063, 0.346) 0.005 –
Animal protein (g)* 0.031 (0.003, 0.059) 0.029 0.018 (− 0.034, 0.071) 0.498
Plant protein (g)* 0.052 (− 0.016, 0.121) 0.135 0.033 (− 0.034, 0.101) 0.331
Total phosphate (mg)* 0.124 (− 0.010, 0.258) 0.069 0.015 (− 0.126, 0.157) 0.830
Animal organic phosphate (mg)* 0.016 (− 0.004, 0.037) 0.122 − 0.005 (− 0.043, 0.033) 0.782
Plant organic phosphate (mg)* 0.007 (− 0.048, 0.062) 0.810 –
Inorganic phosphate (mg)* 0.000 (− 0.015, 0.014) 0.946 –
Phosphate to protein ratio (mg/g)* − 0.131 (− 0.334, 0.072) 0.205 –
Table 3. Factors associated with serum phosphate levels using linear regression analyses. nPNA,
normalization of protein nitrogen appearance. *Data was log-transformed. “–” indicates variables not included
in the multiple linear regression analysis; only variables with p-value < 0.25 in the simple linear regression
were carried into the multiple linear regression analysis, “total protein” was excluded as it was a sum of both
“animal protein” and “plant protein” while “phosphate to protein ratio” was excluded in the analysis due to
collinearity. Bold values denote statistical significance at p-value < 0.05. † The highest variance inflation factor
was 3.960.
In this study, we did not observe any significant association between serum phosphorus level and any indi-
vidual nutrient, including dietary phosphate. There are some possible explanations for this null finding. Firstly,
total dietary phosphate intake does not reflect the actual amount of phosphate absorbed in the intestinal tract,
as phosphate bioavailability varies by food s ource7. Secondly, patients’ dietary phosphate intakes were estimated
from 3DDRs with reference to food composition databases. Other studies have indicated discrepancies in phos-
phate content estimated from diet recalls using food composition databases with direct laboratory analyses
of duplicate portions of diet s amples35,36. The wide use of phosphate additives in food manufacturing adds to
actual burden of dietary phosphate intake as opposed to the lower estimations from referencing the food com-
position databases37. In addition, we observed variables such as dialysis adequacy (Kt/V) and adherence to phos-
phate binder prescription were inversely associated with serum phosphorus level. This implies that management
of hyperphosphatemia in MHD patients is beyond limiting total amount of dietary phosphate intake alone. In
fact, Lynch et al.38 have shown that prescribed dietary phosphate restrictions could not be associated with improv-
ing survival. In the present study, more patients from non-governmental dialysis centers had serum phosphorus
level above 1.78 mmol/l compared to patients from government or private centers. This finding is consistent with
our previous study, which reported the prevalence of hyperphosphatemia in MHD patients based on the data
from Malaysian National Renal Registry39. A possible explanation is that government and private centers have
more resources in terms of manpower and treatment options for achieving the target serum phosphorus level.
We went beyond the single nutrient approach and examined the effect of dietary patterns on serum phos-
phorus level. We found that the S SBDP was significantly associated with higher serum phosphorus levels, which
could be attributed to greater consumption of inorganic phosphate as found in beverages added with condensed
milk. It is well known that cola beverages contain phosphoric acid additives that contribute to substantial dietary
phosphate burden40. However, our study showed that carbonated beverages were the least consumed SSB. Instead,
tea or coffee added with sugar, sweetened condensed milk or evaporated milk were the most popular choice
of SSB in our population as indicated by national trade estimates d ata41. Inorganic phosphate additives such as
sodium phosphates, calcium phosphates, triphosphates, and polyphosphates are added as stabilizing salts during
the manufacturing process of evaporated and sweetened condensed milk which according to CODEX standards
may be between 0.2 to 0.3% of product content42,43. We examined the front-on-pack labelling of popular evapo-
rated and sweetened condensed milk brands in the market, but found none disclosed the phosphate content or
type of additives. The non-mandatory reporting of phosphate content in food labelling has made it difficult for
MHD patients to identify potential hidden sources of p hosphate44. In the United States, a cross-sectional analysis
from the National Health and Nutrition Examination Survey revealed that consumption of dairy products and
cereals or grains with inorganic phosphate additives were also associated with greater serum phosphorus in
the general p opulation26. Contrarily, a recent dietary pattern study on African American patients on MHD did
not observe significant difference in serum phosphorus level between high SSBDP and low S BBDP, likely due to a
smaller sample size, a homogenous population and different food s election45.
Scientific Reports | (2020) 10:12278 | https://doi.org/10.1038/s41598-020-68893-4 8
Vol:.(1234567890)www.nature.com/scientificreports/
Home FoodDP
Tertile 1 Tertile 2 Tertile 3
(n = 142) (n = 144) (n = 149) P trend P value* T1vsT3
Energy (kcal) 1490 ± 359 1564 ± 366 1519 ± 301 0.183 > 0.999
Energy (kcal/kg) 24.6 ± 6.0 25.9 ± 7.4 25.0 ± 5.9 0.244 > 0.999
Total protein (g) 48.7 (23.0) 52.6 (21.9) 54.2 (17.9) 0.002 0.002
Total protein (g/kg) 0.8 (0.5) 0.8 (0.4) 0.9 (0.4) 0.010 0.007
Animal protein (g) 24.0 (22.0) 26.7 (19.6) 32.1 (16.7) 0.001 0.001
Plant protein (g) 22.7 (11.2) 23.9 (9.2) 24.8 (9.6) 0.474 –
Total phosphate (mg) 625 (284) 632 (328) 648 (237) 0.206 –
Animal organic phosphate (mg) 196 (201) 251 (186) 282 (198) < 0.001 < 0.001
Plant organic phosphate (mg) 262 (183) 273 (161) 274 (133) 0.247 –
Inorganic phosphate (mg) 89 (147) 91 (148) 67 (108) 0.026 0.055
Phosphate to protein ratio (mg/g) 12.1 (4.1) 12.2 (3.3) 11.9 (2.9) 0.249 –
Total fluid (ml) 1177 (730) 1258 (966) 1336 (776) 0.004 0.003
Dietary monotony index 30 (13) 30 (11) 29 (13) 0.803 –
Eating out frequency (per week) 8 (10) 9 (11) 7 (10) 0.027 > 0.999
Sugar Sweetened BeveragesDP
Tertile 1 Tertile 2 Tertile 3
(n = 145) (n = 145) (n = 145) P trend P value* T1vsT3
Energy (kcal) 1431 ± 334 1491 ± 332 1651 ± 328 < 0.001 < 0.001
Energy (kcal/kg) 23.5 ± 5.9 25.6 ± 6.8 26.5 ± 6.4 < 0.001 < 0.001
Total protein (g) 53.3 (20.6) 51.5 (22.3) 51.1 (21.2) 0.583 –
Total protein (g/kg) 0.9 (0.4) 0.9 (0.5) 0.8 (0.4) 0.525 –
Animal protein (g) 29.9 (22.0) 27.7 (19.7) 27.4 (17.0) 0.411 –
Plant protein (g) 22.7 (10.4) 24.4 (9.6) 24.3 (11.2) 0.233 –
Total phosphate (mg) 604 (263) 639 (290) 683 (278) 0.168 –
Animal organic phosphate (mg) 230 (230) 242 (217) 237 (195) 0.670 –
Plant organic phosphate (mg) 264 (163) 274 (156) 270 (157) 0.595 –
Inorganic phosphate (mg) 63 (106) 64 (116) 128 (167) < 0.001 < 0.001
Phosphate to protein ratio (mg/g) 11.4 (3.5) 12.0 (3.1) 12.7 (3.2) 0.001 0.001
Total fluid (ml) 1183 (1032) 1173 (632) 1350 (795) < 0.001 0.010
Dietary monotony index 28 (10) 30 (15) 30 (10) 0.411 –
Eating out frequency (per week) 7 (10) 7 (10) 10 (9) 0.002 0.002
Eating-out NoodleDP
T1 T2 T3
(n = 202) (n = 116) (n = 117) P trend P value* T1vsT3
Energy (kcal) 1491 ± 360 1549 ± 323 1557 ± 331 0.166 0.293
Energy (kcal/kg) 23.9 ± 6.7 26.6 ± 6.4 25.8 ± 5.9 0.001 0.033
Total protein (g) 49.1 (20.1) 53.9 (15.6) 53.1 (27.2) 0.016 0.062
Total protein (g/kg) 0.8 (0.3) 0.9 (0.4) 1.0 (0.5) < 0.001 0.003
Animal protein (g) 26.9 (18.8) 30.0 (17.4) 28.0 (24.4) 0.476 –
Plant protein (g) 22.1 (9.9) 23.2 (10.6) 26.1 (9.1) < 0.001 < 0.001
Total phosphate (mg) 634 (264) 634 (257) 638 (327) 0.847 –
Animal organic phosphate (mg) 238 (215) 248 (167) 226 (241) 0.517 –
Plant organic phosphate (mg) 253 (169) 273 (169) 289 (150) 0.390 –
Inorganic phosphate (mg) 77 (149) 85 (151) 79 (106) 0.725 –
Phosphate to protein ratio (mg/g) 12.4 (3.6) 12.1 (2.9) 11.4 (3.1) 0.004 0.003
Total fluid (ml) 1347 (1007) 1209 (833) 1222 (571) 0.207 –
Dietary monotony index 30 (11) 28 (9) 31 (13) 0.044 0.851
Eating out frequency (per week) 8 (10) 8 (9) 9 (10) 0.011 0.009
Table 4. Comparison of dietary parameters between tertiles for each dietary pattern. Data is expressed as
mean ± standard deviation or median with interquartile range (IQR). Bold values denote statistical significance
at p-value < 0.05. *Significance values had been adjusted for multiple tests. “–” The Dunn’s post hoc test was
not performed if the overall test was not significant. T1 tertile 1, T2 tertile 2, T3 tertile 3.
Scientific Reports | (2020) 10:12278 | https://doi.org/10.1038/s41598-020-68893-4 9
Vol.:(0123456789)www.nature.com/scientificreports/
Serum phosphorus
(mmol/l)* Serum phosphorus > 1.78 mmol/l† Serum phosphorus > 2.00 mmol/l†
Dietary pattern Model 1 Model 2 Model 1 Model 2 Model 1 Model 2
Home food
Tertile 1 1.76 ± 0.04 1.80 ± 0.05 1.00 1.00 1.00 1.00
Tertile 2 1.72 ±0.05 1.77 ± 0.05 0.68 (0.42, 1.09) 0.67 (0.41, 1.09) 0.78 (0.46, 1.33) 0.81 (047, 1.39)
Tertile 3 1.74 ± 0.04 1.78 ± 0.05 0.70 (0.43, 1.13) 0.69 (0.42, 1.13) 0.91 (0.54, 1.54) 0.87 (0.51, 1.50)
P trend 0.829 0.830 0.208 0.119 0.661 0.737
P value for T1 vs T3 > 0.999 > 0.999 0.141 0.137 0.735 0.622
Sugar sweetened beverages
Tertile 1 1.67 ± 0.05 1.70 ± 0.05 1.00 1.00 1.00 1.00
Tertile 2 1.71 ± 0.04 1.75 ± 0.05 1.00 (0.61, 1.62) 1.03 (0.62, 1.71) 1.12 (0.64, 1.96) 1.29 (0.72, 2.31)
Tertile 3 1.85 ± 0.05 1.88 ± 0.05 1.61 (0.97, 2.67) 1.64 (0.97, 2.79) 1.99 (1.14, 3.48) 2.35 (1.30, 4.28)
P trend 0.008 0.005 0.097 0.108 0.030 0.013
P value for T1 vs T3 0.011 0.006 0.066 0.067 0.015 0.005
Eating out noodles
Tertile 1 1.73 ± 0.04 1.77 ± 0.04 1.00 1.00 1.00 1.00
Tertile 2 1.74 ± 0.05 1.78 ± 0.06 1.04 (0.64, 1.71) 1.04 (0.63, 1.72) 1.14 (0.66, 1.96) 1.20 (0.69, 2.09)
Tertile 3 1.77 ± 0.06 1.82 ± 0.06 1.00 (0.60, 1.66) 1.03 (0.61, 1.73) 1.10 (0.63, 1.92) 1.18 (0.66, 2.11)
P trend 0.868 0.745 0.985 0.987 0.881 0.756
P value for T1 vs T3 > 0.999 > 0.999 0.993 0.918 0.744 0.568
Table 5. Serum phosphorus and odds ratio of hyperphosphatemia (serum phosphorus > 1.78 mmol/l and
2.00 mmol/l) by tertiles of dietary patterns. Model 1 is adjusted for age, gender, ethnic, sector of dialysis
provider; Model 2 is adjusted for all confounders in model 1 and dialysis vintage, Kt/V, normalization of
protein nitrogen appearance, history of parathyroidectomy, prescription of activated vitamin D, and self-
reported compliance to phosphate binder. *Data is presented as mean ± standard error, †data is presented as
odds ratio (95% confidence interval). Bold values denote statistical significance at p-value < 0.05.
Figure 3. Types of beverages consumed by tertile 3 patients (n = 145) within the sugar sweetened beverages
dietary pattern.
Although the Home FoodDP was associated with greater dietary protein intake, particularly animal protein,
this pattern did not adversely affect serum phosphorus levels. Typical protein foods implicated in the Home
FoodDP were fish and shellfish, poultry, pork, and soybean curd and legumes, which did not occur in the other
Scientific Reports | (2020) 10:12278 | https://doi.org/10.1038/s41598-020-68893-4 10
Vol:.(1234567890)www.nature.com/scientificreports/
Tertile 3 Home F
oodDP Tertile 3 SSBDP
(n = 105) (n = 101) P value
Age (year) 58.6 ± 12.6 52.6 ± 12.1 0.001
Gender
Male 58 (55.2%) 70 (69.3%)
0.037
Female 47 (44.8%) 31 (30.7%)
Sector
Government 36 (34.3%) 45 (44.6%)
NGO 54 (51.4%) 35 (34.7%) 0.050
Private 15 (14.3%) 21 (20.8%)
Ethnic
Malay 34 (32.4%) 59 (58.4%)
Chinese 54 (51.4%) 26 (25.7%) < 0.001
Indian 17 (16.2%) 16 (15.8%)
Compliance to binder
Yes 39 (37.5%) 42 (42.9%)
0.437
No 65 (62.5%) 56 (57.1%)
Kt/V 1.66 ± 0.43 1.65 ± 0.27 0.909
Energy (kcal/kg) 1456 ± 266 1644 ± 327 < 0.001
Protein (g/kg)* 54.1 (17.4) 49.5 (20.2) 0.044
Phosphate (mg)* 607 (228) 632 (280) 0.584
Plant protein (g)* 24.4 (8.6) 23.5 (9.5) 0.688
Animal protein (g)* 31.9 (18.6) 24.7 (16.4) 0.004
Organic plant phosphate (mg)* 267 (131) 265 (164) 0.353
Organic animal phosphate (mg)* 283 (199) 231 (186) 0.003
Inorganic phosphate (mg)* 45 (98) 147 (158) < 0.001
Phosphate protein ratio* 11.6 (3.1) 12.9 (3.6) 0.001
1.71 ± 0.47 1.87 ± 0.49 0.021
Serum phosphorus (mmol/l)
1.75 ± 0.06† 1.92 ± 0.06† 0.014†
Category of serum phosphorus
≤ 1.78 mmol/l 61 (58.1%) 45 (44.6%)
0.052
> 1.78 mmol/l 44 (41.9%) 56 (55.4%)
Table 6. Comparison of characteristics between patients of tertile 3 of home food and sugar sweetened
beverages dietary patterns. Continuous data was presented as mean ± SD and independent t test was used for
analyses while categorical data was presented as frequency (%) and chi-square test was used for analysis. DP
dietary pattern, NGO non-governmental organization, SSB sugar sweetened beverages. *Data was presented
as median with interquartile range (IQR) and Mann–Whitney test was used for analyses. Bold values denote
statistical significance at p-value < 0.05. † Data was presented as mean ± SE and the general linear model was
used for analysis with adjustment for age, gender, ethnic, sector of dialysis provider, dialysis vintage, Kt/V,
normalization of protein nitrogen appearance, history of parathyroidectomy, prescription of activated vitamin
D, and self-reported compliance to phosphate binder. Forty-four patients were excluded in these analyses as
they were categorized into tertile 3 of both Home FoodDP and S SBDP.
two patterns. At the same time, the Home F oodDP also carried appreciable factor loadings for non-starchy
vegetables (0.498), starchy vegetables (0.166), and fresh and dried fruit (0.132). The non-significant association
between Home F oodDP and serum phosphorus level, despite higher protein intakes may be explained by the
lower phosphate absorption from fruits and vegetables17. Achieving dietary protein adequacy without excessive
phosphate intake is critical for MHD patients, yet challenging as phosphate is naturally found in protein-rich
food. Shinaberger et al.5 showed that increased protein intake alongside with reduced serum phosphorus level
was associated with better survival in MHD patients, but controlling serum phosphorus level by decreasing
protein intake led to increased mortality. Thus the Home FoodDP reflecting a balanced diet with rice, protein
foods, vegetables, and fruits, is clearly the answer to patients facing the phosphate-protein dilemma. In addition,
we have previously shown that the Home Food pattern was associated with better nutritional status indicated by
serum albumin, malnutrition inflammation score, and handgrip strength14.
The present study highlighted potential applications of the dietary pattern approach in nutritional interven-
tion for MHD patients. The dietary pattern approach takes into account the multidimensional exposure and
interactions that exist across complex combinations of dietary components and nutrients from foods12. As people
consume foods instead of nutrients in isolation, dietary patterns can be readily translated into practical dietary
advice. Nevertheless, we cannot refute the importance of recognizing and restricting inorganic phosphate intake.
We have clearly shown that a dietary pattern containing beverages rich in inorganic phosphate was associated
Scientific Reports | (2020) 10:12278 | https://doi.org/10.1038/s41598-020-68893-4 11
Vol.:(0123456789)www.nature.com/scientificreports/
with hyperphosphatemia in this Malaysian population and this aspect should be communicated in patient
education as well as incorporated into the local clinical practice g uideline8. At the same time, it is also critical to
emphasize to patients the value of a balanced diet.
There were some important limitations in this study. Firstly, this was a cross-sectional study with potential
residual confounders and the causality cannot be established. Secondly, dietary intakes were assessed using
the 3DDR method, which may be subject to measurement and recall bias. However, trained dieticians were
involved in dietary data collection and expectedly minimized bias in recall data. Further, we excluded patients
with implausible dietary data to minimize recall bias as per the standard protocol of dietary pattern analyses15,32,
although this could also possibly lead to selection bias. The refusal rate for participation (37.9%) of this study
could have also introduced selection bias. Thirdly, the process of dietary pattern derivation requires a high degree
of subjective decision making such as aggregation of food items into food groups, the number of factors to retain,
the method of rotation, and naming of patterns, which leads to inconsistency between r esearchers46. However,
this limitation was overcome by consensus between researchers for the food listing and derivation of dietary
patterns. A major limitation was the lack of organic and inorganic phosphate database or even its identification
on processed food labels for us to accurately distinguish these two types of phosphate. Therefore, we had to use
an assumption model to overcome this deficiency. Inclusion of parathyroid hormone as a parameter to examine
phosphate resorption from bone and gut availability from dietary phosphate origin would have been ideal, but
owing to its cost, we could not include this measurement for screening this population. The information on
ultrafiltration volume was also not available in this study. Finally, this data-driven approach identified dietary
patterns specific only to the study population and therefore, should not be generalized to other populations
outside of Malaysia.
In conclusion, the S SBDP was associated with higher concentrations of serum phosphorus in MHD patients,
possibly due to greater intakes of inorganic phosphate. The Home F oodDP was associated with greater amount
of protein intake, but was not associated with the serum phosphorus level. Therefore, evaluation of the habitual
dietary pattern could provide valuable insights for the dietary management of hyperphosphatemia in MHD
patients. Future studies investigating the effectiveness of dietary pattern intervention on hyperphosphatemia in
MHD patients are warranted.
Data availability
The datasets generated and/or analysed during this study are available on reasonable request from the corre-
sponding author, T.K.
Received: 19 April 2020; Accepted: 3 July 2020
References
1. Palmer, S. C. et al. Serum levels of phosphorus, parathyroid hormone, and calcium and risks of death and cardiovascular disease
in individuals with chronic kidney disease: a systematic review and meta-analysis. JAMA 305, 1119–1127 (2011).
2. Yamada, S. et al. Association between serum phosphate levels and stroke risk in patients undergoing hemodialysis: the Q-Cohort
Study. Stroke 47, 2189–2196 (2016).
3. Copland, M., Komenda, P., Weinhandl, E. D., McCullough, P. A. & Morfin, J. A. Intensive hemodialysis, mineral and bone disorder,
and phosphate binder use. Am. J. Kidney Dis. 68, S24–S32 (2016).
4. Kidney Disease Improving Global Outcomes CKD-MBD Update Work Group. KDIGO 2017 Clinical practice guideline update for
the diagnosis, evaluation, prevention, and treatment of chronic kidney disease–mineral and bone disorder (CKD–MBD). Kidney
Int. Suppl. 7, e1–e59 (2017).
5. Shinaberger, C. S. et al. Is controlling phosphorus by decreasing dietary protein intake beneficial or harmful in persons with chronic
kidney disease?. Am J. Clin. Nutr. 88, 1511–1518 (2008).
6. Waheed, A. A., Pedraza, F., Lenz, O. & Isakova, T. Phosphate control in end-stage renal disease: barriers and opportunities. Nephrol.
Dial. Transpl. 28, 2961–2968 (2013).
7. Kalantar-Zadeh, K. et al. Understanding sources of dietary phosphorus in the treatment of patients with chronic kidney disease.
Clin. J. Am. Soc. Nephrol. 5, 519–530 (2010).
8. Malaysian Society of Nephrology. Malaysian CKD-MBD and Parathyroidectomy Guidelines and SOP (Malaysian Society of Neph-
rology, 2018).
9. St-Jules, D. E., Jagannathan, R., Gutekunst, L., Kalantar-Zadeh, K. & Sevick, M. A. Examining the proportion of dietary phosphorus
from plants, animals, and food additives excreted in urine. J. Ren. Nutr. 27, 78–83 (2017).
10. Sànchez-Villegas, A. & Sánchez-Tainta, A. A Healthy diet for your heart and your brain. In The Prevention of Cardiovascular Disease
Through the Mediterranean Diet 169–197 (2018).
11. Hu, F. B. Dietary pattern analysis: a new direction in nutritional epidemiology. Curr. Opin. Lipidol. 13, 3–9 (2002).
12. Ocké, M. C. Evaluation of methodologies for assessing the overall diet: dietary quality scores and dietary pattern analysis. Proc.
Nutr. Soc. 72, 191–199 (2013).
13. Paterson, E. N. et al. Dietary patterns and chronic kidney disease: a cross-sectional association in the Irish Nun Eye Study. Sci.
Rep. 8, 1–8 (2018).
14. Sualeheen, A. et al. Habitual dietary patterns of patients on hemodialysis indicate nutritional risk. J. Ren. Nutr. https://doi.
org/10.1053/j.jrn.2019.09.010 (2019).
15. Tsuruya, K. et al. Dietary patterns and clinical outcomes in hemodialysis patients in Japan: a cohort study. PLoS ONE 10, e0116677
(2015).
16. Saglimbene, V. M. et al. Dietary patterns and mortality in a multinational cohort of adults receiving hemodialysis. Am. J. Kidney
Dis. 75, 361–372 (2019).
17. McClure, S. T. et al. The percentage of dietary phosphorus excreted in the urine varies by dietary pattern in a randomized feeding
study in adults. J. Nutr. 149, 816–823 (2019).
18. Khor, B. H. et al. Dietary fatty acid intake in hemodialysis patients and associations with circulating fatty acid profiles: a cross-
sectional study. Nutrition 63, 14–21 (2019).
19. Department of Standard. Skim Akreditasi Makmal Malaysia. https: //www.jsm.gov.my/skim-akredi tasi- makmal -malays ia-samm-#.
Xpr0sC-B3u0 (2020).
Scientific Reports | (2020) 10:12278 | https://doi.org/10.1038/s41598-020-68893-4 12
Vol:.(1234567890)www.nature.com/scientificreports/
20. Fouque, D. et al. EBPG guideline on nutrition. Nephrol. Dial. Transpl. 22, 45–87 (2007).
21. Tee, E. S., Noor, M. I., Azudin, M. N. & Idris, K. Nutrient compositions of Malaysian foods 4th edn. (Institute for Medical Research
Malaysia, Kuala Lumpur, 1997).
22. Health Promotion Board. Energy and Nutrient Composition of Foods Singapore. Health Promotion Board. https://focos.hpb.gov.
sg/eservices/ENCF/ (2011).
23. Harris, J. A. & Benedict, F. G. A biometric study of human basal metabolism. Proc. Natl. Acad. Sci. U.S.A. 4, 370–373 (1918).
24. Black, A. E. Critical evaluation of energy intake using the Goldberg cut-off for energy intake: basal metabolic rate. A practical
guide to its calculation, use and limitations. Int. J. Obes. 24, 1119–1130 (2000).
25. Tharrey, M. et al. Patterns of plant and animal protein intake are strongly associated with cardiovascular mortality: the Adventist
Health Study-2 cohort. Int. J. Epidemiol. 47, 1603–1612 (2018).
26. Moore, L. W., Nolte, J. V., Gaber, A. O. & Suki, W. N. Association of dietary phosphate and serum phosphorus concentration by
levels of kidney function. Am. J. Clin. Nutr. 102, 444–453 (2015).
27. Zimmerer, J. L., Leon, J. B., Covinsky, K. E., Desai, U. & Sehgal, A. R. Diet monotony as a correlate of poor nutritional intake among
hemodialysis patients. J. Ren. Nutr. 13, 72–77 (2003).
28. National Coordinating Committee on Food and Nutrition. Malaysian Dietary Guidelines. (Ministry of Health Malaysia, 2010).
29. Eng, J. Y., Moy, F. M., Bulgiba, A. & Rampal, S. Consistency and generalizability of dietary patterns in a multiethnic working
population. J. Acad. Nutr. Diet. 118, 1249–1262 (2018).
30. Agnoli, C., Pounis, G. & Krogh, V. Dietary pattern analysis. In Analysis in Nutrition Research: Principles of Statistical Methodology
and Interpretation of the Results (ed. Pounis, G.) 86–93 (Academic Press, Oxford, 2018).
31. Ministry of Health. Renal replacement therapy: clinical practice guidelines. (2011).
32. Martínez-Gonzàlez, M. A. et al. Empirically-derived food patterns and the risk of total mortality and cardiovascular events in the
PREDIMED study. Clin. Nutr. 34, 859–867 (2015).
33. Gutiérrez, O. M. et al. Dietary patterns and risk of death and progression to ESRD in individuals with CKD: a cohort study. Am.
J. Kidney Dis. 64, 204–213 (2014).
34. Machado, A. D. et al. Dietary intake of non-dialysis chronic kidney disease patients: the PROGREDIR study. A cross-sectional
study. Sao Paulo Med. J. 136, 208–215 (2018).
35. Navarro-Alarcon, M., Zambrano, E., Moreno-Montoro, M., Agil, A. & Olalla, M. Duplicate portion sampling combined with spec-
trophotometric analysis affords the most accurate results when assessing daily dietary phosphorus intake. Nutr. Res. 32, 573–580
(2012).
36. Zhang, Z. W. et al. Estimates of mineral intakes using food composition tables vs measures by inductively-coupled plasma mass
spectrometry: Part 1. Calcium, phosphorus and iron. Eur. J. Clin. Nutr. 53, 226–232 (1999).
37. Sullivan, C. M., Leon, J. B. & Sehgal, A. R. Phosphorus-containing food additives and the accuracy of nutrient databases: implica-
tions for renal patients. J. Ren. Nutr. 17, 350–354 (2007).
38. Lynch, K. E., Lynch, R., Curhan, G. C. & Brunelli, S. M. Prescribed dietary phosphate restriction and survival among hemodialysis
patients. Clin. J. Am. Soc. Nephrol. 6, 620–629 (2011).
39. Khor, B. H. et al. The state of nutrition care in outpatient hemodialysis settings in Malaysia: a nationwide survey. BMC Health Serv.
Res. 18, 939 (2018).
40. Moser, M. et al. Phosphorus content of popular beverages. Am. J. Kidney Dis. 65, 969–971 (2015).
41. United Nations. United Nations Commodity Trade Statistics Database. https://comtrade.un.org (2016).
42. Bylund, G. Dairy Processing Handbook (Tetra Pak Processing Systems AB, Lund, 2003).
43. Kalyankar, S. D., Deshmukh, M. A., Khedkar, C. D., Deosarkar, S. S. & Sarode, A. R. Condensed milk. In The Encyclopedia of Food
and Health (ed. Caballero, B.) 291–295 (Academic Press, Oxford, 2016).
44. Calvo, M. S., Sherman, R. A. & Uribarri, J. Dietary phosphate and the forgotten kidney patient: a critical need for FDA regulatory
action. Am. J. Kidney Dis. 73, 542–551 (2019).
45. Tallman, D. A. et al. Dietary patterns and health outcomes among African American maintenance hemodialysis patients. Nutrients
12, 797 (2020).
46. Tapsell, L. C., Neale, E. P. & Probst, Y. Dietary patterns and cardiovascular disease: insights and challenges for considering food
groups and nutrient sources. Curr. Atheroscler. Rep. 21, 9 (2019).
Acknowledgments
This study was supported by the Malaysian Government through the Malaysian Palm Oil Board (grant number:
NN-2015-080). The funder was not involved in the study conceptualization and design, data collection, analysis,
decision to publish, or preparation of this manuscript. B.H.K. has received Chancellor’s Research Scholarship
(Zamalah Yayasan Canselor) from Universiti Kebangsaan Malaysia for his postgraduate study and is now a post-
doctoral researcher (MI-2020-004) of Universiti Kebangsaan Malaysia. S.S. has received scholarship (MyBrain15)
from Ministry of Higher Education, Malaysia for her postgraduate study. We would like to thank Ng Hi Ming
for assisting in preparing the figure in this manuscript.
Author contributions
Conceptualization and design of study: T.K., B.H.K., and A.S.; patient recruitment: A.H.A.G., S.B., B.L.G., and
Z.M.; data acquisition: B.H.K. and S.S.; statistical analysis: K.B.H., K.C., and A.S.; drafting of manuscript: B.H.K.
and T.K.; revision of manuscript: S.S., A.H.A.G., S.B., B.L.G., Z.M., Z.A.M.D., P.K., and A.Y.M.W. All authors
have read and approved the submitted manuscript.
Competing interests
The authors declare no competing interests.
Additional information
Supplementary information is available for this paper at https://doi.org/10.1038/s41598-020-68893-4.
Correspondence and requests for materials should be addressed to T.K.
Reprints and permissions information is available at www.nature.com/reprints.
Publisher’s note Springer Nature remains neutral with regard to jurisdictional claims in published maps and
institutional affiliations.
Scientific Reports | (2020) 10:12278 | https://doi.org/10.1038/s41598-020-68893-4 13
Vol.:(0123456789)www.nature.com/scientificreports/
Open Access This article is licensed under a Creative Commons Attribution 4.0 International
License, which permits use, sharing, adaptation, distribution and reproduction in any medium or
format, as long as you give appropriate credit to the original author(s) and the source, provide a link to the
Creative Commons license, and indicate if changes were made. The images or other third party material in this
article are included in the article’s Creative Commons license, unless indicated otherwise in a credit line to the
material. If material is not included in the article’s Creative Commons license and your intended use is not
permitted by statutory regulation or exceeds the permitted use, you will need to obtain permission directly from
the copyright holder. To view a copy of this license, visit http://creativecommons.org/licenses/by/4.0/.
© The Author(s) 2020
PaTCH Investigators
Boon Cheak Bee11, Ghazali Ahmad4, Soo Kun Lim12, Mohammad Zaimi Abdul Wahab4,
Ravindran Visvanathan4 & Rosnawati Yahya4
11 12
Department of Nephrology, Hospital Selayang, Batu Caves, 68100 Selangor, Malaysia. Department of
Nephrology, Universiti Malaya Medical Center, 59100 Kuala Lumpur, Malaysia.
Scientific Reports | (2020) 10:12278 | https://doi.org/10.1038/s41598-020-68893-4 14
Vol:.(1234567890)You can also read