Clinical Utility of Wearable Sensors and Patient-Reported Surveys in Patients With Schizophrenia: Noninterventional, Observational Study
←
→
Page content transcription
If your browser does not render page correctly, please read the page content below
JMIR MENTAL HEALTH                                                                                                                        Lahti et al

     Original Paper

     Clinical Utility of Wearable Sensors and Patient-Reported Surveys
     in Patients With Schizophrenia: Noninterventional, Observational
     Study

     Adrienne C Lahti1, MD; Dai Wang2, PhD; Huiling Pei3, PhD; Susan Baker3, PhD; Vaibhav A Narayan3, PhD
     1
      Department of Psychiatry and Behavioral Neurobiology, University of Alabama at Birmingham, Birmingham, AL, United States
     2
      Janssen Research & Development, Raritan, NJ, United States
     3
      Janssen Research & Development, Titusville, NJ, United States

     Corresponding Author:
     Adrienne C Lahti, MD
     Department of Psychiatry and Behavioral Neurobiology
     University of Alabama at Birmingham
     SC 501, 1720 7th Ave S
     Birmingham, AL 35233
     United States
     Phone: 1 205 996 7171
     Email: alahti@uab.edu

     Abstract
     Background: Relapse in schizophrenia may be preceded by early warning signs of biological, sensory, and clinical status. Early
     detection of warning signs may facilitate intervention and prevent relapses.
     Objective: This study aims to investigate the feasibility of using wearable devices and self-reported technologies to identify
     symptom exacerbation correlates and relapse in patients with schizophrenia.
     Methods: In this observational study, patients with schizophrenia were provided with remote sensing devices to continuously
     monitor activity (Garmin vivofit) and sleep (Philips Actiwatch), and smartphones were used to record patient-reported outcomes.
     Clinical assessments of symptoms (Positive and Negative Syndrome Scale and Brief Psychiatric Rating Scale) were performed
     biweekly, and other clinical scales on symptoms (Clinical Global Impression-Schizophrenia, Calgary Depression Scale),
     psychosocial functioning, physical activity (Yale Physical Activity Survey), and sleep (Pittsburgh Sleep Quality Index) were
     assessed every 4 weeks. Patients were observed for 4 months, and correlations between clinical assessments and aggregated
     device metrics data were assessed using a mixed-effect model. An elastic net model was used to predict the clinical symptoms
     based on the device features.
     Results: Of the 40 patients enrolled, 1 patient relapsed after being stable with evaluable postbaseline data. Weekly patient-reported
     outcomes were moderately correlated with psychiatric symptoms (Brief Psychiatric Rating Scale total score, r=0.29; Calgary
     Depression Scale total score, r=0.37; and Positive and Negative Syndrome Scale total score, r=0.3). In the elastic net model,
     sleep and activity features derived from Philips Actigraph and Garmin vivofit were predictive of the sitting index of the Yale
     Physical Activity Survey and sleep duration component of the Pittsburgh Sleep Quality Index. On the basis of the combined
     patient data, a high percentage of data coverage and compliance (>80%) was observed for each device.
     Conclusions: This study demonstrated that wearable devices and smartphones could be effectively deployed and potentially
     used to monitor patients with schizophrenia. Furthermore, metrics-based prediction models can assist in detecting earlier signs
     of symptom changes. The operational learnings from this study may provide insights to conduct future studies.
     Trial Registration: ClinicalTrials.gov NCT02224430; https://www.clinicaltrials.gov/ct2/show/NCT02224430

     (JMIR Ment Health 2021;8(8):e26234) doi: 10.2196/26234

     KEYWORDS
     activity; relapse; schizophrenia; sleep; wearable devices; mobile phone

     https://mental.jmir.org/2021/8/e26234                                                             JMIR Ment Health 2021 | vol. 8 | iss. 8 | e26234 | p. 1
                                                                                                                  (page number not for citation purposes)
XSL• FO
RenderX
JMIR MENTAL HEALTH Lahti et al
was applied to examine the correlations between clinical
Introduction assessments and aggregated metrics data.
Background
Methods
Psychotic symptom exacerbation and relapse are frequently
observed in patients with schizophrenia and can lead to a decline Overview
in social functioning, reduced treatment response, and worsening
This study was conducted at the University of Alabama,
of clinical outcomes [1]. These patients and their caregivers
Birmingham (UAB), from August 8, 2015, to March 28, 2016.
experience an increased burden because of relapse and
The protocol was approved by the UAB Institutional Review
consequent hospitalization [2-4]. Relapse in schizophrenia may
Board, and all patients or legally authorized representatives
be preceded by early warning signs, including depressed mood;
provided written informed consent and Health Insurance
social withdrawal; and changes in physical activities, feelings,
Portability and Accountability Act authorization before the start
emotions, and sleep disturbances [5]. Therefore, identifying
of the study.
warning signs can enable early intervention to avoid subsequent
relapse events [6]. Symptom onset can be rapid; however, Patients
continuous monitoring may provide an advantage for early Men and women (aged ≥19 years) who met the Diagnostic and
intervention [7]. Statistical Manual of Mental Disorders, Fifth Edition (DSM-5),
Web-based data capturing technologies such as Information criteria for schizophrenia or schizoaffective disorder diagnosed
Technology–Aided Relapse Prevention in Schizophrenia have based on the Structured Clinical Interview for DSM-5-Text
been piloted to recognize warning signs based on patient Revision Axis I Disorders using the Diagnostic Interview for
reporting of prodromal symptoms of relapse [8]. However, the Genetic Studies-4.0 were included in this study. The target
frequency at which it is practical to obtain this information and population included patients discharged from the inpatient
the subjective nature of patients’ and caregivers’ responses pose psychiatry unit, emergency department, or outpatient clinics of
challenges. Small, unobtrusive remote sensing devices, along UAB who were maintained on a stable dose of antipsychotic
with existing mobile technologies, make it possible to capture medication that remained unchanged for 2 weeks before the
real-time data on patients’ activities, sleep patterns, behaviors, start of the study.
and symptoms. More recent studies have indicated the general Patients were excluded if they had physical or clinical
availability and acceptability of devices for remote assessment disabilities or both, such as hearing, vision, or motor impairment,
and management [9-11]. Smartphones are commonly used and leading to difficulties in operating a smartphone or responding
have multiple embedded sensors (eg, accelerometer, to prompts (determined using a demonstration smartphone for
microphone, GPS, and camera). These can be leveraged to screening); severe substance use disorder (≥6 symptoms)
collect symptom reports through patient-reported outcome according to DSM-5 Level 2–Substance Use–Adult scale
(PRO) surveys and to collect passive data to measure changes (adapted from the National Institute on Drug Abuse-Modified
in behavior [9,12-19]. A consumer wrist-worn smartwatch or Alcohol, Smoking, and Substance Involvement Screening Test);
fitness band can additionally provide measurements of precise or if they were enrolled or planning to enroll in an interventional
and objective activity patterns spanning sleep-rest and study for the treatment or prevention of worsening of symptoms
active-awake periods. These devices have an advantage of of schizophrenia.
generating continuous streaming data that are more reproducible
and less obtrusive than relying on patient and caregiver reports Study Design
alone. In addition, changes in device compliance may itself be This was a noninterventional, observational, exploratory clinical
a signal and indicate a clinically relevant change in behavior study in which patients were allowed to continue with their
[9,17]. usual standard of care and antipsychotic treatment as prescribed
Study Objectives by their physician. Patients were screened for eligibility for up
to 2 weeks. Enrolled patients were observed for relapse for 4
This clinical study was designed to explore the signatures of months (approximately 120 days; observation or study
relapse. However, because patients were mainly recruited from participation period), followed by a 30-day poststudy safety
outpatient clinics and followed up for 4 months—a short period reporting period (Figure 1). Patients were considered to have
to observe relapses in stabilized patients—there were insufficient experienced relapse if they had a rating of moderately severe,
relapses to perform the primary objective. We subsequently very severe, or extremely severe (item score ≥5)—in the
evaluated the feasibility of using wearable devices (singly and previous 2 weeks—for ≥1 item on the Positive and Negative
in combination) and self-reporting technologies to identify Syndrome Scale (PANSS) positive subscale (items P1-P7) or
potentially predictive symptom correlates in patients with ≥2 items on the negative subscale (items N1-N7) [20] or if they
schizophrenia or schizoaffective disorder who are at increased had symptom exacerbation (increased PANSS total score) that
risk of relapse. Continuous monitoring using wearable devices required a change in antipsychotic medication or upward dosage
(eg, fitness bands and smartwatches) and self-reporting via adjustment.
smartphones were used in this study, and predictive modeling
https://mental.jmir.org/2021/8/e26234 JMIR Ment Health 2021 | vol. 8 | iss. 8 | e26234 | p. 2
(page number not for citation purposes)
XSL• FO
RenderXJMIR MENTAL HEALTH Lahti et al
Figure 1. Study design and patient disposition. Patient-reported outcome self-reported symptom questionnaire administered every other day (bidaily)
or weekly. Patients were allowed to continue their usual standard of care and antipsychotic treatment as prescribed by their physician but maintained a
stable dose, which had not changed for 2 weeks before enrollment. BPRS: modified Brief Psychiatric Rating Scale; CDS: Calgary Depression Scale;
CGI-SCH: Clinical Global Impression-Schizophrenia; EMR: electronic medical record; PANSS: Positive and Negative Syndrome Scale; PRO:
patient-reported outcome; PSQI: Pittsburgh Sleep Quality Index; REDCap: Research Electronic Data Capture; SFS: Social Functioning Scale; UAB:
University of Alabama, Birmingham; YMRS: Young Mania Rating Scale; YPAS: Yale Physical Activity Survey.
Wearable remote sensing devices and a smartphone were PANSS and modified Brief Psychiatric Rating Scale (BPRS)
provided to eligible patients for use during the observation [21] were assessed every 2 weeks (biweekly), whereas Clinical
period. All patients had to undergo a training tutorial for the Global Impression-Schizophrenia (CGI-SCH) [22], Calgary
devices and smartphone based on their individual learning needs. Depression Scale (CDS) [23], Young Mania Rating Scale [24],
Repeated practice was performed until patients were comfortable and electronic medical records were assessed every 4 weeks.
using these items. The importance of refraining from tampering Physical activity was assessed using the Yale Physical Activity
or attempting to deactivate the devices was conveyed to the Survey (YPAS) [25], and sleep was monitored using the
patients. The confidence of patients with using the devices was Pittsburgh Sleep Quality Index (PSQI) [26] every 4 weeks.
assessed, and retraining was performed, if required. Potential Physicians completed the CGI-SCH [22] severity scale for each
predictors of symptom worsening or relapse (eg, sleep quality) patient, and a trained study coordinator administered the PANSS
were collected using remote sensing devices, and the results to patients. Clinical assessments performed at baseline for
were subsequently compared with standard clinical assessments. patient characterization included psychosocial functioning
Patients did not have access to the activity and sleep data (assessed using the Social Functioning Scale [27]) or quality of
generated by the wearable devices, so that behavior was life, cognitive functioning, impulsivity, and measure of
independent of feedback. addiction. Patient self-reports were also used to assess symptom
status and relapse.
The 30-day poststudy safety reporting period was per Janssen
Adverse Event Reporting Requirements for Noninterventional Device Data Collection and Processing
Studies, wherein all adverse events were recorded from the first
use of the Janssen products and for 30 days after the last use of General Information
these Janssen drug products within the study. The study was monitored according to the sponsor’s current
standard operating procedures for the monitoring of clinical
Clinical Assessments trials, and activities were implemented to ensure proper
During the observation period, clinical assessments were operational study oversight. These activities focused on
performed for symptom worsening and relapse identification. identifying and resolving operational and quality issues to ensure
https://mental.jmir.org/2021/8/e26234 JMIR Ment Health 2021 | vol. 8 | iss. 8 | e26234 | p. 3
(page number not for citation purposes)
XSL• FO
RenderXJMIR MENTAL HEALTH Lahti et al
data integrity, protocol compliance, and safety of the study individuals rather than cross-sectional studies, they can provide
participants. Written instructions were provided for collecting some utility.
source documentation, which was reviewed for accuracy and
completeness by the sponsor during on-site monitoring visits
Philips Actiwatch Spectrum
and underwent internal data reviews throughout the study and The Philips Actiwatch is a wristwatch with an actigraphy system
at the time of database lock. Discrepancies were resolved with for tracking objective data on off-wrist status, sleep-wake,
the investigator or designees, as appropriate. activity count, and light exposure. Data were collected in
30-second epochs. This actiwatch was worn 24×7, is designed
The UAB clinical site captured all clinical assessments using for clinical trials and populations, and is well established for
source documents, and these data were entered into the REDCap actigraphy-based sleep assessments [28]. A single wristwatch
(Research Electronic Data Capture) system. The nature and was dispensed to patients at visit 1. At every visit to the clinic,
location of all source documents were identified to ensure that data from the device were downloaded from a proprietary
all sources of original data required to complete data collection docking station supplied by Philips.
were known to the sponsor or investigator and study site
personnel. As per the study protocol, patients were requested to wear both
Philips Actiwatch and Garmin vivofit devices at all times
Smartwatches or fitness bands can monitor activity based on without additional guidance on the arm preference.
the time frame, duration, and intensity of movement. The
unprocessed data collected from wearable devices (eg, Smartphone
accelerometry) may not directly represent variables or metrics Smartphone apps were used in the study to collect PROs
that are amenable to patient-relevant interpretation or traditional consisting of self-assessment and symptom-tracking
prespecified statistical measures. The raw data are reduced by questionnaires. One set of questions was given every 2 days
the device manufacturers to metrics representing the average (bidaily), and the other set of questions was given weekly
state of an individual during specified periods (eg, steps taken, throughout the observation period. The Ginger app was used at
time spent resting or sleeping, and activity intensity levels). the beginning of the study for collection, but patients were
These behavioral and lifestyle measures provided a set of metrics migrated to the UAB REDCap PRO survey system. The
that were tested independently and collectively as a pattern REDCap system collected the same information at the same
toward the specified aims. Analytics can be derived from the frequency as the originally deployed Ginger app but had the
patterns that are normal (baseline) for a given patient to detect advantage of direct capture in the clinical database rather than
any relevant changes during clinical follow-up. For sleep, needing to capture the data periodically through a third-party
domains that could be assessed through remote sensing devices upload. The reason for the switch was that the duration of the
include onset time, duration, and quality; frequency and pattern trial recruitment period exceeded that of the contracted services
of sleep disruptions can be monitored by the number and with Ginger. A smooth transition was easily developed and
duration of movements. Similarly for activity, steps per day implemented, and no data were lost.
(mobility) and patterns of daily activity—distribution of high-,
medium-, and low-intensity activities—can be assessed. Mobile Patients who had personal smartphones were asked to download
phone reporting of clinically relevant metrics such as medication the Ginger app. The site provided a smartphone if the patient
compliance; well-being; and the degree of symptom experience, did not own one. Patients were restricted to the use of only one
such as seeing or hearing things, could also be assessed. personal smartphone with the Ginger app during the course of
the study. To prevent the erroneous collection of nonpatient
Device data and PRO responses collected between clinical visits data, the use of the smartphone was restricted to the patient only
were aggregated to test correlations with the clinical visits and and was not to be shared with others.
outcomes. Compliance using the devices was also monitored
(defined as using or wearing either all devices for 50% of the In addition, patients were instructed on the completion of UAB
time in 24 hours or 2 of 4 devices during the 4-month REDCap PRO surveys via an email set up for each patient by
observation period). the UAB. The email contained a link for access to the survey.
Responses to the survey were collected within REDCap through
Garmin Vivofit Fitness Band a secure web-based app module to manage and build the
Garmin vivofit is a wristband with an easy-to-read display that web-based surveys.
was worn at all times by patients to track ambulatory activity Both Ginger and REDCap data were recorded on the Health
(number of steps taken every 15 minutes). A single device was Insurance Portability and Accountability Act–compliant UAB
dispensed at visit 1 with instructions for use. At every visit to server. At the end of the study, all patients were asked to return
the clinic, data from the device were downloaded onto the site their wristwatches. Patients completing the study were allowed
computer and stored in a secure location. The Garmin vivofit to keep the site-issued smartphone, but the monthly plan was
device is a consumer-grade fitness device. Consumer devices terminated. Patients did not have access to the data generated
have the benefit of higher user acceptance as a social norm. The during the course of the study.
disadvantage is that the measurements are not clinically
validated, and specific firmware versions need to be tracked,
as they can impact the results. Despite these challenges, if the
intended outcome is detecting relative changes in behavior for
https://mental.jmir.org/2021/8/e26234 JMIR Ment Health 2021 | vol. 8 | iss. 8 | e26234 | p. 4
(page number not for citation purposes)
XSL• FO
RenderXJMIR MENTAL HEALTH Lahti et al
Analytical Methods corresponding clinical assessment were calculated. The summary
statistics of all device metrics were combined as the feature set
Statistical Analysis for models predictive of clinical assessments.
The sample size for the study was estimated based on previous
Associations among the clinical symptoms and between clinical
experience, assuming that 35% to 40% of patients may
symptoms and device variables were assessed using mixed-effect
experience a full significant exacerbation of psychotic symptoms
models. For each pair, one variable was considered as the
or relapse during the course of the study. The level of relapse
response variable and the other variable was considered as the
anticipated within 120 days for patients treated for a current
independent variable. Patient was included in the model as a
relapse was based on the experience of UAB in their clinics.
random effect to account for correlations among the repeated
For patient characteristics, all continuous variables were
measures. Each data variable was scaled so that each had a
summarized using descriptive statistics, and the categorical
variance of 1. Testing whether the dependent and independent
variables were summarized using frequency measures. As the
variables are correlated is equivalent to testing whether the
analyses were exploratory in nature, a two-sided significance
coefficient of the independent variable is 0.
level of 5% was used, unless specified otherwise, for all
statistical tests. Multiplicity adjustments were not made for the Elastic net [29] was applied to build models using linear
analysis. regression to predict the clinical assessments and the
patient-reported activity and sleep scales using feature sets
Without significant clinical changes to detect or model, we
constructed from the device data. Ten-fold repeated
assessed the within-patient stability of the clinical scales using
cross-validation with 30 repeats was also applied to train the
the intraclass correlation coefficient (ICC), a metric commonly
models and assess the performance of the model. The repeated
used in psychometrics to assess the test-retest and interrater
cross-validation was conducted at the patient level, where data
reliability. If the patient-level variance is small for stable
on 10% of patients were held out for validation. The
patients, it is easier to detect potentially important deviations
performance of the predictive models was assessed using the
from individualized norms. The ICC was calculated using a
mixed-effect model, in which patient was included as a random root mean square error and the R2. The R2 was calculated as the
effect. difference between the total sum of squares and the sum of
squares owing to the error sum of squares divided by the total
Table 1 summarizes all the metrics obtained from the devices.
sum of squares. When the R2 is calculated based on
These metrics were aggregated biweekly to generate the feature
cross-validation results and the sum of squares owing to error
sets for predictive modeling. Means and SDs of the device
is calculated based on out-of-sample predictions, the estimated
metrics during the 2 weeks immediately before the
R2 may be negative.
https://mental.jmir.org/2021/8/e26234 JMIR Ment Health 2021 | vol. 8 | iss. 8 | e26234 | p. 5
(page number not for citation purposes)
XSL• FO
RenderXJMIR MENTAL HEALTH Lahti et al
Table 1. Metrics obtained from Philips Actigraph, Garmin vivofit, and surveys.
Device and metric Frequency
Philips Actigraph
Time spent sedentary (minutes) Daily
Time spent on low-intensity activities (minutes) Daily
Time spent on moderate-intensity activities (minutes) Daily
Time spent on vigorous-intensity activities (minutes) Daily
Total activity count Daily, nightly
Average activity count Daily, nightly
Maximum activity count Daily, nightly
Duration of active or sleeping (minutes) Daily, nightly
Percentage of time with invalid sleep-wake status Daily, nightly
Time spent awake (minutes) Daily, nightly
Percentage of time spent awake Daily, nightly
Number of wake bouts Nightly
Average duration of wake bouts (minutes) Nightly
Time spent sleeping (minutes) Daily, nightly
Percentage of time spent sleeping Daily, nightly
Sleep onset latency (minutes) Nightly
Time spent resting after waking up (minutes) Nightly
Time of valid rest (minutes) Nightly
Sleep efficiency Nightly
Sleep start time (hours:minutes) Nightly
Rest start time (hours:minutes) Nightly
Sleep fragmentation Nightly
Garmin vivofit
Time spent sedentary (seconds) Daily
Time spent walking (seconds) Daily
Total steps Daily
Number of epochs Daily
Number of steps during nighttime Nightly
Survey
Bidaily survey summary score Bidaily
Feel down or depressed Bidaily
Feel confused or have trouble with your thinking Bidaily
Feel stressed or overwhelmed Bidaily
See or hear things that other people could not see or hear Bidaily
Feel suspicious or paranoid Bidaily
Have trouble sleeping the night before Bidaily
Weekly survey summary score Weekly
Feel anxious or nervous Weekly
Feel unmotivated Weekly
Have trouble getting things done Weekly
Missed any schizophrenia medications in the past 7 days Weekly
https://mental.jmir.org/2021/8/e26234 JMIR Ment Health 2021 | vol. 8 | iss. 8 | e26234 | p. 6
(page number not for citation purposes)
XSL• FO
RenderXJMIR MENTAL HEALTH Lahti et al
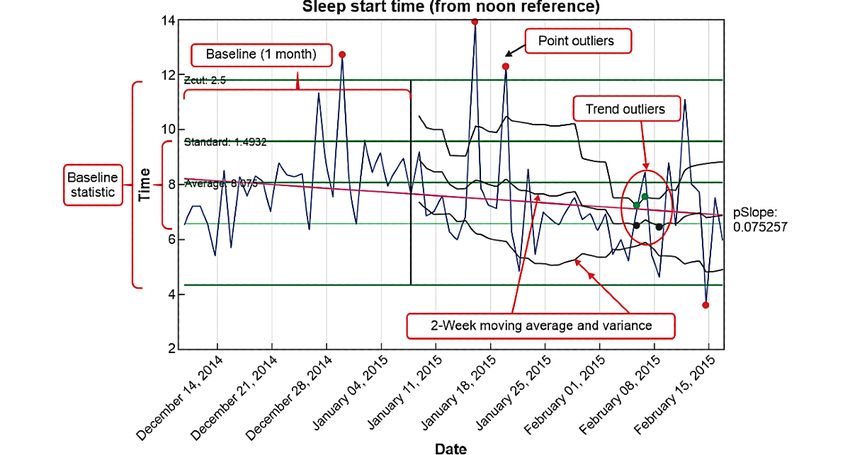
Detecting Statistically Relevant Change in Streaming Outliers and trends may have causal explanations other than
Data relapse; however, detected changes create an opportunity to
have conversations with the patient about behaviors, with
There is evidence that detectable signs of relapse may be specific
objective data. For example, in Figure 2, examination of sleep
to an individual [17]. As such, it is important to develop metrics
onset data revealed a significant trend toward earlier sleep times
that can detect statistically relevant changes based on a person’s
as the patient approached relapse. The average sleep onset time
own data rather than what may be normal for individuals.
at baseline was 8 PM. Near relapse, the data trended to a 2-week
Metrics derived from the devices or PRO can be monitored as
average around 6:30 PM.
a real-time streaming process similar to process control in
manufacturing or even the stock market. A stable longitudinal It is relatively easy to detect statistically relevant changes in the
period can be used to establish a baseline norm (mean and streaming metrics. The challenge is assigning causality to the
variance) for each metric of interest. At any subsequent point, change without an understanding of the context [13,16,17].
statistical tests can be performed for point outlier status of the Most detected changes are probably not relevant to relapse but
daily tracked measures or if the short-term mean and variance could be used in a clinical setting for follow-up or conversations
of a defined measurement period are statistically different from with caregivers based on these objective data.
the baseline measures, indicating that a trend may be occurring.
Figure 2. Sleep onset time for a single relapse patient. Outliers and trends may have causal explanations other than relapse but allow an opportunity
to have conversations about behaviors with objective data. The first month was used to establish baseline normal data. Outlier alerts can be set based
on baseline mean and variance. In this case, outlier detection alerts were set at 2.5 SDs from the baseline population distribution. After the baseline, a
moving average window of 2 weeks was calculated and overlayed on daily data and was used to look for significant changes or trends from the baseline
mean or variance. Finally, statistically relevant changes in the slope over a defined interval can indicate relevant changes. The flagged points represent
outliers or changes above a set threshold. Flags noted on the moving average mean indicate significant differences for the moving average mean, and
flags noted on the moving average variance indicate significant differences in variance from the baseline. For example, examining the sleep onset data,
there is a significant trend toward earlier sleep times as the patient approached relapse. The average sleep onset time at baseline was 8 PM. Near relapse,
the data had trended to a 2-week average around 6:30 PM.
withdrawal of consent: 5%, 2/40; Figure 1). Only 8% (3/40) of
Results patients experienced a relapse during the study, of which only
Patient Disposition and Baseline Characteristics 1 patient had sufficient postscreening data to establish a
reference baseline. The enrolled patients had a higher proportion
A total of 49 patients were screened, and 40 patients were of men (25/40; 63%), a median age of 40.3 years, and a mean
enrolled in the study. In total, 9 participants were screened out
baseline BMI of 34.9 kg/m2. Most patients (38/40;95%) were
because of loss to follow-up after consent (n=4) and after the
on at least one antipsychotic medication during the course of
screening visit (n=1), consent withdrawal (n=1), screen
the study, and the most common medication was Risperdal
failure—lack of proof of diagnosis (n=1) and no reason (n=1),
Consta (28/40; 70%). All patients continued their prescribed
and unknown—screening visit not being performed (n=1).
medication throughout the study (Table 2).
Of these 40 patients, 31 (78%) completed the study and 9 (23%)
discontinued the study (protocol violations: 18%, 7/40 and
https://mental.jmir.org/2021/8/e26234 JMIR Ment Health 2021 | vol. 8 | iss. 8 | e26234 | p. 7
(page number not for citation purposes)
XSL• FO
RenderXJMIR MENTAL HEALTH Lahti et al
Table 2. Patients’ demographics and baseline characteristics (N=40).
Characteristic Values
Age (years), median (range) 40.3 (19-65)
Gender, n (%)
Women 15 (38)
Men 25 (63)
Race, n (%)
Black or African American 29 (73)
White 11 (28)
2 34.9 (8.65)
Baseline BMI (kg/m ), mean (SD)
Baseline PANSSa total score, mean (SD) 35.7 (5.02)
Baseline CGI-Sb score, n (%)
Normal, not at all ill 1 (3)
Borderline mentally ill 4 (10)
Mildly ill 11 (28)
Moderately ill 17 (43)
Markedly ill 7 (18)
a
PANSS: Positive and Negative Syndrome Scale.
b
CGI-S: Clinical Global Impression-Severity scale.
Scale worsened in the subdomains of sleep, language, thought
Clinical Assessments disorder, and insight, and the CDS worsened in the subdomains
For the patient experiencing a relapse, the CGI disease severity of depression and early wakening.
scores worsened from 2 to 5 (borderline mentally to markedly
ill), and the global improvement changed from 4 to 6 (no change Correlations Among Clinical Symptoms
to much worse). The PANSS domains that worsened at relapse For the 40 enrolled patients, the within-patient stability of the
included positive subscale items (delusions-P1 and conceptual clinical symptom scales as assessed by ICC showed either
disorganization-P2), negative subscale items (poor rapport-N3), excellent or good agreement, suggesting that most of the
and general psychopathology scale items (somatic concern-G1, assessed symptoms were stable throughout the study
anxiety-G2, tension-G4, depression-G6, uncooperative-G8, lack (Multimedia Appendix 1). When assessing the association
of judgment-G12, and disturbance of volition-G13). The BPRS among clinical symptoms, the PANSS total score and the BPRS
scale worsened in the subdomains of somatic concern, anxiety, total scores showed a very strong correlation (r=0.97). However,
conceptual disorganization, tension, depressive mood, the Clinical Global Impression-Severity scale score did not
uncooperative, and disorientation. The Young Mania Rating strongly correlate with the PANSS and BPRS scores (Table 3).
https://mental.jmir.org/2021/8/e26234 JMIR Ment Health 2021 | vol. 8 | iss. 8 | e26234 | p. 8
(page number not for citation purposes)
XSL• FO
RenderXJMIR MENTAL HEALTH Lahti et al
Table 3. Associations among psychiatric symptoms (N=40).
Symptom scores BPRSa total score CGI-Sb score CDSc total score YMRSd total score
PANSSe total score
Coefficient 0.97f 0.12 0.68 0.29
P valueJMIR MENTAL HEALTH Lahti et al
Table 4. Associations between Philips Actigraph sleep features and the Pittsburgh Sleep Quality Index global and component scores.
Metric PSQIa sleep duration PSQI sleep disturbances
Coefficient P value Coefficient P value
Total activity count 0.03 .80 0.24 .10
Average activity count −0.14 .22 0.27 .08
Maximum activity count 0 .99 0.17 .23
Duration (minutes) 0.36bJMIR MENTAL HEALTH Lahti et al
Table 5. Associations between Philips Actigraph activity features and the Yale Physical Activity Survey global or individual indexes.
YPASa global YPAS vigorous YPAS leisure YPAS moving YPAS standing YPAS sitting
Activity features index activity index walking index index index index
Time spent sedentary (minutes)
Coefficient −0.35b ncc 0.01 −0.25 −0.36 0.27
P value .01 —d .95 .02 .01 .01
Time spent on low-intensity activities (minutes)
Coefficient 0.40 nc 0.07 0.26 0.40 −0.3
P value .003 — .61 .03 .003 .004
Time spent on moderate-intensity activities (minutes)
Coefficient 0.82 0.93 nc nc 1.03 −0.05
P value .25 .17 — — .26 .97
Time spent on vigorous-intensity activities (minutes)
Coefficient 0.22 0.29 0.05 nc 0.45 nc
P value .61 .70 .89 — .31 —
Total activity count
Coefficient 0.33 nc nc 0.22 0.33 −0.2
P value .02 — — .14 .02 .06
Average activity count
Coefficient 0.33 nc 0.06 0.25 0.33 −0.22
P value .06 — .63 .27 .03 .13
Maximum activity count
Coefficient 0.25 nc −0.02 0.12 0.26 −0.01
P value .14 — .89 .25 .03 .95
Duration (minutes)
Coefficient 0.06 0.1 −0.03 0 0.07 0.02
P value .46 .30 .70 .97 .48 .86
Time spent awake (minutes)
Coefficient nc nc −0.06 0.11 0.05 0.01
P value — — .57 .26 .81 .91
Time spent awake (%)
Coefficient nc nc −0.01 0.19 0.06 0.01
P value — — .93 .13 .77 .96
Time spent sleeping
Coefficient nc −0.13 0.01 −0.18 −0.06 0.04
P value — .49 .95 .13 .78 .70
Time spent sleeping (%)
Coefficient nc nc 0.01 −0.19 −0.06 −0.01
P value — — .93 .13 .77 .96
a
YPAS: Yale Physical Activity Survey.
b
Italic values indicate significant correlation (PJMIR MENTAL HEALTH Lahti et al
Table 6. Associations between Garmin activity features and clinical scores.
Activity features PANSSa total score BPRSb total score CGI-SCHc score CDSd total score YMRSe total score
Time spent sedentary (seconds)
Coefficient 0.15 0.12 0.25 −0.03 ncf
P value .66 .59 .27 .88 —g
Time spent walking (seconds)
Coefficient −0.15 −0.12 −0.25 0.03 nc
P value .65 .58 .26 .88 —
Total steps
Coefficient −0.21 −0.23h −0.07 nc −0.13
P value .19 .03 .44 — .40
a
PANSS: Positive and Negative Syndrome Scale.
b
BPRS: modified Brief Psychiatric Rating Scale.
c
CGI-SCH: Clinical Global Impression-Schizophrenia.
d
CDS: Calgary Depression Scale.
e
YMRS: Young Mania Rating Scale.
f
nc: the model did not converge.
g
Not applicable.
h
Italic values indicate significant correlation (PJMIR MENTAL HEALTH Lahti et al
Table 8. Associations between survey data features and psychiatric symptoms.
Survey data features PANSSa total score BPRSb total score CGI-SCHc score CDSSd total score YMRSe total score
Bidaily survey summary score
Coefficient 0.27 0.23 f ncg 0.37 nc
P value .09 .05 —h .01 —
Feel down or depressed
Coefficient 0.28 0.2 nc 0.34 0.01
P value .11 .10 — .01 .93
Feel confused or have trouble with your thinking
Coefficient 0.25 0.19 nc 0.35 0.12
P value .09 .08 — .01 .34
Feel stressed or overwhelmed
Coefficient 0.29 0.16 –0.04 0.25 0.02
P value .06 .11 .49 .04 .86
See or hear things that other people could not see or hear
Coefficient 0.26 0.2 0 0.11 nc
P value .22 .13 .99 .42 —
Have trouble sleeping the night before
Coefficient 0.10 0.10 –0.07 0.02 –0.04
P value .39 .22 .48 .84 .69
Weekly survey summary score
Coefficient 0.30 0.29 –0.2 0.37 0.09
P value .03 .01 .26 .01 .47
Feel anxious or nervous
Coefficient 0.09 0.18 –0.17 0.26 0.09
P value .71 .12 .16 .06 .55
Feel unmotivated
Coefficient 0.19 0.23 –0.06 0.26 0.1
P value .16 .04 .70 .20 .47
Have trouble getting things done
Coefficient 0.35 0.25 0.05 0.28 0.09
P value .04 .04 .73 .04 .40
Missed any schizophrenia medications in past 7 days
Coefficient 0.23 0.03 nc 0.11 0.37
P value .46 .86 — .19 .07
a
PANSS: Positive and Negative Syndrome Scale.
b
BPRS: modified Brief Psychiatric Rating Scale.
c
CGI-SCH: Clinical Global Impression-Schizophrenia.
d
CDS: Calgary Depression Scale.
e
YMRS: Young Mania Rating Scale.
f
Italic values indicate significant correlation (PJMIR MENTAL HEALTH Lahti et al
Table 9. Performance of the elastic net models for predicting clinical scores (N=40).
Feature set RMSEa SD R2 SD
PANSSb total score
Survey bidaily 4.27c 0.03 0.11 0.01
Survey weekly 4.23 0.05 0.12 0.02
Survey (bidaily+weekly) 4.20 0.04 0.13 0.02
BPRSd total score
Survey bidaily 3.90 0.03 0.19 0.01
Survey weekly 3.94 0.06 0.17 0.02
Survey (bidaily+weekly) 3.86 0.05 0.21 0.02
CGIe-severity
Survey bidaily 0.84 0.01 0.03 0.03
Survey weekly 0.87 0.01 −0.03 0.02
Survey (bidaily+weekly) 0.84 0.01 0.03 0.02
CDSf total score
Survey bidaily 2.48 0.03 0.25 0.02
Survey weekly 2.52 0.03 0.23 0.02
Survey (bidaily+weekly) 2.45 0.03 0.27 0.02
a
RMSE: root mean square error.
b
PANSS: Positive and Negative Syndrome Scale.
c
Italic values indicate that the uncorrected P value for R2 isJMIR MENTAL HEALTH Lahti et al
Table 10. Performance of the elastic net models for predicting the Pittsburgh Sleep Quality Index global and component scores.
Feature set RMSEa SD R2 SD
PSQIb global score
Philips Actigraph sleep 2.68 0.01 –0.01 0.01
Philips Actigraph activity 2.67 0.01 –0.01 0.01
Philips Actigraph (sleep+activity) 2.67 0.01 –0.01 0.01
Garmin activity 2.62 0.02 0.03 0.01
Survey bidaily 2.40c 0.03 0.19 0.02
Survey weekly 2.41 0.02 0.18 0.02
Survey (bidaily+weekly) 2.41 0.03 0.18 0.02
PSQI subjective sleep quality
Philips Actigraph sleep 0.76 0.01 –0.01 0.01
Philips Actigraph activity 0.75 0.00 –0.01 0.01
Philips Actigraph (sleep+activity) 0.76 0.00 –0.01 0.01
Garmin activity 0.76 0.00 –0.01 0.01
Survey bidaily 0.73 0.01 0.05 0.02
Survey weekly 0.74 0.01 0.03 0.01
Survey (bidaily+weekly) 0.73 0.01 0.04 0.02
PSQI sleep latency
Philips Actigraph sleep 1.64 0.01 –0.01 0.01
Philips Actigraph activity 1.58 0.01 0.05 0.01
Philips Actigraph (sleep+activity) 1.60 0.01 0.04 0.01
Garmin activity 1.64 0.01 −0.01 0.01
Survey bidaily 1.62 0.01 0.02 0.01
Survey weekly 1.63 0.01 −0.00 0.01
Survey (bidaily+weekly) 1.61 0.01 0.02 0.01
PSQI sleep duration
Philips Actigraph sleep 1.43 0.02 0.13 0.02
Philips Actigraph activity 1.42 0.02 0.15 0.02
Philips Actigraph (sleep+activity) 1.44 0.01 0.12 0.02
Garmin activity 1.50 0.02 0.06 0.02
Survey bidaily 1.52 0.01 0.03 0.01
Survey weekly 1.55 0.01 −0.01 0.01
Survey (bidaily+weekly) 1.52 0.01 0.03 0.01
PSQI habitual sleep efficiency
Philips Actigraph sleep 7.38 0.02 −0.00 0.01
Philips Actigraph activity 7.38 0.03 −0.00 0.01
Philips Actigraph (sleep+activity) 7.38 0.02 −0.00 0.01
Garmin activity 7.38 0.02 −0.00 0.01
Survey bidaily 7.38 0.03 −0.00 0.01
Survey weekly 7.38 0.02 −0.00 0.01
Survey (bidaily+weekly) 7.38 0.02 −0.00 0.01
PSQI sleep disturbances
https://mental.jmir.org/2021/8/e26234 JMIR Ment Health 2021 | vol. 8 | iss. 8 | e26234 | p. 15
(page number not for citation purposes)
XSL• FO
RenderXJMIR MENTAL HEALTH Lahti et al
Feature set RMSEa SD R2 SD
Philips Actigraph sleep 3.76 0.08 0.05 0.04
Philips Actigraph activity 3.86 0.01 −0.00 0.01
Philips Actigraph (sleep+activity) 3.83 0.04 0.01 0.02
Garmin activity 3.85 0.02 0.00 0.01
Survey bidaily 3.34 0.04 0.25 0.02
Survey weekly 3.35 0.03 0.24 0.01
Survey (bidaily+weekly) 3.27 0.04 0.28 0.02
PSQI use of sleep medication
Philips Actigraph sleep 1.35 0.00 −0.00 0.01
Philips Actigraph activity 1.35 0.01 −0.01 0.01
Philips Actigraph (sleep+activity) 1.35 0.01 −0.01 0.01
Garmin activity 1.36 0.01 −0.01 0.01
Survey bidaily 1.33 0.02 0.02 0.03
Survey weekly 1.32 0.01 0.03 0.02
Survey (bidaily+weekly) 1.34 0.02 0.02 0.02
PSQI daytime dysfunction
Philips Actigraph sleep 0.96 0.01 −0.04 0.01
Philips Actigraph activity 0.96 0.01 −0.04 0.02
Philips Actigraph (sleep+activity) 0.97 0.01 −0.04 0.01
Garmin activity 0.97 0.01 −0.04 0.01
Survey bidaily 0.96 0.01 −0.04 0.02
Survey weekly 0.95 0.03 −0.01 0.06
Survey (bidaily+weekly) 0.96 0.02 −0.03 0.04
a
RMSE: root mean square error.
b
PSQI: Pittsburgh Sleep Quality Index.
c
Italic values indicate significant correlation (PJMIR MENTAL HEALTH Lahti et al
Patient-reported survey data features were correlated with consider tracking recruitment bias in the design. In general,
clinical symptoms. expanding the study to more patients and a longer duration
would be required to develop robust models predictive of clinical
In this study, an elastic net model was used to predict
change. The longitudinal stability of the patients would facilitate,
correlations between clinical assessments and the device metrics.
however, the ability to detect relative changes and outliers when
The Philips Actigraph and the Garmin activity data showed
they occur. Although detecting change is facilitated by having
some utility in predicting the sitting index of the YPAS. The
a long-term stable baseline, patients that are unstable will
features derived from the patient-reported survey data were
inherently have more variability. Higher variability can make
useful in predicting the total score, the subjective sleep quality
the detection of event outliers more difficult. Having continuous
component, and the sleep disturbance component of the PSQI.
data, however, allows statistical averaging for longer periods
Features derived from the Philips Actigraph and Garmin vivofit
than single-point estimates. Trends and changes in variability
were predictive of the sleep duration component of the PSQI.
can be detected with streaming data, even in unstable subjects,
The implementation of technology-based measures along with
more readily than with point estimates from clinical visits. This
metrics-based prediction methods could be effective in
study demonstrates that remote sensing devices and mobile
instituting early warning systems for symptom decline and
technology can be used to monitor metrics that are relevant for
relapse patterns in schizophrenia.
patients with schizophrenia. It will be important to capture the
Limitations context of detected changes in future studies to determine the
With limited relapses or clinical changes, this study was not metrics most predictive of relapse or symptom exacerbation.
sufficiently powered to identify predictors of relapse or symptom Conclusions
exacerbation by comparing clinical and technological
In summary, relapse prediction using remote sensing
assessments. Although a higher relapse rate was expected based
technologies may aid clinicians to be cautioned in advance to
on historical rates in the clinic, we speculate that there may have
detect the approaching exacerbation of symptoms and patterns
been a recruitment bias for this study. Less stable subjects may
of relapse in patients with schizophrenia. The operational
have been less interested in participation. In addition, the
learnings from this study provide insights to conduct future
frequent clinical assessments and questionnaires and the
studies with remote sensing devices in this patient population
presence of the devices would have generated a heightened
to devise earlier intervention strategies.
personal focus on relevant symptoms. Future trial designs should
Acknowledgments
The authors thank the study participants, without whom this study would never have been accomplished, and the investigators
for their participation in this study. The authors also thank Antonia Covin for project management and Michael Beyer for the
information technology framework. Ramji Narayanan, MPharm, ISMPP CMPP (SIRO Clinpharm Pvt Ltd), provided writing
assistance, and Ellen Baum, PhD (Janssen Global Services, LLC), provided additional editorial support for this manuscript.
Conflicts of Interest
This study is supported by Janssen Research & Development, LLC, United States. SB, DW, HP, and VAN are employees of
Janssen Research & Development and hold company stocks. ACL has no conflicts of interest to declare.
Multimedia Appendix 1
Stability of the clinical scales during the study.
[DOCX File , 15 KB-Multimedia Appendix 1]
Multimedia Appendix 2
Performance of the elastic net models for predicting the global and individual Yale Physical Activity Survey indices.
[DOCX File , 17 KB-Multimedia Appendix 2]
References
1. Emsley R, Chiliza B, Asmal L, Harvey BH. The nature of relapse in schizophrenia. BMC Psychiatry 2013;13:50 [FREE
Full text] [doi: 10.1186/1471-244X-13-50] [Medline: 23394123]
2. Caqueo-Urízar A, Miranda-Castillo C, Lemos GS, Lee MS, Ramírez PM, Mascayano TF. An updated review on burden
on caregivers of schizophrenia patients. Psicothema 2014 May;26(2):235-243. [doi: 10.7334/psicothema2013.86] [Medline:
24755026]
3. Hor K, Taylor M. Suicide and schizophrenia: a systematic review of rates and risk factors. J Psychopharmacol 2010 Nov;24(4
Suppl):81-90 [FREE Full text] [doi: 10.1177/1359786810385490] [Medline: 20923923]
4. Chan SW. Global perspective of burden of family caregivers for persons with schizophrenia. Arch Psychiatr Nurs 2011
Oct;25(5):339-349. [doi: 10.1016/j.apnu.2011.03.008] [Medline: 21978802]
https://mental.jmir.org/2021/8/e26234 JMIR Ment Health 2021 | vol. 8 | iss. 8 | e26234 | p. 17
(page number not for citation purposes)
XSL• FO
RenderXJMIR MENTAL HEALTH Lahti et al
5. Jørgensen P. Early signs of psychotic relapse in schizophrenia. Br J Psychiatry 1998 Apr;172:327-330. [doi:
10.1192/bjp.172.4.327] [Medline: 9715335]
6. Birchwood M. Early intervention in psychotic relapse: cognitive approaches to detection and management. Behav Change
2014 Oct 06;12(1):2-19. [doi: 10.1017/s0813483900004344]
7. Wang D, Gopal S, Baker S, Narayan VA. Trajectories and changes in individual items of positive and negative syndrome
scale among schizophrenia patients prior to impending relapse. NPJ Schizophr 2018 Jun 20;4(1):10 [FREE Full text] [doi:
10.1038/s41537-018-0056-6] [Medline: 29925851]
8. Spaniel F, Vohlídka P, Hrdlicka J, Kozený J, Novák T, Motlová L, et al. ITAREPS: Information technology aided relapse
prevention programme in schizophrenia. Schizophr Res 2008 Jan;98(1-3):312-317. [doi: 10.1016/j.schres.2007.09.005]
[Medline: 17920245]
9. Eisner E, Bucci S, Berry N, Emsley R, Barrowclough C, Drake RJ. Feasibility of using a smartphone app to assess early
signs, basic symptoms and psychotic symptoms over six months: a preliminary report. Schizophr Res 2019 Jun;208:105-113
[FREE Full text] [doi: 10.1016/j.schres.2019.04.003] [Medline: 30979665]
10. Finucane MJ. Patients’ attitudes to and experience of the use of technology in mental health in an Irish primary care setting.
Int J Integr Care 2019 Aug 08;19(4):370. [doi: 10.5334/ijic.s3370]
11. Gay K, Torous J, Joseph A, Pandya A, Duckworth K. Digital technology use among individuals with schizophrenia: results
of an online survey. JMIR Ment Health 2016;3(2):e15 [FREE Full text] [doi: 10.2196/mental.5379] [Medline: 27146094]
12. Ben-Zeev D, Scherer EA, Wang R, Xie H, Campbell AT. Next-generation psychiatric assessment: using smartphone sensors
to monitor behavior and mental health. Psychiatr Rehabil J 2015 Sep;38(3):218-226 [FREE Full text] [doi:
10.1037/prj0000130] [Medline: 25844912]
13. Kluge A, Kirschner M, Hager OM, Bischof M, Habermeyer B, Seifritz E, et al. Combining actigraphy, ecological momentary
assessment and neuroimaging to study apathy in patients with schizophrenia. Schizophr Res 2018 May;195:176-182. [doi:
10.1016/j.schres.2017.09.034] [Medline: 29030262]
14. Buck B, Scherer E, Brian R, Wang R, Wang W, Campbell A, et al. Relationships between smartphone social behavior and
relapse in schizophrenia: a preliminary report. Schizophr Res 2019 Jun;208:167-172. [doi: 10.1016/j.schres.2019.03.014]
[Medline: 30940400]
15. Bradstreet S, Allan S, Gumley A. Adverse event monitoring in mHealth for psychosis interventions provides an important
opportunity for learning. J Ment Health 2019 Oct 26;28(5):461-466. [doi: 10.1080/09638237.2019.1630727] [Medline:
31240970]
16. Meyer N, Kerz M, Folarin A, Joyce DW, Jackson R, Karr C, et al. Capturing rest-activity profiles in schizophrenia using
wearable and mobile technologies: development, implementation, feasibility, and acceptability of a remote monitoring
platform. JMIR Mhealth Uhealth 2018 Oct 30;6(10):e188. [doi: 10.2196/mhealth.8292] [Medline: 30377146]
17. Ben-Zeev D, Brian R, Wang R, Wang W, Campbell AT, Aung MS, et al. CrossCheck: Integrating self-report, behavioral
sensing, and smartphone use to identify digital indicators of psychotic relapse. Psychiatr Rehabil J 2017 Sep;40(3):266-275.
[doi: 10.1037/prj0000243] [Medline: 28368138]
18. Kerz M, Folarin A, Meyer N, Begale M, MacCabe J, Dobson RJ. SleepSight: A wearables-based relapse prevention system
for schizophrenia. In: Proceedings of the 2016 ACM International Joint Conference on Pervasive and Ubiquitous Computing:
Adjunct. 2016 Presented at: UbiComp '16: The 2016 ACM International Joint Conference on Pervasive and Ubiquitous
Computing; September 12 - 16, 2016; Heidelberg Germany p. 113-116. [doi: 10.1145/2968219.2971419]
19. Lunsford-Avery JR, LeBourgeois MK, Gupta T, Mittal VA. Actigraphic-measured sleep disturbance predicts increased
positive symptoms in adolescents at ultra high-risk for psychosis: a longitudinal study. Schizophr Res 2015
May;164(1-3):15-20 [FREE Full text] [doi: 10.1016/j.schres.2015.03.013] [Medline: 25818627]
20. Kay SR, Fiszbein A, Opler LA. The positive and negative syndrome scale (PANSS) for schizophrenia. Schizophr Bull
1987;13(2):261-276. [doi: 10.1093/schbul/13.2.261] [Medline: 3616518]
21. Overall J, Gorham D. The Brief Psychiatric Rating Scale (BPRS): Recent developments in ascertainment and scaling.
Psychopharmacol Bull 1988;24(1):97-99 [FREE Full text] [doi: 10.1037/t01554-000]
22. Haro JM, Kamath SA, Ochoa S, Novick D, Rele K, Fargas A, SOHO Study Group. The Clinical Global
Impression-Schizophrenia scale: a simple instrument to measure the diversity of symptoms present in schizophrenia. Acta
Psychiatr Scand Suppl 2003(416):16-23. [doi: 10.1034/j.1600-0447.107.s416.5.x] [Medline: 12755850]
23. Müller MJ, Brening H, Gensch C, Klinga J, Kienzle B, Müller K. The Calgary Depression Rating Scale for schizophrenia
in a healthy control group: psychometric properties and reference values. J Affect Disord 2005 Sep;88(1):69-74. [doi:
10.1016/j.jad.2005.04.005] [Medline: 16040126]
24. Young RB, Ziegler V, Meyer D. Young Mania Rating Scale. In: Handbook of Psychiatric Measures. Washington, DC:
American Psychiatric Association; 2000:1-820.
25. Dipietro L, Caspersen CJ, Ostfeld AM, Nadel ER. A survey for assessing physical activity among older adults. Med Sci
Sports Exerc 1993 May;25(5):628-642. [Medline: 8492692]
26. Buysse DJ, Reynolds CF, Monk TH, Berman SR, Kupfer DJ. The Pittsburgh Sleep Quality Index: a new instrument for
psychiatric practice and research. Psychiatry Res 1989 May;28(2):193-213. [doi: 10.1016/0165-1781(89)90047-4] [Medline:
2748771]
https://mental.jmir.org/2021/8/e26234 JMIR Ment Health 2021 | vol. 8 | iss. 8 | e26234 | p. 18
(page number not for citation purposes)
XSL• FO
RenderXJMIR MENTAL HEALTH Lahti et al
27. Birchwood M, Smith J, Cochrane R, Wetton S, Copestake S. The Social Functioning Scale. The development and validation
of a new scale of social adjustment for use in family intervention programmes with schizophrenic patients. Br J Psychiatry
1990 Dec 02;157(6):853-859. [doi: 10.1192/bjp.157.6.853] [Medline: 2289094]
28. Actiwatch spectrum. Philips. URL: https://www.usa.philips.com/healthcare/product/HC1046964/
actiwatch-spectrum-activity-monitor [accessed 2020-10-06]
29. Zou H, Hastie T. Regularization and variable selection via the elastic net. J Royal Statistical Soc B 2005 Apr;67(2):301-320.
[doi: 10.1111/j.1467-9868.2005.00503.x]
30. Nuij C, van Ballegooijen W, Ruwaard J, de Beurs D, Mokkenstorm J, van Duijn E, et al. Smartphone-based safety planning
and self-monitoring for suicidal patients: rationale and study protocol of the CASPAR (Continuous Assessment for Suicide
Prevention And Research) study. Internet Interv 2018 Sep;13:16-23 [FREE Full text] [doi: 10.1016/j.invent.2018.04.005]
[Medline: 30206514]
31. Faurholt-Jepsen M, Bauer M, Kessing LV. Smartphone-based objective monitoring in bipolar disorder: status and
considerations. Int J Bipolar Disord 2018 Jan 23;6(1):6 [FREE Full text] [doi: 10.1186/s40345-017-0110-8] [Medline:
29359252]
32. Biagianti B, Hidalgo-Mazzei D, Meyer N. Developing digital interventions for people living with serious mental illness:
perspectives from three mHealth studies. Evid Based Ment Health 2017 Nov;20(4):98-101 [FREE Full text] [doi:
10.1136/eb-2017-102765] [Medline: 29025862]
33. Aledavood T, Torous J, Triana Hoyos AM, Naslund JA, Onnela J, Keshavan M. Smartphone-Based Tracking of Sleep in
Depression, Anxiety, and Psychotic Disorders. Curr Psychiatry Rep 2019 Jun 04;21(7):49 [FREE Full text] [doi:
10.1007/s11920-019-1043-y] [Medline: 31161412]
34. Reeve S, Sheaves B, Freeman D. The role of sleep dysfunction in the occurrence of delusions and hallucinations: a systematic
review. Clin Psychol Rev 2015 Dec;42:96-115 [FREE Full text] [doi: 10.1016/j.cpr.2015.09.001] [Medline: 26407540]
35. Kaskie R, Graziano B, Ferrarelli F. Schizophrenia and sleep disorders: links, risks, and management challenges. Nat Sci
Sleep 2017 Sep;Volume 9:227-239. [doi: 10.2147/nss.s121076]
36. Birchwood M, Spencer E, McGovern D. Schizophrenia: early warning signs. Adv Psychiatr Treat 2018 Jan 02;6(2):93-101.
[doi: 10.1192/apt.6.2.93]
37. Lindamer LA, McKibbin C, Norman GJ, Jordan L, Harrison K, Abeyesinhe S, et al. Assessment of physical activity in
middle-aged and older adults with schizophrenia. Schizophr Res 2008 Sep;104(1-3):294-301 [FREE Full text] [doi:
10.1016/j.schres.2008.04.040] [Medline: 18550338]
Abbreviations
BPRS: Brief Psychiatric Rating Scale
CDS: Calgary Depression Scale
CGI-SCH: Clinical Global Impression-Schizophrenia
DSM-5: Diagnostic and Statistical Manual of Mental Disorders, Fifth Edition
ICC: intraclass correlation coefficient
PANSS: Positive and Negative Syndrome Scale
PRO: patient-reported outcome
PSQI: Pittsburgh Sleep Quality Index
REDCap: Research Electronic Data Capture
UAB: University of Alabama, Birmingham
YPAS: Yale Physical Activity Survey
Edited by J Torous; submitted 10.12.20; peer-reviewed by B Buck, N Meyer; comments to author 21.01.21; revised version received
22.04.21; accepted 10.05.21; published 09.08.21
Please cite as:
Lahti AC, Wang D, Pei H, Baker S, Narayan VA
Clinical Utility of Wearable Sensors and Patient-Reported Surveys in Patients With Schizophrenia: Noninterventional, Observational
Study
JMIR Ment Health 2021;8(8):e26234
URL: https://mental.jmir.org/2021/8/e26234
doi: 10.2196/26234
PMID:
https://mental.jmir.org/2021/8/e26234 JMIR Ment Health 2021 | vol. 8 | iss. 8 | e26234 | p. 19
(page number not for citation purposes)
XSL• FO
RenderXJMIR MENTAL HEALTH Lahti et al
©Adrienne C Lahti, Dai Wang, Huiling Pei, Susan Baker, Vaibhav A Narayan. Originally published in JMIR Mental Health
(https://mental.jmir.org), 09.08.2021. This is an open-access article distributed under the terms of the Creative Commons Attribution
License (https://creativecommons.org/licenses/by/4.0/), which permits unrestricted use, distribution, and reproduction in any
medium, provided the original work, first published in JMIR Mental Health, is properly cited. The complete bibliographic
information, a link to the original publication on https://mental.jmir.org/, as well as this copyright and license information must
be included.
https://mental.jmir.org/2021/8/e26234 JMIR Ment Health 2021 | vol. 8 | iss. 8 | e26234 | p. 20
(page number not for citation purposes)
XSL• FO
RenderXYou can also read