Digital oximetry biomarkers for assessing respiratory function: standards of measurement, physiological interpretation, and clinical use - Nature
←
→
Page content transcription
If your browser does not render page correctly, please read the page content below
www.nature.com/npjdigitalmed

                  ARTICLE                   OPEN

                  Digital oximetry biomarkers for assessing respiratory function:
                  standards of measurement, physiological interpretation, and
                  clinical use
                  Jeremy Levy 1,2, Daniel Álvarez                3,4,5
                                                                         , Aviv A. Rosenberg        6
                                                                                                        , Alexandra Alexandrovich1, Félix del Campo                   3,4,5
                                                                                                                                                                              and
                  Joachim A. Behar 1 ✉

                      Pulse oximetry is routinely used to non-invasively monitor oxygen saturation levels. A low oxygen level in the blood means low
                      oxygen in the tissues, which can ultimately lead to organ failure. Yet, contrary to heart rate variability measures, a field which has
                      seen the development of stable standards and advanced toolboxes and software, no such standards and open tools exist for
                      continuous oxygen saturation time series variability analysis. The primary objective of this research was to identify, implement and
                      validate key digital oximetry biomarkers (OBMs) for the purpose of creating a standard and associated reference toolbox for
                      continuous oximetry time series analysis. We review the sleep medicine literature to identify clinically relevant OBMs. We
                      implement these biomarkers and demonstrate their clinical value within the context of obstructive sleep apnea (OSA) diagnosis on
                      a total of n = 3806 individual polysomnography recordings totaling 26,686 h of continuous data. A total of 44 digital oximetry
1234567890():,;

                      biomarkers were implemented. Reference ranges for each biomarker are provided for individuals with mild, moderate, and severe
                      OSA and for non-OSA recordings. Linear regression analysis between biomarkers and the apnea hypopnea index (AHI) showed a
                                                         2
                      high correlation, which reached R ¼ 0:82. The resulting python OBM toolbox, denoted “pobm”, was contributed to the open
                      software PhysioZoo (physiozoo.org). Studying the variability of the continuous oxygen saturation time series using pbom may
                      provide information on the underlying physiological control systems and enhance our understanding of the manifestations and
                      etiology of diseases, with emphasis on respiratory diseases.
                      npj Digital Medicine (2021)4:1 ; https://doi.org/10.1038/s41746-020-00373-5

                  INTRODUCTION                                                                                  benefited from the development of stable standards3 and
                  Pulse oximetry is routinely used for non-invasive monitoring of                               advanced toolboxes and software4–6, there are currently no such
                  oxygen saturation levels. A low oxygen level in the blood means                               standards and open tools for analyzing oxygen saturation time
                  low oxygen in the tissues, which can ultimately lead to organ                                 series in terms of its variability, dynamics, and the statistical
                  failure. Oximetry can be used to sporadically measure the oxygen                              characterization of specific patterns.
                  saturation level during a medical examination or continuously
                  monitor patients in the intensive care unit (ICU) or overnight for a                          This contribution
                  polysomnography (PSG) study. Identification of digital biomarkers                              Research on the use of existing and development of new oximetry
                  extrapolated from the oxygen saturation time series can support                               biomarkers has mainly focused on the diagnosis of OSA, as
                  the diagnosis and continuous monitoring of patient pulmonary                                  echoed by five recent reviews in this field7–11. Although this paper
                  function to predict deteriorations (prognosis). Specifically, study-                           will naturally somewhat overlap with these reviews, we present a
                  ing the variability of the oxygen saturation signal may provide                               new comprehensive review focusing on the physiological inter-
                  information on the underlying physiological control systems.                                  pretation and clinical use of oximetry biomarkers, in the spirit of
                  Furthermore, it may enhance our understanding of the manifesta-                               the work of Malik et al.3 in the field of HRV analysis. We also
                  tion and etiology of diseases and identify digital oximetry                                   develop a complete Python toolbox (denoted “pobm”) and
                  biomarkers (OBMs) for the purpose of health monitoring. Sleep                                 software interface (“PhysioZoo OBM”) for usage of these
                  medicine makes standard usage of oximetry biomarkers, where                                   biomarkers, similar to our previous work in HRV analysis6. This
                  overnight drops in oxygen saturation are characteristic of                                    will support rigorous research in oximetry time series analysis and
                  obstructive sleep apnea (OSA). Beyond the presence of OSA, the                                ensure reproducibility of research. We apply the developed
                  repetitive nocturnal hypoxemia may cause oxidative stress,                                    toolbox to a large dataset of overnight recordings in order to
                  contributing to the pathogenesis of cardiovascular morbidity1.                                demonstrate its usability and clinical value in the context of OSA
                  Similarly, patients with advanced chronic obstructive pulmonary                               diagnosis. While the work mainly focuses on OBM developed in
                  disease (COPD), and with no primary sleep-related breathing                                   the field of sleep medicine, the reviewed OBMs can be applied to
                  disorders, commonly exhibit overnight hypoxemia2. Yet, contrary                               the analysis of continuous oximetry recordings for any other
                  to heart rate variability (HRV) measures, a field which has                                    condition and we thus introduce a general purpose flow diagram

                  1
                   Faculty of Biomedical Engineering, Technion Institute of Technology, Haifa, Israel. 2Faculty of Electrical Engineering, Technion Institute of Technology, Haifa, Israel. 3Río Hortega
                  University Hospital Valladolid, Valladolid, Spain. 4Biomedical Engineering Group, University of Valladolid, Valladolid, Spain. 5Centro de Investigación Biomédica en Red en
                  Bioingeniería, Biomateriales y Nanomedicina (CIBER-BBN), Valladolid, Spain. 6Department of Computer Science, Technion Institute of Technology, Haifa, Israel.
                  ✉email: jbehar@technion.ac.il

                  Seoul National University Bundang Hospital
J. Levy et al.
2
for continuous oximetry analysis. We limit the scope of the statistically discriminative between every pair of classes, i.e., p <
biomarkers to single-channel oximetry analysis, thereby implicitly 0.05 for all pairs (Tables 1 and 2).
excluding OBMs that may require additional channels, such as
airflow, to be engineered12. The paper defines categories of OBMs Added value in combining multiple biomarkers
and a review of the literature to identify evidence-based OBMs in
When performing simple regression analysis for individual OBM
the field of sleep medicine as well as some additional suggested
OBMs. The biomarkers are applied to a large PSG dataset totaling against the AHI, CTMρ with ρ = 0.25 achieved the highest
2 2
3806 individual oximetry recordings. goodness of fit (R ¼ 0:77) followed by the ODI3 (R ¼ 0:74).
When combining the 10 oximetry biomarkers with the best score
within a multivariable linear regression framework, the goodness
RESULTS 2
of fit was further improved to R ¼ 0:82 (Fig. 2).
pobm toolbox and PhysioZoo OBM interface
The pobm toolbox was implemented in Python. For the purpose
of quality control, functions were benchmarked against compara- DISCUSSION
tive reference source code (Supplementary Table 1) or ranges We showed that OBMs engineered from continuous oximetry
published in the literature (Supplementary Table 2). For the recordings may provide discriminative information of groups of
comparison to range reported in the literature, we compared the individuals suffering from respiratory disorders. Within the context
order of magnitude of some biomarkers with those reported by of OSA, we found that CTMρ with ρ = 0.25 had the highest R in
2
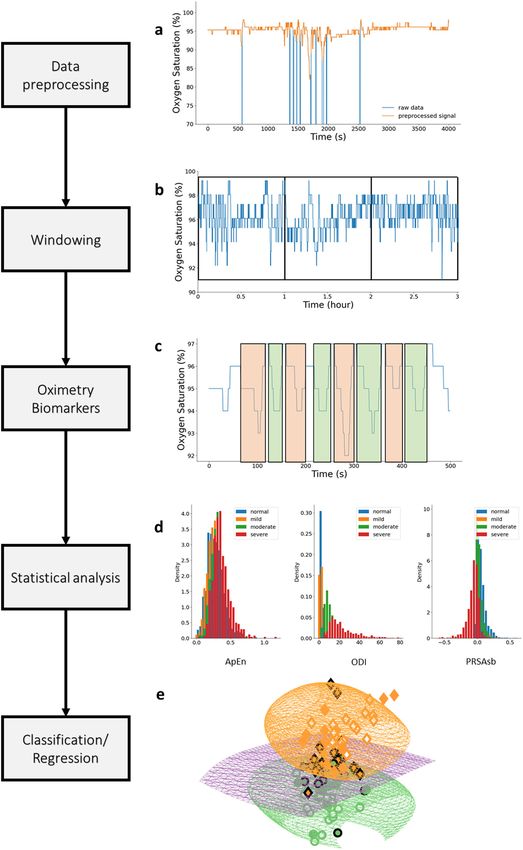
other for the non-OSA group. Figure 1 shows the PhysioZoo OBM 2
interface for oximetry analysis. In PhysioZoo OBM, a SpO2 time estimating the AHI, with R ¼ 0:77. Furthermore, we demon-
series can be loaded (File → Open data file) and pre-filtered using strated that combining multiple oximetry biomarkers for estimat-
2
one of the preprocessing filters introduced in section “Preproces- ing the AHI increased the R to 0.82. This highlights the
sing”. After computation, OBM can be exported together with complementary value in using multiple OBMs versus a single one.
standard data representation figures. The PhysioZoo software Recent studies have shown that nocturnal hypoxemia correlates
handles data in .txt, .mat (The MathWorks, Inc., Natick, MA, USA) better with cardiovascular disease, cancer incidence, and mortality
1234567890():,;
and WFDB13 formats. In addition, the PhysioZoo OBM enables than traditional nocturnal respiratory disturbance indexes, such as
oximetry analysis of multiple segments, thereby enabling tracking the AHI12,14. This suggests that alternative nocturnal OBMs may
of temporal changes in oximetry measures for a given record. The provide important health information. Both intermittent hypoxia
pobm toolbox and PhysioZoo software are available at https:// and sleep fragmentation are responsible for clinical manifestations
physiozoo.com/. and most related comorbidities of OSA15. In OSA, recurrent
collapse of the upper airway leads to a reduced tidal volume and
Standard ranges for oximetry biomarkers both intermittent hypoxemia and hypercapnia. In consequence,
Tables 1 and 2 summarize the median and interquartile range for activity of the sympathetic nervous system increases and cortical
all the OBMs implemented in the PhysioZoo software for arousals occur, leading to disrupted sleep architecture and restless
individuals participating in SHHS1. This provides a standard sleep. In addition, repetitive hypoxemia–reoxygenation periods
reference range for each oximetry biomarker. The null hypothesis are linked to the production of free oxygen radicals, inflammation,
of Kruskal–Wallis test was rejected for most biomarkers (43/44) and endothelial dysfunction16. In this regard, OBMs, such as CT90
with the smallest p value obtained for Px, CAx, and CTx. Following and overnight mean and minimum saturation, have been
the Dunn post hoc analysis, a total of 30 biomarkers were significantly linked with dysfunction in cardiovascular modulation,
Fig. 1 PhysioZoo OBM interface for oximetry time series analysis. The analysis of an oximetry time series is shown. All the OBM biomarkers
are computed for the selected window (in light green).
npj Digital Medicine (2021) 1 Seoul National University Bundang Hospital
J. Levy et al.
                                                                                                                                                          3
 Table 1. Summary statistics (median and interquartiles Q1–Q3) for the General statistics, Complexity and Periodicity OBMs evaluated on the SHHS1
 database.

Biomarker       Non-OSA (n = 1195)            Mild (n = 1303)                Moderate (n = 833)             Severe (n = 475)               Kruskal test

General statistics
 AV                  95.90 (94.77–96.93)         95.14 (94.01–96.09)            94.43 (93.36–95.41)            93.51 (92.23–94.67)         p < 0.001‡
 MED                 96.00 (95.00–97.00)         95.00 (94.00–96.00)            95.00 (93.00–96.00)            94.00 (93.00–95.00)         p < 0.001‡
 Min                 79.00 (72.00–85.00)         79.00 (74.00–84.00)            79.00 (73.00–83.00)            76.00 (70.00–81.00)         p < 0.001
 SD                   1.42 (1.08–1.90)            1.55 (1.29–1.90)               1.81 (1.50–2.19)               2.33 (1.88–3.04)           p < 0.001‡
 RG                  20.00 (14.00–27.00)         19.00 (14.00–25.00)            20.00 (15.00–26.00)            22.00 (18.00–29.00)         p < 0.001
 Pxx                 91.00 (88.00–93.00)         90.00 (88.00–92.00)            89.00 (86.00–90.12)            85.00 (81.00–88.00)         p < 0.001‡
 Mx                   2.14 (1.18–3.82)            3.44 (1.94–5.51)               5.84 (3.49–8.96)              10.98 (6.78–17.00)          p < 0.001‡
 ZCxx            435.00 (346.00–540.00)         481.00 (391.00–579.00)         557.00 (463.50–638.00)        690.00 (592.00–812.50)        p < 0.001‡
 ΔI                   0.36 (0.30–0.42)            0.47 (0.41–0.54)               0.66 (0.57–0.76)               1.03 (0.86–1.44)           p < 0.001‡
Complexity
 ApEn                 0.17 (0.13–0.20)            0.21 (0.17–0.26)               0.28 (0.23–0.34)               0.39 (0.31–0.48)           p < 0.001‡
 LZ             2389.00 (2241.00–2511.00)     2435.00 (2314.00–2547.00)      2492.00 (2374.50–2587.50)      2587.00 (2483.50–2698.00)      p < 0.001‡
 CTMx                 0.92 (0.90–0.93)            0.89 (0.88–0.91)               0.86 (0.84–0.87)               0.79 (0.73–0.82)           p < 0.001‡
 SampEn               0.06 (0.04–0.08)            0.08 (0.06–0.11)               0.12 (0.09–0.15)               0.21 (0.14–0.31)           p < 0.001‡
 DFA                  1.14 (0.99–1.37)            1.35 (1.18–1.54)               1.70 (1.49–1.98)               2.47 (2.05–3.24)           p < 0.001‡
Periodicity
 PRSADc               0.56 (0.53–0.60)            0.56 (0.54–0.59)               0.59 (0.56–0.63)               0.67 (0.61–0.78)           p < 0.001‡
 PRSADad              1.55 (1.34–1.89)            1.83 (1.58–2.16)               2.42 (2.01–2.97)               3.68 (2.86–4.94)           p < 0.001
 PRSADos              0.11 (0.09–0.13)            0.13 (0.11–0.15)               0.17 (0.14–0.20)               0.25 (0.20–0.33)           p < 0.001‡
 PRSADsb              0.01 (0.00–0.03)            0.03 (0.02–0.05)               0.07 (0.05–0.10)               0.14 (0.09–0.21)           p < 0.001‡
 PRSADsa              0.02 (0.01–0.04)            0.04 (0.03–0.06)               0.08 (0.05–0.11)               0.14 (0.09–0.20)           p < 0.001
 AC(x104)            18.20 (17.83–18.54)         17.97 (17.58–18.29)            17.69 (17.30–18.04)            17.33 (16.90–17.79)         p < 0.001
 PSD_total           91.49 (89.48–93.71)         94.65 (92.36–97.49)            99.81 (96.76–103.93)         109.27 (103.81–118.61)        p < 0.001‡
 PSD_band             3.22 (2.78–3.91)            4.28 (3.66–5.06)               6.18 (5.18–7.39)               9.46 (7.60–13.42)          p < 0.001‡
 PSD_ratio            0.04 (0.03–0.04)            0.05 (0.04–0.05)               0.06 (0.05–0.07)               0.09 (0.07–0.11)           p < 0.001‡
 PSD_peak             0.02 (0.02–0.02)            0.03 (0.02–0.03)               0.04 (0.03–0.05)               0.06 (0.05–0.10)           p < 0.001‡
 The symbol ‡ indicate when the result of the Dunn post hoc test between all pairs of groups was p < 0.05. Results presented for the categories general
 statistics, complexity, and periodicity.

arterial hypertension, atrial fibrillation, increased insulin resistance,      hypoxia pattern. On the other hand, COPD patients show slower
higher incidence of lung cancer, and worst prognosis after                    and longer desaturations linked with sustained hypoventilation,
myocardial infarction, as well as higher risk of post-surgery                 mainly during rapid eye movement (REM) sleep, leading to a state
complications in OSA patients17. However, it remains very unclear             of nocturnal chronic hypoxemia. Characterization of hypoxemia is
which oximetric biomarkers (or combinations of biomarkers) are                therefore different during REM sleep. In subjects with OSA, oxygen
most predictive of clinical endpoints, such as metabolic and                  desaturation indices (ODIs) of 3 and 4%, as well as mean,
cardiovascular diseases. For example, the average duration and                minimum, and CT90, are widely used in sleep medicine. On the
morphology of the events are not considered in routine OSA                    contrary, criteria for classifying a COPD patient as a nocturnal
diagnosis. This is limiting, since longer apnea or hypopnea events            desaturator are not well established. Showing at least one episode
will likely result in increased desaturation (in length and depth),           with saturation 5 min and reaching a minimum
which will likely result in more hypoxic stress, leading to more              saturation of at least 85% has been proposed19, while some
severe cardiovascular consequences. At the same time, longer                  authors define nocturnal desaturators as patients with
desaturation events may result in a decrease in AHI, that is, a lower         CT90 ≥30%20. This example highlights that a standard to
number of events per hour. Thus the relationship between duration             characterize and quantify some respiratory conditions, such as
and morphology of events and a clinical endpoint (e.g., cardiovas-            COPD, using nocturnal oximetry, remain to be defined. Usage of
cular complication) remains unclear. For this reason, additional              multiple OBM may also enable to identify patterns for different
desaturation biomarkers may provide valuable information on                   apnea types such as central apnea versus mixed apnea versus
disease phenotyping. This has been suggested, for example, in the             obstructive apnea as ongoing research studies such as the
work of Kulkas et al.18, who showed, albeit on a very small                   SomnaPatch intend (Somnarus Inc., ClinicalTrials.gov Identifier:
population sample (n = 19), that additional oximetry biomarkers, i.e.,        NCT02034175). Machine learning algorithms will play an impor-
duration and morphology related, enhance OSA phenotyping.                     tant role in engineering models that can learn complex
   Nocturnal hypoxemia can be present in many respiratory                     combinations of OBM for the purpose of regression or classifica-
diseases that are either acute or chronic. For example, OSA                   tion tasks. Such models will uncover the OBM combinations that
patients show cyclic desaturation–resaturation episodes during                best reflect the unique patterns of a given condition.
the night, which are linked with partial or complete obstruction of              Because respiratory conditions may possess different oximetry
the upper airway, leading to the well-known chronic intermittent              patterns/dynamics and oximetry recordings may be of different

Seoul National University Bundang Hospital                                                                           npj Digital Medicine (2021) 1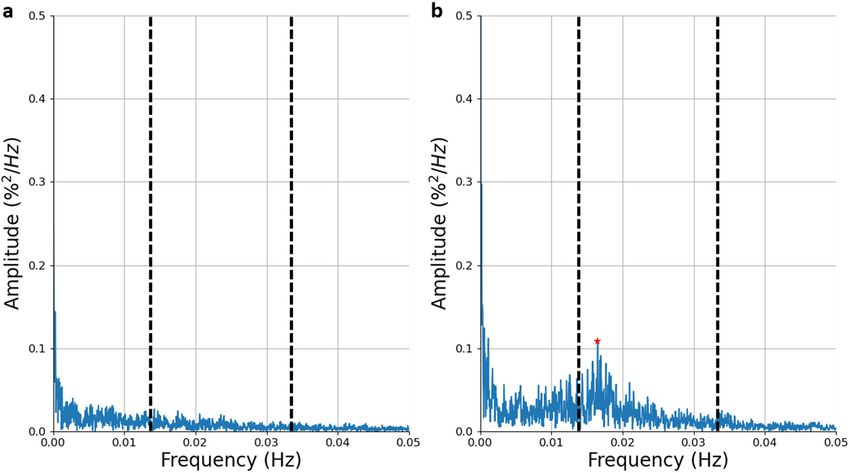
J. Levy et al.
4
     Table 2.   Summary statistics (median and interquartiles Q1–Q3) for the Desaturations and Hypoxic Burden OBMs evaluated on the SHHS1 database.

    Biomarker        Non-OSA (n = 1195)               Mild (n = 1303)                  Moderate (n = 833)              Severe (n = 475)              Kruskal test

    Desaturations
    DLμ                39.44 (34.38 to 45.23)           41.95 (37.00 to 47.31)          42.10 (37.24 to 46.98)          38.04 (33.30 to 43.11)       p < 0.001
    DLσ                23.04 (18.65 to 26.82)           22.94 (19.62 to 26.16)          21.68 (18.69 to 24.36)          18.10 (15.10 to 21.04)       p < 0.001
    DLσ                 4.93 (4.11 to 6.06)              4.60 (4.12 to 5.27)             4.53 (4.13 to 5.16)             5.00 (4.39 to 6.02)         p < 0.001‡
    DDmaxσ              2.63 (1.43 to 3.97)              2.24 (1.48 to 3.26)             2.20 (1.57 to 2.95)             2.48 (1.84 to 3.34)         p < 0.001
    DD100μ              9.47 (8.20 to 10.91)             9.38 (8.42 to 10.50)            9.57 (8.54 to 10.63)           10.28 (8.98 to 11.88)        p < 0.001
    DD100σ              3.24 (1.85 to 5.06)              2.78 (1.90 to 4.03)             2.60 (1.95 to 3.58)             2.74 (2.11 to 3.84)         p < 0.001
    DSμ                −0.22 (−0.26 to 0.18)           −0.19 (−0.23 to 0.16)            −0.18 (−0.21 to 0.16)          −0.20 (−0.25 to 0.17)         p < 0.001‡
    DSσ                 0.14 (0.11 to 0.19)             0.13 (0.10 to 0.16)              0.11 (0.09 to 0.14)            0.11 (0.09 to 0.14)          p < 0.001‡
    DAmaxμ            104.74 (80.48 to 137.64)        104.55 (87.47 to 126.95)         108.16 (90.44 to 130.04)        115.22 (96.08 to 144.56)      p < 0.001
    DAmaxσ             87.52 (53.67 to 144.54)         82.72 (58.97 to 122.55)          85.36 (64.67 to 117.12)         94.62 (70.51 to 127.90)      p < 0.001
    DA100μ            280.75 (223.36 to 352.90)       304.38 (251.74 to 362.10)        315.47 (258.35 to 377.54)       313.76 (262.60 to 380.12)     p < 0.001
    DA100σ            169.66 (120.29 to 262.66)       175.29 (133.78 to 233.17)        177.53 (134.72 to 222.65)       175.48 (135.08 to 225.74)     p > 0.05
    TDμ              1760.82 (1122.78 to 2804.90)     940.56 (673.65 to 1373.38)       429.00 (321.28 to 617.51)       181.61 (117.70 to 268.42)     p < 0.001‡
    TDσ              2365.50 (1660.51 to 3388.55)     1457.2 (1092.66 to 2014.68)      812.64 (635.57 to 1066.14)      375.70 (222.57 to 544.07)     p < 0.001
    Hypoxic burden
    PODx                1.72 (1.69 to 01.76)            10.20 (9.60 to 11.00)           18.23 (18.11 to 18.79)          31.10 (30.02 to 33.65)       p < 0.001‡
    AODmax              0.06 (0.03 to 0.10)              0.11 (0.07 to 0.16)             0.24 (0.16 to 0.36)             0.61 (0.37 to 1.05)         p < 0.001‡
    AOD100              0.15 (0.09 to 0.26)              0.31 (0.20 to 0.47)             0.70 (0.46 to 1.00)             1.65 (1.04 to 2.77)         p < 0.001‡
    CTx                 0.51 (0.15 to 1.34)              0.76 (0.30 to 1.69)             1.42 (0.58 to 3.29)             4.48 (1.68 to 11.58)        p < 0.001‡
    CAx                 0.45 (0.13 to 1.10)              0.64 (0.25 to 1.42)             1.21 (0.51 to 2.79)             3.84 (1.42 to 9.86)         p < 0.001‡

     The symbol ‡ indicate when the result of the Dunn post hoc test between all pairs of groups was p < 0.05. Results presented for the categories desaturation
     measures and hypoxic burden.

                                                                                     includes a processor that calculates the oxygen saturation using
                                                                                     the ratio between the amount of light that was emitted and the
                                                                                     amount that was received at each wavelength. Oximeters may be
                                                                                     transmissive or reflective. In a transmissive oximeter, the photo-
                                                                                     diode and the LEDs are placed on opposite sides of the
                                                                                     measurement site and the light passes through the site. In a
                                                                                     reflective oximeter, the LEDs are placed on the same side and the
                                                                                     light is reflected to the photodiode across the measurement site.
                                                                                        During the current coronavirus disease 2019 (COVID-19)
                                                                                     pandemic, many individuals with suspected or confirmed, but
                                                                                     mild, COVID-19 are told to monitor their symptoms at home or
                                                                                     from government-managed locations. Hospitalization is only an
                                                                                     option if there is a medical need. Monitoring the blood oxygen
                                                                                     level may be a meaningful way to remotely monitor individuals
                                                                                     with mild COVID-1921. It could also be used for continuous
                                                                                     monitoring of patients in the ICU with pneumonia, a common
                                                                                     complication of COVID-19. However, there is a lack of smart
                                                                                     algorithms that can exploit the information encrypted within
                                                                                     these oxygen saturation physiological time series. The develop-
                                                                                     ment of such algorithms will facilitate the continuous monitoring
    Fig. 2 Linear correlation between oximetry biomarkers and the
                       2                                                             of COVID-19 ICU patients in predicting deteriorations. It remains to
    AHI. The adjusted R is reported for every biomarker and for the 10               be determined how the information contained in the oxygen
                                  2
    biomarkers with the highest R .                                                  saturation physiological time series can be exploited. Are trends or
                                                                                     absolute values or the occurrence of specific patterns the most
    durations, it is important to define a general methodology for                    meaningful information for identification of the disease and
    continuous oximetry time series analysis using the OBM toolbox. The              prediction of its course? The pobm toolbox developed in this
    suggested flow for such analysis is illustrated in Fig. 3. Following              publication can support researching novel biomarkers for
    these steps, performance statistics relevant to the task at hand                 diagnosis and prognosis of COVID-19.
    should be reported and a clear discussion should be delivered                       Additional OBMs, such as kernel entropy, bispectrum, and
    regarding the biomarkers that were most relevant to the data-driven              wavelet, among others, should be considered and added to the
    model including interpretation about the underlying physiology.                  library in future works. Although we demonstrated the usage of
       Oximetry biomarkers may vary significantly with the technology                 the PhysioZoo OBM resource on OSA, there is a need to assess the
    used (transmission versus reflectance) as well as by the                          value of these biomarkers for other respiratory disorders.
    manufacturer. Most oximeters use two light-emitting diodes                          Typical oximetry biomarkers used in clinical practice include the
    (LED) that face a translucent part of the body, such as the                      ODI and CT90. While these indices are standardized, to some extent,
    fingertip or earlobe, and a photodiode that receives light rays. In               and interpretable, they fail to capture important pathophysiological
    most cases, one LED is red and the second infrared. The oximeter                 characteristics. We reviewed evidence-based oximetry biomarkers,

    npj Digital Medicine (2021) 1                                                                                   Seoul National University Bundang Hospital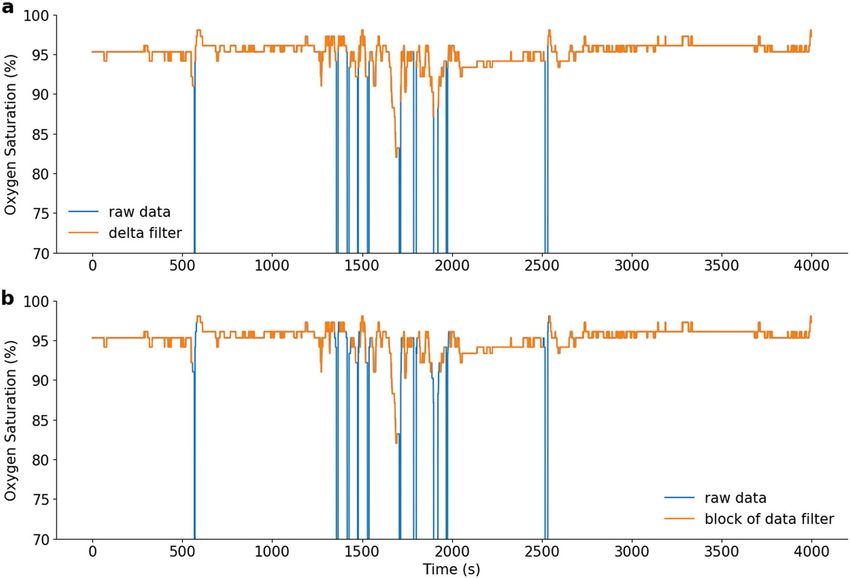
J. Levy et al.
                                                                                                                                                 5

Fig. 3 Flowchart for continuous oximetry time series analysis. a The raw data are first preprocessed using some of the routines presented in
section “Preprocessing”, to remove any non-physiological values that are likely caused by noise. b The recording is then windowed. The size of
the analysis windows and whether to consider overlapping windowing is an important consideration and will be research dependent.
c Oximetry biomarkers are then computed using the OBM toolbox. d A statistical analysis is performed to obtain a preliminary understanding
of the biomarker behavior for the different classes of interest. e Finally, a machine learning model can be used to combine the biomarkers for
a regression or classification task.

Seoul National University Bundang Hospital                                                                   npj Digital Medicine (2021) 1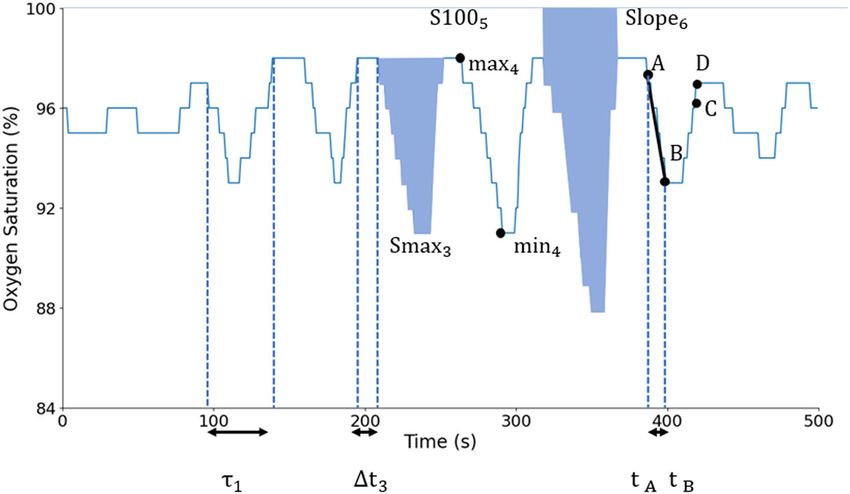
J. Levy et al.
6
    suggested a classification system, and created a unique resource                    Preprocessing
    (pobm toolbox and PhysioZoo OBM interface) for performing                          Raw oximetry data is often associated with missing values and artefacts
    oximetry time series analysis. This resource can be applied to gain                caused, for example, by motion of the oximeter or lack of proper contact
    novel physiological, clinical, and epidemiological insights.                       between the finger and the probe. Therefore, the toolbox includes an
                                                                                       option for two preprocessing filters:

    METHODS                                                                            Delta filter. A delta filter is applied to the SpO2 time series, in which, when
    Oximetry biomarker categorization                                                  two consecutive samples are >x%/s apart, they are considered non-
                                                                                       physiological and are discarded. By default, x = 4%/s apart as in the work
    Various categorizations of OBMs have been previously suggested10,22. We            of Taha et al.23. As an example, applying the delta filter to the SpO2 time
    introduce a five-category classification scheme of our own, which we                 series is shown in Fig. 4a.
    believe best reflects the literature and usage of these biomarkers in medical
    practice.
                                                                                       Block of data filter. An error value is considered a value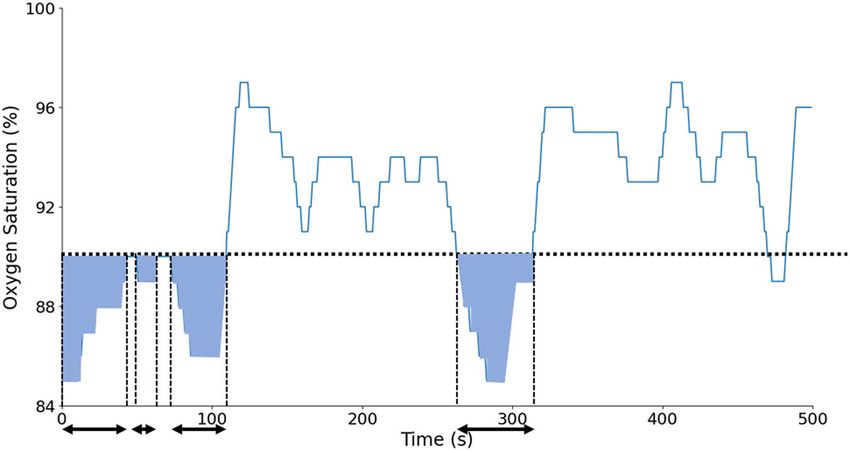
J. Levy et al.
                                                                                                                                                                             7
 Table 4.         List of digital oximetry biomarkers for the categories: desaturation measures and hypoxic burden.

     Biomarker Definition                                                                                                                                      Unit

Desaturation measures
25 ODIx                    The oxygen desaturation index as defined in Jung et al. and Behar et al.50,51, by default x = 3                                     event/h
26 DLμ                     Mean of desaturations length (e.g., related work in Kulkas et al.47)                                                               s
27 DLσ                     Standard deviation of desaturations length (e.g., related work in Kulkas et al.47)                                                 s2
                                                                                            47
28 DDmaxμ                  Mean of desaturations depth (e.g., related work in Kulkas et al. )                                                                 %
29 DDmaxσ                  Standard deviation of desaturation depth (e.g. related work in Kulkas et al.47)                                                    %2
30 DD100μ                  Mean of desaturations depth using 100% SpO2 level as baseline (e.g., related work in Terrill et al.10)                             %
31 DD100σ                  Standard deviation of desaturations depth using 100% SpO2 level as baseline (e.g., related work in Terrill et al.10)               %2
32 DSμ                     Mean of the desaturation slope                                                                                                     %/s
33 DSσ                     Standard deviation of the desaturation slope                                                                                       (%/s)2
34 DAmaxμ                  Desaturation area defined as the mean of the desaturation areas using the maximum SpO2 value in each desaturation event %*s
                           as baseline47
35 DAmaxσ                  Standard deviation of desaturation area47                                                                                          (%*s)2
                                                                                                                       47
36 DA100μ                  Desaturation area: mean of desaturation area under the 100% SpO2 level as baseline                                                 %*s
37 DA100σ                  Standard deviation of desaturation area under the 100% SpO2 level as baseline47                                                    (%*s)2
38 TDμ                     Mean of time between two consecutive desaturation events                                                                           sec
39 TDσ                     Standard deviation of time between two consecutive desaturation events                                                             s2
Hypoxic burden
40 PODx                    Time of oxygen desaturation event, normalized by the total recording time18, by default x = 3                                      s
41 AODmax                  The area under the oxygen desaturation event curve18, using the maximum SpO2 value as baseline and normalized by the %
                           total recording time
42 AOD100                  Cumulative area of desaturations under the 100% SpO2 level as baseline and normalized by the total recording time                  %
43 CTx                     Cumulative time below the x% oxygen saturation level, by default x = 90. Introduced by Olson et al.55                              %
44 CAx                     Integral of SpO2 below the x SpO2 level normalized by the total recording time, by default x = AV                                  %

ZeroCrossing (ZCx). ZeroCrossing (ZCx) is the number of zero-crossing                    window i of length x s, and Nwindow is the number of windows. In their original
points, used by Xie et al.25, using the x% SpO2 level as baseline. A crossing            work, Pepin et al.26 used x = 12 s. In our implementation, signals are re-
point is considered as two consecutive samples of the SpO2 signal, one                   sampled to 1 Hz by default, so, by default, a window will contain 12 samples.
lower than the baseline and the second greater, or vice versa. This
biomarker helps to understand how the signal oscillates around a baseline.
The intuition is that a SpO2 time series from a patient with OSA as                      Complexity measures
compared to that of a non-OSA patient will oscillate more around the                     Regularity quantifies how often similar patterns are observed in the
baseline because of the presence of desaturations and then reach a higher                oximetry signal10. In the context of physiological time series analysis,
value. A common baseline used for this biomarker is the mean of the signal               approximate entropy (ApEn)28 and sample entropy (SampEn)29 have
(i.e., by default, x = AV). ZCx is defined as:                                            commonly been used as measures of the unpredictability (opposite of
                                                                                         regularity). OSA individuals typically have less regular oximetry patterns,
        NSpO2 1
            X                                                                            leading to higher ApEn and SampEn values as compared to non-OSA
ZCx ¼               ZCi ð x Þ;                                                   (1)     individuals. Loss of physiological complexity may be better captured by
            i¼10
                                                                                         using other measures that can detect and quantify the presence of long-
                                                                                        range correlations in non-stationary time series30 with measures such as
                   1 if ðSpO2i  x ÞðSpO2iþ1  x Þ< 0
ZCi ð x Þ ¼                                               ;                      (2)     the Lempel–Ziv complexity (LZ)31. Fractal objects, generated by stochastic
                   0 else                                                                or nonlinear deterministic mechanisms30, may also be used to capture
where NSpO2 is the number of samples of the SpO2 time series.                            complexity, as they show self-similarity, i.e., the smaller-scale structure
                                                                                         resembles the larger-scale form32. Detrended fluctuation analysis (DFA) has
Delta index (ΔIx). ΔIx26 corresponds to the sum of the absolute variations               commonly been used for fractal analysis in the field of physiological time
between two successive points divided by the number of intervals. The                    series analysis.
original intuition was that SpO2 oscillations, induced by repeated apnea
resumption of ventilation sequence, will lead to a high ΔI, while COPD-                  Approximate entropy. ApEn is a biomarker introduced in Pincus et al.28,
induced prolonged desaturations or nearly constant SpO2 would lead to a                  which aims to capture the irregularity in the signal, with higher values
low ΔI. In the original paper of Pepin et al.26, recordings from a total of 160          indicating higher irregularity. This biomarker is very useful in the detection
consecutive patients referred for PSG were used to set the threshold of the ΔI           of OSA, as high randomness is associated with high values of the
distinguishing between OSA and non-OSA. When testing on the prospective                  biomarker. Thus apneas and hypopneas are associated with high ApEn
group of patients, i.e., n = 36 patients with p = 34 nights of recordings for            values. ApEn(m, r, N) can be defined as:
each patient, they obtained a sensitivity of 0.75 and specificity of 0.86. In             ApEn ¼ φm ðr Þ  φmþ1 ðr Þ;                                                   (4)
Magalang et al.27, the ΔI was the best predictor (r2 = 0.60) for the AHI versus
other OBMs including the ODI. The ΔI index is defined as:
                                                                                                         1     X  Nm ði Þ
                                                                                                              Nmþ1
                         NX                                                              φm ðr Þ ¼                  ln             ;                                   (5)
              1           window
                                                                                                     N  m þ 1 i¼1     ðN  m þ 1Þ
ΔIx ¼                             jSpO2 windowiþ1  SpO2 windowi j;             (3)
        Nwindow           i¼1                                                            where Nm(i) is the number of windows of length m for which the distance
where SpO2_windowi is the average of the level of oxygen saturation for the              from the window beginning at the index i is lower than or equal to r. The

Seoul National University Bundang Hospital                                                                                        npj Digital Medicine (2021) 1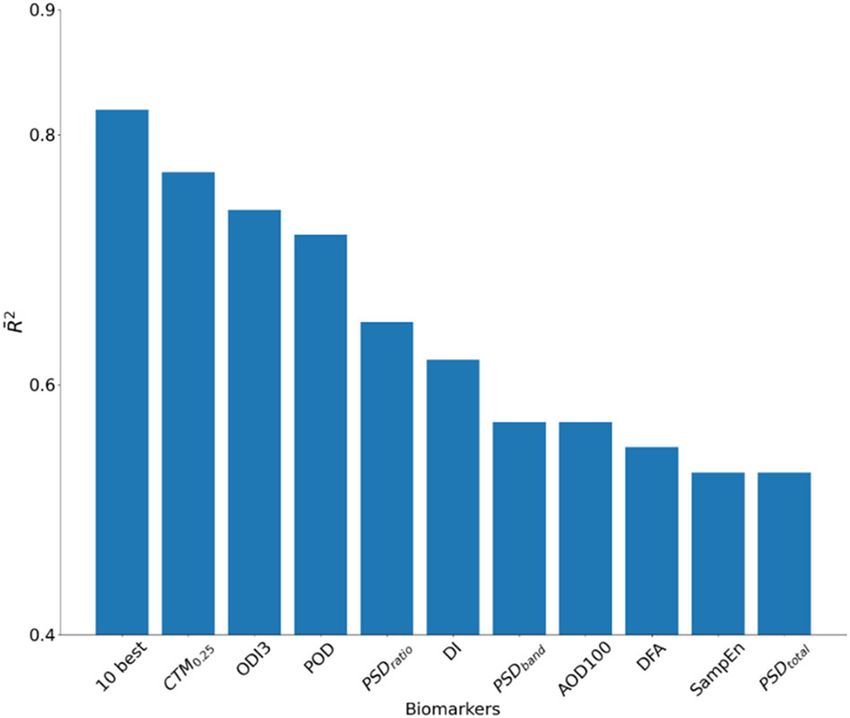
J. Levy et al.
8

    Fig. 4 Example of preprocessing approaches. a shows the time series preprocessed with the delta filter technique, and b shows the same
    time series preprocessed with the block of data technique.

    distance between two windows can be defined as:                                   variability in cardiac physiological data. The higher the variability in the SpO2
                                                                                     signal (i.e., more desaturations/apneas), the lower the CTMρ. Indeed, as CTMρ
    dðX ði Þ; X ð j ÞÞ ¼ max jx ði þ k  1Þ  x ðj þ k  1Þj:                  (6)
                      1km                                                          measures the number of points within a circular region of radius ρ, the higher
                                                                                     the variability/dispersion the lower the number of points within the circle so
                                                                                     the lower the CTMρ. This biomarker was used in the study of Álvarez et al.35
      This biomarker was first used in the context of OSA diagnosis from
                                                                                     on a dataset composed of n = 187 patients, with ρ = 0.25 for the purpose of
    oximetry data, in a study by Hornero et al.33, with m = 1, r = 0.25·σ, where
                                                                                     OSA diagnosis. Their analysis resulted in a sensitivity of 90.01% and a
    σ is the standard deviation of the data. The database was composed of
                                                                                     specificity of 82.9%. CTMρ is calculated as:
    SpO2 time series from subjects showing symptoms of sleep disordered
                                                                                                PNSpO2 2
    breathing categorized into OSA-positive and OSA-negative groups                                       δρði Þ
    according to the gold standard PSG. ApEn was used to diagnose OSA                 CTMρ ¼ i¼1                 ;                                                  (7)
                                                                                                   NSpO2  2
    and reached 82.09% sensitivity and 86.96% specificity on a test set
    composed of n = 113 individuals.                                                 δρði Þ ¼
                                                                                       (       qffiffiffiffiffiffiffiffiffiffiffiffiffiffiffiffiffiffiffiffiffiffiffiffiffiffiffiffiffiffiffiffiffiffiffiffiffiffiffiffiffiffiffiffiffiffiffiffiffiffiffiffiffiffiffiffiffiffiffiffiffiffiffiffiffiffiffiffiffiffiffiffiffiffiffiffiffiffiffiffiffiffiffiffiffiffiffiffiffiffiffiffiffiffiffiffiffiffiffiffiffiffiffiffiffiffiffiffiffiffiffiffiffi
    Sample entropy. This is a non-linear biomarker that quantifies the                      1 if ðSpO2 ði þ 2Þ  SpO2 ði þ 1ÞÞ2 þðSpO2 ði þ 1Þ  SpO2 ði ÞÞ2 < ρ :                                                   (8)
    irregularity in the data and has less bias compared to ApEn. It was used                0 else
    in the original work of Richman and Moorman29, who proved the
    robustness of sample entropy within the context of physiological time-
    series analysis (on neonatal HRV). This biomarker has also been used by          Periodicity measures
    Behar et al.6 for HRV analysis across different mammals. A pseudo-code for       Consecutive apneic events create some periodicity in the oxygen
    the implementation of SampEn is provided in Supplementary Methods.               saturation time series. This periodicity can be quantified through
                                                                                     techniques, such as frequency analysis, phase-rectified signal averaging
    LZ complexity. This biomarker was introduced by Lempel and Ziv31 in              (PRSA), and autocorrelation.
    1976. Within the context of SpO2 analysis, LZ evaluates the degree of
    complexity of spatiotemporal patterns in the SpO2 signal. It has been            Phase-rectified signal averaging. PRSA is a signal processing technique
    largely used in the domain of medicine, especially in the domain of              introduced by Bauer et al.38 to detect and quantify quasi-periodic
    biomedical signal analysis, such as in the work of Amigó et al.34, who used      oscillations in a noisy non-stationary signal. The method also identifies
    it on electroencephalogram time series, or by Álvarez et al.35 to                patterns in increasing and decreasing regions of the signal. A PRSA
    discriminate between OSA and non-OSA individuals. For the later work,            window can be defined as:
    it resulted in a sensitivity of 86.5%, a specificity of 77.6%, and an accuracy
    of 82.9%, when tested on a population of n = 187 patients, including 147                          P
                                                                                                      M
                                                                                     x ðk Þ ¼ M1            Xi ½k ;     for  L  k < L ;                                                                          (9)
    males and 40 females. A pseudo-code for the LZ measure is available in                            i¼1
    Supplementary Methods.                                                           where Xi is the window of length 2L around the anchor point x(i) and M is
                                                                                     the number of anchor points. An anchor point is a decreasing point in the
    Detrended fluctuation analysis. DFA is a scaling analysis method that aims        signal: x(i) < x(i−1), such that the decreasing part (negative slope) of the
    to represent the autocorrelation properties of the signal. A major               desaturation is always within the window. It can also be defined as
    advantage of this method is its robustness against non-stationarity of           increasing points in order to investigate patterns in the resaturation part of
    the signal. This biomarker was introduced by Peng et al.36 to identify           the event. Figure 5 shows an example of PRSA computation on an
    crossover behavior in signals. Larger fluctuations typical of repetitive          oximetry time series for L = 10 and M = 10 anchor points.
    desaturations lead to a higher DFA profile, while near-constant or slow,             Within the context of OSA diagnosis, PRSA biomarkers were used in the
    longer desaturations result in lower profiles. A pseudo-code for the              study of Deviaene et al.22 and evaluated on three datasets: the Sleep Heart
    implementation of DFA is provided in Supplementary Methods.                      Health Study (SHHS) dataset39–42, the Apnea-ECG43 dataset, and a third set
                                                                                     recorded at the sleep laboratory of the University Hospital Leuven. Five
    Central tendency measure (CTMρ). CTMρ is a non-linear method first                PRSA biomarkers were found significant and these are the ones that we
    proposed by Cohen et al.37, with the goal of assessing the degree of             implemented 22.

    npj Digital Medicine (2021) 1                                                                                                           Seoul National University Bundang Hospital
J. Levy et al.
9
Fig. 5 PRSA analysis of the oximetry time series. In a, the oximetry time series, with anchor points highlighted. In b, concatenation of PRSA
windows, defined around each anchor points. In c, PRSA windows of top of each other. In d, the average of all the PRSA windows.
● PRSAdc, the capacity of the window, defined as where X is the amplitude of the PSD function, estimated by the
x ð0Þ þ x ð1Þ x ð1Þ x ð2Þ Welch’s method46 using a hamming window, and NFFT is the
PRSAdc ¼ : (10) number of points in the PSD signal.
4
● PSDband corresponds to the energy within the band 0.014–0.033 Hz:
● PRSAdad, the amplitude differences; this is the difference between max
and min values. X
N2
● PRSAdos, the overall slope of the window; the window is linearly PSDband ¼ X ðiÞ; (13)
approximated, and the slope is retained. i¼N1
● PRSAdsb, the slope before the anchor point.
● PRSAdsa, the slope after the anchor point. where N1 and N2 are the limits of the summation between 0.014
and 0.033 Hz.
Autocorrelation. AC(k) measures the degree of correlation between values ● PSDratio corresponds to the ratio between the power (area) within the
of the same variable. This is achieved by computing the correlation spectral band 0.017–0.033 Hz and PSDtotal.
between the original SpO2 time series and a shifted version of it. The PN2
analysis of AC can be used to find repeating patterns, such as a periodic X ði Þ
PSDratio ¼ Pi¼N 1
NFFT
; (14)
signal. Mathematically, AC can be defined as:
i¼0 X ði Þ
X
Nk
ACðk Þ ¼ SpO2 ði Þ SpO2 ði þ k Þ: (11) ● PSDpeak corresponds to the peak amplitude of the PSD within the
i¼1
band 0.014–0.033 Hz.
Power spectral analysis (power spectral density (PSDtotal, PSDband, PSDratio, PSDpeak ¼ max fX ði Þg; (15)
PSDpeak). In Zamarrón et al.44, the authors analyzed the PSD curve of the N1 < i < N2
oximetry time series. They defined a spectral band of interest for oximetry where i is the index of the power spectrum signal.
analysis within the context of OSA as 0.014–0.033 Hz. Zamarrón et al.45
assessed PSD biomarkers on a total of 250 subjects between the ages of 21
and 82 years and obtained a sensitivity of 78.2% and a specificity of 89.0%. Desaturation measures
Figure 6 shows the differences in the spectral signal between a non-OSA Desaturations can occur as a consequence of conditions such as sleep
and an OSA patient. disordered breathing, and can be characterized by descriptors such as
●
their lengths and depths. For example, a study by Kulkas et al.47 studied
PSDtotal corresponds to the area defined by the power spectrum:
the gender difference in the distribution of the desaturation lengths,
X
N FFT depths, and areas caused by hypopnea and apnea events. Desaturations
PSDtotal ¼ X ðiÞ; (12) are not only caused by apnea or hypopnea events48 and thus
i¼1
desaturation events and their statistical descriptors may capture the
expression of other conditions during sleep.
Seoul National University Bundang Hospital npj Digital Medicine (2021) 1J. Levy et al.
10
Fig. 6 Power spectral density (PSD) of the oximetry time series. Example on a a non-OSA individual and b a patient with moderate OSA. The
band 0.014–0.033 Hz is delineated by the vertical dashed lines. In b, the peak within this band is located at f = 0.017 Hz, as highlighted by the
red star.
Fig. 7 Desaturation biomarkers. A, B, C, and D are the fiducials points delimiting a desaturation event.
Oxygen desaturation index (ODIx). The ODIx corresponds to the average value that reaches a minimum of at least 3% below A, and fiducial point C
number of desaturation events per hour. A desaturation is defined as a as the point where the SpO2 value returns to a level either 1% below A or
SpO2 drop of x% below the baseline. The ODIx is a widely used measure 3% above B. Some additional constraints are imposed, including that
in the field of sleep medicine, where desaturations are characteristic of fluctuations in consecutive SpO2 values should be −1% between B and C. Finally, the time interval between A and C
reduced entrance of oxygenated air to the lungs, which leads to a drop in must be ≥10 and ≤60 s51. In the original paper, 90 s was used as the time
oxygenated hemoglobin until airway patency is restored. These manifest limit, but to ensure capture of resaturation, 60 s is used here. An
as transient hypoxemic events or desaturations. Traditionally x = 3 or 4%. additional fiducial point D was defined as a point posterior to C at which
There exist many implementations of the ODI with variable definitions. In the SpO2 time series reaches a level of at least 1% below A and where the
the present work, the implementation of the ODIx detection algorithm time interval between A and D is ≤60 s. From the detected desaturation
was developed and validated by Behar et al.50, building on the parent events, several oximetry biomarkers can be computed (Fig. 7). Within our
model and desaturation definition of Jung et al.51. Specifically, the model context of single-channel SpO2 analysis, i.e., when no reference EEG
of Jung et al.51 defines three fiducial points A, B, and C, to determine the channel is available to quantify sleep time, the ODIx is defined as:
occurrence of a desaturation. Fiducial point A is defined as the point Ndesat
where the SpO2 value decreases by ≥1 and ≤3%, fiducial point B as the ODIx ¼ ; (16)
TRT
npj Digital Medicine (2021) 1 Seoul National University Bundang HospitalJ. Levy et al.
11
sffiffiffiffiffiffiffiffiffiffiffiffiffiffiffiffiffiffiffiffiffiffiffiffiffiffiffiffiffiffiffiffiffiffiffiffiffiffiffiffiffiffiffiffiffi
2ffi
where Ndesat is the number of desaturations in the signal and TRT is the PNdesat
i¼1 Slope i DS μ (25)
total recording time in hours. DSσ ¼ :
Ndesat
Desaturation length (DLμ, DLσ). DLμ is the mean and DLσ is the standard Slopei can be seen in Fig. 7.
deviation across the entire length of the desaturation. These biomarkers
contain information about the duration of the desaturation events in the Desaturation area (DAmaxμ, DAmaxσ, DA100μ, DA100μ). The area of the
SpO2 signal. Indeed, ODIx only considers the number of desaturations but desaturation is computed for each desaturation. DA100μ is the mean and
does not consider their length. The length of a desaturation is particularly DA100σ is the standard deviation of the area across all individual
important because it reflects how long an individual is under hypoxic desaturations, taking 100% SpO2 as baseline. The area can also be
stress. Furthermore, desaturations of various lengths will lead to a higher computed by taking the maximum SpO2 value of individual desaturations
DLσ. DLμ and DLσ are defined as: as baseline. DAmaxμ is the mean and DAmaxσ is the standard deviation of
NX
desat the area across all individual desaturations. Whereas the Desaturation
1
DLμ ¼ τi ; (17) length biomarker considers the duration of the events (reflecting the time
Ndesat i¼1 under hypoxic stress) and the desaturation depth biomarkers consider the
sffiffiffiffiffiffiffiffiffiffiffiffiffiffiffiffiffiffiffiffiffiffiffiffiffiffiffiffiffiffiffiffiffiffiffiffiffi depth of events (reflecting the strength of hypoxia), the desaturation area
PNdesat 2 factorizes both the depth and the length of the desaturations. The two
τ i DLμ (18)
DLσ ¼ i¼1
; pairs of biomarkers can be mathematically written as:
Ndesat
NX
desat
where τi corresponds to the duration of the ith oxygen desaturation event. 1
DA100μ ¼ S100i ; (26)
Ndesat i¼1
Desaturation depth (DDmaxμ, DDmaxσ, DD100μ, DD100σ). For a single sffiffiffiffiffiffiffiffiffiffiffiffiffiffiffiffiffiffiffiffiffiffiffiffiffiffiffiffiffiffiffiffiffiffiffiffiffiffiffiffiffiffiffiffiffiffiffiffiffiffiffiffi
desaturation, the desaturation depth is computed as the maximal minus PNdesat 2ffi
S100 i DA100 μ (27)
the minimal SpO2 value within the desaturation event, from point A to B. DA100σ ¼ i¼1
;
DDmaxμ is the mean and DDmaxσ is the standard deviation across all Ndesat
individual desaturation depths. A similar pair of biomarkers can be
engineered by computing the depth with respect to the 100% SpO2 level, 1 NX desat
DAmaxμ ¼ Smaxi ; (28)
i.e., 100% minus the minimal SpO2 value of a desaturation event. These are, Ndesat i¼1
respectively, denoted DD100μ and DD100σ for the mean and the standard
sffiffiffiffiffiffiffiffiffiffiffiffiffiffiffiffiffiffiffiffiffiffiffiffiffiffiffiffiffiffiffiffiffiffiffiffiffiffiffiffiffiffiffiffiffiffiffiffiffiffiffiffiffiffiffi
deviation computed across all desaturation depths. The idea of quantifying PNdesat 2
the desaturation depth has also been used by Terrill10. The desaturation Smaxi DAmaxμ (29)
DAmaxσ ¼ i¼1
;
depth may be an important factor for determination of the severity of OSA Ndesat
because it will reflect, for a given desaturation, the level of the hypoxic where Smaxi is the area of the specific desaturation event integrated from
stress imposed. Desaturation depth also varies with sleep stages, and so the maximal (max) value of the desaturation event and S100i is the area of
there is value in capturing its variation across desaturations52. Furthermore, the specific desaturation event integrated from 100%. Smaxi and S100i can
alternation of soft and deep desaturations will lead to high values of be seen in Fig. 7.
DDmaxσ and DD100σ. The two pairs of biomarkers are defined as:
1 X
N desat Time between desaturation (TDμ, TDσ). The average and standard
DDmaxμ ¼ maxi mini ; (19) deviation of time elapsed between two consecutive desaturation events
Ndesat i¼1 can be used to capture some aspect of the temporal distribution of
NX
desat
desaturation events. The two biomarkers can be computed as:
1
DD100μ ¼ 100 mini ; (20) 1 NX
desat
Ndesat i¼1 TDμ ¼ Δti ; (30)
Ndesat 1
sffiffiffiffiffiffiffiffiffiffiffiffiffiffiffiffiffiffiffiffiffiffiffiffiffiffiffiffiffiffiffiffiffiffiffiffiffiffiffiffiffiffiffiffiffiffiffiffiffiffiffiffiffiffiffiffiffiffiffiffiffiffiffiffiffiffi
2ffi
i¼2
PNdesat
max min DDmax sffiffiffiffiffiffiffiffiffiffiffiffiffiffiffiffiffiffiffiffiffiffiffiffiffiffiffiffiffiffiffiffiffiffiffiffiffiffiffi
2ffi
DDmaxσ ¼ i¼1 i i μ
; (21) PNdesat
Ndesat Δti TDμ (31)
TDσ ¼ i¼2
;
sffiffiffiffiffiffiffiffiffiffiffiffiffiffiffiffiffiffiffiffiffiffiffiffiffiffiffiffiffiffiffiffiffiffiffiffiffiffiffiffiffiffiffiffiffiffiffiffiffiffiffiffiffiffiffiffiffiffiffiffiffiffiffiffi Ndesat 1
PNdesat 2
100 mini DD100μ (22) where Δti is the time elapsed between desaturation i and desaturation i −
DD100σ ¼ i¼1
; 1. Δti can be seen in Fig. 7.
Ndesat
where maxi is the maximum value of desaturation i and mini is the minimum
value of desaturation i. The variables maxi and mini are illustrated in Fig. 7. The Measures of the hypoxic burden
desaturation depth can also be described by extending the ODI to any The percentage of oxygen desaturation events (PODx). The PODx is the
threshold x and studying the cumulative frequency of the desaturations as a overall duration of all desaturations, normalized by the total recording
function of x53. time. It was introduced by Kulkas et al.18 in order to estimate the
severity of OSA from the SpO2 time series. It was used in the work of
Desaturation slope (DSμ, DSσ). The downslope of the signal is calculated for Watanabe et al.54 to study the prognostic importance of novel oxygen
each desaturation. The decreasing phase of the desaturation is linearly desaturation measures in heart failure and central sleep apnea
approximated. DSμ is the mean and DSσ is the standard deviation of the population samples. Non-survivors had a higher PODx compared with
slopes over all desaturation events. These biomarkers consider the slope of survivors (19 ± 13 versus 11 ± 6.4%; p = 0.001). By contrast, non-
the desaturation, which is a different factor than the number, duration, or survivors did not differ significantly from survivors with respect to the
depth of the desaturations. Indeed, OSA and other pathologies may lead to AHI and CT90%. An adjusted logistic regression analysis revealed that
sharp drops in SpO2, which would lead to high DSμ value. The slope of a the PODx was the best independent predictor of mortality. In the work
specific desaturation can be written as: by Kulkas et al.18, the biomarker was computed on a dataset collected
from 160 male patients with different levels of AHI severity. The
BA
Slopei ¼ ; (23) correlation between AHI and PODx was high: r2 = 0.8718. The PODx can
tB tA be mathematically defined as:
where (A, tA) is the point of inflexion (amplitude and timestamp) of the PNdesat
τi
desaturation, and (B, tB) is the minimum point of the desaturation. PODx ¼ 100 i¼1 ; (32)
Accordingly, the mean and standard deviation of slopes are computed as: TRT
where τi (Fig. 7) corresponds to the duration of each oxygen
1 X
Ndesat
DSμ ¼ Slopei ; (24) desaturation event and x to the level of the desaturation. In their
Ndesat i¼1 original publication, Watanabe et al.54 set x = 4%.
Seoul National University Bundang Hospital npj Digital Medicine (2021) 1J. Levy et al.
12
Fig. 8 Illustration of CA90 and CT90 biomarkers. The sum of all the blue areas corresponds to CA90, whereas the sum of all the length
arrows corresponds to CT90.
The area under the oxygen desaturation curve (AODmax, AOD100). The database. SHHS was a multi-center cohort study conducted by the National
AODx was introduced by Kulkas et al.18 in the same context as the PODx, for Heart Lung & Blood Institute (ClinicalTrials.gov Identifier: NCT0000527) to
the estimation of the sleep apnea–hypopnea syndrome. It was used in the determine the cardiovascular and other consequences of sleep-disordered
work of Watanabe et al.54, along with the POD biomarker. Survivors in this breathing. In all, 6441 men and women, aged ≥40 years, were enrolled
study appeared to have lower AODx than non-survivors (0.16 ± 0.2 versus between November 1, 1995 and January 31, 1998. Institutional review
0.26 ± 0.2; p = 0.08). It represents the sum of the area of each desaturation board from the Technion-IIT Rappaport Faculty of Medicine was obtained
event divided by TRT. This index was demonstrated to be an independent under number 62-2019 in order to use this database for research. The
modulator of increased epicardial fat volume (EFV) in an acute myocardial variable “ahi_a0h3a” was used for the AHI in order to define the classes. To
infarction population sample14 (n = 105). EFV is associated with adverse elaborate this variable, the AHI was computed as the average number of all
cardiovascular events after myocardial infarction. In the work of Kulkas apneas and hypopneas (with oxygen desaturation >3% or an arousal) per
et al.18, this biomarker appeared to have moderate correlation with AHI: hour of sleep and following the American Academy of Sleep Medicine
r2 ∈ [0.581−0.689], p < 0.001. It can be mathematically defined as: (AASM) 2012 rules56. OSA severity was defined with respect to the AHI, i.e.,
PNdesat mild (5 ≤ AHI < 15), moderate (15 ≤ AHI 0.05”. Dunn post hoc analysis was performed between each pair of the
CTx ¼ 100 i¼1 ; (35)
TRT fs classes. Multivariable linear regression was performed to assess the added
value in combining OBM for the purpose of estimating the AHI. To this end,
1 if SpO2i < x linear regression was performed between individual and combined sets of
tð x Þi ¼ ; (36) 2
0 else biomarkers and the AHI. For each model, the adjusted R2 ðR Þ score was
2
where fs is the sampling frequency of the signal. reported. R is defined as:
2 ð1 R2 Þðsize 1Þ
Cumulative area (CAx). Total area under the x% oxygen saturation level. R ¼1 ; (39)
size pred 1
This biomarker was introduced by Watanabe et al.54, with x = 90%. Indeed,
OSA patients tend to have a greater area under the baseline x than non- where pred is the number of predictors, and size is the total sample size.
OSA patients and then get a higher value for this biomarker. The biomarker
is illustrated in Fig. 8. It can be defined as: Reporting summary
PNSpO2
x SpO2ð x Þi (37)
Further information on research design is available in the Nature Research
CAx ¼ 100 i¼1 ; Reporting Summary linked to this article.
TRT fs
SpO2i if SpO2i < x
SpO2ð x Þi ¼ : (38) DATA AVAILABILITY
x else
The SHHS database used in this research may be requested from sleepdata.org.
Evaluation database
In order to demonstrate the usability of the implemented oximetry CODE AVAILABILITY
biomarkers and to define some normality ranges, we used the SHHS39–42 The source code used in this research is available at physiozoo.com.
npj Digital Medicine (2021) 1 Seoul National University Bundang HospitalJ. Levy et al.
13
Received: 13 September 2020; Accepted: 25 November 2020; 27. Magalang, U. J. et al. Prediction of the apnea-hypopnea index from overnight
pulse oximetry. Chest 124, 1694–1701 (2003).
28. Pincus, S. M. Approximate entropy as a measure of system complexity. Proc. Natl
Acad. Sci. USA 88, 2297–2301 (1991).
29. Richman, J. S. & Moorman, J. R. Physiological time-series analysis using approx-
REFERENCES imate entropy and sample entropy. Am. J. Physiol. Heart Circ. 278, H2039–H2049
(2000).
1. Lavie, L. Obstructive sleep apnoea syndrome - an oxidative stress disorder. Sleep
30. Goldberger, A. L., Peng, C. K. & Lipsitz, L. A. What is physiologic complexity and
Med. Rev. 7, 35–51 (2003).
how does it change with aging and disease? Neurobiol. Aging 23, 23–26 (2002).
2. Budhiraja, R., Siddiqi, T. A. & Quan, S. F. Sleep disorders in chronic obstructive
31. Lempel, A. & Ziv, J. On the complexity of finite sequences. IEEE Trans. Inf. Theory
pulmonary disease: etiology, impact, and management. J. Clin. Sleep Med. 11,
22, 75–81 (1976).
259–270 (2015).
32. Ary, L., Goldberger, D. R. R. & B., J. Chaos and fractals in human physiology. Sci.
3. Malik, M. et al. Heart rate variability: standards of measurement, physiological
Am. 262, 42–49 (1990).
interpretation, and clinical use. Eur. Hear. J. 17, 354–381 (1996).
33. Hornero, R., Álvarez, D., Abásolo, D., Del Campo, F. & Zamarrón, C. Utility of
4. Tarvainen, M. P., Niskanen, J.-P., Lipponen, J. A., Ranta-aho, P. O. & Karjalainen, P.
approximate entropy from overnight pulse oximetry data in the diagnosis of the
A. Kubios HRV - heart rate variability analysis software. Comput. Methods Prog.
obstructive sleep apnea syndrome. IEEE Trans. Biomed. Eng. 54, 107–113 (2007).
Biol. 113, 210–20 (2014).
34. Amigó, J. M., Szczepański, J., Wajnryb, E. & Sanchez-Vives, M. V. Estimating the
5. Vest, A. N. et al. Benchmarking heart rate variability toolboxes. J. Electrocardiol. 50,
entropy rate of spike trains via Lempel-Ziv complexity. Neural Comput. 16,
744–747 (2017).
717–736 (2004).
6. Behar, J. A. et al. PhysioZoo: a novel open access platform for heart rate varia-
35. Álvarez, D., Hornero, R., Abásolo, D., Del Campo, F. & Zamarrón, C. Nonlinear
bility analysis of mammalian electrocardiographic data. Front. Physiol. 9, 1–14
characteristics of blood oxygen saturation from nocturnal oximetry for obstruc-
(2018).
tive sleep apnoea detection. Physiol. Meas. 27, 399–412 (2006).
7. Uddin, M. B., Chow, C. M. & Su, S. W. Classification methods to detect sleep apnea
36. Peng, C. K., Havlin, S., Stanley, H. E. & Goldberger, A. L. Quantification of scaling
in adults based on respiratory and oximetry signals: a systematic review. Physiol.
exponents and crossover phenomena in nonstationary heartbeat time series.
Meas. 39, 2018 (2018).
Chaos 5, 82–87 (1995).
8. del Campo, F. et al. Oximetry use in obstructive sleep apnea. Expert Rev. Resp.
37. Cohen, M. E., Hudson, D. L. & Deedwania, P. C. Applying continuous chaotic
Med. 12, 665–681 (2018).
modeling to cardiac signal analysis. IEEE Eng. Med. Biol. Mag. 15, 97–102 (1996).
9. Mendonça, F., Mostafa, S. S., Ravelo-García, A. G., Morgado-Dias, F. & Penzel, T. A
38. Bauer, A. et al. Phase-rectified signal averaging detects quasi-periodicities in non-
review of obstructive sleep apnea detection approaches. IEEE J. Biomed. Health
stationary data. Phys. A Stat. Mech. Appl. 364, 423–434 (2006).
Inform. 23, 825–837 (2019).
39. Zhang, G. Q. et al. The National Sleep Research Resource: towards a sleep data
10. Terrill, P. I. A review of approaches for analysing obstructive sleep apnoea-related
commons. J. Am. Med. Inform. Assoc. 25, 1351–1358 (2018).
patterns in pulse oximetry data. Respirology 25, 475–485 (2020).
40. Quan, S. et al. The Sleep Heart Health Study: design, rationale, and methods. Sleep
11. Rashid, N. H. et al. The value of oxygen desaturation index for diagnosing
20, 1077–1085 (1997).
obstructive sleep apnea: a systematic review. Laryngoscope. https://doi.org/
41. Redline, S. et al. Methods for obtaining and analyzing unattended poly-
10.1002/lary.28663 (2020).
somnography data for a multicenter study. Sleep Heart Health Res. Group Sleep 21,
12. Azarbarzin, A. et al. The hypoxic burden of sleep apnoea predicts cardiovascular
759–767 (1998).
disease-related mortality: the osteoporotic fractures in Men Study and the Sleep
42. Dean, D. A. et al. Scaling up scientific discovery in sleep medicine: The National
Heart Health Study. Eur. Heart J. 40, 1149–1157 (2019).
Sleep Research Resource. Sleep 39, 1151–1164 (2016).
13. Goldberger, A. L. et al. PhysioBank, PhysioToolkit, and PhysioNet: components of
43. Penzel, T., Rg, G. B. M., Goldberges, M. A. L. & Peter, H. The Apnea-ECG Database.
a new research resource for complex physiologic signals. Circulation 101,
Comput. Cardiol. 27, 255–258 (2000).
E215–E220 (2000).
44. Zamarrón, C., Gude, F., Barcala, J., Rodriguez, J. R. & Romero, P. V. Utility of oxygen
14. Linz, D. et al. Nocturnal hypoxemic burden is associated with epicardial fat volume
saturation and heart rate spectral analysis obtained from pulse oximetric record-
in patients with acute myocardial infarction. Sleep Breath. 22, 703–711 (2018).
ings in the diagnosis of sleep apnea syndrome. Chest 123, 1567–1576 (2003).
15. Dewan, N. A., Nieto, F. J. & Somers, V. K. Intermittent hypoxemia and OSA:
45. Zamarrón Sanz, C., Romero, P. V., Rodriguez, J. R. & Gude, F. Oximetry spectral
implications for comorbidities. Chest 147, 266–274 (2015).
analysis in the diagnosis of obstructive sleep apnoea. Clin. Sci. 97, 467–473
16. Orrù, G. et al. Obstructive Sleep Apnea, oxidative stress, inflammation and
(1999).
endothelial dysfunction-an overview of predictive laboratory biomarkers. Eur.
46. Welch, P. D. The use of fast Fourier transform for the estimation of power spectra:
Rev. Med. Pharmacol. Sci. 24, 6939–6948 (2020).
a method based on time averaging over short, modified periodograms. IEEE
17. Suen, C. et al. Sleep study and oximetry parameters for predicting postoperative
Trans. Audio Electroacoust. 9, 2077 (1967).
complications in patients with OSA. Chest 155, 855–867 (2019).
47. Kulkas, A., Duce, B., Leppänen, T., Hukins, C. & Töyräs, J. Gender differences in
18. Kulkas, A., Tiihonen, P., Julkunen, P., Mervaala, E. & Töyräs, J. Novel parameters
severity of desaturation events following hypopnea and obstructive apnea
indicate significant differences in severity of obstructive sleep apnea with
events in adults during sleep. Physiol. Meas. 38, 1490–1502 (2017).
patients having similar apnea-hypopnea index. Med. Biol. Eng. Comput. 51,
48. Behar, J. A. From sleep medicine to medicine during sleep: a new paradigm. Sleep
697–708 (2013).
43, 1–3 (2020).
19. Fletcher, E. C., Miller, J., Divine, G. W., Fletcher, J. G. & Miller, T. Nocturnal oxy-
49. Behar, J. A. et al. Feasibility of single channel oximetry for mass screening of
hemoglobin desaturation in COPD patients with arterial oxygen tensions above
obstructive sleep apnea. EClinicalMedicine 11, 81–88 (2019).
60 mm Hg. Chest 92, 604–608 (1987).
50. Behar, J. A., Palmius, N., Penzel, T., Bittencourt, L. & Tufik, S. Single-channel oxi-
20. Resta, O. et al. Sleep related O2 desaturation in COPD patients with normoxaemia
metry monitor versus in-lab polysomnography oximetry analysis: does it make a
and mild hypoxyaemia. Boll. Soc. Ital. Biol. Sper. 74, 91–98 (1998).
difference? Accept. Physiol. Meas. 41, 4 (2020).
21. Quaresima, V. & Ferrari, M. COVID-19: efficacy of prehospital pulse oximetry for
51. Jung, D. W. et al. Real-time automatic apneic event detection using nocturnal
early detection of silent hypoxemia. Crit. Care 24, 501 (2020).
pulse oximetry. IEEE Trans. Biomed. Eng. 65, 706–712 (2018).
22. Deviaene, M. et al. Automatic screening of sleep apnea patients based on the
52. Findley, L. J., Wilhoit, S. C. & Suratt, R. M. Apnea duration and hypoxemia during
SpO2 signal. IEEE J. Biomed. Health Inform. 23, 607–617 (2019).
REM sleep in patients with obstructive sleep apnea. Chest 87, 432–436 (1985).
23. Taha, B. H. et al. Automated detection and classification of sleep-disordered
53. Terrill, P. I., Dakin, C., Edwards, B. A., Wilson, S. J. & MacLean, J. E. A graphical
breathing from conventional polysomnography data. Sleep 20, 991–1001
method for comparing nocturnal oxygen saturation profiles in individuals and
(1997).
populations: application to healthy infants and preterm neonates. Pediatr. Pul-
24. Buekers, J. et al. Wearable finger pulse oximetry for continuous oxygen saturation
monol. 53, 645–655 (2018).
measurements during daily home routines of patients with chronic obstructive
54. Watanabe, E. et al. Prognostic importance of novel oxygen desaturation metrics
pulmonary disease (COPD) over one week: observational study. J. Med. Internet
in patients with heart failure and central sleep apnea. J. Card. Fail. 23, 131–137
Res. 21, 1–14 (2019).
(2017).
25. Xie, B. & Minn, H. Real-time sleep apnea detection by classifier combination. IEEE
55. Olson, L. G., Ambrogetti, A. & Gyulay, S. G. Prediction of sleep-disordered
Trans. Inf. Technol. Biomed. 16, 469–477 (2012).
breathing by unattended overnight oximetry. J. Sleep Res. 8, 51–55 (1999).
26. Pepin, J. L., Levy, P., Lepaulle, B., Brambilla, C. & Guilleminault, C. Does oximetry
56. Berry, R. B. et al. Rules for scoring respiratory events in sleep: Update of the 2007
contribute to the detection of apneic events? Mathematical processing of the
AASM manual for the scoring of sleep and associated events. J. Clin. Sleep Med. 8,
SaO2 signal. Chest 99, 1151–1157 (1991).
597–619 (2012).
Seoul National University Bundang Hospital npj Digital Medicine (2021) 1You can also read