Proteomics and metabonomics analyses of Covid 19 complications in patients with pulmonary fibrosis - Nature
←
→
Page content transcription
If your browser does not render page correctly, please read the page content below
www.nature.com/scientificreports
OPEN Proteomics and metabonomics
analyses of Covid‑19 complications
in patients with pulmonary fibrosis
Jianrong Yang1,10, Chunxia Chen2,3,10, Wan Chen4,10, Luying Huang5, Zhao Fu6, Kun Ye7,
Liwen Lv4, Zhihuang Nong8, Xing Zhou9, Wensheng Lu9* & Mei Zhong9*
Pulmonary fibrosis is a devastating disease, and the pathogenesis of this disease is not completely
clear. Here, the medical records of 85 Covid-19 cases were collected, among which fibrosis
and progression of fibrosis were analyzed in detail. Next, data independent acquisition (DIA)
quantification proteomics and untargeted metabolomics were used to screen disease-related
signaling pathways through clustering and enrichment analysis of the differential expression of
proteins and metabolites. The main imaging features were lesions located in the bilateral lower lobes
and involvement in five lobes. The closed association pathways were FcγR-mediated phagocytosis,
PPAR signaling, TRP-inflammatory pathways, and the urea cycle. Our results provide evidence for the
detection of serum biomarkers and targeted therapy in patients with Covid-19.
In December 2019, pneumonia with an unknown cause became prevalent in Wuhan, China. When RNA was
extracted and sequenced from these patients in samples of bronchoalveolar lavage fluid, the causative agent was
found to be a novel betacoronavirus, SARS-CoV-21. Subsequently, the outbreak was declared a public health
emergency, and the novel coronavirus disease was named Covid-19 by the World Health Organization (WHO)2.
As of November, 2020, over 42 million Covid-19 cases and 1 million deaths have been confirmed globally.
However, the epidemic continues to spread, especially in the Americas and southeast Asia3. Currently, there
are no effective therapies to treat Covid-19, although countries continue to develop new vaccines4,5. Therefore,
developing new ways to control the progression of disease is urgent.
Pulmonary fibrosis is a phenomenon in patients with Covid-19, as evidenced by CT imaging and a utopsy6,7.
It is a progressive lung disease, and lung transplantation may be the only treatment to elevate life e xpectancy8.
Recently, the Arg-Gly-Asp integrin-binging domain in SARS-CoV-2 spike protein was recognized by some
researchers as one of the target pathways9,10, and the inflammatory factor IL-1 was implicated as possibly medi-
ating its binding integrins11. TGF-β orchestrates multifunctional aspects of fibrogenesis, such as proliferation,
deposition of extracellular matrix and fiber f ormation12,13. The TGF-β pathway is the main antifibrotic therapeutic
pathway14,15. However, more pathogenetic profibrotic pathways need to be explored.
Proteomics and metabonomics are useful methods to screen markers of disease occurrence through dif-
ferential expression of proteins and metabolic c ompounds16,17. In this study, we combined proteomic and meta-
bonomic data with chest CT imaging to investigate the mechanism of pulmonary fibrosis. For the first time, to
study the related pathways of fibrosis progression in Covid-19, patients with pulmonary fibrosis were divided
into a nonprogressive group and a progressive group according to the degree of fibrosis progression. Our research
1
Hepatobiliary Surgery, the People’s Hospital of Guangxi Zhuang Autonomous Region, Nanning 530021,
Guangxi, People’s Republic of China. 2Department of Research Center of Medical Sciences, the People’s Hospital
of Guangxi Zhuang Autonomous Region, Nanning 530021, Guangxi, People’s Republic of China. 3Department
of Pharmaceutical Sciences (Shenzhen), Sun Yat-Sen University, Guangzhou 510006, Guangdong, People’s
Republic of China. 4Department of Emergency, the People’s Hospital of Guangxi Zhuang Autonomous Region,
Nanning 530021, Guangxi, People’s Republic of China. 5Department of Respiratory Diseases, the People’s Hospital
of Guangxi Zhuang Autonomous Region, Nanning 530021, Guangxi, People’s Republic of China. 6Department of
Radiology, the People’s Hospital of Guangxi Zhuang Autonomous Region, Nanning 530021, Guangxi, People’s
Republic of China. 7Department of Nephrology, the People’s Hospital of Guangxi Zhuang Autonomous Region,
Nanning 530021, Guangxi, People’s Republic of China. 8Department of Pharmacy, the People’s Hospital of
Guangxi Zhuang Autonomous Region, Nanning 530021, Guangxi, People’s Republic of China. 9Department of
Endocrinology, the People’s Hospital of Guangxi Zhuang Autonomous Region, 6 Taoyuan Road, Nanning 530021,
Guangxi, People’s Republic of China. 10These authors contributed equally: Jianrong Yang, Chunxia Chen and Wan
Chen. *email: 40192385@qq.com; rosasa001@163.com
Scientific Reports | (2021) 11:14601 | https://doi.org/10.1038/s41598-021-94256-8 1
Vol.:(0123456789)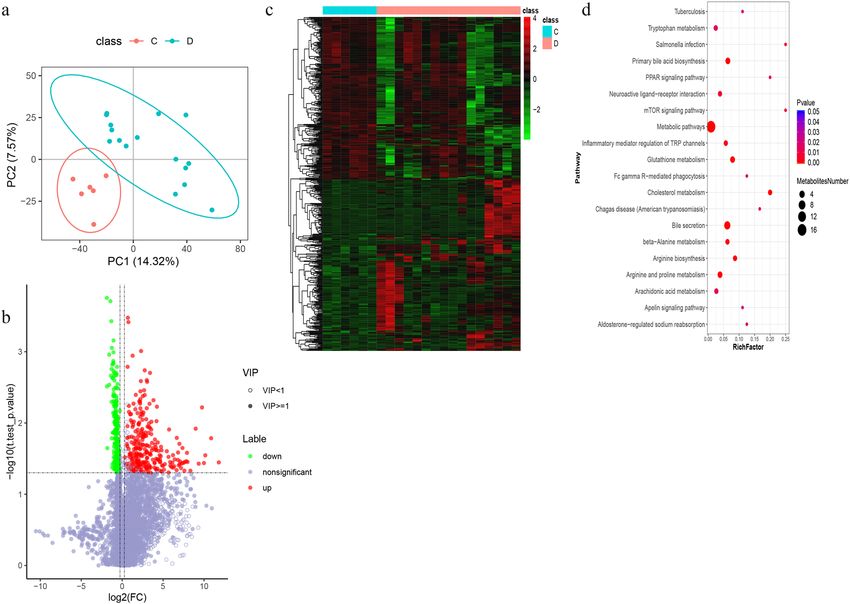
www.nature.com/scientificreports/
Characteristics All patients (n = 85) Nonpulmonary fibrosis (n = 41) Pulmonary fibrosis (n = 44)
Age, median (interquartile), years 41 (29–50.5) 31 (17.5–42) 48 (37.5–62.8)
Sex
Male 34 (40.0) 18 (43.9) 16 (36.4)
Female 51 (60.0) 23 (56.1) 28 (63.6)
WBCs (× 109/L; normal range 3.6–10) 5.9 (4.5–6.9) 6.0 (5.1–7.8) 6.1 (4.7–7.6)
Increased 9 (10.6) 4 (9.8) 5 (11.4)
Decreased 6 (7.0) 2 (2.5) 4 (9.1)
Neutrophils (× 109/L; normal range 1.7–7) 3.2 (2.4–4.5) 2.9 (2.3–4.1) 3.8 (2.5–5.0)
Increased 6 (7.1) 1 (2.4) 5 (11.4)
Decreased 7 (8.2) 4 (9.8) 3 (6.8)
Lymphocytes (× 109/L; normal range 0.7–4) 1.9 (1.4–2.4) 2.1 (1.8–2.7) 1.6 (1.1–2.1)
Increased 5 (5.9) 5 (12.2) 0 (0)
Decreased 5 (5.9) 1 (2.4) 4 (9.1)
Erythrocyte sedimentation rate, median (inter-
34 (18.0–56) 24 (9.8–45.3) 41.5 (28.0–65.0)
quartile), mm/h
C-reactive protein ≥ 10 mg/L 20 (23.5) 7 (17.1) 13 (29.5)
Hypersensitive C-reactive protein ≥ 10 mg/L 21 (24.7) 8 (19.5) 13 (29.5)
Procalcitonin ≥ 0.05 ng/mL 24 (28.2) 6 (14.6) 18 (40.9)
D-dimer > 0.5 mg/L 50 (58.8) 22 (53.7) 28 (63.6)
Oxygenation index > 300 73 (85.9) 36 (87.8) 37 (84.1)
Table 1. Baseline characteristics of patients with Covid-19. Except where indicated, data are cases of patients,
with percentages in parentheses.
may provide useful clues and strategies for controlling the epidemic of Covid-19 in other countries worldwide,
particularly the prognosis and treatment of pulmonary fibrosis.
Results
Patient demographics and laboratory findings. By 17 Mar 2020, the clinical data of 85 laboratory-
confirmed SARS-CoV-2-infected cases were collected in Guangxi, China. The median age for all patients was
41 years, with an interquartile range of 29–50.5 years (Tables 1 and S1). Sixty percent of the patients were female.
On admission, white blood cells (WBCs) were below the normal range in 9 (10.6%) patients and above the
normal range in 6 (7.0%) patients. Seven (8.2%) patients showed neutropenia (neutrophil count < 1.7 × 10⁹), and
5 (5.9%) showed lymphopenia (lymphocyte count < 0.7 × 10⁹). The erythrocyte sedimentation rate (ESR) was
higher in pulmonary fibrosis patients (median level 41.5 mm/h [interquartile 28.0–65.0]) than in nonpulmonary
fibrosis patients (median level 24 mm/h [interquartile 9.8–45.3]). Levels of C-reactive protein, hypersensitive
C-reactive protein, procalcitonin, D-dimer, and oxygenation index were increased in 13 (29.5%), 13 (29.5%),
18 (40.9%), 28 (63.6%) and 37 (84.1%) pulmonary fibrosis patients, respectively, while they were increased in 7
(17.1%), 8 (19.5%), 6 (14.6%), 22 (53.7%) and 36 (87.8%) nonpulmonary fibrosis patients.
Chest CT findings. Of the 85 patients, 11 (12.9%) had no abnormality at admission on chest CT, including
10 (24.4%) of 41 nonpulmonary fibrosis patients and 1 (2.3%) of 44 pulmonary fibrosis patients (Table 2 and
Fig. 1). Most of the patients (68 [80%]) had the single form of ground-glass opacities in the process of disease,
while a few patients (10 [11.8%]) had the mixed form of ground-glass opacities and consolidation. Thirty-eight
(44.7%) patients had fibrosis on admission, and 2 had fibrosis before discharge. In the nonpulmonary fibrosis
group, the numbers of involved lobes were usually 1, 2, and 5. In contrast, the number of involved lobes in the
pulmonary fibrosis group was mainly 5. The total lung severity score of the pulmonary fibrosis group was higher
than that of the nonpulmonary fibrosis group at both stages of admission and discharge. Lesions were mainly
peripheral and central distribution in the pulmonary fibrosis group (20 [50.0%]) at admission and then turned
to peripheral distribution (27 [61.4%]) before discharge, whereas lesions were mainly peripherally distributed
in the nonpulmonary fibrosis group. Importantly, almost half of the pulmonary fibrosis patients exhibited linear
consolidation, bronchiectasis, and pleural incrassation in both stages of admission and discharge.
Then, we further evaluated the distribution of fibrosis in Covid-19 patients complicated with pulmonary fibro-
sis, including nonprogressive pulmonary fibrosis patients and progressive pulmonary fibrosis patients (Table 3,
Fig. 1c–f.). In the progressive pulmonary fibrosis group, on admission, 6 (20%) patients had no fibrosis, and
14 (46.7%) patients had fibrosis in 5 lobes. However, 23 (76.7%) patients had fibrosis involving 5 lobes before
discharge. Pulmonary fibrosis was widely distributed in both groups, especially in the left lower lobe and the
right lower lobe.
Proteomic and metabolomic analysis of Covid‑19 patients with pulmonary fibrosis. The
Q-Exactive HF (Thermo Fisher Scientific, San Jose, CA) instrument collected mass spectrometry data from 27
samples (randomly sampled from each group) in DIA mode (Table S2). A total of 8055 peptide fragments and
Scientific Reports | (2021) 11:14601 | https://doi.org/10.1038/s41598-021-94256-8 2
Vol:.(1234567890)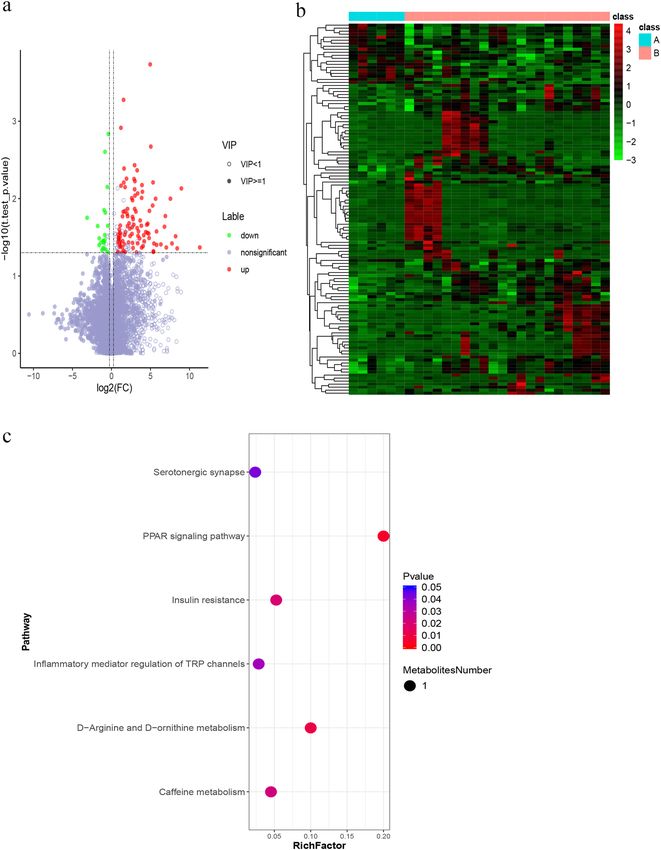
www.nature.com/scientificreports/
All patients Nonpulmonary fibrosis Pulmonary fibrosis
Finding Onset (n = 85) Endpoint (n = 71) Onset (n = 41) Endpoint (n = 31) Onset (n = 44) Endpoint (n = 40)
No abnormality 11 (12.9) 4 (5.6) 10 (24.4) 4 (12.9) 1 (2.3) 0 (0)
Lesion morphology
Ground-glass opaci-
68 (80) 59 (83.1) 26 (63.4) 20 (64.5) 42 (95.5) 39 (97.5)
ties
Ground-glass opaci-
ties with consolida- 10 (11.8) 3 (4.2) 6 (2.4) 0 (0) 4 (9.1) 3 (7.5)
tion
Fibrotic stripes 38 (44.7) 40 (56.3) 0 (0) 0 (0) 38 (86.4) 40 (100)
NO. of lobes affected
0 11 (12.9) 4 (5.6) 10 (24.4) 4 (12.9) 1 (2.3) 0 (0)
1 15 (17.6) 12 (16.9) 12 (29.3) 9 (29.0) 3 (6.8) 3 (7.5)
2 7 (8.2) 8 (11.3) 6 (14.6) 5 (16.1) 1 (2.3) 3 (7.5)
3 10 (11.8) 5 (7.0) 4 (9.8) 2 (6.5) 6 (13.6) 3 (7.5)
4 3 (3.5) 0 (0) 1 (2.4) 0 (0) 2 (4.5) 0 (0)
5 38 (44.7) 38 (53.5) 7 (17.1) 7 (22.6) 31 (70.5) 31 (77.5)
Total lung severity
score, median (inter- 4 (1.5–8.0) 5 (2.0–9.0) 2 (0.5–3.0) 2 (1.0–5.0) 7 (5.0–10.0) 6 (5.0–11.5)
quartile)
Distribution of lesions
Peripheral 33 (38.8) 31 (43.7) 17 (41.5) 11 (35.5) 16 (36.4) 20 (50.0)
Peripheral and
34 (40.0) 24 (33.8) 7 (17.1) 7 (22.6) 27 (61.4) 17 (42.5)
central
Other findings
Linear 50 (58.8) 44 (62.0) 11 (26.8) 9 (29.0) 39 (88.6) 35 (87.5)
Consolidation 27 (31.8) 18 (25.4) 1 (2.4) 1 (3.2) 26 (59.1) 17 (42.5)
Discrete pulmonary
15 (17.6) 8 (11.3) 9 (22.0) 5 (16.1) 6 (13.6) 3 (7.5)
nodules
Pulmonary emphy-
14 (16.5) 11 (15.5) 6 (14.6) 5 (16.1) 8 (18.2) 6 (15.0)
sema
Bronchiectasis 29 (34.1) 27 (38.0) 3 (7.3) 5 (16.1) 26 (59.1) 22 (55.0)
Pleural effusion 4 (4.7) 2 (2.8) 0 (0) 1 (3.2) 4 (9.1) 1 (2.5)
Pleural incrassation 43 (50.6) 37 (52.1) 6 (14.6) 5 (16.1) 37 (84.1) 32 (80)
Table 2. Chest CT findings of patients with Covid-19. Except where indicated, data are cases of patients, with
percentages in parentheses.
1079 proteins were quantified (Table S3). A heat map of the sample correlation analysis is shown in Fig. S1a.
After calculating the fold difference between Covid-19 patients with pulmonary fibrosis (n = 21) and Covid-19
patients without fibrosis (n = 6) by MSstats software, 20 differentially expressed proteins were found, including
13 downregulated and 7 upregulated proteins (Fig. 2a,b). GO and K EGG18 enrichment analysis indicated that
DEPs were related to the immune system, biological adhesion, and glycosaminoglycan degradation (Fig. S1b–d
and Table S4).
For metabolomic analysis, the data of positive and negative ions were collected from 28 samples (randomly
sampled from each group) to improve the metabolite coverage. The coefficient of variation (CV) plot shows that
there was a high degree of repeatability for samples (Fig. 3a,b). PLS-DA (Fig. 3c,d) was used to establish the rela-
tionship model between metabolite expression and sample types to predict sample categories and to determine
the differential metabolism among groups. A total of 3020 positive compounds with identification information
(Table S5) and 978 negative compounds were identified (Table S6), among which 102 positive compounds were
upregulated and 21 were downregulated (Fig. 4a), while 38 negative compounds were upregulated and 3 were
downregulated (Fig. S2a) between Covid-19 patients with pulmonary fibrosis (n = 22) and Covid-19 patients
without fibrosis (n = 6). The cluster analysis of different metabolites is shown in Fig. 4b and Fig. S2b. Based on the
KEGG database, pathways including the peroxisome proliferator-activated receptor (PPAR) signaling pathway,
D-arginine and D-ornithine metabolism, inflammatory mediator regulation of TRP channels and alpha-linolenic
acid metabolism were significantly enriched (Fig. 4c, S2c and Table S7).
Proteomic and metabolomic analyses of Covid‑19 patients with progressive pulmonary fibro‑
sis. To further search for factors related to the progression of pulmonary fibrosis, we divided the patients with
pulmonary fibrosis into a progressive group and a nonprogressive group and continued to conduct proteomic
and metabolomic tests on their serum. It was found that 34 proteins were differentially expressed between the
progressive pulmonary fibrosis Covid-19 patients (n = 16) and the nonprogressive pulmonary fibrosis Covid-19
patients (n = 5) (Fig. 5a). After clustering (Fig. 5b) and enrichment analysis of DEPs (Fig. 5c–e, and Table S4),
it was found that DEPs were mainly distributed in the immune system, including primary immunodeficiency,
Scientific Reports | (2021) 11:14601 | https://doi.org/10.1038/s41598-021-94256-8 3
Vol.:(0123456789)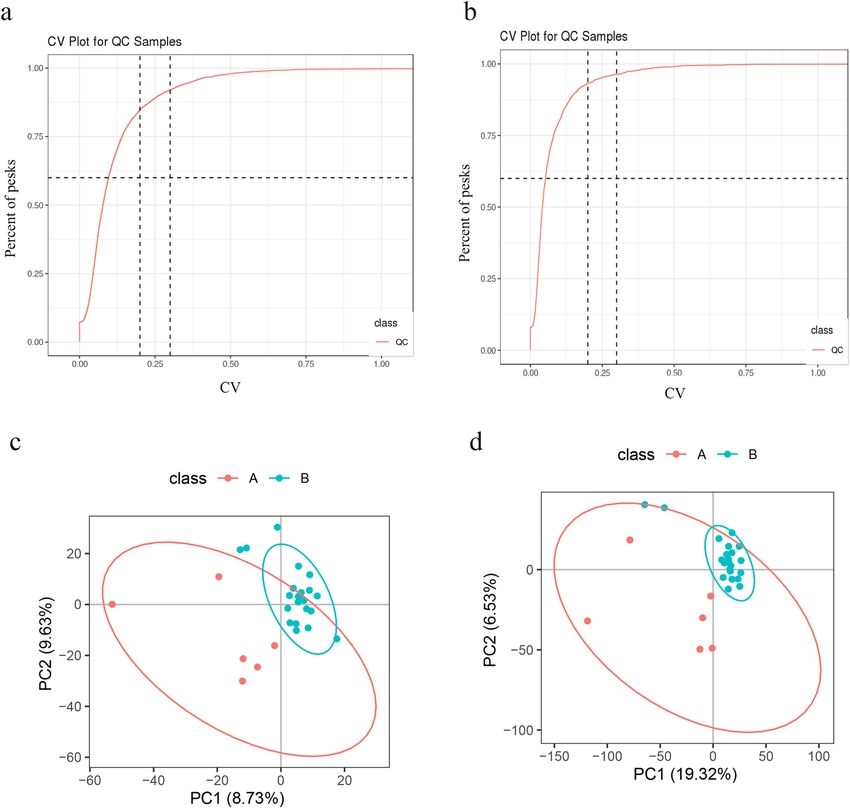
www.nature.com/scientificreports/
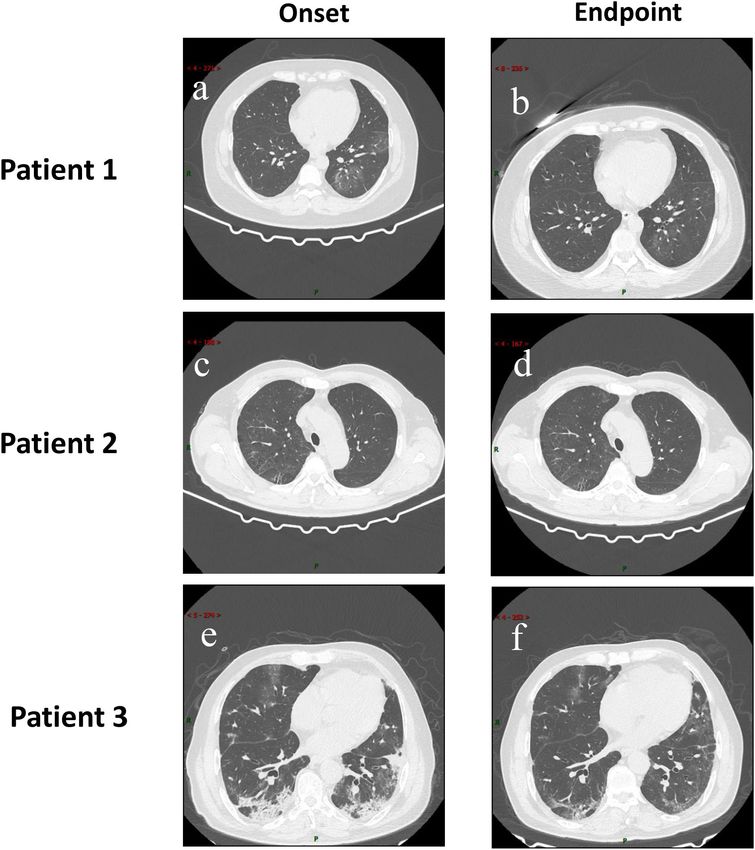
Figure 1. Representative chest CT images. (a) Ground-glass opacities in the dorsal segment of the left lower
lobe of lung were seen in a 44-year-old female on admission, and partial absorption of lung lesions before
discharge (b), Multiple fibrotic stripes shadows in dorsal segment of the lower lobe of the right lung were seen
in a 62-year-old male after symptom onset (c), however, no obvious changes were observed before discharge (d,
e), multiple fibrotic stripes shadows and patchy dense shadow (exudative lesion) were shown in a 65-year-old
severe male on admission. (f) The exudative lesions were less and the fibrosis lesions were more than before in
20 days after hospitalization.
intestinal immune network for IgA production, FcγR-mediated phagocytosis, natural killer cell-mediated cyto-
toxicity, the B cell receptor signaling pathway, and the FcεRI signaling pathway. Moreover, the NF-kappa B,
calcium, hematopoietic cell lineage, and phospholipase D signaling pathways were also involved.
Scientific Reports | (2021) 11:14601 | https://doi.org/10.1038/s41598-021-94256-8 4
Vol:.(1234567890)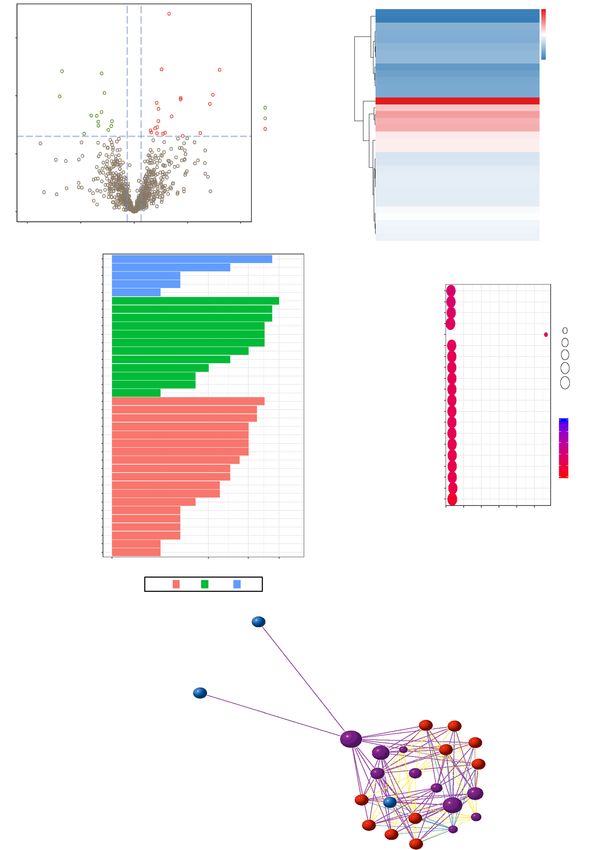
www.nature.com/scientificreports/

                                                                               All pulmonary fibrosis           Nonprogressive pulmonary        Progressive pulmonary
                                                                               patients (n = 40)                fibrosis (n = 10)               fibrosis (n = 30)
                                   Finding                                     Onset           Endpoint         Onset           Endpoint        Onset         Endpoint
                                   NO. of fibrotic lobes
                                   0                                           6 (15.0)        0 (0)            0 (0)           0 (0)           6 (20.0)      0 (0)
                                   1                                           3 (7.5)         2 (5.0)          2 (20.0)        2 (20.0)        1 (3.3)       0 (0)
                                   2                                           1 (2.5)         1 (2.5)          0 (0)           0 (0)           1 (3.3)       1 (3.3)
                                   3                                           6 (15.0)        4 (10.0)         2 (20.0)        2 (20.0)        4 (13.3)      2 (6.7)
                                   4                                           5 (12.5)        7 (17.5)         1 (10.0)        3 (30.0)        4 (13.3)      4 (13.3)
                                   5                                           19 (47.5)       26 (65.0)        5 (50.0)        3 (30.0)        14 (46.7)     23 (76.7)
                                   Frequency of fibrotic lobe involvement
                                   Right upper lobe                            22 (55.0)       31 (77.5)        6 (60.0)        5 (50.0)        16 (53.3)     26 (86.7)
                                   Right middle lobe                           28 (70.0)       34 (85.0)        7 (70.0)        7 (70.0)        21 (70.0)     27 (90.0)
                                    Right lower lobe                           32 (80.0)       36 (90.0)        9 (90.0)        7 (70.0)        23 (76.7)     29 (96.7)
                                    Left upper lobe                            27 (67.5)       34 (85.0)        6 (60.0)        7 (70.0)        21 (70.0)     27 (90.0)
                                    Left lower lobe                            31 (77.5)       39 (97.5)        9 (90.0)        9 (90.0)        22 (73.3)     30 (100.0)
                                   *Total pulmonary fibrosis severity score,
                                                                               5.0 (2.3–7.0)   7.0 (5.0–11.5)   5.0 (3.5–5.3)   4.5 (3.5–5.3)   6.0 (1.8–7)   8.0 (5.0–14.0)
                                   median (interquartile)

                                  Table 3.  Chest CT evaluations of Covid-19 complicated with pulmonary fibrosis patients. Except where
                                  indicated, data are cases of patients, with percentages in parentheses. *The corresponding score of each lobe in
                                  the five lobes was 0, 1, 2, 3, 4, respectively, and the corresponding affected area was 0, 1–25%, 26–50%, 51–75%,
                                  76–100%, which was referred to the total lung severity score.

                                  Figure 2.  Differentially expressed proteins (DEPs) were identified and clustered in Covid-19 patients with
                                  pulmonary fibrosis. (a) Volcano plots of total protein levels. Red dots, significantly upregulated proteins; green
                                  dots, significantly downregulated proteins. (b) Cluster chart of DEPs. Red rows, significantly upregulated
                                  proteins; blue rows present significantly downregulated proteins.

                                      In terms of the metabolomic analysis, we found that the PLS-DA model had a good prediction effect (Figs. 6a
                                  and S3a). A total of 511 differential positive metabolites and 160 negative metabolites were screened (Figs. 6b and
                                  S3b) between the progressive pulmonary fibrosis Covid-19 patients (n = 16) and the nonprogressive pulmonary
                                  fibrosis Covid-19 patients (n = 6) and clustered (Figs. 6c and S3c). Using the KEGG database, metabolic pathway
                                  enrichment analysis revealed the following pathways with differential metabolite enrichments: PPAR signaling

Scientific Reports |   (2021) 11:14601 |                    https://doi.org/10.1038/s41598-021-94256-8                                                                         5

                                                                                                                                                                         Vol.:(0123456789)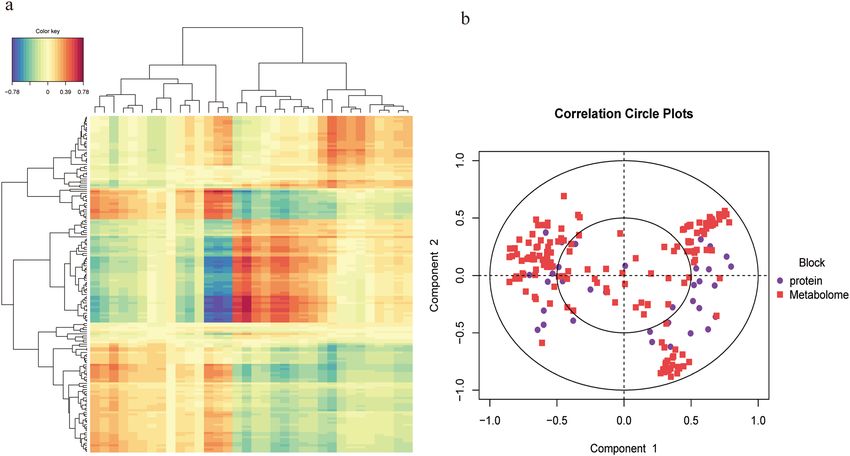
www.nature.com/scientificreports/

                                            Figure 3.  Quality control of samples in Covid-19 patients with pulmonary fibrosis. (a, b) Coefficient of
                                            variation (CV) plots for positive and negative ion modes. (c,d) PLS-DA model plots for positive and negative ion
                                            modes. A, Covid-19 patients without pulmonary fibrosis (n = 6). B, Covid-19 patients with pulmonary fibrosis
                                            (n = 22).

                                            pathway, mTOR signaling pathway, inflammatory mediator regulation of TRP channels, FcγR-mediated phago-
                                            cytosis, arginine metabolism, and alpha-Linolenic acid metabolism (Figs. 6d, S3d and Table S7).

                                            Correlation analysis between proteomics and metabolomics in Covid‑19 patients complicated
                                            with progressive pulmonary fibrosis. To further explore the relationship between biological network
                                            regulation, we conducted proteome and metabolomic association analyses between the nonprogressive pulmo-
                                            nary fibrosis group and the progressive pulmonary fibrosis group. By performing regularized canonical cor-
                                            relation analysis, correlation clustering of DEPs and differential metabolites can be observed in the heatmap
                                            (Fig. 7a). After multivariate dimensionality reduction and relationship visualization of omics (Fig. 7b), it was
                                            found that the DEPs and differential metabolites in pulmonary fibrosis group (n = 21) were correlated with each
                                            other.

                                            Discussion
                                            To our knowledge, this is the first paper describing an integrated multiomics study in Covid-19 complicated
                                            with pulmonary fibrosis patients at the molecular and ionic levels. First, after reviewing the medical records of
                                            85 Covid-19 patients hospitalized in the People’s Hospital of Guangxi Zhuang Autonomous Region Yongwu

          Scientific Reports |   (2021) 11:14601 |              https://doi.org/10.1038/s41598-021-94256-8                                                 6

Vol:.(1234567890)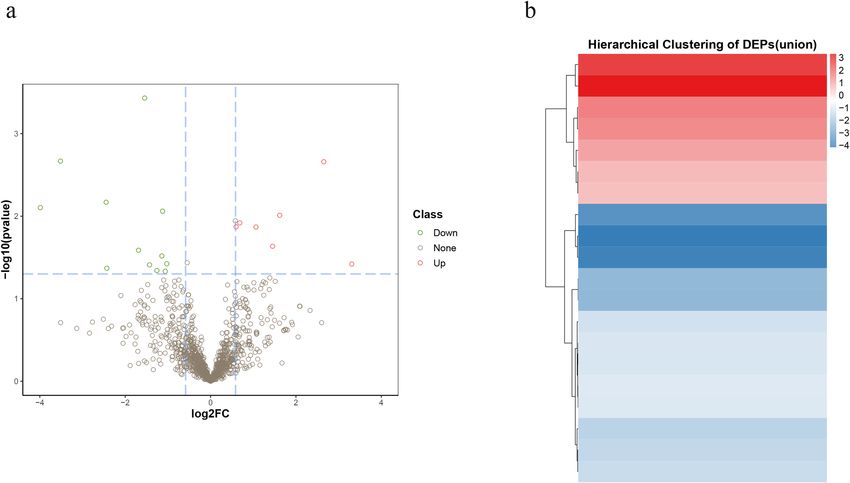
www.nature.com/scientificreports/
Figure 4. Positive differentially expressed metabolites were identified, clustered and enriched in Covid-19
patients with pulmonary fibrosis. (a) Volcano plots of positive compounds. Red dots, significantly upregulated
metabolites; green dots, significantly downregulated metabolites. (b) Heatmap of different positive metabolites
(“pheatmap” package in R software v3.5.0, https://www.r-project.org/). Each row denotes a different metabolite,
and each column denotes a sample. A, Covid-19 patients without pulmonary fibrosis (n = 6). B, Covid-19
patients with pulmonary fibrosis (n = 22). (c) Bubble plot of KEGG enrichment of positive metabolic pathways.
The size of the circle dot denotes the number of different metabolites. RichFactor is defined as the number of
differential metabolites annotated to the pathway divided by all identified metabolites annotated to the pathway.
Scientific Reports | (2021) 11:14601 | https://doi.org/10.1038/s41598-021-94256-8 7
Vol.:(0123456789)www.nature.com/scientificreports/
Figure 5. Differentially expressed proteins (DEPs) were identified and analyzed using proteomics in Covid-19
patients with progressive pulmonary fibrosis. (a) Volcano plots of total protein level. (b) Cluster chart of DEPs.
(c) Enrichment analysis of DEPs by GO function. (d) Bubble plot of the top 20 KEGG enrichment pathways
of DEPs. RichFactor is defined as the number of differential metabolites annotated to the pathways divided
by all identified metabolites annotated to the pathway. (e) Pathway network of DEPs (“igraph” package in R
software v3.5.0, https://www.r-project.org/). The red and blue dots represent up-regulated and down-regulated
differential proteins, respectively. The purple balls represent the top 10 pathways of enrichment. The area is
directly proportional to the enrichment degree.
Scientific Reports | (2021) 11:14601 | https://doi.org/10.1038/s41598-021-94256-8 8
Vol:.(1234567890)www.nature.com/scientificreports/
Figure 6. Positive differentially expressed metabolites were identified and analyzed using proteomics in Covid-
19 patients with progressive pulmonary fibrosis. (a) PLS-DA model plot for positive ion mode. (b) Volcano plots
of positive compounds. (c) Heatmap of different positive metabolites (“pheatmap” package in R software v3.5.0,
https://www.r-project.org/). (d) Bubble plot of the top 20 KEGG enrichment of positive metabolic pathways.
C, Nonprogressive pulmonary fibrosis of Covid-19 patients. D, Progressive pulmonary fibrosis of Covid-19
patients. RichFactor is defined as the number of differential metabolites annotated to the pathway divided by all
identified metabolites annotated to the pathway.
branch, we found that as many as 44.7% of the patients had fibrotic stripe shadows in the early onset, and the
incidence rate was close to that of SARS outbreaks in 200319. The most common manifestations of chest CT in
Covid-19 fibrosis in our 85 cases were summarized as follows: lesions located in bilateral lower lobes, involved
in five lobes, and complicated with linear consolidation, bronchiectasis, and pleural incrassation, which partially
agreed with a previous report6. Second, we described the detailed profile of CT images in Covid-19 complicated
with pulmonary fibrosis patients, especially focusing on progressive pulmonary fibrosis patients. Third, using
proteomics and metabonomics methods, we explored the mechanism of the information pathway related to the
occurrence and development of progressive fibrosis, which is expected to predict disease progression and to
provide evidence for targeted therapy.
In recent years, proteomics has become an accurate method to screen disease biomarkers20 and has also been
used in the pathogenesis of SARS-CoV-2 infection16,17. In this study, we found significant differential expression
levels of immune system and biological adhesion markers and glycosaminoglycan degradation in pulmonary
fibrosis patients. Previous experimental and clinical data demonstrated that the accumulation and deposition
of glycosaminoglycan in the extracellular matrix contributed to progressive pulmonary fi brosis21,22. Moreover,
glycosaminoglycan hyaluronan (HA) on AEC2s (stem cells in the adult lung) is critical for restoring renewal
brosis23. The general properties of cell adhesion molecules (CAMs) involve
capacity and limiting the scope of fi
cell recruitment; they participate in cell–cell interactions and cell-extracellular matrix interactions24 and then
promote the formation of fibrosis by intervention in the m icroenvironment25. For example, platelet/endothelial
cell adhesion molecule-1 (PECAM-1) is expressed at intercellular junctions on platelets and leukocytes, includ-
ing NK cells, T cells, monocytes and neutrophils26, which are involved in chemokine-mediated migration to the
inflammatory site27. Moreover, PECAM-1 participates in the maintenance and restoration of vascular integrity
following alveolar-capillary barrier disruption in A RDS28. In addition, CAMs modulate signal transduction by
roteins29. However, the results of this omics analysis are limited. The specific
interacting with extracellular matrix p
adhesion molecule biomarkers and the occurrence of diseases need further accurate detection.
Scientific Reports | (2021) 11:14601 | https://doi.org/10.1038/s41598-021-94256-8 9
Vol.:(0123456789)www.nature.com/scientificreports/
Figure 7. Association analysis of proteomics and metabolomics in Covid-19 patients with progressive
pulmonary fibrosis. (a) Cluster heat map of the correlation between proteomics and metabolomics (“pheatmap”
package in R software v3.5.0, https://www.r-project.org/). Each row denotes a differentially expressed metabolite,
and each column denote a DEP. Blue, negative correlation; Red, positive correlation. (b) Concentric circles of
correlation between differential proteins and differential metabolites. If the angle between a differential protein
and differential metabolite is an acute angle (less than 90 degrees), the correlation is positive. If the angle
between the differential protein and the differential metabolite is an oblique angle (greater than 90 degrees and
less than 180 degrees), the correlation is negative. Starting from the center of the circle, the lines are connected
to the differential metabolites and differential proteins. The longer the connection length, the stronger the
relationship.
It has been well documented that the immune system plays an important role in the occurrence and devel-
opment of fibrosis30,31 and Covid-1932. The association of FCGR3B (encodes the lgG receptor FcγRIIIb) copy
number variations with susceptibility to idiopathic pulmonary fibrosis (IPF) has been previously reported33.
FcγR binds to serum amyloid P (SAP), inhibits the differentiation of monocytes into fi brocytes30,31 and affects
30 2+
neutrophil adhesion . Moreover, SAP binds to C a -dependent ligands to induce FcγR-mediated phagocytosis
in vivo34. Recently, it was reported that segregated-nucleus-containing atypical monocytes, which were derived
from FcεRI+ granulocyte/macrophage progenitors, were involved in fi brosis35. NK cells lacking FcεRIγ are associ-
ated with lower levels of fibrosis36. Furthermore, samples from 18 patients with IPF showed that the proportion
of Breg cells (i.e., Breg cells to total B cells) was decreased, even though this proportion was positively correlated
with the diffusion capacity of the l ungs37. Consistent with the results of the above references, our study supported
the cross-regulation among pathways of the immune system, calcium signaling and cell adhesion.
As a member of the nuclear receptor and transcription factor family, PPAR is a classical receptor for diabetic
therapy38. However, recent emerging literature suggests a correlation between PPAR and lung fi brosis39–41. Activa-
tion of the PPARγ pathway provided protection against organ fibrosis in the lung. PPAR agonists are beneficial in
treating preclinical models such as bleomycin-induced pulmonary fi brosis42 and genetically engineered m ice43.
Moreover, inhibiting PPARγ promoted fibroproliferative ARDS, which was observed in clinical bronchoalveolar
lavage fluid (BAL) samples44. Our results from both pulmonary fibrosis patients and progressive pulmonary
fibrosis patients in metabolomic analysis confirmed the differential expression of the PPAR signaling pathway,
which suggested that PPAR signaling is a core pathway in the formation and development of lung fibrosis. TRP
channels respond to a series of heterogeneous stimuli and are essential for pathophysiological homeostasis45.
It has been reported that TRP channels participate in lung disease mainly through calcium signaling, recruit-
ment of proinflammatory cells, and neurogenic inflammatory pathways46. In our study, pathway enrichment
revealed that inflammatory mediator regulation of the TRP channel was an important pathway to regulate the
occurrence and development of pulmonary fibrosis. Both arginine and ornithine are essential components in
the urea cycle. L-arginine is the precursor of nitric oxide47, which is involved in the vascular system48. Treatment
with L-arginine protects against pulmonary fibrosis progression in a mouse m odel49. D-arginine is an inactive
form of L-arginine. The results from our study indicated that lung fibrosis was associated with dysfunction of
the urea cycle metabolic pathway. D-arginine and D-ornithine could be used as an early warning and a sign of
progression of pulmonary fibrosis disease.
Scientific Reports | (2021) 11:14601 | https://doi.org/10.1038/s41598-021-94256-8 10
Vol:.(1234567890)www.nature.com/scientificreports/
This study has several limitations. First, although the 85 Covid-19 cases were all confirmed patients in our
hospital, their numbers are relatively few and cannot represent the whole of China or the international situa-
tion or even secondary infection. Second, the CV of proteomics was large because the samples were taken from
patients’ serum. Third, the immune system, PPAR, and TRP pathways screened by proteomics and metabonom-
ics in this study need to be further verified in vivo and in vitro, while the pathways related to nervous system
diseases need to be further explored, although it has been reported that Covid-19 patients have nervous system
damage50. Fourth, long-term follow-up of the progression of fibrosis is required.
In conclusion, in this study, proteomics, metabonomics, and correlation analysis were used to screen the
related pathways of fibrosis formation and progression in Covid-19 patients, and the results showed that pathways
including the immune system (especially the action of FcγR-mediated phagocytosis), PPAR signaling, TRP-
inflammatory pathways, and the urea cycle were closely related. Our data provide new ideas for the treatment
of Covid-19 and fibrosis patients.
Methods
Patient involvement and data collection. For this retrospective, single-center study, we recruited
patients from Jan 15 to Mar 17, 2020, at the branches of the People’s Hospital of Guangxi Zhuang Autono-
mous Region (Yongwu Hospital), a designated hospital for patients infected with SARS-CoV-2 in Guangxi
Province. According to the guidelines of the National Health Commission of China, a case of confirmed infec-
tion with SARS-CoV-2 was diagnosed51. Patients enrolled in this study were laboratory confirmed. The study
was approved by the ethics committee of the People’s Hospital of Guangxi Zhuang Autonomous Region, China
(KY-LW-2020–22) and was conducted in accordance with the Declaration of Helsinki. Informed consent was
obtained from all patients.
Laboratory confirmation. Specimens including nasal and pharyngeal swabs were collected for SARS-
CoV-2 detection by real-time polymerase chain reaction (RT-PCR). Briefly, after total RNA was extracted by
nucleic acid extraction and separation reagent (Sansure Biotech Inc., Changsha, China), one-step RT-PCR
(bioPerfetus Technologies Co., Taizhou, China and Shanghai BioGerm Medical Technology Co., Shanghai,
China) was performed using the following conditions: 50 °C for 10 min and 95℃ for 5 min, 40 cycles at 95 °C
for 10 s and 55 °C for 40 s. The viral nucleic acid testing for patients was performed in the clinical laboratory of
the People’s Hospital of Guangxi Zhuang Autonomous Region Yongwu branch. Laboratory findings, including
hematological and serological parameters and serum biochemistry, were traced.
Chest CT. Eighty-five patients were imaged with a 64-detector row SOMATOM go. Top (Siemens Health-
ineers, Germany). The patient was in the supine position, and the images were collected at the end of inspira-
tion. Chest CT was assessed at two time points: on admission and before discharge (or death). All images were
independently reviewed by two radiologists with more than 5 years of working experience, and the final results
were determined by consensus the two doctors.
Each image was evaluated for the following features: lesion morphology, fibrosis, number of lobes affected,
total lung severity score, distribution of lesions, and other findings, including linear consolidation, discrete
pulmonary nodules, pulmonary emphysema, bronchiectasis, pleural effusion and pleural incrassation. The total
lung severity score was obtained by adding the involvement of each l obe52,53. The corresponding scores of each
lobe in the five lobes were 0, 1, 2, 3, and 4, and the corresponding affected areas were 0, 1–25%, 26–50%, 51–75%,
and 76–100%.
According to whether there were fibrosis bands on chest CT, the patients were divided into nonpulmo-
nary fibrosis and pulmonary fibrosis groups. The latter group includes the nonprogressive pulmonary fibrosis
group and the progressive pulmonary fibrosis group, based on the increased severity of fibrotic pulmonary lobe
involvement.
Proteome analysis. Serum samples were placed at 56 °C (water bath) for 30 min to inactivate the SARS-
CoV-2 virus and were prepared as previously described with some modifications16. One hundred microliters
of serum sample was denatured in 900 μL of L3 buffer containing 7 M urea, 2 M thiourea and 20 mM Tris (pH
8–8.5). The serum protein was extracted by the two following reactions: dithiothreitol (10 mM) at 37 °C (water
bath) for 30 min and iodoacetamide at room temperature for 30 min (dark condition). The protein was enriched
by a C18 column (Waters, USA) at a flow rate of 3 mL/min, washed with 0.1% formic acid (FA) and 75% ACN,
and then dried in 75% ACN. Isolated proteins were digested with 1:20 trypsin overnight at 37 °C.
Peptides were fractionated using an LC-20AB system (Shimadzu, Japan) for high-pH reversed-phase frac-
tionation and separated on a Gemini C18 column (5 μm × 4.6 mm × 250 mm; Waters, USA) using a multistep
gradient from 5 to 95% buffer B (95% ACN, pH 9.8) at a flow rate of 1 mL/min for 64 min. Eluting peptides were
collected every min, which were combined with a chromatographic elution peak diagram. Then, all the fractions
were combined into a total of 10 fractions, which were then frozen and dried.
The fractions were redissolved in buffer A (2% ACN and 0.1% FA) and separated on an UltiMate 3000
UHPLC (Thermo Fisher Scientific) equipped with a C18 column (150 μm i.d, 1.8-μm particles, 35 cm long;
Waters, USA). Peptides were eluted by a gradient from 5 to 80% buffer B. For data-dependent acquisition (DDA)
mode detection, peptides were ionized by a nanoESI source and were then introduced into a Q-Exactive HF
tandem mass spectrometer (Thermo Fisher Scientific, San Jose, CA) at a spray voltage of 1.9 kV. The MS spectra
(350–1500 m/z) were acquired at a resolution of 120,000, a maximum injection time (MIT) of 100 ms and an
AGC target value of 3 × 10⁶. The M
S2 spectra (350–1500 m/z) were acquired at a resolution of 120,000, an MIT
Scientific Reports | (2021) 11:14601 | https://doi.org/10.1038/s41598-021-94256-8 11
Vol.:(0123456789)www.nature.com/scientificreports/
of 100 ms and an AGC target value of 1 × 10⁵. The data were identified using the Andromeda integrated by Max-
Quant, and then the spectrum library was established.
For data-independent acquisition (DIA) mode detection, the same nano-LC system and gradient was used
as DDA analysis. Briefly, the MS spectra (400–1250 m/z) were acquired at a resolution of 120,000, an MIT of
50 ms and an AGC target value of 1 × 10⁶. The ion fragmentation mode was HCD, the MIT was selected as auto-
matic mode, the fragment ions were detected in Orbitrap, and the resolution was set to 30,000. The fragmenta-
tion energy was distributed as follows: 22.5, 25, 27.5. The data were analyzed and controlled by the mProphet
algorithm.
Metabolome analysis. The metabolites of serum samples were extracted by internal labeling and with a
mixture of methanol and ACN at a ratio of 2:1. Ten microliters of supernatant from each sample was mixed into
QC quality control samples to evaluate the repeatability and stability of the LC–MS analysis process. A Waters
2D UPLC (Waters, USA) series Q Exactive HF high-resolution mass spectrometer (Thermo Fisher Scientific,
USA) was used for the separation and detection of metabolites.
A 5-μL aliquot of sample solution was injected on a BEH C18 column (100 mm × 2.1 mm, 1.7 μm; Waters,
USA). The column oven was maintained at 55 °C. The positive ion mode mobile phases were aqueous solution
containing 0.1% formic acid (A solution) and 100% methanol containing 0.1% formic acid (B solution). The
negative ion mode mobile phase consisted of aqueous solution containing 10 mM ammonium formate (C solu-
tion) and 95% methanol containing 10 mM ammonium formate (D solution). The following gradient was used
for elution: 0–1 min, 2% B/D solution; 1–9 min, 2–98% B/D solution; 9–12 min, 98% B/D solution; 12–12.1 min,
98–2% B/D solution; 12.1–15 min, 2% B/D solution. The flow rate was 0.35 mL/min. The range of mass spec-
trometry scanning with mass nucleus ratio was 70–1050, the first-stage resolution was 120,000, the AGC was
3 × 10⁶, and the MIT was 100 ms. According to the parent ion strength, top3 was selected for fragmentation, and
secondary information was collected. The secondary resolution was 30,000, the AGC was 1 × 10⁵, and the MIT
was 50 ms. The stepped energy was set to 20, 40, and 60 eV. The ion source was set at the following conditions:
sheath gas flow rate, 40; aux gas flow rate, 10; spray voltage positive ion mode, 3.8; spray voltage negative ion
mode, 3.2; capillary temperature, 320 °C; aux gas heater temperature, 350 °C.
Statistical analysis. Continuous variables are represented as medians with interquartile ranges, while cat-
egorical variables are expressed as counts (%). The statistical analyses were performed using SPSS 13.0.
DDA data were identified by MaxQuant 1.5.3.30 (Max Planck Institutes) software and the UniProtKB/Swiss-
Prot Homo sapiens database. Identification information that met FDR ≤ 1% was used to build the final library. The
parameters were selected as follows: enzyme: trypsin; minimal peptide length: 7; PSM-level FDR: 0.01; protein
FDR: 0.01; fixed modifications: carbamidomethyl (C); variable modifications: oxidation (M), acetyl (protein
N-term). DIA data were analyzed by Spectronaut (Biognosys) software, which used iRT peptide to correct the
retention time. Then, based on the target-decoy model applicable to SWATH-MS, the false-positive control was
completed at FDR 1% to obtain significant quantitative results. The R package MSstats (Bioconductor) screened
differential proteins according to the fold change > 1.5 and P value < 0.05, while screened differential metabolites
according to variable importance for the projection (VIP) ≥ 1, fold change ≥ 1.2 or ≤ 0.83, and P value < 0.05.
Meanwhile, differential proteins and differential metabolites were enriched by network pathway analysis database:
gene ontology (GO) (http://w ww.g eneon
tolog y.o
rg.) and the kyoto encyclopedia of genes and genomes (KEGG).
The protein–protein interaction network of the difference proteins was analyzed by STRING database (http://
string-db.org). DEPs and differential metabolites were calculated by regularized canonical correlation analysis
and were visualized using the plotVar functions in the mixOmics package.
Data availability
The mass spectrometry proteomics data have been deposited to the ProteomeXchange Consortium (http://prote
omecentral.proteomexchange.org) via the iProX partner repository54 with the dataset identifier PXD024311. All
data are fully available without restriction.
Received: 1 December 2020; Accepted: 29 June 2021
References
1. Wu, Y. et al. SARS-CoV-2 is an appropriate name for the new coronavirus. Lancet 395, 949–950 (2020).
2. WHO. Novel coronavirus disease named COVID-19. https://w ww.w ho.i nt/e merge ncies/d
iseas es/n
ovel-c orona virus-2 019. Accessed
11 Feb 2020.
3. WHO. Coronavirus disease (COVID-19) weekly epidemiological update and weekly operational update. https://www.who.int/
emergencies/diseases/novel-coronavirus-2019/situation-reports/. Accessed 25 Oct 2020.
4. Lurie, N., Saville, M., Hatchett, R. & Halton, J. Developing Covid-19 vaccines at pandemic speed. N. Engl. J. Med. 382, 1969–1973
(2020).
5. Zhu, F. C. et al. Safety, tolerability, and immunogenicity of a recombinant adenovirus type-5 vectored COVID-19 vaccine: a dose-
escalation, open-label, non-randomised, first-in-human trial. Lancet 395, 1845–1854 (2020).
6. Xu, Y. H. et al. Clinical and computed tomographic imaging features of novel coronavirus pneumonia caused by SARS-CoV-2. J.
Infect. 80, 394–400 (2020).
7. Bradley, B. T. et al. Histopathology and ultrastructural findings of fatal COVID-19 infections in Washington State: a case series.
Lancet 396, 320–332 (2020).
8. George, P. M., Patterson, C. M., Reed, A. K. & Thillai, M. Lung transplantation for idiopathic pulmonary fibrosis. Lancet Respir.
Med. 7, 271–282 (2019).
9. Li, F. Receptor recognition mechanisms of coronaviruses: a decade of structural studies. J. Virol. 89, 1954–1964 (2015).
Scientific Reports | (2021) 11:14601 | https://doi.org/10.1038/s41598-021-94256-8 12
Vol:.(1234567890)www.nature.com/scientificreports/
10. Qiao, B. & de la Olvera, C. M. Enhanced binding of SARS-CoV-2 spike protein to receptor by distal polybasic cleavage sites. ACS
Nano 14, 10616–10623 (2020).
11. Ganter, M. T. et al. Interleukin-1beta causes acute lung injury via alphavbeta5 and alphavbeta6 integrin-dependent mechanisms.
Circ. Res. 102, 804–812 (2008).
12. Shimbori, C. et al. Mechanical stress-induced mast cell degranulation activates TGF-β1 signalling pathway in pulmonary fibrosis.
Thorax 74, 455–465 (2019).
13. Li, M. et al. Epithelium-specific deletion of TGF-β receptor type II protects mice from bleomycin-induced pulmonary fibrosis. J.
Clin. Invest. 121, 277–287 (2011).
14. Azuma, A. et al. Interferon-β inhibits bleomycin-induced lung fibrosis by decreasing transforming growth factor-β and throm-
bospondin. Am. J. Respir. Cell Mol. Biol. 32, 93–98 (2005).
15. King, T. E. Jr. et al. Effect of interferon gamma-1b on survival in patients with idiopathic pulmonary fibrosis (INSPIRE): a multi-
centre, randomised, placebo-controlled trial. Lancet 374, 222–228 (2009).
16. Shen, B. et al. Proteomic and metabolomic characterization of COVID-19 patient sera. Cell 182, 59–72 (2020).
17. Bojkova, D. et al. Proteomics of SARS-CoV-2-infected host cells reveals therapy targets. Nature 583, 469–472 (2020).
18. Kanehisa, M. & Goto, S. KEGG: kyoto encyclopedia of genes and genomes. Nucleic Acids Res. 28, 27–30 (2000).
19. Antonio, G. E. et al. Thin-section CT in patients with severe acute respiratory syndrome following hospital discharge: preliminary
experience. Radiology 228, 810–815 (2003).
20. Geyer, P. E., Holdt, L. M., Teupser, D. & Mann, M. Revisiting biomarker discovery by plasma proteomics. Mol. Syst. Biol. 13, 942
(2017).
21. Bensadoun, E. S., Burke, A. K., Hogg, J. C. & Roberts, C. R. Proteoglycan deposition in pulmonary fibrosis. Am. J. Respir. Crit.
Care Med. 154, 1819–1828 (1996).
22. Li, Y. et al. Hyaluronan synthase 2 regulates fibroblast senescence in pulmonary fibrosis. Matrix Biol. 55, 35–48 (2016).
23. Liang, J. et al. Hyaluronan and TLR4 promote surfactant-protein-C-positive alveolar progenitor cell renewal and prevent severe
pulmonary fibrosis in mice. Nat. Med. 22, 1285–1293 (2016).
24. Cavallaro, U. & Dejana, E. Adhesion molecule signalling: not always a sticky business. Nat. Rev. Mol. Cell Biol. 12, 189–197 (2011).
25. Harjunpää, H., Llort, A. M., Guenther, C. & Fagerholm, S. C. Cell adhesion molecules and their roles and regulation in the immune
and tumor microenvironment. Front. Immunol. 10, 1078 (2019).
26. Marelli-Berg, F. M., Clement, M., Mauro, C. & Caligiuri, G. An immunologist’s guide to CD31 function in T-cells. J. Cell Sci. 126,
2343–2352 (2013).
27. Privratsky, J. R., Newman, D. K. & Newman, P. J. PECAM-1: conflicts of interest in inflammation. Life Sci. 87, 69–82 (2010).
28. Villar, J., Zhang, H. & Slutsky, A. S. Lung repair and regeneration in ARDS: role of PECAM1 and wnt signaling. Chest 155, 587–594
(2019).
29. Watson, W. H., Ritzenthaler, J. D. & Roman, J. Lung extracellular matrix and redox regulation. Redox Biol. 8, 305–315 (2016).
30. Cox, N., Pilling, D. & Gomer, R. H. Distinct Fcγ receptors mediate the effect of serum amyloid p on neutrophil adhesion and
fibrocyte differentiation. J. Immunol. 193, 1701–1708 (2014).
31. Pilling, D., Buckley, C. D., Salmon, M. & Gomer, R. H. Inhibition of fibrocyte differentiation by serum amyloid P. J. Immunol. 171,
5537–5546 (2003).
32. Song, J. W. et al. Immunological and inflammatory profiles in mild and severe cases of COVID-19. Nat. Commun. 11, 3410 (2020).
33. Bournazos, S. et al. Copy number variation of FCGR3B is associated with susceptibility to idiopathic pulmonary fibrosis. Respira-
tion 81, 142–149 (2011).
34. Castaño, A. P. et al. Serum amyloid P inhibits fibrosis through Fc gamma R-dependent monocyte-macrophage regulation in vivo.
Sci. Transl. Med. 1, 5ra3 (2009).
35. Satoh, T. et al. Identification of an atypical monocyte and committed progenitor involved in fibrosis. Nature 541, 96–101 (2017).
36. Oh, J. S. et al. NK cells lacking FcεRIγ are associated with reduced liver damage in chronic hepatitis C virus infection. Eur. J.
Immunol. 46, 1020–1029 (2016).
37. Asai, Y. et al. Aberrant populations of circulating T follicular helper cells and regulatory B cells underlying idiopathic pulmonary
fibrosis. Respir. Res. 20, 244 (2019).
38. Gross, B., Pawlak, M., Lefebvre, P. & Staels, B. PPARs in obesity-induced T2DM, dyslipidaemia and NAFLD. Nat. Rev. Endocrinol.
13, 36–49 (2017).
39. Kheirollahi, V. et al. Metformin induces lipogenic differentiation in myofibroblasts to reverse lung fibrosis. Nat. Commun. 10, 2987
(2019).
40. Bargagli, E. et al. Metabolic dysregulation in idiopathic pulmonary fibrosis. Int. J. Mol. Sci. 21, 5663 (2020).
41. Landi, C. et al. A system biology study of BALF from patients affected by idiopathic pulmonary fibrosis (IPF) and healthy controls.
Proteomics Clin. Appl. 8, 932–950 (2014).
42. Avouac, J. et al. Pan-PPAR agonist IVA337 is effective in experimental lung fibrosis and pulmonary hypertension. Ann. Rheum.
Dis. 76, 1931–1940 (2017).
43. El Agha, E. et al. Two-way conversion between lipogenic and myogenic fibroblastic phenotypes marks the progression and resolu-
tion of lung fibrosis. Cell Stem Cell 20, 261–273 (2017).
44. Jain, M. et al. Leptin promotes fibroproliferative acute respiratory distress syndrome by inhibiting peroxisome proliferator-activated
receptor-γ. Am. J. Respir. Crit. Care Med. 183, 1490–1498 (2011).
45. Steinritz, D., Stenger, B., Dietrich, A., Gudermann, T. & Popp, T. TRPs in tox: involvement of transient receptor potential-channels
in chemical-induced organ toxicity-a structured review. Cells 7, 98 (2018).
46. Grace, M. S., Baxter, M., Dubuis, E., Birrell, M. A. & Belvisi, M. G. Transient receptor potential (TRP) channels in the airway: role
in airway disease. Br. J. Pharmacol. 171, 2593–2607 (2014).
47. Moncada, S. & Higgs, A. The L-arginine-nitric oxide pathway. N. Engl. J. Med. 329, 2002–2012 (1993).
48. Mehta, S., Stewart, D. J., Langleben, D. & Levy, R. D. Short-term pulmonary vasodilation with L-arginine in pulmonary hyperten-
sion. Circulation 92, 1539–1545 (1995).
49. Gao, L. et al. Combination of L-Arginine and L-Norvaline protects against pulmonary fibrosis progression induced by bleomycin
in mice. Biomed. Pharmacother. 113, 108768 (2019).
50. Ellul, M. A. et al. Neurological associations of COVID-19. Lancet Neurol 19, 767–783 (2020).
51. China NHCO. New coronavirus pneumonia diagnosis and treatment scheme (6th edn). https://www.gov.cn/zhengce/zhengceku/
2020-02/19/content_5480948htm. Accessed 18 Feb 2020.
52. Chung, M. et al. CT imaging features of 2019 novel coronavirus (2019-nCoV). Radiology 295, 202–207 (2020).
53. Bernheim, A., et al. Chest CT findings in coronavirus disease-19 (COVID-19): relationship to duration of infection. Radiology
295, 200463 (2020).
54. Ma, J. et al. iProX: an integrated proteome resource. Nucleic Acids Res 47, D1211–D1217 (2019).
Acknowledgements
This study was supported by the National Natural Science Foundation of China (81960246, 81701089, 81560044,
30860113, 81960026 and 82003967), the Guangxi Natural Science Foundation (2017GXNSFBA198010 and
Scientific Reports | (2021) 11:14601 | https://doi.org/10.1038/s41598-021-94256-8 13
Vol.:(0123456789)www.nature.com/scientificreports/
2020GXNSFAA238003), the Guangxi Medical and Health Appropriate Technology Research and Development
Project (S2020076, S201422-01 and S2019087), and the Shanxi Health Research Project (2019165).
Author contributions
J.R.Y., C.X.C., W.C., W.S.L. and M.Z. designed the research study and had full access to all data in this study.
C.X.C., W.C., L.Y.H., Z.F., K.Y., and L.W.L. collected the data. J.R.Y., C.X.C., and W.C. drafted the manuscript
and summarized all data. Z.H.N. and X.Z. analyzed the data. All authors reviewed the manuscript.
Competing interests
The authors declare no competing interests.
Additional information
Supplementary Information The online version contains supplementary material available at https://doi.org/
10.1038/s41598-021-94256-8.
Correspondence and requests for materials should be addressed to W.L. or M.Z.
Reprints and permissions information is available at www.nature.com/reprints.
Publisher’s note Springer Nature remains neutral with regard to jurisdictional claims in published maps and
institutional affiliations.
Open Access This article is licensed under a Creative Commons Attribution 4.0 International
License, which permits use, sharing, adaptation, distribution and reproduction in any medium or
format, as long as you give appropriate credit to the original author(s) and the source, provide a link to the
Creative Commons licence, and indicate if changes were made. The images or other third party material in this
article are included in the article’s Creative Commons licence, unless indicated otherwise in a credit line to the
material. If material is not included in the article’s Creative Commons licence and your intended use is not
permitted by statutory regulation or exceeds the permitted use, you will need to obtain permission directly from
the copyright holder. To view a copy of this licence, visit http://creativecommons.org/licenses/by/4.0/.
© The Author(s) 2021
Scientific Reports | (2021) 11:14601 | https://doi.org/10.1038/s41598-021-94256-8 14
Vol:.(1234567890)You can also read