Imaging slow brain activity during neocortical and hippocampal epileptiform events with electrical impedance tomography - IOPscience
←
→
Page content transcription
If your browser does not render page correctly, please read the page content below
Physiological Measurement

PAPER • OPEN ACCESS

Imaging slow brain activity during neocortical and hippocampal
epileptiform events with electrical impedance tomography
To cite this article: Sana Hannan et al 2021 Physiol. Meas. 42 014001

View the article online for updates and enhancements.

                               This content was downloaded from IP address 46.4.80.155 on 01/08/2021 at 09:37
Physiol. Meas. 42 (2021) 014001 https://doi.org/10.1088/1361-6579/abd67a
PAPER
Imaging slow brain activity during neocortical and hippocampal
OPEN ACCESS
epileptiform events with electrical impedance tomography
RECEIVED
31 October 2020
Sana Hannan1,∗ , Kirill Aristovich1 , Mayo Faulkner2 , James Avery3 , Matthew C Walker4 and
REVISED
21 December 2020
David S Holder1
1
Department of Medical Physics and Biomedical Engineering, University College London, United Kingdom
ACCEPTED FOR PUBLICATION
2
23 December 2020 Wolfson Institute for Biomedical Research, University College London, United Kingdom
3
Department of Surgery and Cancer, Imperial College London, United Kingdom
PUBLISHED 4
4 February 2021
UCL Queen Square Institute of Neurology, University College London, United Kingdom
∗
Author to whom any correspondence should be addressed.
Original content from this
E-mail: sana.hannan@ucl.ac.uk
work may be used under
the terms of the Creative Keywords: seizure, epilepsy, electrical impedance tomography, neocortex, hippocampus, slow activity
Commons Attribution 4.0
licence.
Any further distribution of
this work must maintain Abstract
attribution to the
author(s) and the title of
Objective. Electrical impedance tomography (EIT) is an imaging technique that produces tomographic
the work, journal citation images of internal impedance changes within an object using surface electrodes. It can be used to
and DOI.
image the slow increase in cerebral tissue impedance that occurs over seconds during epileptic
seizures, which is attributed to cell swelling due to disturbances in ion homeostasis following
hypersynchronous neuronal firing and its associated metabolic demands. In this study, we
characterised and imaged this slow impedance response during neocortical and hippocampal
epileptiform events in the rat brain and evaluated its relationship to the underlying neural activity.
Approach. Neocortical or hippocampal seizures, comprising repeatable series of high-amplitude ictal
spikes, were induced by electrically stimulating the sensorimotor cortex or perforant path of rats
anaesthetised with fentanyl-isoflurane. Transfer impedances were measured during 30 consecutive
seizures, by applying a sinusoidal current through independent electrode pairs on an epicortical array,
and combined to generate an EIT image of slow activity. Main results. The slow impedance responses
were consistently time-matched to the end of seizures and EIT images of this activity were
reconstructed reproducibly in all animals (p
Physiol. Meas. 42 (2021) 014001                                                                           S Hannan et al

as deep as the hippocampus with a spatiotemporal resolution of 2 ms and ∼300 μm from the rat cortical surface
(Hannan et al 2020a). However, this method requires averaging of repetitive neural events over long recording
periods to obtain an adequate signal-to-noise ratio (SNR) for imaging (Aristovich et al 2018, Hannan et al
2020a). An alternative approach is to use EIT to image the slower impedance signal that occurs secondarily to
neural activity on a timescale of seconds during seizures. Due to the greater magnitude of this signal, and
therefore the lack of needing to average, it could potentially be used to image epileptic activity in real time which
would increase the applicability of EIT for use in clinical settings and in vivo research. This study focused on
characterising and imaging this slow impedance response during seizures.

1.1. Background
1.1.1. Physiological basis of impedance changes during epileptiform activity
There are two main impedance changes which occur during epileptic seizures that may be imaged with EIT: the
‘fast neural’ and ‘slow’ responses. The fast neural impedance response occurs on a timescale of milliseconds
and is due to the opening of voltage- and ligand-gated ion channels in the cell membrane of active neurons
(Klivington and Galambos 1967, Oh et al 2011). This allows current to pass into the intracellular space, leading
to a transient impedance decrease in the neural tissue (Aristovich et al 2016). The slow increase in cerebral tissue
impedance that occurs over seconds during seizures has been reported during chemically and electrically
induced seizures across several species (Van Harreveld and Schadé 1962, Elazar et al 1966, Olsson et al 2006).
This impedance increase is attributed to cell swelling which arises as a result of the high metabolic demands of
intense neuronal activity during ictal events and causes the active cerebral tissue to outrun its available energy
supplies, giving rise to anoxic depolarisation (Andrew and MacVicar 1994, Dzhala et al 2000, Dreier et al 2011).
This state of uncontrolled neuronal depolarisation is induced by loss of regulation of the membrane sodium-
potassium adenosine triphosphatase (Na+/K+-ATPase) pump which is normally responsible for maintaining
the cell resting membrane potential (Hansen 1985, Balestrino 1995, Hille 2001). The resulting disturbance of ion
homeostasis thus generates an osmotic gradient, leading to the movement of water from the extracellular space
into the intracellular compartment, causing cell swelling (Hansen 1985, Hille 2001, Ullah et al 2015). When
applied to cerebral tissue at a carrier frequency
Physiol. Meas. 42 (2021) 014001                                                                            S Hannan et al

images showed neural impedance changes every 2 ms over a 40 ms epoch during a single averaged ictal spike.
Due to the need for averaging, however, fast neural EIT currently requires seizures with highly reproducible ictal
spikes and does not enable imaging over the course of the entire seizure.

1.1.2.2. Imaging the slow impedance change
Imaging the slow impedance response over the course of a seizure may present a method for overcoming the
limitations of fast neural EIT. At any given carrier frequency of injected current, the amplitude of the slow
impedance response is up to ten times larger than that of the fast neural impedance change during averaged ictal
discharges (Rao 2000, Vongerichten et al 2016, Hannan et al 2018b). As a result, slow impedance responses can
be imaged over epochs that encompass entire seizures ( 90 s) without requiring averaging. Moreover, this
approach may ultimately enable single-shot imaging of individual seizures using parallel multifrequency EIT, in
which current is injected simultaneously through multiple electrode pairs at different carrier frequencies
(Dowrick et al 2015). Imaging fast neural activity is not currently possible with parallel EIT because all chosen
frequencies of injected current would need to be separated by 500 Hz, the required bandwidth for getting a
2 ms temporal resolution. Further, the magnitude and SNR of the fast neural impedance response is
dramatically reduced at carrier frequencies above 2 kHz which severely limits the number of parallel current
injections that can be used for producing fast neural EIT images (Hannan et al 2018b). In contrast, the slow
impedance change can be imaged with a 1 s temporal resolution, meaning that a bandwidth as low as 1 Hz
around the carrier frequency can be used to extract the signal. Because the magnitude and SNR of the slow
impedance change is not significantly different across frequencies in the 1–10 kHz range, hundreds of
simultaneous current injections could theoretically be utilised for reconstructing an EIT image of the slow
activity during a single seizure with high spatial accuracy (Hannan et al 2018b, Hannan 2019). This method
would be highly beneficial for any clinical or research application in which seizures occur infrequently or
unpredictably. However, the slow impedance response is typically a secondary phenomenon that occurs as a by-
product of the neural event itself. Therefore, prior to implementing EIT protocols aimed at imaging this slow
activity, it is important to characterise its spatiotemporal features and validate that it is indeed representative of
the fast neural activity during the epileptiform event and thus a reliable biomarker of the ictal onset zone. This
was addressed in the present study.

1.1.3. In vivo models of epileptiform activity
For evaluating the technical accuracy of EIT for imaging impedance responses during seizures, the induced
epileptiform events need to have a consistent well-defined focal origin and be highly reproducible in their
electrographic characteristics. For these reasons, the neocortical and hippocampal epileptic afterdischarge
models were selected. In these models, electrical stimulation of the sensorimotor cortex or perforant path results
in the immediate induction of epileptiform events lasting 10 s on demand, which will henceforth be referred to
as ‘seizures’, with foci localised to the facial somatosensory cortex or dentate gyrus, respectively (Hannan et al
2020b). As such, use of these models enabled assessment of slow and fast impedance changes at two different
depths of activity. In addition, the induced seizures comprised trains of ictal spikes which exhibited a high degree
of repeatability and thus were suitable for averaging; this was required to image fast neural impedance changes
for direct comparison to the concurrently imaged slow activity during seizures.

1.2. Purpose
This study was aimed at determining whether EIT can be used to image slow impedance responses during
seizures, from the surface of the rat cortex, and evaluating the potential of the imaged slow activity to act as a
valid indicator of the epileptogenic zone. Specific sub-questions to address were as follows.

 (i) What are the spatiotemporal features of the slow activity imaged during seizures and how do these compare
     to the simultaneously obtained EEG recordings and fast neural EIT images?
(ii) Can this method be used to image deeper epileptiform activity in the hippocampus as well as superficial
     neocortical activity?

1.3. Experimental design
Impedance measurements during neocortical and hippocampal epileptic seizures were previously recorded
from the surface of the cerebral cortex of anaesthetised rats using a planar epicortical electrode array (Hannan
et al 2018a, 2020a). Since the induced neocortical and hippocampal seizures were highly reproducible and
remained electrographically stable over time, it was possible to obtain an impedance recording during each
seizure using an independent pair of EIT current-injecting electrodes. A single imaging protocol comprised at
least 30 sequential impedance measurements obtained in 30 consecutive neocortical or hippocampal seizures.

                                                3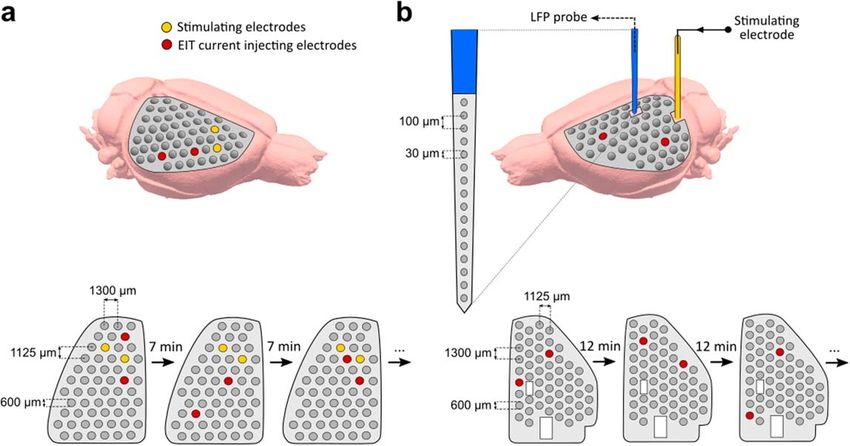
Physiol. Meas. 42 (2021) 014001                                                                       S Hannan et al

The EIT recordings contained both the slow and fast neural impedance signals which can be extracted from the
raw data using a bandpass filter with differing bandwidths around the carrier frequency, namely, ±1 Hz and
±500 Hz, respectively. The fast neural EIT measurements obtained from these datasets have previously been
imaged (Hannan et al 2018a, 2020a) and are reused here only for direct comparison to the concomitant slow
impedance changes during seizures. The imaged slow activity was assessed for reproducibility across animals
and compared to fast neural reconstructions using centre-of-mass analysis. Further analysis was performed to
determine whether the slow impedance changes were correlated to fast neural impedance changes and EEG
recordings obtained during neocortical and hippocampal seizures. As such, we were able to establish whether
the slow impedance response can be used as a reliable and more robust biomarker of the hypersynchronous
neural activity underlying epileptiform events that can overcome the limitations of fast neural EIT.

2. Materials and methods

2.1. Data collection
This study utilised two datasets that were collected previously. For retrospective analysis of slow impedance data
from neocortical seizures, we used data from experiments performed in five female Sprague-Dawley rats
(300–450 g) by Hannan et al (2018a). For analysis of slow impedance data from hippocampal seizures, we used
data generated in five female Sprague-Dawley rats (405–460 g) by Hannan et al (2020a). Please refer to these
previous studies for a detailed description of methods employed in the neocortical and hippocampal imaging
experiments (Hannan et al 2018a, 2020a). A brief overview of the experimental procedures, provided for reader
convenience, is as follows.
     Rats were anaesthetised with fentanyl-isoflurane and a planar epicortical electrode array was implanted on
the cortical surface of one hemisphere. For neocortical imaging experiments, a 57-electrode epicortical array was
used and seizures were elicited by electrically stimulating the sensorimotor cortex. For hippocampal imaging
experiments, the epicortical array contained 54 electrodes and two openings for implanting: (a) a stimulating
depth electrode targeting the perforant path to induce focal hippocampal seizures, and (b) a 16-channel local
field potential (LFP) probe for recording from the dentate gyrus to confirm the presence of ictal activity. Seizures
were induced by stimulating the sensorimotor cortex or perforant path, respectively, with 100 Hz trains of
biphasic square-wave pulses in accordance with the adapted neocortical and hippocampal epileptic
afterdischarge models (Hannan et al 2020b). Minimum inter-train intervals of 7 and 12 min, respectively,
ensured that baseline activity was restored after seizure induction and that seizure patterns remained
electrographically stable during experiments. If any motor manifestations of seizures were observed, rats were
paralysed prior to commencing EIT recordings with pancuronium bromide (1 mg kg−1), administered
intravenously. As such, the EEG and EIT recordings remained uncontaminated by movement artefacts. During
each seizure, ECoG/LFP and EIT data were obtained simultaneously. For the latter, a sinusoidal current was
applied to a pair of epicortical electrodes and voltage measurements were obtained for the resulting current
pattern from all other electrodes on the epicortical array. The parameters for EIT measurements were chosen for
the initial purpose of imaging fast neural impedance changes, which are approximately ten times smaller in
magnitude than the slow impedance responses that were obtained simultaneously and extracted from the same
datasets (Hannan et al 2018b). For neocortical seizures, the EIT current was applied at an amplitude of 50 μA and
a carrier frequency of 1.725 kHz, in accordance with a previous in vivo EIT study in which these parameters were
used to successfully image fast neural impedance changes during physiological activity in the rat neocortex
(Aristovich et al 2016). Because the sensitivity of EIT to impedance changes is known to decrease with distance
from the electrodes, the SNR of hippocampal impedance changes as measured from the cortical surface is
expected to be considerably lower than that of cortical impedance changes (Faulkner et al 2018b). Therefore, it
was important to use optimal recording parameters to maximise the chances of imaging fast neural ictal activity
in the hippocampus using epicortical electrodes. For this reason, we used EIT current with an amplitude of
100 μA in the hippocampal imaging experiments; this is the highest current level that can be applied
continuously to the rat cerebral cortex without affecting the amplitude or latency of neural activity or causing
structural damage to the cortical tissue (Oh et al 2011, Hannan et al 2019). Additionally, current was applied at
1.355 kHz, the optimal carrier frequency for imaging impedance changes during epileptiform events (Hannan
et al 2018b). Use of these parameters resulted in successful imaging of both the fast and slow impedance changes
during neocortical and hippocampal ictal activity, thereby enabling their direct comparison. A full EIT protocol
consisted of at least 30 sequential impedance measurements, each obtained during a single seizure with an
independent electrode pair for current injection (figure 1). Control recordings were used to confirm that the
measured impedance responses were not artefactual and were indeed caused by the evoked seizures. These
included baseline EEG and impedance recordings, obtained prior to stimulus application, and full post-mortem
EIT protocols. All animal handling and experimental investigations were ethically approved by the UK Home

                                              4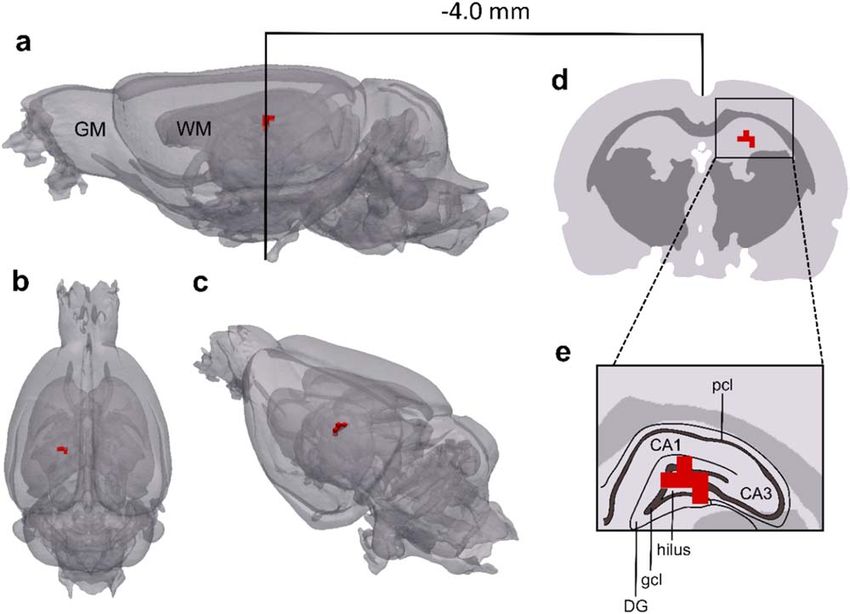
Physiol. Meas. 42 (2021) 014001                                                                                                  S Hannan et al

   Figure 1. Schematic of experimental setup for recording EEG and impedance data during neocortical and hippocampal seizures. (a)
   Neocortical seizures were induced by electrically stimulating the sensorimotor cortex with a 5 s train of 100 Hz biphasic square-wave
   pulses. The stimulus train was delivered through two electrodes (yellow) on a 57-electrode planar array implanted on the exposed
   cortical surface of the rat brain. A sinusoidal current was simultaneously applied to another electrode pair (red) on the array to obtain
   EIT measurements. For each of 30 induced seizures, a different electrode pair was used for EIT current injection; the positions of these
   electrodes were varied to ensure adequate sampling of cerebral tissue. A 7 min rest period between stimulus trains was required for
   seizures to remain electrographically stable during experiments. (b) To induce hippocampal seizures, stimulation with a 2 s train of
   the same pulse waveform was directed to the perforant path through a stimulating depth electrode. The resulting seizures were
   recorded from their foci in the dentate gyrus using a 16-channel LFP probe. A 54-electrode epicortical array, containing two
   rectangular openings for implanting the stimulating electrode and LFP probe, was used to obtain EIT measurements during the
   induced seizures. A 12 min rest period between stimulus trains was required for seizures to remain stable.

Office and performed in accordance with its regulations, as outlined in the Animals (Scientific Procedures)
Act 1986.

2.2. Analysis of EEG and impedance data
All recordings were taken during a time window that included the seizure as well as 10 s pre-stimulation
and 30 s post-ictal baseline periods. The raw voltage measurements contained the EEG and fast and slow
impedance data; these were extracted with different filters. The ECoG and LFP signals were extracted by
applying a first order, high-pass filter at 1 Hz, a Butterworth filter at 1 kHz (low-pass, fifth order), and a notch
filter at 50 Hz (IIR, second order). The slow impedance signals were extracted by applying a ±1 Hz bandpass
Butterworth filter (third order) either side of the carrier frequency, 1.725 kHz for neocortical seizures and
1.355 kHz for hippocampal seizures, which yielded a 1 s temporal resolution. The fast impedance signals were
obtained previously by applying a ±500 Hz bandpass Butterworth filter (fifth order) around the carrier
frequency in recordings from neocortical (Hannan et al 2018a) and hippocampal seizures (Hannan et al 2020a);
this fast neural data is used here only for direct comparison to concomitant slow impedance changes during
seizures. The slow impedance signals were demodulated using the Hilbert transform and processed for image
reconstruction. Please refer to previous studies for a detailed description of the analysis of the fast neural EIT
signal during neocortical and hippocampal ictal discharges (Hannan et al 2018a, 2020a).
     Seizures were defined as the sudden appearance of abnormal electrographic activity in the ECoG or LFP
traces for neocortical and hippocampal seizures, respectively, which had a minimum duration of 10 s and
comprised a series of high-amplitude (>2 times baseline activity) rhythmic ictal discharges. The seizure start
time was marked by the first of these ictal discharges and seizure duration was defined as the time period between
the first and last ictal discharge. ECoG and LFP recordings were used to confirm that the foci and electrographic
patterns of seizures remained stable over the course of the EIT protocol so that impedance data from multiple
seizures, obtained using different spatial configurations of current-injecting electrodes, could be combined to
reconstruct an image of the slow impedance change during a typical neocortical or hippocampal ictal event.
     The slow impedance change (dZ) that occurred during each seizure could be visualised in the demodulated
impedance traces. The impedance trace recorded from each channel was normalised to the baseline dZ, defined
as the mean amplitude during the 5 s period immediately preceding delivery of the electrical stimulus for seizure
induction. Current-injecting and disconnected channels were identified and rejected from further analysis. dZ

                                                          5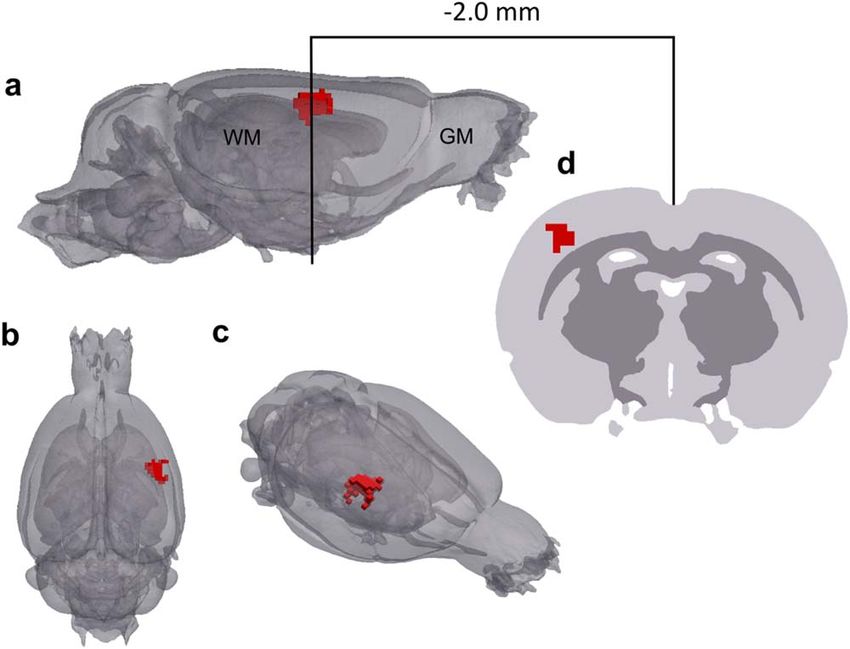
Physiol. Meas. 42 (2021) 014001 S Hannan et al measurements from all other epicortical electrode channels were collated across the 30 seizures by aligning the traces with respect to the start of the seizure and truncating the recordings according to the length of the seizure with the shortest duration recorded during a given EIT protocol. These processed dZ measurements were then used to generate an EIT image of slow activity during a neocortical or hippocampal seizure in each animal. 2.3. Tomographic reconstruction of slow impedance changes during seizures EIT images of slow activity over the course of the entire seizure were reconstructed using 1650 processed voltages for neocortical seizures and 1560 processed voltages for hippocampal seizures. The total numbers of these voltage traces were determined by the number of epicortical channels available for recording during each impedance measurement. For every current injection protocol, the forward solution and the resulting Jacobian matrix were calculated on a finite element method (FEM) mesh of the rat brain, which contained 2.9 million tetrahedral elements, using the PEITS forward solver (Jehl et al 2015). Tissue conductivity values within the mesh were set to 0.3, 0.15 and 1.79 Sm−1 for the grey matter, white matter and cerebrospinal fluid, respectively (Ranck 1963, Baumann et al 1997, Latikka et al 2001, Horesh 2006). Imaging was performed using the time- difference EIT approach, based on the principle that most modelling errors cancel out when a reference baseline measurement is subtracted from the data measurement (Brown 2003). As such, the overall effects of the chosen conductivity values for the grey matter, white matter and cerebrospinal fluid in the rat brain mesh on the final reconstructed images are minimal (Brown 2003, Jehl et al 2016). The inverse problem was computed using an inversion of the Jacobian matrix. Images of slow activity were reconstructed at 1 s time steps for the entire seizure epoch on a 300 μm hexahedral mesh. Zeroth-order Tikhonov regularisation with noise-based correction was used for image reconstruction after selecting the regularisation parameter through generalised cross-validation (Tikhonov et al 1995, Aristovich et al 2014). The reconstructed conductivity values in each voxel were expressed as t-score (δσ) for visualisation. To calculate this, the conductivity change was divided by the computed standard deviation of the estimated conductivity change in a given element due to random Gaussian noise, in accordance with a previously described noise-based correction approach (Aristovich et al 2014). 2.4. Analysis of reconstructed images To assess the reproducibility of the reconstructed slow activity during neocortical and hippocampal seizures, population statistics were undertaken in each group of five rats. Active voxels, defined as δσ 3 (p < 0.01), were labelled in each reconstruction and the volume of active voxels that were common to all five animals (p
Physiol. Meas. 42 (2021) 014001 S Hannan et al
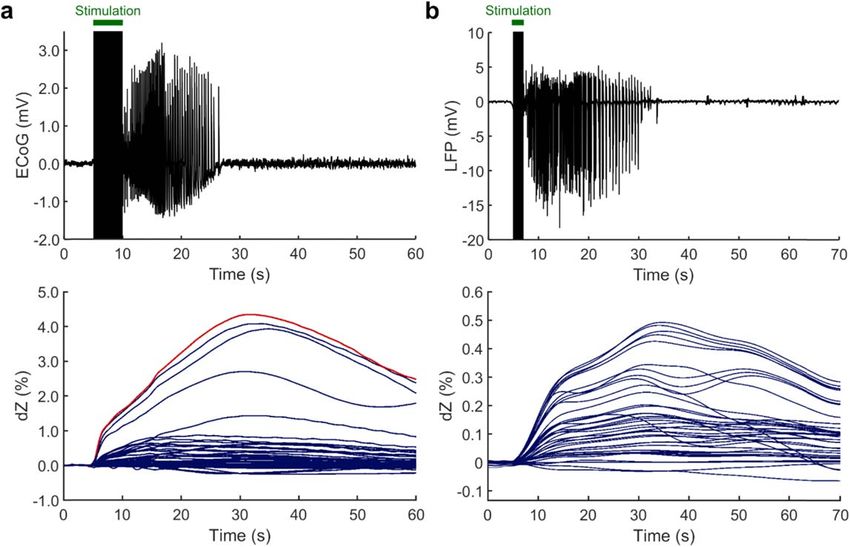
Figure 2. Slow impedance changes during neocortical and hippocampal seizures. (a) Representative ECoG (top) and impedance (dZ,
bottom) recordings obtained using epicortical electrodes on the 57-electrode planar array during a neocortical seizure. The ECoG
trace was recorded from one electrode on the array that lay above the ictal focus in the facial somatosensory cortex; the corresponding
dZ trace from this same electrode is marked in red. The 5 s electrical stimulation period is marked with a green bar. (b) Representative
LFP (top) and dZ (bottom) recordings during a hippocampal seizure. The LFP trace was recorded from an electrode on the 16-channel
depth probe positioned at the ictal focus within the dentate granule cell layer and the dZ traces were recorded from electrodes on the
54-electrode epicortical array. The 2 s electrical stimulation period is marked with a green bar.
peak, the slow dZ proceeded to return to baseline until the end of the recording. Although it was not always
possible to see a complete return to baseline by the end of the recording epoch, a distinct peak in the slow dZ was
observed consistently for every seizure. In all induced seizures, the maximal slow impedance change and the
highest-amplitude ictal discharges in the ECoG traces were both recorded from the same electrode on the
epicortical array, which lay above the facial somatosensory cortex and corresponded to the ictal focus.
Hippocampal seizures had a mean duration of 28.3±9.5 s and were characterised by a rhythmic pattern of
high-amplitude granule cell population spikes, with a focus in the dentate granule cell layer of the hippocampus,
at a frequency of 30–50 Hz (n=162 seizures, N=5 rats). As with the neocortical seizures, the dZ response to
hippocampal seizures was marked by a slow increase in impedance that was in phase with LFP recordings of the
seizure obtained from the dentate gyrus. The slow dZ reached a maximal amplitude of 0.52% ± 0.06%
(figure 2(b)) at 29.7±9.2 s relative to the beginning of the seizure, which was followed by a decrease towards
baseline.
3.2. EIT images of slow activity during neocortical and hippocampal seizures
EIT images of the slow impedance response during neocortical and hippocampal seizures were reconstructed at
1 s time steps over a total period of 0 s to 60 s, where 0 s corresponded to the seizure start time. This time period
encompassed the entire seizure in addition to a post-ictal baseline period. For neocortical seizures, the earliest
significant slow activity was observed at 3 s within the barrel cortex area of the primary somatosensory cortex
(S1) (figure 3; n = 168 seizures, N = 5 rats). This early activity was 3 mm posterior to the sensorimotor cortical
region (M1/S1 HL) that was electrically stimulated to induce seizures and increased in volume between 3 and
21 s as the seizure progressed. During the seizure, the slow activity propagated posterolaterally and ventrally.
After the peak response at 21 s, the volume of active voxels gradually decreased until 39 s, at which point no more
significant activity was observed in the rest of the image.
For hippocampal seizures, the onset of slow activity occurred at 3 s within the dorsal region of the dentate
gyrus and its structural centre in the anteroposterior axis (figure 4; n = 162 seizures, N = 5 rats). The active
volume then increased over the course of the seizure, propagating in the medial and ventral directions and
reaching a peak at 30 s. At this time point, the reconstructed activity encompassed most of the dentate gyrus and
7Physiol. Meas. 42 (2021) 014001 S Hannan et al
Figure 3. EIT image of the slow impedance response during a neocortical seizure. Frames are displayed at 3 s time intervals over a 39 s
epoch. The onset of activity occurs at 3 s in the whisker representation within the S1 cortical area and subsequently propagates in the
posterolateral and ventral directions. The peak response is seen at 21 s, after which the size of the active volume decreases. 0 s
corresponds to the seizure start time, as determined by simultaneously obtained ECoG measurements. δσ represents the t-score of the
conductivity changes.
8Physiol. Meas. 42 (2021) 014001 S Hannan et al
Figure 4. EIT image of the slow impedance response during a hippocampal seizure. Frames are displayed at 3 s time intervals over a
45 s epoch. The onset of activity occurs at 3 s in the dentate gyrus and subsequently propagates in the medial and ventral directions.
The peak response is seen at 30 s, after which the size of the active volume decreases. 0 s corresponds to the seizure start time, as
determined by simultaneously obtained LFP measurements. δσ represents the t-score of the conductivity changes.
9Physiol. Meas. 42 (2021) 014001 S Hannan et al Figure 5. Population statistics for EIT images of slow activity during neocortical seizures. Sagittal (a), dorsal (b) and anterolateral (c) views of the mesh in which active voxels in the reconstructed slow activity during neocortical seizures that are common across animals are shown (red) at the time point of peak δσ, corresponding to 21 s relative to the start of the seizure (p
Physiol. Meas. 42 (2021) 014001 S Hannan et al Figure 6. Population statistics for EIT images of slow activity during hippocampal seizures. Sagittal (a), dorsal (b) and posterolateral (c) views of the mesh in which active voxels in the reconstructed slow activity during hippocampal seizures that are common across animals are shown (red) at the time point of maximal δσ, corresponding to 30 s relative to the start of the seizure (p0.01) but was significantly correlated to the time taken to reach the peak slow dZ (figure 8(c); r=0.88, p
Physiol. Meas. 42 (2021) 014001 S Hannan et al Figure 7. Correlation analysis of slow impedance changes, fast neural impedance changes and ECoG recordings during neocortical seizures. Scatterplots showing the relationship between: (a) the peak ECoG amplitude of the averaged ictal spike in the neocortical seizures and the peak amplitude of the slow dZ (r=0.74, p0.01); (c) seizure duration and the time taken to reach the peak slow dZ, measured from the beginning of the seizure (r=0.95, p
Physiol. Meas. 42 (2021) 014001 S Hannan et al Figure 8. Correlation analysis of slow impedance changes, fast neural impedance changes and LFP recordings during hippocampal seizures. Scatterplots showing the relationship between: (a) the peak LFP amplitude of the averaged ictal spike in the hippocampal seizures and the peak amplitude of the slow dZ (r=–0.71, p0.01); (c) seizure duration and the time taken to reach the peak slow dZ, measured from the beginning of the seizure (r=0.88, p
Physiol. Meas. 42 (2021) 014001 S Hannan et al
For the hippocampal EIT experiments, the LFP probe was not modelled when computing the forward
solution. This is unlikely to have any effect on the final image because time-difference EIT data were being
reconstructed so that the effects of any such modelling errors on the final image were minimal (Brown 2003,
Jehl et al 2016). Additionally, there was a statistically significant spatially distinct volume of common active
voxels which reconstructed to the expected location across all rats in these experiments (pPhysiol. Meas. 42 (2021) 014001 S Hannan et al
ECoG or LFP recordings. Additionally, the peak amplitudes of the slow and fast neural dZ were significantly
correlated and the peak slow dZ was consistently time-matched to the end of the seizure. However, the
magnitude of this slow impedance increase was not significantly related to seizure duration. These findings
support the view that the slow impedance response during seizures is caused by cell swelling following extensive
ion translocation and water movement from the intracellular to extracellular space, as a result of a disturbance in
ion homeostasis due to the high metabolic demands of excessive neuronal activity, and that the extent of cell
swelling is proportional to the degree of hypersynchronous neuronal firing underlying the epileptiform event
(Andrew and MacVicar 1994, Dzhala et al 2000, Dreier et al 2011). The lack of correlation between the seizure
duration and the magnitude of the slow impedance response may be explained by the fact that the amount of cell
swelling that occurs in the implicated neural tissue becomes saturated once the maximum capacity for cells to
swell is reached, which can occur even before the end of the seizure (Ullah et al 2015). Therefore, the extent of cell
swelling, and thus the size of the associated impedance response, may reach its maximal value as a result of the
sustained high-frequency neuronal depolarisation during the seizure, regardless of the total seizure duration.
The slow impedance response was reconstructed reproducibly, with a temporal resolution of 1 s, in EIT
images of neocortical and hippocampal seizures. For the former, the slow activity was localised to the S1 facial
somatosensory cortex. This is consistent with the established importance of facial projections within the
somatosensory cortex for the initiation and expression of spike-and-wave activity during neocortical seizures, as
shown in previous studies that have employed genetic absence epilepsy models (Sitnikova and van
Luijetelaar 2004, Meeren et al 2005, Polack et al 2009). Unlike the fast neural EIT images of averaged SWDs
which displayed a bimodal spatial profile of activation (Hannan et al 2018a), the slow impedance changes
reconstructed over the course of the seizure were unimodal in nature and consisted of a single active volume
which increased in size as the seizure progressed. This difference may be explained by the fact that it was
inherently different patterns of activity, with differing biophysical properties, that were being imaged in the two
setups. Whereas the fast neural EIT images showed significant neural activity during a single ictal SWD,
constructed from averaging many individual repeatable SWDs during the seizure to obtain an adequate SNR for
imaging, the slow activity displayed the metabolic changes which occur secondarily to neural activity over the
course of the entire seizure. The neocortical seizures occasionally also contained other more variable ictal
discharges, such as sharp waves and polyspike complexes, in addition to the repeatable SWDs that were
identified and averaged for fast neural imaging. Therefore, it is possible that the significant slow activity observed
at the FWHM threshold is localised to the neural tissue in which metabolic demands are particularly heightened
during the seizure and thus represents the general epicentre of the several patterns of epileptiform activity that
occur as the seizure evolves over time. In contrast, the fast neural reconstructions reflect the activation of specific
neural circuits implicated in SWDs, the only type of ictal discharge that was seen consistently in all seizures in all
animals and was thus suitable for averaging; this may explain why a second volume of activity is seen in fast
neural EIT images ∼4 ms after the first (Hannan et al 2018a). Nevertheless, the position of the centre of mass of
the reconstructed slow activity corresponded to (a) the centre of mass of the most anterior of the two volumes of
fast neural activity, which was the largest volume of active voxels and also occurred at an earlier time point than
the second volume of activity, as well as (b) the true ictal focus of seizures, as determined by ECoG recordings.
This suggests that the positions of the seizure onset zone localised using slow and fast neural EIT were in
agreement and matched its true location.
For hippocampal seizures, the slow impedance response was reconstructed to the dentate gyrus. This is
consistent with the mechanisms underlying granule cell population spikes, the fundamental component of
seizures induced by electrically stimulating the perforant path, each of which is the electrophysiological
manifestation of action potential synchronisation from a given population of dentate granule cells (Andersen
et al 1971, Bragin et al 1997, Shepherd 2004). The localisation accuracy of the reconstructed slow activity,
determined by comparing its centre of mass to the true ictal focus as determined by LFP recordings from the
dentate granule cell layer, was 200 μm. This contrasted to a localisation accuracy of 400 μm obtained in fast
neural EIT images of averaged ictal granule cell population spikes (Hannan et al 2020a). The slow impedance
response, therefore, offers a superior localisation accuracy for imaging epileptiform activity in deeper brain
regions from the cortical surface.
4.3. Depth sensitivity of EIT for imaging slow impedance changes
The depth sensitivity of fast neural EIT for imaging ictal events from the surface of the cerebral cortex has been
shown to extend to the hippocampus in the rat (∼3 mm), corresponding to >1/3 of the total brain depth
(Hannan et al 2020a). The present study suggested that, at this same depth, hippocampal ictal events can be
localised with improved accuracy (400 μm to 200 μm) if the slow impedance response is imaged instead. This
can be attributed to the greater magnitude of slow impedance changes, which are approximately ten times larger
than their fast neural counterparts. Although a comprehensive analysis of the depth resolution of EIT for
15Physiol. Meas. 42 (2021) 014001 S Hannan et al
imaging epileptiform activity was outside the scope of this study, our results suggest that imaging the slow
impedance signal in deeper brain structures (>3 mm from the cortical surface) is promising. While fast neural
activity in the thalamus during somatosensory evoked potentials cannot be imaged with EIT (Faulkner et al
2018b), the greater magnitude of the slow impedance response may render it possible to image thalamic
epileptiform activity using non-penetrating epicortical electrodes. If the proposed EIT approach was translated
to the clinical setting and a comparable arrangement of epicortical electrodes was implemented, the depth
sensitivity of this method would scale up to enable imaging of the slow impedance response in at least the outer
third of the human brain (Faulkner et al 2018b, Hannan et al 2020a). The volume of epileptogenic tissue
implicated in seizure generation is expected to be larger in humans than in rats due to the comparatively larger
anatomy of the human brain (Witkowska-Wrobel et al 2018, Hannan 2019). Additionally, subdural grids that
are used clinically in the presurgical evaluation of epilepsy patients can contain as many as 64 electrodes, each
with a typical diameter of 2–4 mm (Wyler 1992, Diehl and Lüders 2000, Voorhies and Cohen-Gadol 2013).
Therefore, the proportionally larger intracranial electrodes, greater electrode coverage and larger volume of
epileptogenic tissue in humans would all contribute to a depth sensitivity and localisation accuracy for imaging
the slow impedance response that are proportionally comparable to that seen in the in vivo rat brain setup, that is
at least a third of the depth of the brain and of the order of millimetres, respectively (Witkowska-Wrobel et al
2018, Faulkner et al 2018b). This can be further enhanced by using an optimised EIT protocol if any a priori
information is available regarding the expected location of neural activity or if intracranial depth electrodes are
also implemented (Witkowska-Wrobel et al 2018).
In the present study, EIT measurements were obtained with epicortical electrodes because we aimed to
directly compare the reconstructed slow impedance response during seizures to images of the fast neural
impedance response during ictal spikes, and the latter cannot currently be detected from the surface of the scalp
due to its low SNR (Vongerichten et al 2016, Hannan et al 2018a, 2020a). Therefore, assessing the feasibility of
imaging slow seizure-related activity with EIT using scalp electrodes was beyond the scope of this work.
However, in light of our findings, which have shown that the slow impedance response is indeed a reliable
marker of neural activity in the epileptogenic zone, we are currently undertaking in vivo experiments to assess
the technical accuracy with which EIT can be used to image the slow impedance change non-invasively from the
scalp in a rat seizure model. The seizure-induced slow impedance signal is expected to have a magnitude of the
order of 0.1% on the scalp (Fabrizi et al 2006). Based on recent in-house modelling and tank experiments, we
expect to be able to image signals of this magnitude non-invasively with EIT using scalp electrodes both in the rat
and human brain (Avery et al 2019). Using a parallel multifrequency EIT system will help to improve the
compatibility of our setup with the standard EEG monitoring methods used clinically and will ensure that
sufficient slow impedance data can be collected in epilepsy patients who are undergoing EEG monitoring with
scalp electrodes (Dowrick et al 2015, Avery et al 2019). The ability to image seizure-related slow impedance
responses non-invasively with scalp electrodes would also improve the practicality of EIT for investigating the
mechanisms of epileptogenesis in vivo to ultimately aid the development of novel anticonvulsant therapies.
4.4. Implications of the slow impedance response for clinical and in vivo applications
Since this work has shown that EIT images of the slow impedance response to epileptiform events in the
neocortex and hippocampus are indeed representative of the underlying neural activity in the epileptogenic
zone, it supports the development and use of a parallel EIT system employing simultaneous current injection at
multiple frequencies for single-shot imaging of seizures. This is attractive from a clinical perspective as seizures
occur unpredictably and often infrequently and so the ability to reconstruct slow changes from individual
seizures would considerably reduce the total recording time. Additionally, use of a parallel EIT system would
avoid the need for switching of current-injecting electrodes and thus eliminate the possibility of contaminating
the clinical EEG recordings with low-frequency switching artefacts (Dowrick et al 2015). As such, this method
could be used in conjunction with conventionally used EEG monitoring techniques to provide additional
diagnostic data, obtained using standard pre-implanted intracranial EEG electrodes, during the presurgical
evaluation of refractory epilepsy patients undergoing surgery without disrupting the current clinical practice.
Compared to EEG, EIT has a unique solution to the inverse problem (Somersalo et al 1992). This contrasts with
EEG inverse source localisation methods in which it may be possible for multiple current models to fit the
recorded data (Jatoi et al 2014). In addition, because transfer impedances are measured for every current-
injecting electrode pair in an EIT protocol, a greater number of independent measurements can be obtained
using the same number of electrodes with EIT compared to EEG (O(n2) for EIT versus O(n) for EEG, when using
n electrodes) (Aristovich et al 2018). As such, utilising EIT increases the overall spatial and temporal information
that is used to reconstruct images and localise epileptic activity. Finally, EEG source reconstruction methods are,
unlike EIT, sensitive to the orientation of the source. This may lead to signal cancellation in the EEG if the
epileptic activity originates from sources that are oriented tangentially to the scalp or extend over sulci or gyri
16Physiol. Meas. 42 (2021) 014001 S Hannan et al
with opposing source orientations (Lüders 2008, Ahlfors et al 2010, Schomer and Lopes da Silva 2010). For these
reasons, utilising EIT alongside standard EEG monitoring methods would enable more accurate localisation of
the epileptogenic zone, the target of resection, and ultimately improve surgical outcome in these patients
(Witkowska-Wrobel et al 2018).
If translated to clinical settings for aiding presurgical localisation of the epileptogenic zone in epilepsy
patients, the lowest carrier frequency at which current should be applied is 1.355 kHz, which was used for the
hippocampal imaging experiments in the present study and would ensure that EEG recordings during the
standard presurgical monitoring of patients are not contaminated (Avery et al 2019). The magnitude and SNR of
the slow impedance response during seizures is not significantly different across frequencies in the 1–10 kHz
range, and so frequencies between 1.355 and 10 kHz could be used initially with parallel EIT systems (Hannan
et al 2018b). However, it may be possible to use higher frequencies up to 50 kHz. It would be valuable, therefore,
to determine the frequency response of the slow impedance change at higher frequencies prior to clinical use.
The number of carrier frequencies that can be used at once is restricted by hardware limitations, which will
dictate the number of current sources that can operate in parallel, as well as the number of implanted
intracranial electrodes that are available for current injection which will vary across patients according to the
type and extent of epileptic activity. The recommended current level to use in clinical settings is 50 μA, the lower
of the two current levels used in the present work. Since the slow impedance change during seizures is
approximately ten times larger than the fast neural response during ictal discharges, we expect to be able to
image seizure-related slow activity in both cortical and subcortical brain regions from the surface of cortex at this
current amplitude (Hannan et al 2018b). Even at 1.355 kHz, the lowest frequency suggested for clinical use,
current applied at 50 μA is well below the maximum level allowed under the guidelines specified in the
International Electrotechnical Commission (IEC) 60601-1 medical safety regulations and is therefore
considered safe for clinical use (IEC 60601-1 2005).
Imaging the slow impedance response could also be beneficial to in vivo studies investigating the
mechanisms of epileptogenesis. Although fast neural EIT can directly image neural activity over milliseconds, it
requires averaging over repeated neural events and the magnitude of the signal is relatively small at ∼0.4% locally
(Hannan et al 2018a). EIT of the slow impedance response has a lower temporal resolution of seconds. However,
the signal is around ten times larger and so it offers a complementary approach to image epileptic activity which
is possible without the need for averaging and with an improved depth sensitivity. Therefore, the present
findings complement the previously published fast neural EIT approach. There are still certain applications in
which imaging the fast neural impedance response directly is preferable, for example, to elucidate neural
network dynamics during epileptic discharges (Vongerichten et al 2016, Hannan et al 2018a, 2020a). Here, we
have described an approach to improve the overall practicality of EIT which offers a valuable additional method
that may be more feasible for certain applications, such as imaging seizures that occur spontaneously. Moreover,
imaging the fast neural and slow impedance response simultaneously with EIT would increase the physiological
information that is obtained during seizures and thus may provide a method for studying the mechanisms of
neurovascular coupling in epileptogenesis, a phenomenon that is at present poorly understood. Overall, the
choice of whether the fast neural or slow impedance response, or both, should be imaged with EIT is application-
specific and should be determined by considering the specific clinical or research questions under investigation.
While it was beyond the scope of the present work, it would be of interest in the future to definitively
determine whether the impedance increase is indeed caused by cell swelling and thereby investigate the relative
contribution of other factors such as increased cerebral blood flow and temperature, if any, on this response.
This may be explored by recording the impedance changes using carrier frequencies above 50 kHz, at which the
applied current is expected to cross the neuronal cell membrane and be conducted through the intracellular as
well as extracellular fluid (Holder 2005, Seoane et al 2005). A decrease in the magnitude of the slow impedance
response at such frequencies would confirm that the impedance change observed during seizures is caused by
cell swelling and could further provide insights into the mechanisms of ictogenesis and neurovascular coupling
in epilepsy.
4.5. Conclusion
This work has shown that EIT can be used to image the slow impedance response during seizures that have
neocortical and hippocampal foci with high reproducibility and localisation accuracy from the surface of the rat
cortex. Additionally, our findings reveal that this slow increase in impedance presents a reliable surrogate
marker of ongoing neural activity for localising the ictal focus. As such, EIT may be utilised, as an adjunct
imaging modality to conventional EEG methods, for improving localisation of the epileptogenic zone in
individuals with refractory epilepsy undergoing surgical treatment for seizure control. Future work should focus
on continuing the development of a parallel multifrequency EIT system that would allow for images of the slow
impedance change to be reconstructed from multiple transfer impedance measurements obtained during an
17Physiol. Meas. 42 (2021) 014001 S Hannan et al
individual seizure and subsequently proceed with clinical testing. In addition to its proposed benefits for clinical
settings, this system would increase the applicability of EIT as a standard in vivo neuroimaging tool for
investigations into the pathophysiology of refractory epilepsies to ultimately direct the design and development
of novel therapeutic strategies for these disorders.
Acknowledgments
This work was supported by grants from DARPA (N66001-16-2-4066), Blackrock Microsystems and the EPSRC
(EP/M506448/1). James Avery was supported by the NIHR Imperial BRC.
ORCID iDs
Sana Hannan https://orcid.org/0000-0003-2241-8312
Kirill Aristovich https://orcid.org/0000-0002-2924-5680
Mayo Faulkner https://orcid.org/0000-0001-5427-0282
James Avery https://orcid.org/0000-0002-4015-1802
David S Holder https://orcid.org/0000-0003-2755-6124
References
Ahlfors S P, Han J, Lin F, Witzel T, Belliveau J W, Hämäläinen M S and Halgren E 2010 Cancellation of EEG and MEG signals generated by
extended and distributed sources Hum. Brain Mapp. 31 140–49
Andersen P, Bliss T V and Skrede K K 1971 Unit analysis of hippocampal polulation spikes Exp. Brain Res. 13 208–21
Andrew R D and MacVicar B A 1994 Imaging cell volume changes and neuronal excitation in the hippocampal slice Neuroscience 62 371–83
Aristovich K, Donegá M, Blochet C, Avery J, Hannan S, Chew D J and Holder D S 2018 Imaging fast neural traffic at fascicular level with
electrical impedance tomography: proof of principle in rat sciatic nerve J. Neural Eng. 15 056025
Aristovich K Y, Packham B C, Koo H, dos Santos G S, McEvoy A and Holder D S 2016 Imaging fast electrical activity in the brain with
electrical impedance tomography Neuroimage 124 204–13
Aristovich K Y, Sato dos Santos G, Packham B C and Holder D S 2014 A method for reconstructing tomographic images of evoked neural
activity with electrical impedance tomography using intracranial planar arrays Physiol. Meas. 35 1095–109
Avery J, Dowrick T, Witkowska-Wrobel A, Faulkner M, Aristovich K and Holder D 2019 Simultaneous EIT and EEG using frequency
division multiplexing Physiol. Meas. 40 034007
Bahar S, Suh M, Zhao M and Schwartz T H 2006 Intrinsic optical signal imaging of neocortical seizures: the ‘epileptic dip’ Neuroreport 17
499–503
Balestrino M 1995 Pathophysiology of anoxic depolarization: new findings and a working hypothesis J. Neurosci. Methods 59 99–103
Baumann S B, Wozny D R, Kelly S K and Meno F M 1997 The electrical conductivity of human cerebrospinal fluid at body temperature IEEE
Trans. Biomed. Eng. 44 220–3
Bragin A, Penttonen M and Buzsáki G 1997 Termination of epileptic afterdischarge in the hippocampus J. Neurosci. 17 2567–79
Brown B H 2003 Electrical impedance tomography (EIT): a review J. Med. Eng. Technol. 27 97–108
de Tisi J, Bell G S, Peacock J L, McEvoy A W, Harkness W F, Sander J W and Duncan J S 2011 The long-term outcome of adult epilepsy
surgery, patterns of seizure remission, and relapse: a cohort study Lancet 378 1388–95
Diehl B and Lüders H O 2000 Temporal lobe epilepsy: when are invasive recordings needed? Epilepsia 41 S61–74
Dowrick T, Sato dos Santos G, Vongerichten A and Holder D 2015 Parallel, multi frequency EIT measurement, suitable for recording
impedance J. Electr. Biomp. 6 37–43
Dreier J P et al 2011 Spreading convulsions, spreading depolarization and epileptogenesis in human cerebral cortex Brain 135 259–75
Dzhala V, Ben-Ari Y and Khazipov R 2000 Seizures accelerate anoxia-induced neuronal death in the neonatal rat hippocampus Ann. Neurol.
48 632–40
Elazar Z, Kado R T and Adey W R 1966 Impedance changes during epileptic seizures Epilepsia 7 291–307
Fabrizi L et al 2006 Factors limiting the application of electrical impedance tomography for identification of regional conductivity changes
using scalp electrodes during epileptic seizures in humans Physiol. Meas. 27 S163–74
Faulkner M, Hannan S, Aristovich J, Avery J and Holder D 2018a Characterising the frequency response of impedance changes during
evoked physiological activity in the rat brain Physiol. Meas. 39 034007
Faulkner M, Hannan S, Aristovich K, Avery J and Holder D 2018b Feasibility of imaging evoked activity throughout the rat brain using
electrical impedance tomography NeuroImage 178 1–10
Hannan S 2019 Imaging fast neural activity in the brain during epilepsy with electrical impedance tomography PhD Thesis University College
London
Hannan S, Faulkner M, Aristovich K, Avery J, Walker M C and Holder D 2018a Imaging fast electrical activity in the brain during ictal
epileptiform discharges with electrical impedance tomography Neuroimage Clin. 20 674–84
Hannan S, Faulkner M, Aristovich K, Avery J and Holder D 2018b Frequency-dependent characterisation of impedance changes during
epileptiform activity in a rat model of epilepsy Physiol. Meas. 39 085003
Hannan S, Faulkner M, Aristovich K, Avery J and Holder D 2019 Investigating the safety of fast neural electrical impedance tomography in
the rat brain Physiol. Meas. 40 034003
Hannan S, Faulkner M, Aristovich K, Avery J, Walker M C and Holder D S 2020a In vivo imaging of deep neural activity from the cortical
surface during hippocampal epileptiform events in the rat brain using electrical impedance tomography Neuroimage 209 116525
Hannan S, Faulkner M, Aristovich K, Avery J, Walker M C and Holder D S 2020b Optimised induction of on-demand focal hippocampal
and neocortical seizures by electrical stimulation J. Neurosci. Methods 346 108911
Hansen A J 1985 Effect of anoxia on ion distribution in the brain Physiol. Rev. 65 101–48
18Physiol. Meas. 42 (2021) 014001 S Hannan et al
Hille B 2001 Ion Channels of Excitable Membranes 3rd edn (Sunderland, MA: Sinauer Associates)
Holder D S 2005 Electrical Impedance Tomography: Methods, History and Application (Bristol: Institute of Physics Publishing)
Horesh L 2006 Some novel approaches in modelling and image reconstruction for multi frequency electrical impedance tomography of the
human brain PhD Thesis University College London
IEC 60601-1 2005 Medical Electrical Equipment—Part 1: General Requirements for Basic Safety and Essential Performance 3rd edn (Geneva:
International Electrotechnical Commission)
Jatoi M A, Kamel N, Malik A S, Faye I and Begum T 2014 A survey of methods used for source localization using EEG signals Biomed. Signal
Process. Control 11 42–52
Jehi L 2018 The epileptogenic zone: concept and definition Epilepsy Curr. 18 12–6
Jehl M, Dedner A, Betcke T, Aristovich K, Klöfkorn R and Holder D 2015 A fast parallel solver for the forward problem in electrical
impedance tomography IEEE Trans. Biomed. Eng. 62 126–37
Jehl M, Aristovich K, Faulkner M and Holder D 2016 Are patient specific meshes required for EIT head imaging? Physiol. Meas. 37 879–92
Kandratavicius L, Balista P A, Lopes-Aguiar C, Ruggiero R N, Umeoka E H, Garcia-Cairasco N and Leite J P 2014 Animal models of epilepsy:
use and limitations Neuropsychiatr. Dis. Treat. 10 1693–705
Klivington K A and Galambos R 1967 Resistance shifts accompanying the evoked cortical response in the cat Science 157 211–3
Latikka J, Kuurne T and Eskola H 2001 Conductivity of living intracranial tissues Phys. Med. Biol. 46 1611–6
Lüders H 2008 Textbook of Epilepsy Surgery (London: Informa Healthcare)
Meeren H, van Luijtelaar G, Lopes da Silva F and Coenen A 2005 Evolving concepts on the pathophysiology of absence seizures: the cortical
focus theory Arch. Neurol. 62 371–6
Nair D R 2016 Management of drug-resistant epilepsy Continuum 22 157–72
Oh T, Gilad O, Ghosh A, Schuettler M and Holder D S 2011 A novel method for recording neuronal depolarization with recording at
125–825 Hz: implications for imaging fast neural activity in the brain with electrical impedance tomography Med. Biol. Eng. Comput.
49 593–604
Olsson T et al 2006 Cell swelling, seizures and spreading depression: an impedance study Neuroscience 140 505–15
Paxinos G and Watson C 2013 The Rat Brain in Stereotaxic Coordinates 7th edn (San Diego, CA: Academic)
Polack P O, Mahon S, Chavez M and Charpier S 2009 Inactivation of the somatosensory cortex prevents paroxysmal oscillations in cortical
and related thalamic neurons in a genetic model of absence epilepsy Cereb. Cortex 19 2078–91
Ranck J B 1963 Specific impedance of rabbit cerebral cortex Exp. Neurol. 7 144–52
Rao A 2000 Electrical impedance tomography of brain activity: studies into its accuracy and physiological mechanisms PhD Thesis University
College London
Schomer D L and Lopes da Silva F H 2010 Niedermeyer’s Electroencephalography: basic Principles, Clinical Applications, and Related Fields 6th
edn (Philadelphia; London: Lippincott Williams & Wilkins)
Schwartz T H 2007 Neurovascular coupling and epilepsy: hemodynamic markers for localizing and predicting seizure onset Epilepsy Curr. 7
91–4
Seoane F, Lindecrantz K, Olsson T, Kjellmer I, Flisberg A and Bågenholm R 2005 Spectroscopy study of the dynamics of the transencephalic
electrical impedance in the perinatal brain during hypoxia Physiol. Meas. 26 849–63
Shariff S, Suh M, Zhao M, Ma H and Schwartz T H 2006 Recent developments in oximetry and perfusion- based mapping techniques and
their role in the surgical treatment of neocortical epilepsy Epilepsy Behav. 8 363–75
Shepherd G M 2004 The Synaptic Organisation of the Brain 5th edn (New York: Oxford University Press)
Sitnikova E and van Luijetelaar G 2004 Cortical control of generalized absence seizures: effect of lidocaine applied to the somatosensory
cortex in WAG/Rij rats Brain Res. 1012 127–37
Somersalo E, Cheney M and Isaacson D 1992 Existence and uniqueness for electrode models for electric current computed tomography
SIAM J. Appl. Math. 52 1023–40
Spencer S S et al 2005 Predicting long-term seizure outcome after resective epilepsy surgery: the multicenter study Neurology 65 912–8
Tikhonov A N, Goncharsky A, Stepanov V and Yagola A 1995 Numerical Methods for the Solution of Ill-Posed Problems (Dordrecht, The
Netherlands: Kluwer Academic Publishers)
Ullah G, Wei Y, Dahlem M A, Wechselberger M and Schiff S J 2015 The role of cell volume in the dynamics of seizure, spreading depression,
and anoxic depolarization PLoS Comput. Biol. 11 e1004414
Van Harreveld A and Schadé J P 1962 Changes in the electrical conductivity of cerebral cortex during seizure activity Exp. Neurol. 5 383–400
Vongerichten A N, Sato Dos Santos G S, Aristovich K, Avery J, McEvoy A, Walker M and Holder D S 2016 Characterisation and imaging of
cortical impedance changes during interictal and ictal activity in the anaesthetised rat Neuroimage 124 813–23
Voorhies J M and Cohen-Gadol A 2013 Techniques for placement of grid and strip electrodes for intracranial epilepsy surgery monitoring:
pearls and pitfalls Surg. Neurol. Int. 4 98
Wang L, Sun Y, Xu X, Dong X and Gao F 2017 Real-time imaging of epileptic seizures in rats using electrical impedance tomography
Neuroreport 28 689–93
Weiss H R 1988 Measurement of cerebral capillary perfusion with a fluorescent label Microvas. Res. 36 172–80
Witkowska-Wrobel A, Aristovich K, Faulkner M, Avery J and Holder D 2018 Feasibility of imaging epileptic seizure onset with EIT and
depth electrodes NeuroImage 173 311–21
Wyler A R 1992 Subdural strip electrodes in surgery of epilepsy Epilepsy Surgery ed H Lüders (New York: Raven Press) pp 395–8
Yang X-F, Chang J H and Rothman S M 2002 Intracerebral temperature alterations associated with focal seizures Epilepsy Res. 52 97–105
19You can also read