Teaching Meaningful Explanations - Noel C. F. Codella, Michael Hind, Karthikeyan Natesan Ramamurthy, Murray Campbell, Amit Dhurandhar, Kush R ...
←
→
Page content transcription
If your browser does not render page correctly, please read the page content below
Teaching Meaningful Explanations

                                                     Noel C. F. Codella,∗ Michael Hind,∗ Karthikeyan Natesan Ramamurthy,∗
                                             Murray Campbell, Amit Dhurandhar, Kush R. Varshney, Dennis Wei, Aleksandra Mojsilović
                                                                                                      IBM Research
                                                                                               Yorktown Heights, NY 10598
arXiv:1805.11648v2 [cs.AI] 11 Sep 2018

                                                                       Abstract                               2. Domain Match: An explanation needs to be tailored to
                                                                                                                 the domain, incorporating the relevant terms of the do-
                                            The adoption of machine learning in high-stakes applications
                                                                                                                 main. For example, an explanation for a medical diagno-
                                            such as healthcare and law has lagged in part because predic-
                                            tions are not accompanied by explanations comprehensible to          sis needs to use terms relevant to the physician (or patient)
                                            the domain user, who often holds the ultimate responsibility         who will be consuming the prediction.
                                            for decisions and outcomes. In this paper, we propose an ap-         In this paper, we take this guidance to heart by asking con-
                                            proach to generate such explanations in which training data is    sumers themselves to provide explanations that are mean-
                                            augmented to include, in addition to features and labels, ex-     ingful to them for their application along with feature/label
                                            planations elicited from domain users. A joint model is then
                                            learned to produce both labels and explanations from the in-
                                                                                                              pairs, where these provided explanations lucidly justify the
                                            put features. This simple idea ensures that explanations are      labels for the specific inputs. We then use this augmented
                                            tailored to the complexity expectations and domain knowl-         training set to learn models that predict explanations along
                                            edge of the consumer. Evaluation spans multiple modeling          with labels for new unseen samples.
                                            techniques on a game dataset, a (visual) aesthetics dataset, a       The proposed paradigm is different from existing meth-
                                            chemical odor dataset and a Melanoma dataset showing that         ods for local interpretation (Montavon, Samek, and Müller,
                                            our approach is generalizable across domains and algorithms.      2017) in that it does not attempt to probe the reasoning pro-
                                            Results demonstrate that meaningful explanations can be re-       cess of a model. Instead, it seeks to replicate the reason-
                                            liably taught to machine learning algorithms, and in some         ing process of a human domain user. The two paradigms
                                            cases, also improve modeling accuracy.                            share the objective to produce a reasoned explanation, but
                                                                                                              the model introspection approach is more well-suited to AI
                                                                                                              system builders who work with models directly, whereas the
                                                                 1   Introduction                             teaching explanations paradigm more directly addresses do-
                                         New regulations call for automated decision making systems           main users. Indeed, the European Union GDPR guidelines
                                         to provide “meaningful information” on the logic used to             say: “The controller should find simple ways to tell the data
                                         reach conclusions (Goodman and Flaxman, 2016; Wachter,               subject about the rationale behind, or the criteria relied on in
                                         Mittelstadt, and Floridi, 2017; Selbst and Powles, 2017).            reaching the decision without necessarily always attempting
                                         Selbst and Powles (2017) interpret the concept of “meaning-          a complex explanation of the algorithms used or disclosure
                                         ful information” as information that should be understand-           of the full algorithm.” More specifically, teaching explana-
                                         able to the audience (potentially individuals who lack spe-          tions allows user verification and promotes trust. Verification
                                         cific expertise), is actionable, and is flexible enough to sup-      is facilitated by the fact that the returned explanations are in
                                         port various technical approaches.                                   a form familiar to the user. As predictions and explanations
                                            For the present discussion, we define an explanation as in-       for novel inputs match with a user’s intuition, trust in the
                                         formation provided in addition to an output that can be used         system will grow accordingly. Under the model introspec-
                                         to verify the output. In the ideal case, an explanation should       tion approach, while there are certainly cases where model
                                         enable a human user to independently determine whether the           and domain user reasoning match, this does not occur by
                                         output is correct. The requirements of meaningful informa-           design and they may diverge in other cases, potentially de-
                                         tion have two implications for explanations:                         creasing trust (Weller, 2017).
                                         1. Complexity Match: The complexity of the explanation                  There are many possible instantiations for this proposed
                                            needs to match the complexity capability of the con-              paradigm of teaching explanations. One is to simply expand
                                            sumer (Kulesza et al., 2013; Dhurandhar et al., 2017).            the label space to be the Cartesian product of the original
                                            For example, an explanation in equation form may be ap-           labels and the elicited explanations. Another approach is to
                                            propriate for a statistician, but not for a nontechnical per-     bring together the labels and explanations in a multi-task set-
                                            son (Miller, Howe, and Sonenberg, 2017).                          ting. The third builds upon the tradition of similarity metrics,
                                                                                                              case-based reasoning and content-based retrieval.
                                            ∗
                                                These authors contributed equally.                               Existing approaches that only have access to features
and labels are unable to find meaningful similarities. How- 2. Creating a second, simpler-to-understand model, such as a
ever, with the advantage of having training features, labels, small number of logical expressions, that mostly matches
and explanations, we propose to learn feature embeddings the decisions of the deployed model (e.g., Bastani, Kim,
guided by labels and explanations. This allows us to infer ex- and Bastani (2018); Caruana et al. (2015)).
planations for new data using nearest neighbor approaches. 3. Leveraging “rationales”, “explanations”, “attributes”, or
We present a new objective function to learn an embedding other “privileged information” in the training data to help
to optimize k-nearest neighbor (kNN) search for both pre- improve the accuracy of the algorithms (e.g., (Sun and
diction accuracy as well as holistic human relevancy to en- DeJong, 2005; ?; Zaidan and Eisner, 2008; Zhang, Mar-
force that returned neighbors present meaningful informa- shall, and Wallace, 2016; McDonnell et al., 2016; Don-
tion. The proposed embedding approach is easily portable to ahue and Grauman, 2011; ?; Peng et al., 2016)
a diverse set of label and explanation spaces because it only
requires a notion of similarity between examples in these 4. Work in the natural language processing and computer
spaces. Since any predicted explanation or label is obtained vision domains that generate rationales/explanations de-
from a simple combination of training examples, complex- rived from input text (e.g., Lei, Barzilay, and Jaakkola
ity and domain match is achieved with no further effort. (2016); Ainur, Choi, and Cardie (2010); Hendricks et al.
We also demonstrate the multi-task instantiation wherein la- (2016)).
bels and explanations are predicted together from features. 5. Content-based retrieval methods that provide explana-
In contrast to the embedding approach, we need to change tions as evidence employed for a prediction, i.e. k-nearest
the structure of the ML model for this method due to the neighbor classification and regression (e.g., Wan et al.
modality and type of the label and explanation space. (2014); Jimenez-del-Toro et al. (2015); Li et al. (2018);
We demonstrate the proposed paradigm using the three Sun et al. (2012)).
instantiations on a synthetic tic-tac-toe dataset (See sup- The first two groups attempt to precisely describe how a
plement), and publicly-available image aesthetics dataset machine learning decision was made, which is particularly
(Kong et al., 2016), olfactory pleasantness dataset (Keller relevant for AI system builders. This insight can be used to
et al., 2017), and melanoma classification dataset (Codella improve the AI system and may serve as the seeds for an
et al., 2018a). Teaching explanations, of course requires a explanation to a non-AI expert. However, work still remains
training set that contains explanations. Since such datasets to determine if these seeds are sufficient to satisfy the needs
are not readily available, we use the attributes given with the of a non-AI expert. In particular, when the underlying fea-
aesthetics and pleasantness datasets in a unique way: as col- tures are not human comprehensible, these approaches are
lections of meaningful explanations. For the melanoma clas- inadequate for providing human consumable explanations.
sification dataset, we will use the groupings given by human The third group, like this work, leverages additional infor-
users described in Codella et al. (2018b) as the explanations. mation (explanations) in the training data, but with different
The main contributions of this work are: goals. The third group uses the explanations to create a more
accurate model; we leverage the explanations to teach how
• A new approach for machine learning algorithms to pro-
to generate explanations for new predictions.
vide meaningful explanations that match the complexity
The fourth group seeks to generate textual explanations
and domain of consumers by eliciting training explana-
with predictions. For text classification, this involves select-
tions directly from them. We name this paradigm TED
ing the minimal necessary content from a text body that
for ‘Teaching Explanations for Decisions.’
is sufficient to trigger the classification. For computer vi-
• Evaluation of several candidate approaches, some of sion (Hendricks et al., 2016), this involves utilizing textual
which learn joint embeddings so that the multidimen- captions to automatically generate new textual captions of
sional topology of a model mimics both the supplied images that are both descriptive as well as discriminative.
labels and explanations, which are then compared with While serving to enrich an understanding of the predictions,
single-task and multi-task regression/classification ap- these systems do not necessarily facilitate an improved abil-
proaches. ity for a human user to understand system failures.
The fifth group creates explanations in the form of deci-
• Evaluation on disparate datasets with diverse label and
sion evidence: using some feature embedding to perform k-
explanation spaces demonstrating the efficacy of the
nearest neighbor search, using those k neighbors to make a
paradigm.
prediction, and demonstrating to the user the nearest neigh-
bors and any relevant information regarding them. Although
2 Related Work this approach is fairly straightforward and holds a great deal
Prior work in providing explanations can be partitioned into of promise, it has historically suffered from the issue of the
several areas: semantic gap: distance metrics in the realm of the feature
embeddings do not necessarily yield neighbors that are rele-
1. Making existing or enhanced models interpretable, i.e. vant for prediction. More recently, deep feature embeddings,
to provide a precise description of how the model de- optimized for generating predictions, have made significant
termined its decision (e.g., Ribeiro, Singh, and Guestrin advances in reducing the semantic gap. However, there still
(2016); Montavon, Samek, and Müller (2017); Lundberg remains a “meaning gap” — although systems have gotten
and Lee (2017)). good at returning neighbors with the same label as a query,they do not necessarily return neighbors that agree with any Thus, we not only want to predict the labels y, but also the
holistic human measures of similarity. As a result, users are corresponding explanations e for the specific x and y based
not necessarily inclined to trust system predictions. on historical explanations given by human experts.
Doshi-Velez et al. (2017) discuss the societal, moral, and The space E in most of these applications is quite dif-
legal expectations of AI explanations, provide guidelines for ferent than X and has similarities with Y in that it requires
the content of an explanation, and recommend that explana- human judgment.
tions of AI systems be held to a similar standard as humans. We provide methods to solve the above problem. Al-
Our approach is compatible with their view. Biran and Cot- though these methods can be used even when X is human-
ton (2017) provide an excellent overview and taxonomy of understandable, we envision the most impact for applica-
explanations and justifications in machine learning. tions where this is not the case, such as the olfaction dataset
Miller (2017) and Miller, Howe, and Sonenberg (2017) described in Section 4.
argue that explainable AI solutions need to meet the needs
of the users, an area that has been well studied in philos-
ophy, psychology, and cognitive science. They provides a
3.2 Candidate Approaches
brief survey of the most relevant work in these fields to the We propose several candidate implementation approaches to
area of explainable AI. They, along with Doshi-Velez and teach labels and explanations from the training data, and pre-
Kim (2017), call for more rigor in this area. dict them for unseen test data. We will describe the base-
line regression and embedding approaches. The particular
3 Methods parameters and specific instantiations are provided in Sec-
The primary motivation of the TED paradigm is to pro- tion 4.
vide meaningful explanations to consumers by leveraging
Baseline for Predicting Y or E To set the baseline, we
the consumers’ knowledge of what will be meaningful to
trained a regression (classification) network on the datasets
them. Section 3.1 formally describes the problem space that
to predict Y from X using the mean-squared error (cross-
defines the TED approach. One simple learning approach to
entropy) loss. This cannot be used to infer E for a novel X.
this problem is to expand the label space to be the Carte-
A similar learning approach was be used to predict E from
sian product of the original labels and the provided explana-
X. If E is vector-valued, we used multi-task learning.
tions. Although quite simple, this approach has a number of
pragmatic advantages in that it is easy to incorporate, it can Multi-task Learning to Predict Y and E Together We
be used for any learning algorithm, it does not require any trained a multi-task network to predict Y and E together
changes to the learning algorithm, and does not require own- from X. Similar to the previous case, we used appropriate
ers to make available their algorithm. It also has the possibil- loss functions.
ity of some indirect benefits because requiring explanations
will improve auditability (all decisions will have explana- Embeddings to Predict Y and E We propose to use the
tions) and potentially reduce bias in the training set because activations from the last fully connected hidden layer of the
inconsistencies in explanations may be discovered. network trained to predict Y or E as embeddings for X.
Other instantiations of the TED approach may leverage Given a novel X, we obtain its k nearest neighbors in the
the explanations to improve model prediction and possi- embedding space from the training set, and use the corre-
bly explanation accuracy. Section 3.2 takes this approach sponding Y and E values to obtain predictions as weighted
to learn feature embeddings and explanation embeddings averages. The weights are determined using a Gaussian ker-
in a joint and aligned way to permit neighbor-based expla- nel on the distances in the embedding space of the novel X
nation prediction. It presents a new objective function to to its neighbors in the training set. This procedure is used
learn an embedding to optimize kNN search for both predic- with all the kNN-based prediction approaches.
tion accuracy as well as holistic human relevancy to enforce
that returned neighbors present meaningful information. We Pairwise Loss for Improved Embeddings Since our key
also discuss multi-task learning in the label and explanation instantiation is to predict Y and E using the kNN approach
space as another instantiation of the TED approach, that we described above, we propose to improve upon the embed-
will use for comparisons. dings of X from the regression network by explicitly en-
suring that points with similar Y and E values are mapped
3.1 Problem Description close to each other in the embedding space. For a pair of
Let X × Y denote the input-output space, with p(x, y) de- data points (a, b) with inputs (xa , xb ), labels (ya , yb ), and
noting the joint distribution over this space, where (x, y) ∈ explanations (ea , eb ), we define the following pairwise loss
X × Y . Then typically, in supervised learning one wants to functions for creating the embedding f (·), where the short-
estimate p(y|x). hand for f (xi ) is fi for clarity below:
In our setting, we have a triple X × Y × E that denotes
the input space, output space, and explanation space, re- Lx,y (a, b)
spectively. We then assume that we have a joint distribution
1 − cos(fa , fb ), ||ya − yb ||1 ≤ c1 ,
p(x, y, e) over this space, where (x, y, e) ∈ X × Y × E. In = (1)
this setting we want to estimate p(y, e|x) = p(y|x)p(e|y, x). max(cos(fa , fb ) − m1 , 0), ||ya − yb ||1 > c2 ,Lx,e (a, b)
1 − cos(fa , fb ), ||ea − eb ||1 ≤ c3 ,
= (2)
max(cos(fa , fb ) − m2 , 0), ||ea − eb ||1 > c4 .
The cosine similarity cos(fa , fb ) = ||faf||a2·f
||fb ||2 , where · de-
b
notes the dot product between the two vector embeddings
and ||.||p denotes the `p norm. Eqn. (1) defines the embed-
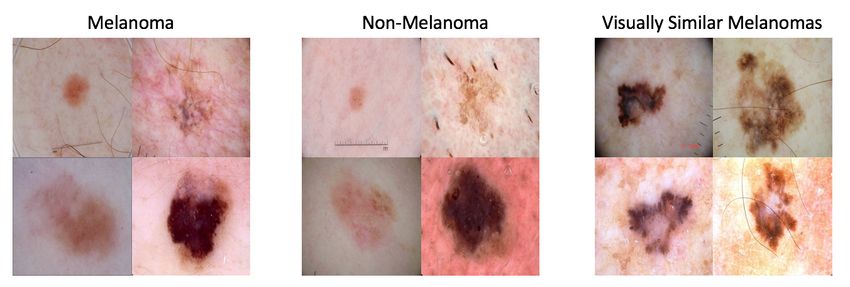
ding loss based on similarity in the Y space. If ya and yb are Figure 1: Example images from the ISIC Melanoma detec-
close, the cosine distance between xa and xb will be min- tion dataset. The visual similarity between Melanoma and
imized. If ya and yb are far, the cosine similarity will be non-Melanoma images is seen from the left and middle im-
minimized (up to some margin m1 ≥ 0), thus maximizing ages. In the right image, the visually similar lesions are
the cosine distance. It is possible to set c2 > c1 to create a placed in the same group (i.e., have the same e value).
clear buffer between neighbors and non-neighbors. The loss
function (2) based on similarity in the E space is exactly
analogous. We combine the losses using Y and E similari-
ties as The AADB (Aesthetics and Attributes Database) (Kong
et al., 2016) contains about 10, 000 images that have been
Lx,y,e (a, b) = Lx,y (a, b) + w · Lx,e (a, b), (3) human rated for aesthetic quality (Y ∈ [0, 1]), where higher
where w denotes the scalar weight on the E loss. We set values imply more aesthetically pleasing. It also comes with
w ≤ 1 in our experiments. The neighborhood criteria on 11 attributes (E) that are closely related to image aesthetic
y and e in (1) and (2) are only valid if they are continu- judgments by professional photographers. The attribute val-
ous valued. If they are categorical, we will adopt a different ues are averaged over 5 humans and lie in [−1, 1]. The train-
neighborhood criteria, whose specifics are discussed in the ing, test, and validation partitions are provided by the au-
relevant experiment below. thors and consist of 8,458, 1,000, and 500 images, respec-
tively.
4 Evaluation The Olfactory dataset (Keller et al., 2017) is a challenge
To evaluate the ideas presented in this work, we focus on dataset describing various scents (chemical bondings and la-
two fundamental questions: bels). Each of the 476 rows represents a molecule with ap-
proximately 5000 chemoinformatic features (X) (angles be-
1. Does the TED approach provide useful explanations?
tween bonds, types of atoms, etc.). Similarly to AADB, each
2. How is the prediction accuracy impacted by incorporating row also contains 21 human perceptions of the molecule,
explanations into the training? such as intensity, pleasantness, sour, musky, burnt. These
Since the TED approach can be incorporated into many are average values among 49 diverse individuals and lie in
kinds of learning algorithms, tested against many datasets, [0, 100]. We take Y to be the pleasantness perception and
and used in many different situations, a definitive answer to E to be the remaining 19 perceptions except for intensity,
these questions is beyond the scope of this paper. Instead we since these 19 are known to be more fundamental semantic
try to address these two questions on four datasets, evaluat- descriptors while pleasantness and intensity are holistic per-
ing accuracy in the standard way. ceptions (Keller et al., 2017). We use the standard training,
Determining if any approach provides useful explana- test, and validation sets provided by the challenge organizers
tions is a challenge and no consensus metric has yet to with 338, 69, and 69 instances respectively.
emerge (Doshi-Velez et al., 2017). However, the TED ap- The 2017 International Skin Imaging Collabora-
proach has a unique advantage in dealing with this chal- tion (ISIC) challenge on Skin Lesion Analysis Toward
lenge. Specifically, since it requires explanations be pro- Melanoma Detection dataset (Codella et al., 2018a) is a
vided for the target dataset (training and testing), one can public dataset with 2000 training and 600 test images.
evaluate the accuracy of a model’s explanation (E) in a sim- Each image belongs to one of the three classes: melanoma
ilar way that one evaluates the accuracy of a predicted label (513 images), seborrheic keratosis (339 images) and benign
(Y ). We provide more details on the metrics used in Sec- nevus (1748 images). We use a version of this dataset
tion 4.2. In general, we expect several metrics of explana- described by Codella et al. (2018b), where the melanoma
tion efficacy to emerge, including those involving the target images were partitioned to 20 groups, the seborrheic ker-
explanation consumers (Dhurandhar et al., 2017). atosis images were divided into 12 groups, and 15 groups
were created for benign nevus, by a non-expert human user.
4.1 Datasets We show some example images from this dataset in Figure
The TED approach requires a training set that contains ex- 1. We take the 3 class labels to be Y and the 47 total groups
planations. Since such datasets are not readily available, we to be E. In this dataset, each e maps to a unique y. We
evaluate the approach on a synthetic dataset (tic-tac-toe, see partition the original training set into a training set with
supplement) and leverage 3 publicly available datasets in a 1600 images, and a validation set with 400 images, for use
unique way: AADB (Kong et al., 2016), Olfactory (Keller et in our experiments. We continue using the original test set
al., 2017) and Melanoma detection (Codella et al., 2018a). with 600 images.4.2 Metrics works were trained for 100 epochs with a batch size of
An open question that we do not attempt to resolve here 64. The embedding layer that provides the 64−dimensional
is the precise form that explanations should take. It is im- output had a learning rate of 0.01, whereas all other lay-
portant that they match the mental model of the explanation ers had a learning rate of 0.001. For training the embed-
consumer. For example, one may expect explanations to be dings using pairwise losses, we used 100, 000 pairs chosen
categorical (as in tic-tac-toe, loan approval reason codes, or from the training data, and optimized the loss for 15 epochs.
our melanoma dataset) or discrete ordinal, as in human rat- The hyper-parameters (c1 , c2 , c3 , c4 , m1 , m2 , w) were de-
ings. Explanations may also be continuous in crowd sourced fined as (0.1, 0.3, 0.2, 0.2, 0.25, 0.25, 0.1). These parame-
environments, where the final rating is an (weighted) aver- ters were chosen because they provided a consistently good
age over the human ratings. This is seen in the AADB and performance in all metrics that we report for the validation
Olfactory datasets that we consider, where each explanation set.
is averaged over 5 and 49 individuals respectively. Table 1a provides accuracy numbers for Y and E using
In the AADB and Olfactory datasets, since we use the the proposed approaches. Numbers in bold are the best for
existing continuous-valued attributes as explanations, we a metric among an algorithm. Improvement in accuracy and
choose to treat them both as-is and discretized into 3 bins, MAE for Y over the baseline is observed for for Multi-task,
{−1, 0, 1}, representing negative, neutral, and positive val- Pairwise Y + kNN and Pairwise Y & E + kNN approaches.
ues. The latter mimics human ratings (e.g., not pleasing, Clearly, optimizing embeddings based on Y, and sharing in-
neutral, or pleasing). Specifically, we train on the original formation between Y and E is better for predicting Y . The
continuous Y values and report absolute error (MAE) be- higher improvement in performance using Y & E similar-
tween Y and a continuous-valued prediction Ŷ . We also ities can be explained by the fact that Y can be predicted
similarly discretize Y and Ŷ as −1, 0, 1. We then report both easily using E in this dataset. Using a simple regression
absolute error in the discretized values (so that |1 − 0| = 1 model, this predictive accuracy was 0.7890 with MAE of
0.2110 and 0.0605 for Discretized and Continuous, respec-
and |1−(−1)| = 2) as well as 0-1 error (Ŷ = Y or Ŷ 6= Y ),
tively. There is also a clear advantage in using embedding
where the latter corresponds to conventional classification
approaches compared to multi-task regression.
accuracy. We use bin thresholds of 0.4 and 0.6 for AADB
and 33.66 and 49.68 for Olfactory to partition the Y scores The accuracy of E varies among the three kNN tech-
in the training data into thirds. niques with slight improvements by using pairwise Y and
The explanations E are treated similarly to Y by comput- then pairwise Y & E. Multi-task regression performs better
ing `1 distances (sum of absolute differences over attributes) than embedding approaches in predicting E for this dataset.
before and after discretizing to {−1, 0, 1}. We do not, how-
ever, compute the 0-1 error for E. We use thresholds of −0.2
and 0.2 for AADB and 2.72 and 6.57 for Olfactory, which 4.4 Melanoma
roughly partitions the values into thirds based on the training
data. For this dataset, we use the same approaches we used for the
For the melanoma classification dataset, since both Y and AADB dataset with a few modifications. We also perform
E are categorical, we use classification accuracy as the per- kNN using embeddings from the baseline Z network, and
formance metric for both Y and E. we do not obtain embeddings using weighted pairwise loss
with Y and E because there is a one-to-one map from E
4.3 AADB to Y in this dataset. The networks used are also similar to
We use all the approaches proposed in Section 3.2 to obtain the ones used for AADB except that we use cross-entropy
results for the AADB dataset: (a) simple regression base- losses. The learning rates, training epochs, and number of
lines for predicting Y and E, (b) multi-task regression to training pairs were also the same as AADB. The hyper-
predict Y and E together, (c) kNN using embeddings from parameters (m1 , m2 ) were set to (0.75, 0.75), and were cho-
the simple regression network (Y ), (d) kNN using embed- sen to based on the validation set performance. For the loss
dings optimized for pairwise loss using Y alone, and E (1), a and b were said to be neighbors if ya = yb and non-
alone, and embeddings optimized using weighted pairwise neighbors otherwise. For the loss (2), a and b were said to be
loss with Y and E. neighbors if za = zb and non-neighbors ya 6= yb . The pairs
All experiments with the AADB dataset used a mod- where za 6= zb , but ya = yb were not considered.
ified PyTorch implementation of AlexNet for fine-tuning Table 1b provides accuracy numbers for Y and E using
(Krizhevsky, Sutskever, and Hinton, 2012). We simplified the proposed approaches. Numbers in bold are the best for
the fully connected layers for the regression variant of a metric among an algorithm. The Y and E accuracies for
AlexNet to 1024-ReLU-Dropout-64-n, where n = 1 for multi-task and kNN approaches are better than that the base-
predicting Y , and n = 11 for predicting E. In the multi- lines, which clearly indicates the value in sharing informa-
task case for predicting Y and E together, the convolutional tion between Y and E. The best accuracy on Y is obtained
layers were shared and two separate sets of fully connected using the Pairwise E + kNN approach, which is not surpris-
layers with 1 and 11 outputs were used. The multi-task net- ing since E contains Y and is more granular than Y . Pair-
work used a weighted sum of regression losses for Y and wise Y + kNN approach has a poor performance on E since
E: lossY + λlossE . All these single-task and multi-task net- the information in Y is too coarse for predicting E well.Table 1: Accuracy of predicting Y and E using different methods (Section 3.2). Baselines for Y and E are regres-
sion/classification networks, Multi-task learning predicts both Y and E together, Embedding Y + kNN uses the embedding
from the last hidden layer of the baseline network that predicts Y . Pairwise Y + kNN and Pairwise E + kNN use the cosine
embedding loss in (1) and (2) respectively to optimize the embeddings of X. Pairwise Y & E + kNN uses the sum of cosine
embedding losses in (3) to optimize the embeddings of X.
(a) AADB dataset (b) ISIC Melanoma detection dataset
Performance on Y Performance on E Algorithm λ or K Y Accuracy E Accuracy
MAE MAE Baseline (Y ) NA 0.7045 NA
Algorithm λ or k Class. Accuracy Discretized Continuous Discretized Continuous Baseline (E) NA 0.6628 0.4107
Baseline (Y ) NA 0.4140 0.6250 0.1363 NA NA 0.01 0.6711 0.2838
Baseline (E) NA NA NA NA 0.5053 0.2042 0.1 0.6644 0.2838
100 0.4170 0.6300 0.1389 0.4501 0.1881 1 0.6544 0.4474
250 0.4480 0.5910 0.1315 0.4425 0.1861 Multi-task 10 0.6778 0.4274
Multi-task 500 0.4410 0.5950 0.1318 0.4431 0.1881 classification 25 0.7145 0.4324
regression 1000 0.4730 0.5650 0.1277 0.4429 0.1903 (Y & E) 50 0.6694 0.4057
(Y &E) 2500 0.3190 0.6810 0.1477 0.4917 0.2110 100 0.6761 0.4140
5000 0.3180 0.6820 0.1484 0.5165 0.2119 250 0.6711 0.3957
500 0.6327 0.3907
1 0.3990 0.7650 0.1849 0.6237 0.2724
1 0.6962 0.2604
Embedding Y 2 0.4020 0.7110 0.1620 0.5453 0.2402
Embedding Y 2 0.6995 0.2604
+ 5 0.3970 0.6610 0.1480 0.5015 0.2193
+ 5 0.6978 0.2604
kNN 10 0.3890 0.6440 0.1395 0.4890 0.2099
kNN 10 0.6962 0.2604
15 0.3910 0.6400 0.1375 0.4849 0.2069
15 0.6978 0.2604
20 0.3760 0.6480 0.1372 0.4831 0.2056
20 0.6995 0.2604
1 0.4970 0.5500 0.1275 0.6174 0.2626 1 0.6978 0.4357
Pairwise Y 2 0.4990 0.5460 0.1271 0.5410 0.2356 Embedding E 2 0.6861 0.4357
+ 5 0.5040 0.5370 0.1254 0.4948 0.2154 + 5 0.6861 0.4357
kNN 10 0.5100 0.5310 0.1252 0.4820 0.2084 kNN 10 0.6745 0.4407
15 0.5060 0.5320 0.1248 0.4766 0.2053 15 0.6828 0.4374
20 0.5110 0.5290 0.1248 0.4740 0.2040 20 0.6661 0.4424
1 0.3510 0.8180 0.1900 0.6428 0.2802 1 0.7162 0.1619
Pairwise E 2 0.3570 0.7550 0.1670 0.5656 0.2485 Pairwise Y 2 0.7179 0.1619
+ 5 0.3410 0.7140 0.1546 0.5182 0.2262 + 5 0.7179 0.1619
kNN 10 0.3230 0.6920 0.1494 0.5012 0.2174 kNN 10 0.7162 0.1619
15 0.3240 0.6790 0.1489 0.4982 0.2150 15 0.7162 0.1619
20 0.3180 0.6820 0.1483 0.4997 0.2133 20 0.7162 0.1619
1 0.7245 0.3406
1 0.5120 0.5590 0.1408 0.6060 0.2617
Pairwise E 2 0.7279 0.3406
Pairwise Y & E 2 0.5060 0.5490 0.1333 0.5363 0.2364
+ 5 0.7229 0.3389
+ 5 0.5110 0.5280 0.1272 0.4907 0.2169
kNN 10 0.5260 0.5180 0.1246 0.4784 0.2091 kNN 10 0.7279 0.3389
15 0.7329 0.3372
15 0.5220 0.5220 0.1240 0.4760 0.2065
20 0.7312 0.3356
20 0.5210 0.5220 0.1235 0.4731 0.2050
4.5 Olfactory 3 kNN techniques with no clear advantages. The multi-task
linear regression does not perform as well as the Pairwise
Since random forest was the winning entry on this dataset loss based approaches that use non-linear networks.
(Keller et al., 2017), we used a random forest regression
to pre-select 200 out of 4869 features for subsequent mod-
eling. From these 200 features, we created a base regres- 5 Discussion
sion network using fully connected hidden layer of 64 units One potential concern with the TED approach is the addi-
(embedding layer), which was then connected to an out- tional labor required for adding explanations. However, re-
put layer. No non-linearities were employed, but the data searchers (Zaidan and Eisner, 2008; Zhang, Marshall, and
was first transformed using log 10(100 + x) and then the Wallace, 2016; McDonnell et al., 2016) have quantified that
features were standardized to zero mean and unit vari- the time to add labels and explanations is often the same as
ance. Batch size was 338, and the network with pair- just adding labels for an expert SME. They also cite other
wise loss was run for 750 epochs with a learning rate of benefits of adding explanations, such as improved quality
0.0001. For this dataset, we set (c1 , c2 , c3 , c4 , m1 , m2 , w) and consistency of the resulting training data set.
to (10, 20, 0.0272, 0.0272, 0.25, 0.25, 1.0). The parameters Furthermore, in some instances, the kNN instantiation
were chosen to maximize performance on the validation set. of TED may require no extra labor. For example, in cases
Table 2 provides accuracy numbers in a similar format as where embeddings are used as search criteria for evidence-
Table 1a. The results show, once again, improved Y accu- based predictions of queries, end users will, on average,
racy over the baseline for Pairwise Y + kNN and Pairwise naturally interact with search results that are similar to the
Y & E + kNN and corresponding improvement for MAE for query in explanation space. This query-result interaction ac-
Y . Again, this performance improvement can be explained tivity inherently provides similar and dissimilar pairs in the
by the fact that the predictive accuracy of Y given E using explanation space that can be used to refine an embedding
the both baselines were 0.8261, with MAEs of 0.1739 and initially optimized for the predictions alone. This reliance
3.4154 (4.0175 for RF) for Discretized and Continuous, re- on relative distances in explanation space is also what dis-
spectively. Once again, the accuracy of E varies among the tinguishes this method from multi-task learning objectives,Table 2: Accuracy of predicting Y and E for Olfactory using different methods. Baseline LASSO and RF predict Y from X.
Multi-task LASSO regression with `21 regularization on the coefficient matrix predicts Y&E together, or just E. Other methods
are similar to those in Table 1
Performance on Y Performance on E
MAE MAE
Algorithm k Class. Accuracy Discretized Continuous Discretized Continuous
Baseline LASSO (Y ) NA 0.4928 0.5072 8.6483 NA NA
Baseline RF (Y ) NA 0.5217 0.4783 8.9447 NA NA
Multi-task regression (Y &E) NA 0.4493 0.5507 11.4651 0.5034 3.6536
Multi-task regression (E only) NA NA NA NA 0.5124 3.3659
1 0.5362 0.5362 11.7542 0.5690 4.2050
Embedding Y 2 0.5362 0.4928 9.9780 0.4950 3.6555
+ 5 0.6087 0.4058 9.2840 0.4516 3.3488
kNN 10 0.5652 0.4783 10.1398 0.4622 3.4128
15 0.5362 0.4928 10.4433 0.4798 3.4012
20 0.4783 0.5652 10.9867 0.4813 3.4746
1 0.6087 0.4783 10.9306 0.5515 4.3547
Pairwise Y 2 0.5362 0.5072 10.9274 0.5095 3.9330
+ 5 0.5507 0.4638 10.4720 0.4935 3.6824
kNN 10 0.5072 0.5072 10.7297 0.4912 3.5969
15 0.5217 0.4928 10.6659 0.4889 3.6277
20 0.4638 0.5507 10.5957 0.4889 3.6576
1 0.6087 0.4493 11.4919 0.5728 4.2644
Pairwise E 2 0.4928 0.5072 9.7964 0.5072 3.7131
+ 5 0.5507 0.4493 9.6680 0.4767 3.4489
kNN 10 0.5507 0.4493 9.9089 0.4897 3.4294
15 0.4928 0.5072 10.1360 0.4844 3.4077
20 0.4928 0.5072 10.0589 0.4760 3.3877
1 0.6522 0.3913 10.4714 0.5431 4.0833
Pairwise Y &E 2 0.5362 0.4783 10.0081 0.4882 3.6610
+ 5 0.5652 0.4638 10.0519 0.4622 3.4735
kNN 10 0.5072 0.5217 10.3872 0.4653 3.4786
15 0.5072 0.5217 10.7218 0.4737 3.4955
20 0.4493 0.5797 10.8590 0.4790 3.5027
since absolute labels in explanation space need not be de- (Keller et al., 2017) and a publicly-available Melanoma de-
fined. tection dataset (Codella et al., 2018a). We hope this work
will inspire other researchers to further enrich this paradigm.
6 Conclusion
References
The societal demand for “meaningful information” on auto- Ainur, Y.; Choi, Y.; and Cardie, C. 2010. Automatically gen-
mated decisions has sparked significant research in AI ex- erating annotator rationales to improve sentiment classifi-
planability. This paper suggests a new paradigm for pro- cation. In Proceedings of the ACL 2010 Conference Short
viding explanations from machine learning algorithms. This Papers, 336–341.
new approach is particularly well-suited for explaining a ma-
chine learning prediction when all of its input features are in- Bastani, O.; Kim, C.; and Bastani, H. 2018. Interpreting
herently incomprehensible to humans, even to deep subject blackbox models via model extraction. arXiv preprint
matter experts. The approach augments training data collec- arXiv:1705.08504.
tion beyond features and labels to also include elicited ex- Biran, O., and Cotton, C. 2017. Explanation and justification
planations. Through this simple idea, we are not only able to in machine learning: A survey. In IJCAI-17 Workshop on
provide useful explanations that would not have otherwise Explainable AI (XAI).
been possible, but we are able to tailor the explanations to Caruana, R.; Lou, Y.; Gehrke, J.; Koch, P.; Sturm, M.; and
the intended user population by eliciting training explana- Elhadad, N. 2015. Intelligible models for healthcare:
tions from members of that group. Predicting pneumonia risk and hospital 30-day readmis-
There are many possible instantiations for this proposed sion. In Proc. ACM SIGKDD Int. Conf. Knowl. Disc. Data
paradigm of teaching explanations. We have described a Min., 1721–1730.
novel instantiation that learns feature embeddings using la-
bels and explanation similarities in a joint and aligned way Codella, N. C.; Gutman, D.; Celebi, M. E.; Helba, B.;
to permit neighbor-based explanation prediction. We present Marchetti, M. A.; Dusza, S. W.; Kalloo, A.; Liopyris, K.;
a new objective function to learn an embedding to optimize Mishra, N.; Kittler, H.; et al. 2018a. Skin lesion analy-
k-nearest neighbor search for both prediction accuracy as sis toward melanoma detection: A challenge at the 2017
well as holistic human relevancy to enforce that returned international symposium on biomedical imaging (isbi),
neighbors present meaningful information. We have demon- hosted by the international skin imaging collaboration
strated the proposed paradigm and two of its instantiations (isic). In Biomedical Imaging (ISBI 2018), 2018 IEEE
on a tic-tac-toe dataset (see Supplement) that we created, 15th International Symposium on, 168–172. IEEE.
a publicly-available image aesthetics dataset (Kong et al., Codella, N. C.; Lin, C.-C.; Halpern, A.; Hind, M.; Feris, R.;
2016), a publicly-available olfactory pleasantness dataset and Smith, J. R. 2018b. Collaborative human-ai (chai):Evidence-based interpretable melanoma classification in Lundberg, S., and Lee, S.-I. 2017. A unified approach to
dermoscopic images. arXiv preprint arXiv:1805.12234. interpreting model predictions. In Advances of Neural Inf.
Proc. Systems.
Dhurandhar, A.; Iyengar, V.; Luss, R.; and Shanmugam, K.
2017. A formal framework to characterize interpretability McDonnell, T.; Lease, M.; Kutlu, M.; and Elsayed, T. 2016.
of procedures. In Proc. ICML Workshop Human Interp. Why is that relevant? collecting annotator rationales for
Mach. Learn., 1–7. relevance judgments. In Proc. AAAI Conf. Human Com-
put. Crowdsourc.
Donahue, J., and Grauman, K. 2011. Annotator rationales
for visual recognition. In ICCV. Miller, T.; Howe, P.; and Sonenberg, L. 2017. Explain-
able AI: Beware of inmates running the asylum or: How I
Doshi-Velez, F., and Kim, B. 2017. Towards a rig- learnt to stop worrying and love the social and behavioural
orous science of interpretable machine learning. In sciences. In Proc. IJCAI Workshop Explainable Artif. In-
https://arxiv.org/abs/1702.08608v2. tell.
Doshi-Velez, F.; Kortz, M.; Budish, R.; Bavitz, C.; Gersh- Miller, T. 2017. Explanation in artificial intelligence:
man, S.; O’Brien, D.; Schieber, S.; Waldo, J.; Weinberger, Insights from the social sciences. arXiv preprint
D.; and Wood, A. 2017. Accountability of AI under the arXiv:1706.07269.
law: The role of explanation. CoRR abs/1711.01134.
Montavon, G.; Samek, W.; and Müller, K.-R. 2017. Methods
Goodman, B., and Flaxman, S. 2016. EU regulations on for interpreting and understanding deep neural networks.
algorithmic decision-making and a ‘right to explanation’. Digital Signal Processing.
In Proc. ICML Workshop Human Interp. Mach. Learn.,
26–30. Peng, P.; Tian, Y.; Xiang, T.; Wang, Y.; and Huang, T. 2016.
Joint learning of semantic and latent attributes. In ECCV
Hendricks, L. A.; Akata, Z.; Rohrbach, M.; Donahue, J.; 2016, Lecture Notes in Computer Science, volume 9908.
Schiele, B.; and Darrell, T. 2016. Generating visual ex-
planations. In European Conference on Computer Vision. Ribeiro, M. T.; Singh, S.; and Guestrin, C. 2016. “Why
should I trust you?”: Explaining the predictions of any
Jimenez-del-Toro, O.; Hanbury, A.; Langs, G.; Foncubier- classifier. In Proc. ACM SIGKDD Int. Conf. Knowl. Disc.
taRodriguez, A.; and Muller, H. 2015. Overview of the Data Min., 1135–1144.
visceral retrieval benchmark 2015. In Multimodal Re-
Selbst, A. D., and Powles, J. 2017. Meaningful informa-
trieval in the Medical Domain (MRMD) Workshop, in
tion and the right to explanation. Int. Data Privacy Law
the 37th European Conference on Information Retrieval
7(4):233–242.
(ECIR).
Sun, Q., and DeJong, G. 2005. Explanation-augmented svm:
Keller, A.; Gerkin, R. C.; Guan, Y.; Dhurandhar, A.; Turu, an approach to incorporating domain knowledge into svm
G.; Szalai, B.; Mainland, J. D.; Ihara, Y.; Yu, C. W.; learning. In 22nd International Conference on Machine
Wolfinger, R.; Vens, C.; Schietgat, L.; De Grave, K.; Learning.
Norel, R.; Stolovitzky, G.; Cecchi, G. A.; Vosshall, L. B.;
and Meyer, P. 2017. Predicting human olfactory percep- Sun, J.; Wang, F.; Hu, J.; and Edabollahi, S. 2012. Super-
tion from chemical features of odor molecules. Science vised patient similarity measure of heterogeneous patient
355(6327):820–826. records. In SIGKDD Explorations.
Kong, S.; Shen, X.; Lin, Z.; Mech, R.; and Fowlkes, C. 2016. Wachter, S.; Mittelstadt, B.; and Floridi, L. 2017. Why a
Photo aesthetics ranking network with attributes and con- right to explanation of automated decision-making does
tent adaptation. In Proc. Eur. Conf. Comput. Vis., 662– not exist in the general data protection regulation. Int.
679. Data Privacy Law 7(2):76–99.
Krizhevsky, A.; Sutskever, I.; and Hinton, G. E. 2012. Im- Wan, J.; Wang, D.; Hoi, S.; Wu, P.; Zhu, J.; Zhang, Y.; and
agenet classification with deep convolutional neural net- Li, J. 2014. Deep learning for content-based image re-
works. In Adv. Neur. Inf. Process. Syst. 25. 1097–1105. trieval: A comprehensive study. In Proceedings of the
ACM International Conference on Multimedia.
Kulesza, T.; Stumpf, S.; Burnett, M.; Yang, S.; Kwan, I.; and
Wong, W.-K. 2013. Too much, too little, or just right? Weller, A. 2017. Challenges for transparency. In Proc.
Ways explanations impact end users’ mental models. In ICML Workshop Human Interp. Mach. Learn. (WHI), 55–
Proc. IEEE Symp. Vis. Lang. Human-Centric Comput., 3– 62.
10. Zaidan, O. F., and Eisner, J. 2008. Modeling annotators: A
Lei, T.; Barzilay, R.; and Jaakkola, T. 2016. Rationalizing generative approach to learning from annotator rationales.
neural predictions. In EMNLP. In Proceedings of EMNLP 2008, 31–40.
Zhang, Y.; Marshall, I. J.; and Wallace, B. C. 2016.
Li, Z.; Zhang, X.; Muller, H.; and Zhang, S. 2018. Large-
Rationale-augmented convolutional neural networks for
scale retrieval for medical image analytics: A comprehen-
text classification. In Conference on Empirical Methods
sive review. In Medical Image Analysis, volume 43, 66–
in Natural Language Processing (EMNLP).
84.A Synthetic Data Experiment
We provide a synthetic data experiment using the tic-tac-toe
dataset. This dataset contains the 4,520 legal non-terminal
positions in this classic game. Each position is labeled with a
preferred next move (Y ) and an explanation of the preferred
move (E). Both Y and E were generated by a simple set of
rules given in Section A.1.
A.1 Tic-Tac-Toe
As an illustration of the proposed approach, we describe a
simple domain, tic-tac-toe, where it is possible to automati-
cally provide labels (the preferred move in a given board po-
sition) and explanations (the reason why the preferred move
is best). A tic-tac-toe board is represented by two 3 × 3 bi-
nary feature planes, indicating the presence of X and O, re-
spectively. An additional binary feature indicates the side to
move, resulting in a total of 19 binary input features. Each
legal board position is labeled with a preferred move, along
with the reason the move is preferred. The labeling is based
on a simple set of rules that are executed in order (note that
the rules do not guarantee optimal play):
1. If a winning move is available, completing three in a row
for the side to move, choose that move with reason Win
2. If a blocking move is available, preventing the opponent
from completing three in a row on their next turn, choose
that move with reason Block
3. If a threatening move is available, creating two in a row
with an empty third square in the row, choose that move
with reason Threat
4. Otherwise, choose an empty square, preferring center
over corners over middles, with reason Empty
Two versions of the dataset were created, one with only
the preferred move (represented as a 3 × 3 plane), the sec-
ond with the preferred move and explanation (represented
as a 3 × 3 × 4 stack of planes). A simple neural net-
work classifier was built on each of these datasets, with
one hidden layer of 200 units using ReLU and a softmax
over the 9 (or 36) outputs. On a test set containing 10%
of the legal positions, this classifier obtained an accuracy
of 96.53% on the move-only prediction task, and 96.31%
on the move/explanation prediction task (Table 3). When
trained on the move/explanation task, performance on pre-
dicting just the preferred move actually increases to 97.42%.
This illustrates that the overall approach works well in a sim-
ple domain with a limited number of explanations. Further-
more, given the simplicity of the domain, it is possible to
provide explanations that are both useful and accurate.
Table 3: Accuracy of predicting Y, Y and E in tic-tac-toe
Input Y Accuracy Y and E Accuracy
Y 0.9653 NA
Y and E 0.9742 0.9631You can also read