Quality & Popularity' Prediction Modeling of TV Programme through Fuzzy QFD Approach
←
→
Page content transcription
If your browser does not render page correctly, please read the page content below
JOURNAL OF ADVANCES IN INFORMATION TECHNOLOGY, VOL. 3, NO. 2, MAY 2012                                                    77

    ‘Quality & Popularity’ Prediction Modeling of
    TV Programme through Fuzzy QFD Approach
                                                     Savitur Prakash *
                                              Department of Engineering
                                   Doordarshan Kendra (TV station), Lucknow, India
                        * Uphar-268, Eldeco-Udyan-1; Bhadrukh, Lucknow- 226002, India
                                            saviturprakash@rediffmail.com

                                                    Dr. Manuj Darbari #
                                         Department of Information Technology,
                                               BBDNITM, Lucknow, India
                                      # A-649, Indira Nagar, Lucknow-226016, India
                                               manujuma@rediffmail.com

Abstract—In this paper we tried to dwell on to the problem       only a few of them encounter a positive response from its
of identifying the most important ‘Quality and Popularity        viewer and thus could become success in term of
contributing factors’, which plays an important role in          monetary returns, but majority of others could not even
deciding the ‘Popularity’ of a TV production.                    get back their investment or just equalize it and some
We first tried to identify correctly the most important          more unfortunates get totally loss as they even do not get
‘Quality and popularity’ contributing factors of a TV
programme which makes the TV programme more popular
                                                                 any commercial sponsorship for their production.
and successful, and then applied the knowledge of a most         A. Motivation
suitable scientific technique i.e. Fuzzy QFD in our situation,
which would successfully incorporate these identified                Though most of the producers of the TV industry used
factors by establishing a proper correlation between these       to concern about the latest way of incorporating the
factors and the relative engineering requirements which          current trend and technicality of the production industries
used to effects these factors mostly if not considered at the    rather, in a blind manner to prove that their production
time of production of the TV programme, and lastly we            incorporating the latest feature of the industry, even then
analyze our findings by simulating a most approximate            their programme does not taste the success on real
‘fuzzy inference rule’ based ‘Quality and Popularity’            ground. There exist a number of cases of drastic failure of
prediction model.                                                hugely invested projects which incorporates the entire
    Our model would rather help in deciding the best
                                                                 latest technicality and invested millions of rupee in the
combination of identified characteristic, for which ‘Quality
& popularity’ of the said TV programme will be predictable       projects, why it is so?
on a suitable linguistic scale, and could be kept high by            A general trend in a TV programme making is the
maintaining the minimum required threshold of different          concern about a good script, a well trained director,
identified characteristics.                                      shooting technicians, camera persons, good sound
                                                                 recordist and vision mixer engineers and for post
Index Terms—Fuzzy Quality Function Deployment (FQFD),            production a well establish non linear editing facility with
House of Quality (HOQ), Fuzzy Inference mechanism                some good editors for audio and video effect generation
(FIM), TV Production (Television program production)             and mixing for final presentation of the programme, is
                                                                 been taken as a sufficient resource to produce a good
                   I. INTRODUCTION                               quality programme, is it enough to contribute well in a
    In TV entertainment industries where millions of             success of the production? Does not the heterogeneous
money are being invested in producing variety of T V             background of the viewers play any role in the success of
programmes on regular basis and after finishing the              a programme? Does only the above mentioned resources
production, producers of the programme, start search for         are enough to cross the benchmark of viewer’s
sponsorship of their production through various                  expectations? These and several other questions often
commercial agencies or directly with TV channel owners,          come in producers mind when a well invested project
to get some good return on their investment, these               faces a drastic failure. The purpose of this research is
agencies in return provide them a platform to telecast           oriented towards answering these queries on a well
their programme for the viewers and depending upon the           structured scientific background and thereby designing a
response of the viewers in terms of popularity of the said       computational prediction model of ‘TV programme
programme the return on the investment of the producers          popularity’ based on our scientific finding of related data.
could be decided, though every producer has invested his         B. Problem statement and objectives
money by thinking a good return on the investment but

© 2012 ACADEMY PUBLISHER
doi:10.4304/jait.3.2.77-90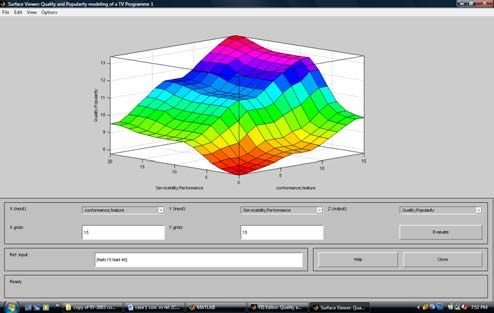
78                                         JOURNAL OF ADVANCES IN INFORMATION TECHNOLOGY, VOL. 3, NO. 2, MAY 2012

The problem motivation stated above suggest us that it is      the respective improvements i.e. which one is needed to
only the viewer of a programme who is responsible for its      improve most so that the viewers requirements relating to
popularity or failure and if we any how can identify the       that particular attribute could almost get fulfilled and thus
most common features of a programme which, the                 contribute most to make the proposed TV production
viewers want most, and through some effective scientific       ‘Popular and Success’. After suitably ranking these
methodology could insert these requirements in the             identified improvement factors contributing more
proposed TV programme well at the time of production,          towards popularity and success of the TV programme we
only then we might be able to make it popular among the        rigorously prepared a related rule base depending upon
viewers, but the heterogeneous background of Television        our findings to simulate the most approximate ‘fuzzy
viewers and their responses about a popular TV                 inference model of popularity prediction’ by utilizing
programme is so scattered that selecting and organizing        Fuzzy toolbox of MAT Lab environment to relate the
them in a two or three sub groups of most rated                ‘popularity’ of the programme in relation with the above
requirements is difficult to interpret accurately, as the      identified attributes and then discuss the result.
responses are in linguistic terms and thus difficult to
judge on crisp scale.                                          D. Organization of the paper
    Since the identification of ‘popularity ingredients’ of
                                                                   Apart from this introduction rest of the paper is
the TV programme will be based upon these findings
                                                               explained in three major parts, in section-2 a brief
therefore in case of wrong judgment of linguistic terms
                                                               overview of fuzzy logic, fuzzy inference mechanism,
on crisp scale will cause the wrong prediction of the
                                                               introduction of the traditional QFD (Quality Function
success metrics ingredients and this in result will produce
                                                               Deployment) and building up of HOQ (House of Quality)
a wrong result. Hence in this scenario we identify our
                                                               is given. Section-3 explains our proposed fuzzyQFD
problem statement as:
                                                               based ‘TV programme ‘popularity factor identification’;
     •   To identify correctly the most important              we explained our work thoroughly with the help of both
         common popularity factors of a TV programme           the approaches i.e. crisp and fuzzy in relation to our
         which makes a programme more popular and              gathered data. Section-4 presents the result analysis and
         successful, through its viewers (audience) point      decision on the identified important production metrics,
         of view and judge them accurately in linguistic       we correlate the different metrics that has been identified
         term by some appropriate technique.                   above through simulation by utilizing the fuzzy tool box
     •   To find and apply a most suitable scientific          of MAT lab, an exhaustive exercise is been done while
         technique which will successfully incorporate         preparing the rule base in accordance with our findings
         these popularity factors and interpret them on a      for the fuzzy inference system, to simulate a more
         suitable linguistic scale.                            accurate model for prediction after suitably scaling the
                                                               linguistic variables and their respective membership
     •   To establish a proper correlation between these       functions.
         identified factors and the relative engineering           We conclude this research work with a discussion
         requirements which used to effects these factors      about future work scope. Appendix ‘A’ and ‘B’ explain
         mostly if not considered at the time of               the necessary calculation steps involved in our work and
         production of the TV programme.                       Appendix ‘C explains the necessary parameters and the
     •   To propose a basic popularity prediction model        applied fuzzy rule base which we prepared for simulation
         based on our findings of the above popularity         work.
         ingredients and its simulation for prediction
         study purposes.                                            II. FUZZY LOGIC & QUALITY FUNCTION
                                                                             DEPLOYMENT(QFD)
C. Contribution and adopted methodology
                                                               A. Fuzzy Logic
    Since the viewers requirements were expressed in
linguistic term therefore to initiate our work correctly we        Use of Fuzzy sets in logical expression is known as
applied fuzzy logic concepts (because fuzzy theory is a        Fuzzy Logic. Fuzzy Logic is a superset of a Boolean
well proven methodology of Soft computing in dealing           logic and that has been extended to take care of the
with linguistic variables effectively) to weight the           partially truth values. It is a mathematical technique for
requirements on a suitable linguistic scale and then we        dealing with imprecise data and problems that have many
correlate the identified attributes more accurately in         solutions rather than one. Fuzzy logic works with ranges
accordance with the voice of viewers. we did a lot of          of values, solving problems in a way that more resembles
literature survey to find the most suitable correlating        human logic. Fuzzy logic is a logical system which is an
technique which in our scenario seems to fit correctly         extension of multi valued logic. Fuzzy logic starts with
when applied correctly to correlate viewers requirements       and builds on a set of user supplied human language
to the design attributes of the production, we find QFD        rules. The fuzzy system converts these rules to their
(Quality function deployment ) in combination with             mathematical equivalents. Fuzzy logic can handle
fuzzy i.e. Fuzzy QFD most suitable to fulfill our criteria     problems with imprecise, vague and incomplete data. In
of application. We then ranked them in accordance to           Fuzzy Logic a proposition may be true or false or have an
their importance ranking (find out on linguistic scale), for   intermediate truth value, such as may be true. Fuzzy

© 2012 ACADEMY PUBLISHER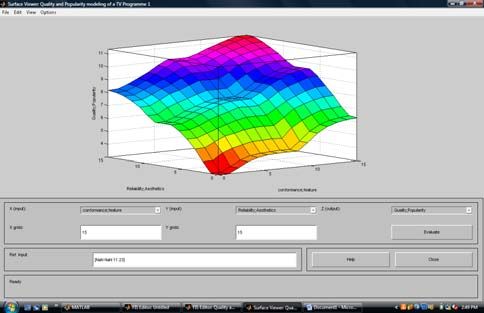
JOURNAL OF ADVANCES IN INFORMATION TECHNOLOGY, VOL. 3, NO. 2, MAY 2012                                                   79

systems try to emulate cognitive process of the brain with     C. QFD and House of quality (HoQ)
a rule base. The basic concept is inspired by the human
process, where the decisional criteria are not clear cut but       Generally a four phase approach is accomplished by
blurred and is difficult to find objective to make decision    using a series of matrixes that guides the product or
more precise and clear [1].                                    service team’s activities by providing standard
                                                               documentation during product and/ or process
B. Fuzzy inference mechanism (FIM)                             development (Figure 2.1).
    To get a better understanding of fuzzy inference
mechanism we will start with Generalized Modus Ponens
(GMP) which is analogue of the ‘Modus Ponens’ rule of
the classical logic[14]. Its format is given by:
          R:       If p then q                   (Rule)

         F:          p’                          (premise)

       C:                      q’
                               (conclusion)

   In general if R will be interpreted as a fuzzy relation
on U x V and F will be interpreted as a fuzzy set on U, so
that C = RoF ( composition of F and R) is a fuzzy set on
V where U = domain of x and V = domain of y in other
words , we have

              C(y) = max {min [F(x), R(x, y)]}

Where max is taken over all x in U. The given process by
which the conclusion is derived is called fuzzy inference
[5].                                                                     Figure 2.1 The four phases of traditional QFD
      The general format of fuzzy inference mechanism
      (FIM) is as follows:                                         As shown in figure 2.1 each phase has a matrix
          ¾ It consists of several rules (several R’s)         consisting of a vertical column of “What’s” and a
               each R consisting of one or more                horizontal row of “How’s”. “What’s” are CR; “How’s”
               antecedents (one or more F) and only one        are the ways of achieving them (CRs). At each stage, the
               consequent C. The collection of such rules      “How’s” are carried to the next phase as “What’s”. As a
               is called the rule base or fuzzy rule base      result, the House of Quality can be built in many shapes
               (FRB).                                          and forms. The general purpose of QFD model includes
          ¾ One or more given facts (matching the total        the components is shown in Figure 2.2.
               number of antecedents) in the form of               Customers requirements (CR) - Also known as
               fuzzy propositions.                             "Voice of Customer" or VoC, they are the "what’s" the
          ¾ The objective is to arrive at the appropriate      customers want from the product to be developed. They
               conclusion(s) via the interpretations           contain customers’ wishes, expectations and requirements
               described above and the Generalized             for the product.
               Modus Ponens (GMP).                                 Customer importance ratings - Once these "what’s"
We now explain the actual details of FIM procedure. Let        are in place, the customer needs to provide numerical
the total number of linguistic rules be K and let the kth      ratings to these "what’s" items in terms of their
rule be given by                                               importance to the customer. A numerical rating of 1 to 5
                                                               is often used, in which the number 5 represents the most
R (k): if < x1 is A1k > and  and …and < xN
                                                               important and 1 the least.
                         is ANk>
                                                                   Customer market competitive evaluations - In this
                    Then < z is Bk >
                                                               block, a comparison is made between a company's
Where x1, x2,…xN are the input variables with domains          product/service and similar competitive products/services
U1,U2,…,UN and z is the output variable with domain V.         on the market by the customer. The comparison results
Aik and Bk (i = 1, 2,…,N) are linguistic values                will help the developer position the product on the market
characterized by fuzzy sets with membership function           as well as find out how the customer is satisfied now. For
also denoted by the same symbols. We are also given N          each product, the customer gives 1 to 5 ratings against
number of facts : < x1 is A1>, < x2 is A2>… < xN is            each CR, 5 being best satisfied and 1 the worst.
AN>.                                                               Technical specifications - They are the technical
                                                               specifications that are to be built into a product with the
                                                               intention to satisfy the CR. They are sometimes referred
                                                               as "hows" because they are the answers to CR: how can

© 2012 ACADEMY PUBLISHER
80 JOURNAL OF ADVANCES IN INFORMATION TECHNOLOGY, VOL. 3, NO. 2, MAY 2012
the requirements be addressed or satisfied. They are the factors correctly and in orderly fashion, to do so we here
engineers' understanding in technical terms what proposed a novel practical application of fuzzy QFD
customers really want. The technical specifications must
be quantifiable or measurable so that they can be used for
design.
Relationship matrix - Relationship matrix is used to
maintain the relationship between CR and design
requirements. In other words, the matrix corresponds to
the "what’s" vs. "how’s". It is the center part of HoQ and
must be completed by technical team. A weight of 1-3-9
or 1-3-5 is often used for internal representation of
relationship, 1 being the weak and the biggest number
being the strong relationship.
Correlation matrix - It is the triangular part in the
HoQ (the "roof"). The correlation matrix is used to
identify which "how’s" items support one another and
which are in conflict. Positive correlation help identify
"how’s" items that are closely related and avoid
duplication of efforts. Negative correlation represents
conditions that will probably require trade-offs. The
positive and negative ratings are usually quantified using
2, 1, -1, and -2 ratings, with 2 being the two "how’s"
items are strongly supportive to each other and -2 being
the conflicting. Sometimes only 1 and -1 are used.
Target goals - Completed by technical team, these are
the "how much’s" of the technical "how’s" items. They Figure 2.2 House of Quality (HoQ) in QFD
provide designers with specific technical guidance for
what have to be achieved as well as objectively method which is been derived through the fusion of
measuring the progress. The goals have to be quantified computer science and management science discipline.
in order to be specific and measurable. Through this approach we try to resolve the issue of
Technical difficulty assessment - Technical team identifying the most important incorporable factor among
conducts the assessment. It helps to establish the the various almost same looking important factors by
feasibility and reliability of each "how’s" item. 1 to 5 suitably deciding the ranking as per their importance in
ratings are used to quantify technical difficulty with 5 viewers mind and then discarding those factors which are
being the most difficult and 1 being the easiest. less important or less relevant to accommodate in the
Technical competitive evaluation - It is used for proposed production. We start making a suitable HOQ
comparing the new product with competitor's products to (QFD process) as explained in previous section through
find out if these technical requirements are better or the following stages:
worse than competitors. Again, 1 to 5 ratings are used A. Determining the Viewers Demand
with 5 being the fully realized each particular "how’s"
item and 1 being the worst realized. The initial and most critical step of the QFD process
Overall importance ratings – This is the final step of in our case is, the identification of ‘what’ TV viewer
finishing HoQ for phase 1. For each column, sum all the want and expect from a good TV programme. In this step,
row numbers each of which is equal to the production of viewers’ demands, expectations, and complaints are
relationship rating and customer's important rating. The determined. Identified data contain current viewer’s
results help identify critical product requirements and expectations that are critical to success and potential
assist in the trade-off decision making process. expectations that would excite viewers. Several methods
can be used to establish the viewers' requirements,
III. PROPOSED WORK including: viewer’s panels; focused group discussions;
structured or unstructured viewers interviews; self-
In order to identify most common incorporable factors completing questionnaires; in-depth viewers observation;
which will make a programme more popular and viewers' complaint and compliment database; viewers'
successful among its viewer the various important service inquiries database; front-line staff feedback. The
feedbacks of the viewers must be ranked first as per the list of viewer demand was identified with literature
decreasing or increasing order of importance of a search, and focusing on group brainstorming in the
particular factor in viewers mind and then finding what concerned audience research unit, which was applied in
most of the viewers want to see in a particular this study. In the brainstorming process, group considered
programme. The task of listing and identifying these the complaints that were received from viewers as an
factors is so complicated that the audience research unit input. In addition that small viewer group was chosen for
of the production house becomes unable to sort out the the pilot study. In this study an open question was asked
© 2012 ACADEMY PUBLISHERJOURNAL OF ADVANCES IN INFORMATION TECHNOLOGY, VOL. 3, NO. 2, MAY 2012 81
to the respondent to gather data. After collecting data,
this list was obtained. Further refining among these attributes led us to
suitably categories them into three broad factors which
The list of the viewer’s concerns is shown below:
are of relevancy from the production point of view, we
grouped them as explained below:
1. Cost of production of the programme
¾ Popularity factor
2. Production house brand name
¾ Entertainment factor
3. Sufficient well advance promotion
¾ Regional factor
4. Contents of programme
5. Ease in understanding Only the below given attributes are compatible on
6. Confined to specific group of viewer these three factors and based on the items loading on each
7. Able to convey the hidden message factor. These twelve attributes are shown as items in the
8. Provides entertainment Table 3.2. Therefore rest of the attributes was not
9. Repeat telecast of the programme (time slot) considered further.
10. Avoids vulgarity in programme Table 3.2 attributes categorization in three factors
11. Related to viewers environment
12. Related to social environment Popularity Entertainment Regional
13. Appealing (presentation) factor factor factor
14. Characterization
15. Duration of program Time slot Ease in Related to
16. avoids excessive mid breaks allotment understanding viewers
17. Appropriate theme for family viewing environment
At any one time it is unlikely that TV organization Duration of Content of Related to
can satisfy all of its viewers' requirements. Therefore it is the program program social
necessary to prioritize the needs that are to be met within environment
a planning cycle systematically. Using a structured Provide Appropriate for -------
questionnaire, 300 viewers were asked to rate the entertainment family viewing
importance of the programme features identified and to Presentation Avoids vulgarity ------
compare the performance of the many existing popular Avoid ------- ------
TV programmes with their “ideal programme” In this excessive mid
way it was possible to see which quality characteristics breaks
are more important for meeting or exceeding viewers' Able to -------- ------
expectations. The rate of importance is a rating of the convince
viewer demands on a scale of 1 to 5. On this scale 5 meaning
denotes most important and 1 denotes relatively low
importance. The viewers should assign these ratings. B. Viewers competitive evaluation
Mean and standard deviation of the attributes is depicted
Viewer's competitive evaluation is conducted
in table 3.1
according to the result of the survey is given in Table 3.3.
This table consists of ten columns. Every column is
Table 3.1: Mean and standard deviations of viewers preferred attributes explained below.
Column 1: consist of Viewer’s rate of importance of
Attribute Variables Mean Standard identified preferred attributes.
deviation
Cost of production 2.71 1.25 Column 2: This column represents the current
Production house brand name 3.05 1.23 performance of the programme in question i.e.
Sufficient well advance 3.09 1.26
promotions
programme ‘A’, considering the quality characteristics.
Contents of programme 4.26 1.03 The viewer performance evaluation of the surveying TV
Ease in understanding 4.05 1.20 organization (producer of programme ‘A’) provides a
Confined to a specific group of 3.70 0.99
viewers listing of the satisfaction degree for the each of the
Able to convey the hidden 4.23 1.06 quality characteristics. A scale of 1 to 5 was used.
message
Provide entertainment 4.31 1.02 Columns 3, 4, 5: The viewer evaluation of the
Repeat telecast of the 4.34 1.02 performance of the competitors’ programme of the
programme (time slot
allotment)
surveying TV organization was determined using a scale
Avoids vulgarity in 4.61 0.97 of 1 to 5. In this case three competitors TV organization
programme
Related to viewers 3.83 1.05
(name could not be disclosed due to legal reasons) were
environment examined for comparing and benchmarking process.
Related to social environment 3.95 0.99 Column 6: This column shows the planning phase of
Appealing (presentation) 3.91 0.92
Characterization 3.09 0.91 the organization. This is determined by looking at where
Duration of programme 4.25 0.64 the viewer programme is today, and what the competitors
Avoids excessive mid breaks 4.55 0.78
Appropriate theme for family 4.51 0.81
are doing with respect to the viewer demands. It also
viewing
© 2012 ACADEMY PUBLISHER82 JOURNAL OF ADVANCES IN INFORMATION TECHNOLOGY, VOL. 3, NO. 2, MAY 2012
takes into account the organization’s strategic plan and edge. In this study sales point scores were determined
policy deployment. using brain storming process among the experts who
Column 7: Column 7 contains the factor by which works at the programme production department in the
actual improvements must be adjusted to reach the levels organization, which was applied to this study. A score of
that organization in question i.e. A wants to achieve. 1.5 is used to indicate a strong sales point. A score of 1.2
These were calculated by dividing the planned quality is used for a lesser sales point and a blank or 1.0 is used
target levels by the current quality levels. It is called the for items, which are not sales point. It is impractical to
rate of improvement. The value of the rate of make every customer demand a sales point. A weight,
improvement 1.00 would signify that no improvement which was determined by experts can be assigned to the
was necessary. presence of a sales point and used in calculation of the
quality weight [8].
Table 3.3: Viewer competitive evaluation matrix
Column 9: This column is named as row weight or
Column 1 2 3 ….. absolute weight. Row weight is determined by
Level of multiplying the rate of importance (column 1) by the rate
attributes
of improvement (column 7) and multiplying the result by
Primary
Level
Secondary
Level
Rate
of
Compe-
titor
Our
Progra-
the sales point (column 8). Row weight = (column 1) x
(Attributes) Import- X
Progr-
mme (column 7) x (column 8) (1)
ance ‘A’
amme Column 10: Final column is determined by
Popularity Time slot allotment 4.34 3.2 3.59 converting the absolute weight to the percentage.
Factor
Duration of program 4.25 3.24 3.36
Provide 4.31 3.4 3.44 C. Determining the Technical Requirements
entertainment
Presentation 3.91 3.16 3.67 In this stage, determined viewers demands were
Avoids excess mid 4.55 3.36 3.79 translated into technical requirements. The objective is to
breaks
Able to convince 4.23 3.2 3.26
translate each viewer’s voice into one or more technical
meantime requirements. Each technical requirement should be
Entertain- Ease in 4.05 3.16 3.21 measurable and global in nature and should satisfy the
ment
Factor understanding voice of the viewer. Table 3.4 has addressed the “what”
Content of 4.26 3.2 3.31
Programme
question by identifying viewers’ requirements. This third
Appropriate to 4.51 3.48 3.74 stage addresses the “how” question by identifying the
family Viewing measurable and definable design features of the viewers
Avoids Vulgarity 4.61 3.32 3.36 programme. In this study, eight important quality
Regional Related to viewers 3.83 3.4 3.56
Factor
Environment
characteristics, which were defined by Garvin, were
Related to social 3.95 3.12 3.36 considered to meet and related to viewers requirements.
Environment These are performance, features, reliability,
conformance, durability, serviceability, aesthetics, and
…4 5 6 7 8 9 10 perceived quality. All of these quality characteristics
Compe-
titor
Compe-
titor
Goal Impo-
vment
Sales
Point
Row
Weight
Demand
Weight were explained below [9].
Y
Progr-
Z
Progr-
Ratio
Performance refers to the primary operating
amme Mme characteristics of the product or service. They are usually
measurable. For a TV programme these characteristics
3.52 3.14 4.34 1.21 1.5 7.87 10.37
would relate to the regional factor such as, related to
3.17 2.85 4.25 1.26 1.2 6.45 8.50 viewers environment or related to social environment.
3.43 3.25 4.31 1.25 1.5 8.10 10.67 Features are additional characteristics that enhance the
3.43 3.14 3.91 1.07 1.0 4.17 5.49 product/service appeal to the user. Adding prize
3.61 3.15 4.55 1.20 1.5 8.19 10.79 distribution to the viewers and encouraging them to
3.43 2.99 3.45 1.06 1.2 5.37 7.08 participate through SMS in between the programme can
2.83 2.81 4.05 1.26 1.2 6.13 8.08
3.52 3.1 3.52 1.06 1.0 4.53 5.97 be given as an example. Reliability of a product is the
3.52 3.01 4.51 1.21 1.5 8.16 10.75 likelihood that a product will not fail within a specific
3.52 2.83 3.52 1.05 1.5 7.24 9.54 time period. An example is the inclusion of some local
3.43 3.04 3.83 1.08 1.0 4.12 5.43 announcements, or some informative educative content in
3.39 2.96 3.95 1.18 1.2 5.57 7.34 between the proposed show. Although Garvin states that
75.91 100.0
reliability is more relevant to durable goods there are
many examples of reliability as a key element of a service
Column 8: This column that is named as sales point and fast moving product.
shows which of viewer demands or attributes of
programme have more important effect on marketing and
image of the programme. In other words which attributes
of the programme ensure competitive advantage for the
TV organization against its rivals? In this case the
organization in question can improve this competitive
© 2012 ACADEMY PUBLISHERJOURNAL OF ADVANCES IN INFORMATION TECHNOLOGY, VOL. 3, NO. 2, MAY 2012 83
Table 3.4: Relationship matrix between how’s and what’s their Television sets. Serviceability is the speed with
which the product can be put into service when it breaks
How’s Performance Features Reliability....…
down. In our scenario of TV programme we relate it to
What’s
Primary Level Secondary the adaptability of the show i.e. flexibility in script to
(factors) level
(attributes)
accommodate any future changes to make it continuously
Popularity Time slot 1 9 9 more interesting as it progresses. Aesthetics is the
Factor Allotment
subjective dimension indicating the kind of response a
Duration of
Programme
1 9 9 user has to a product. It represents the individual’s
personal preferences. It reflects the ways of individual’s
Provide
entertainment
1 9 9
responds to the look, feel, sound, taste, and smell. A
Presentation 3 3
person judging the content of the programme would say it
is of higher quality but other can judge exactly opposite
Avoids excess 9 9 9 of this person.
Mid breaks
Able to
convince
1 9 9 D. Relationship matrix between how’s and what’s
meaning
Entertainment Ease in 9 3 9 After establishing what’s and how’s, construction of
Factor understanding
house of quality continues with establishing the
Contents of
Programme
3 3 9 relationships between the customer voices and the
Appropriate
technical requirements [10]. To build the relationship
for family
3 9 9
matrix between how’s and what’s, it is necessary to
viewing
Avoids 9 3 9
establish if relationships exist between every what and
vulgarity every how. All relationships are categorized such as
Regional Related to 9 9 9 either strong, medium, or weak. A score of 9 is used to
Factor viewer
environment indicate a strong relationship between what’s and how’s.
Related to
social
9 9 9 A score of 3 signifies a moderate relationship and a
environment square or 1 signifies a weak relationship between them.
Weight of column’s
The matrix in Table 3.4 shows all relationship between
457.4 867.15 725.61
customer requirements and technical requirements.
5 2 3
E. Column weights
Weights were calculated for each technical
…...Conformance Durability Serviceability Aesthetics
requirement that represent a combination of both the
viewers’ level of importance and the strength of the
9 1 3 9 relationships. This is accomplished by multiplying the
9 3 3 9
relationship strength and the importance. Thus, in column
1, row 1, in Table 3.3, the viewers’ importance level
9 3 3 9 (demand weight) is 10.37 and weight for the weak
9 9 3 9 relationship is 1; their product is 10.37. At the
9 3 9 intersection of column 1 and row 2, the product is 8.50.
This calculation process is continued wherever there is a
9 1 3 9
relationship in the column. For the column 1, the sum of
9 1 3 9 these products is 457.40. Using the same calculation all
9 1 1 of the column weights have been determined and shown
at the bottom line of the Table 3.4
9 1 3 3
9 1 3 3
F. Fuzzy Quality Function Deployment Approach
9 3 3
As we described above in our work that various
9 3 3
inputs, in the form of judgments and evaluations are
900.09 191.05 288.09 615.66
needed in the QFD charts. Normally, these inputs are
1 7 6 4
gathered through questionnaires, deep interviews, and
focus groups. This gives rise to uncertainties when trying
to quantify the information. Therefore we also investigate
Conformance is precision with which the product or the same problem through Fuzzy logic, in order to reduce
service meets the specified standards. In our case it the uncertainty of the collected data, and then we
relates to the technical aspect of production and post investigate the result obtained through both methods to
production features like non linear editing, special audio analyze which of one will resolve the issue more
and visual effects etc. Durability measures the length of a appropriately.
product’s life. For TV programme, it measures how long
the popularity of the show will keep its viewers stuck to
© 2012 ACADEMY PUBLISHER84 JOURNAL OF ADVANCES IN INFORMATION TECHNOLOGY, VOL. 3, NO. 2, MAY 2012
1. Integrating Fuzzy Logic with QFD Table 3.5: Definition of linguistic variables
In FQFD approach, we translate the crisp values into
fuzzy numbers, which can be considered as probability
distribution [65] and used to test the significance of the
coefficients. Mathematically,
(3.1) Table 3.6 shows viewers rating and relative
importance using linguistic variables. The ranges of
Where Aij is a symmetrical triangular fuzzy number linguistic values for quantifying the relationship were
(TFN) which is defined by the interval [α1ij, α2ij]. Using pre-determined by intuition. The ranges of ratings were
the same notation, a typical membership function for a then derived from calculated rating and pre-determined
symmetrical TFN Aij can be expressed by: uncertainty value. In this study, uncertainty value was
fixed ±0.1. For example demand weight was calculated at
a score of 10.37 for providing ‘time slot’ attribute in the
traditional QFD approach. In the FQFD approach,
demand weight was calculated as a range which is 10.27
(3.2) – 10.47. For other attributes, demand weights were
calculated in the same method and it is shown in the
The scalar multiplication of TFN and the sum of two rating column in Table 3.6 using FQFD approach,
symmetrical TFNs can be represented as follows: individual ratings were calculated using the above given
equation, and then translated into normalized individual
ratings.
(3.3) The result obtained through the calculations formed
the table 3.6 (below) which is the viewers rating and
relative importance using linguistic variables as explained
(3.4) through table 3.5(above)
Where λ denotes the scalar quantity and [α1, α2] and [β1, Table 3.6: Viewer Ratings and Relative Importance Using Fuzzy
β2] are the intervals of the two symmetrical TFNs approach
respectively. Performance Reliability Feature ….
In this study, individual rating equations can be Ratings
generalized as: Time slot 10.27 - 10.47 W S S
Allotment
Duration of 08.40 – 08.60 W S S
program
Individual rating =
Provide 10.57 – 10.77 W S S
Entertainment
Presentation 05.39 – 05.59 W W
Where Aij and Xj denote the relative importance of the Avoids excess 10.69 – 10.89 S S S
ith characteristic with respect to the jth viewers need in mid Breaks
the relationship matrix and importance of the jth viewer Able to convey
meaning
06.98 – 07.18 W S S
need perceived by the viewer, which are customer rating Ease in 07.98 – 08.18 S W S
respectively. In this study, to compare between crisp Under
individual ratings and fuzzy individual ratings, we used standing
Content of 05.87 – 06.07 M W S
normalized individual ratings. programme
The normalized individual rating for each characteristic Appropriate 10.65 – 10.85 M S S
can be determined as: for family
viewing
Avoids 09.44 – 09.64 S W S
vulgarity
Related 05.33 – 05.53 S S S
(3.5) to viewer’s
Environment
The relative importance and the customer rating can be Related 07.24– 07.44 S S S
linguistic or crisp variable. As mentioned, linguistic to social
environment
variables such as strong relation, (s) moderate relation, Individual 31.59 48.81 65.01
(m) and weak relation, (w) are used to describe the Ratings
76.98 86.97 98.99
relative importance instead of 9, 3 and 1. These linguistic
variables first translated into TFNs numbers (Table 3.5) Normalized
Individual
0.31 0.48 0.64
Ratings
0.76 0.85 0.97
© 2012 ACADEMY PUBLISHERJOURNAL OF ADVANCES IN INFORMATION TECHNOLOGY, VOL. 3, NO. 2, MAY 2012 85
.….Conformance Durability Serviceability Aesthetics programme success and popular) through normalized
viewers requirement ratings, and make important
S W M S
decision on the attribute ranking.
S M M S
S M M S
S S M S 1 ‘Performance’ vs. ‘Serviceability’
S M S
S W M S For a TV programme these characteristics relate to the
S W M S regional factor such as, ‘related to viewers environment’
S W W or ‘related to social environment’, and Serviceability in
S W M M our scenario of ‘TV programme’ is the adaptability of the
S W M M TV show i.e. flexibility in script to accommodate any
S M M future changes to make it continuously more interesting
S M M
as it progresses.
68.75 10.01 18.48 45.95 Now we observe that ‘Performance’ has a score of
0.51 while considering crisp methodology and
101.8 63.49 79.61 88.10
‘Serviceability’ has a score of 0.32 ,which is quite low in
0.68 0.10 0.18 0.45
terms of importance ranking if compared with
1.0 0.62 0.78 0.87 ‘Performance’, therefore if we consider crisp approach
we would put ‘Serviceability’ in lower ranking in respect
IV. ANALYSIS, SIMULATION & RESULT to ‘Performance, but the fuzzy methodology
consideration imply a rating of 0.31 – 0.76 for
In this section we will analyze our findings of
performance and 0.18 – 0.78 for serviceability which is
previous section to conclude the topic and discuss the
almost same for both quality attributes thus put them at
result; to start with we will prepare a table which is the
the same ranking of quality requirements. Since
summary of our findings through the two mentioned
‘serviceability’, in our case is the capability of the ‘T V
approaches i.e. crisp and fuzzy. This will facilitate us in
programme in question’ for future adaptation to keep it
comparison of the two methodology and in deciding the
popular, and through fuzzy approach we found its
improvement if any.
ranking same as the rating of ‘Performance’ i.e. of equal
Table 4.1 Results generated by the FQFD approach and the crisp importance, but this important attribute would have not
approach
been considered had we considered only crisp rating
Design Through Through crisp methodology and would have lost it for equal
requirement fuzzy approach consideration for improvement. Therefore we conclude
approach about ‘performance’ and ‘serviceability that they are of
Performance 0.31 – 0.76 0.51 the same importance and should be considered equally
Feature 0.64 – 0.97 0.96 for improvement i.e. the TV programme ‘A’ must have
Reliability 0.48 – 0.85 0.81 provision to be related to its viewers environment as well
Conformance 0.68 – 1.00 1.00 as to its social environment and the provision of future
Durability 0.10 – 0.62 0.21 adaptability (i.e. flexibility in script, characters and shoot
Serviceability 0.18 – 0.78 0.32 locations etc to kept it popular in long run) at the same
Aesthetics 0.45 – 0.87 0.68 level.
The ratings related with the crisp approach are also 2 ‘Feature’ vs. ‘Conformance’
normalized using the maximum ratings obtained. As it Feature in our case is, adding prize distribution
was mentioned before, normalized individual rating is through lottery to the participating viewers and
calculated by dividing individual rating by the maximum encouraging them to participate through SMS in between
rating. Maximum individual rating for the crisp approach the programme or after the programme etc. while
is determined as a score of 900.09. This rating value Conformance in our case of TV programme is the
shows that the conformance attribute has a maximum technical aspect of production shoot and post production
rating and the highest score. For each attribute of the ‘TV engineering features like non linear editing, special audio
programme in question’ normalized value for crisp and visual effects etc.
approaches (as mentioned in above table 4.1) is also
calculated as shown in ‘appendix B’, in order for better Now considering the outcome of importance rating
comparison and analysis. through crisp methodology, it is 0.96 for the quality
attribute ‘Feature’ while for ‘Conformance’ it is 1.0
which keep it at the top of ranking while ‘Feature’ comes
A. Decision on relative ranking of attributes
next to conformance , now so far as fuzzy methodology is
Now we will consider each attribute separately or concerned quality attribute ‘Feature’ having a rating in
collectively and analyze the scope of improvement the range 0.64 – 0.97 and ‘conformity’ obtain a reading
(needed or not needed) depending upon its relative of 0.68 – 1.0 which obviously put quality characteristic
ranking of importance (needed to make the TV ‘Conformance’ at the top of ranking but to the quality
© 2012 ACADEMY PUBLISHER86 JOURNAL OF ADVANCES IN INFORMATION TECHNOLOGY, VOL. 3, NO. 2, MAY 2012
characteristic ‘Feature’ it also give the same level of We shall now graduate to the next step of analysis
importance. which is co relational analysis part, to do so we need to
consider the table 3.6 of previous section which identifies
Therefore through the above discussion we conclude
the applicable correlation among the viewer’s
to put both of them i.e. ‘Feature and Conformance’ at the
requirement and the quality engineering requirement or
same level thus enhancing the feature by introducing
feasibility of incorporating.
viewers participation either through prizes or through
As per our relational ranking analyzed above
SMS participation and well take care of shooting
‘Conformance’ tops the list now we will analyze the
technicality such as proper lighting to shoot correctly,
viewers requirement dependency on it, by examining the
proper camera control, proper audio balancing and vision
table 3.6 we observe that all the twelve selected
mixing, proper after shoot editing and audio mixing etc
requirements of the viewers have ‘Strong’ correlation
should be taken with equal care and with top priority to
with ‘conformance’ and thus make it more relevant to
make the launching programme a quality success.
improve upon. Next on ranking is the quality attribute
‘Feature’ , which also has strong correlation with all the
3 ‘Reliability’ vs. ‘Aesthetics’ viewers requirements except one that is ‘Presentation’
As we explain previously that Reliability of a product which indicates that by improving upon the ‘Feature
is the likelihood that a product will not fail within a quality attribute of programme production we would
specific time period. This is the key element for users marginally improve the ‘Presentation’ requirements of
who need the product to work without fail, in our the viewers.
scenario of TV programme it will be like the inclusion of Next on our list are ‘Reliability and ‘Aesthetics’
some local regional employment or administrative quality attribute which by looking on table 3.6 indicates
announcements, or some informative educative content in that ‘Reliability has four ‘weak’ correlation among the
between the proposed show by which viewers shall feel viewers requirement ‘Presentation’, ‘Ease in
connected to it on regular basis, Aesthetics is the understanding’, ‘Content of programme’ and ‘Avoids
subjective dimension indicating the kind of response a vulgarity’, therefore improving upon the ‘Reliability’
user has to a product. It represents the individual’s quality attribute of programme, will marginally satisfied
personal preferences. It reflects the ways of individual’s these four requirements of the viewers. Now coming to
responds to the look, feel, sound, taste, and smell. A ‘Aesthetics’ quality attribute we observe that it does not
person judging the content of the programme would say it have any correlation with factor 3 viewers requirements
is of higher quality but other viewer can judge exactly namely,’ Related to viewers environment’ and ‘Related to
opposite of this person. social environment’ and has medium correlation with
‘Appropriate for family viewing’ and ‘Avoids vulgarity’
Now considering them on crisp rating scale we have
and with ‘Content of the programme’ requirements of
0.81 score for quality requirement ‘Reliability’ while
viewers it has a weak correlation, except these other
‘Aesthetics obtain 0.68 which is far below than
remaining requirements are strongly correlated with
‘Reliability’, so through crisp approach we put
‘Aesthetics’ quality attribute, similarly we make
‘Reliability’ far head than ‘Aesthetics’, but is it proper to
consideration for ‘Performance’ and ‘Serviceability’
consider ? Let’s have a look on fuzzy methodology!
quality attributes through the table and find that
Which suggest the rating of 0.45 – 0.87 for both of them
‘Performance’ attribute is not related to the ‘Presentation’
and thus judge them at equal rank. Therefore we would
requirement of viewer thus only this requirements would
have been wrong had we considered crisp approach only.
be left out even if improving upon this quality attribute
‘Time slot allotment’, ‘duration of programme’, ‘Provide
4 ‘Durability’
entertainment’ and ‘Able to convey meaning’
requirements of viewers are weakly correlated with this
Durability measures the length of a product’s life
attribute and ‘content of programme’ and ‘Appropriate
which in our scenario of TV programme, it measures how for family viewing’ is having medium correlation with
long (time period) the popularity of the show will remain this attribute. So far as ‘Serviceability’ quality attribute is
same and keep its viewers stuck to their Television set on concerned only ‘content of programme’ requirement is
regular basis. weakly correlated with it and all other requirements are
Now considering the outcome of importance rating medium correlated.
through crisp methodology, for ‘Durability’ it is 0.21
which indicates the lowest ranking, while through fuzzy C. Simulation work
methodology it is 0.10 – 0.62 which is also lowest among
other attribute but indicates moderate consideration if Based on our above analysis we arranged a test bed
consider upper bound. by utilizing fuzzy tool box of MATLAB 7.0 set up, to
further investigate our findings on Quality contributing
B. Investigating additive influence of identified factors factors and their additive influence on the ‘quality and
and their contribution towards ‘Quality and Popularity’ popularity’ of the TV programme, to do so we redefine
of TV programme the above found ‘quality and popularity’ affecting
attributes on a suitable linguistic scale and defined them
through triangular fuzzy membership functions and kept
© 2012 ACADEMY PUBLISHERJOURNAL OF ADVANCES IN INFORMATION TECHNOLOGY, VOL. 3, NO. 2, MAY 2012 87
them under a suitable range for modeling purpose and range i.e. ‘Above normal’ to ‘High’ for almost all upper
then we exhaustively prepared a rule base considering all half ranges of variables
the combinations of the above found ‘Quality and Similarly other two interesting cases that we observed
popularity’ affecting attributes by keeping their rank of through simulating the various scenario, for which
contribution as per the above done analysis, the results ‘Quality & Popularity’ of the TV programme could easily
are shown below in the screen shots taken from the model be maintained in the upper ranges with optimize
and parameters of test set up is shown in Annexure ‘C’ at balancing of the variables are self explanatory and
the end of this dissertation. Linguistic variable term and depicted in below given screen shots in fig.4.2 and 4.3.
their corresponding values of the above found Quality
attributes are taken at three level of contribution in TV
Programme, for minimum contribution of any attribute
we define linguistic term “Insufficient” through triangular
fuzzy function similarly for moderate contribution we
defined the term “Sufficient”, and for higher level of
contribution we used the term “High”, and to depict the
“Quality and Popularity” in term of linguistic term we
took help of the words.”Less” for lower level of Quality
& Popularity level, “Normal” for below moderate level of
Quality & Popularity, “Above normal” term is used for
explaining the level in the above moderate range and
lastly we used the term “High” for higher level of
popularity.
Through this simulation work we tried to identify the Figure 4.2 “[Conformance & Features]”vs. “[Serviceability
most balanced suitable combination of Quality and &Performance]” With [Reliability & Aesthetics] and [Durability] are
Popularity contributing factors which collectively seems in the linguistic range of “high”
to provide the best result with intelligent contribution
towards the ‘Quality and Popularity’ of the TV The above depicted screen shot of fig.4.2 models the
programme and thus is more influential when applied variation among ‘Conformance & Features’ (on X axis)
collectively, which would otherwise have been more and ‘Serviceability & Performance’ (on Y axis) while we
costlier affair if applied in isolation to each other, in this keep ‘Reliability & Aesthetics’ and Durability in the
prediction simulation ‘Quality and Popularity’ of the TV linguistic range “High”, we observe that the ‘Quality &
programme is shown as output on Z axis in relation with Popularity’ of the programme could be kept in higher
the varying attributes taken on X and Y axis as mentioned ranges with comparatively less efforts i.e. for almost
below the respective figures. entire two third upper range of ‘serviceability and
performance’ gradual increase in the ‘Conformance &
Feature’ from threshold value would keep the ‘Quality &
Popularity’ almost in “Above normal” to “High” ranges.
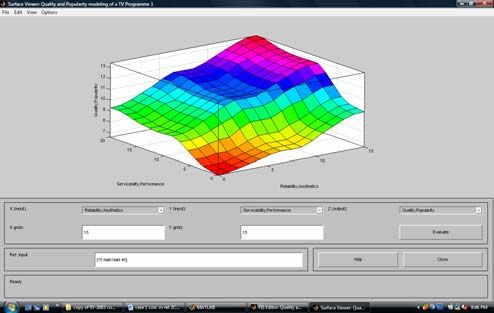
Figure 4.1 “[Conformance & Features]” vs. “[Reliability &
Aesthetics]”With [Serviceability & Performance] and [Durability] are
in the linguistic range of “sufficient” Figure 4.3 “[Reliability & Aesthetics]” vs.” [Serviceability &
Performance]” With [Conformance & Feature] and [Durability] in
linguistic range of “High” (Quality & Popularity just reaches the “high”
The above depicted screen shot of fig.4.1 models the linguistic range for extremes)
variation among ‘Conformance & Features’ (on X axis)
and ‘Reliability & Aesthetics’ (on Y axis) while we keep Similarly, above depicted screen shot of fig.4.3
‘Serviceability & Performance’ and Durability in the models the variation among ‘Reliability & Aesthetics’
linguistic range “Sufficient”, we observe that the ‘Quality (on X axis) and ‘Serviceability & Performance’ (on Y
& Popularity’ of the programme could maintain higher axis) while we keep ‘Conformance and Feature’ and
‘Durability’ in the linguistic range “High”, we observe
© 2012 ACADEMY PUBLISHER88 JOURNAL OF ADVANCES IN INFORMATION TECHNOLOGY, VOL. 3, NO. 2, MAY 2012
that the ‘Quality & Popularity’ of the programme could was ranked to be second factor affecting the consumer
maintain higher range i.e. ‘Above normal’ to ‘High’ for preference. Reliability and aesthetics have the same
almost all upper two third ranges of ‘Serviceability & range, which is different in the crisp approach. After
Performance’ if we maintain ‘Reliability & Aesthetics’ conformance and features, rest of the quality
towards extreme. requirements have different priority in both approaches.
Since our research work is novel in nature and we
D. Conclusion and future scope have not seen any related research on “TV programme
In this research work, we have explained, how a popularity factor identification and their additive
quality plan can be determined for a proposed TV influencing nature in success of a TV programme,
programme ‘A’ by using Fuzzy QFD technique, QFD therefore this exploitation of the subject could further be
links viewer requirements or “what’s” with the technical expanded in all dimensions to the fulfillment of various
quality requirements or “how’s”, so the voice of the unseen possibilities and also by including some of the
viewer is translated into Quality engineering plan. Study unresolved issues of Quality and Popularity of TV
was conducted in the six stages as explained in chapter 4. prograame, also in this research we tried to explore the
The first and the most important part of the study are to topic through Fuzzy QFD and investigated the influence
determine the viewer’s wants and needs accurately. These further through Fuzzy inference modeling, as Fuzzy
viewers’ demands were grouped under three factors, inference modeling is a rule based modeling approach
which were labeled as: popularity factor, Entertainment therefore the additive influence is considered here strictly
factor, and Regional factor. These three factors include in accordance with the rule base and does not include the
most quality and popularity effecting attributes. At the uncertain or stochastic processes which may or may not
second stage of the study, ‘TV programme in question’ affect the Quality and popularity of the programme,
i.e. ‘A’ was evaluated with its three competitors. This hence The main challenge lies in our proposed work are:
evaluation was conducted by considering crisp and fuzzy
approaches. According to the crisp approach, avoid ¾ Discriminating Quality contributing factors
excess mid breaks in the popularity factor was found out when there are a large number of legitimate
the most important attribute to be improved. The second factors affecting a particular kind of TV
important attribute was determined in the Entertainment programme.
factor that is appropriate for family viewing. The third ¾ Generally ‘Quality and Popularity’ depends on
one is provides entertainment, which is in the popularity the above identified attributes but is there any
factor. Popularity and entertainment factors are more other stochastic process or processes involve
important than regional factors according to the viewer which play challenging role in the said
evaluation. determination.
In the fuzzy approach, requirement weights have been ¾ Identification and determination of good
determined as a range rather than a crisp value. threshold Values of attributes collectively is
According to fuzzy approach, the range of ratings of the very difficult and that should be dynamic or
requirements derived from calculated rating. Thus, avoids adaptable to be more effecting.
excessive mid breaks has a range of 10.69 – 10.89. It has
the highest upper limit. Appropriate for family viewing Depending upon the current situation, stochastic nature of
has a range of 10.65 – 10.85 if these two viewer influence is one additional possibility to be explored in
requirements are compared with each other it can be seen further research on the topic, we tried to write our work
that there is a small difference between these two in a self content manner so that the necessity of further
attributes. The next important viewer requirements is references could be reduced and the research work may
provide entertainment, which has a range of 10.57 – be proved to be complete in all manners.
10.77. At the third step, these requirements were
translated into the seven technical requirements. These APPENDIX ‘A’
characteristics, which were taken from Garvin’s study, (i) Calculation of ‘Individual Ratings’ mentioned in
are performance, features, reliability, conformance, Table 3.6 using FQFD Approach:
durability, serviceability, and aesthetics. After
determining relationship between how’s and what’s, the a) Performance Rating
weights of each technical requirement were calculated.
Considering this calculation, quality plan of TV (10.27x 0.0; 10.47 x 0.4)+(8.4 x 0.0; 8.6 x
programme ‘A’ was determined. Conformance was found 0.4)+(10.57 x 0.0; 10.77 x 0.4)+(5.39 x 0.0; 5.59 x
the first factor to be improved by both approaches. Then, 0.0)+(10.69 x 0.6; 10.89 x 1.0)+(6.98 x 0.0; 7.18 x
0,4)+(7.98 x 0.6; 8.18 x 1.0)+(5.87 x 0.3; 6.07 x
in the crisp approach, features, reliability, and aesthetics
0.7)+(10.65 x 0.3; 10.85 x 0.7)+(9.44 x 0.6; 9.64 x
were determined as essential technical requirements. 1.0)+(5.33 x 0.6; 5.53 x 1.0)+(7.24 x 0.6; 7.44 x 1.0)
Performance, serviceability and durability were found as = (31.59; 76.98)
the final improvement characteristics. On the other hand,
in the fuzzy approach, result was slightly different than All of the other ratings were calculated using the same notation
crisp approach. Conformance was also the most above
important attribute in the fuzzy approach, the features
© 2012 ACADEMY PUBLISHERYou can also read