PointFlowNet: Learning Representations for Rigid Motion Estimation from Point Clouds
←
→
Page content transcription
If your browser does not render page correctly, please read the page content below

PointFlowNet: Learning Representations for
                                                                     Rigid Motion Estimation from Point Clouds

                                                     Aseem Behl      Despoina Paschalidou       Simon Donné      Andreas Geiger
                                                    Autonomous Vision Group, MPI for Intelligent Systems and University of Tübingen
                                                       {aseem.behl,despoina.paschalidou,simon.donne,andreas.geiger}@tue.mpg.de
arXiv:1806.02170v3 [cs.CV] 7 Jan 2019

                                                                 Abstract                                     of all, most leading techniques take several minutes or hours
                                                                                                              to predict 3D scene flow. Secondly, stereo-based scene flow
                                           Despite significant progress in image-based 3D scene               methods suffer from a fundamental flaw, the “curse of two-
                                        flow estimation, the performance of such approaches has               view geometry”: it can be shown that the depth error grows
                                        not yet reached the fidelity required by many applications.           quadratically with the distance to the observer [20]. This
                                        Simultaneously, these applications are often not restricted to        causes problems for the baselines and object depths often
                                        image-based estimation: laser scanners provide a popular              found in self-driving cars, as illustrated in Fig. 1 (top).
                                        alternative to traditional cameras, for example in the context            Consequently, most modern self-driving car platforms
                                        of self-driving cars, as they directly yield a 3D point cloud.        rely on LIDAR technology for 3D geometry perception. In
                                        In this paper, we propose to estimate 3D motion from such             contrast to cameras, laser scanners provide a 360 degree
                                        unstructured point clouds using a deep neural network. In             field of view with just one sensor, are generally unaffected
                                        a single forward pass, our model jointly predicts 3D scene            by lighting conditions, and do not suffer from the quadratic
                                        flow as well as the 3D bounding box and rigid body motion             error behavior of stereo cameras. However, while LIDAR
                                        of objects in the scene. While the prospect of estimating 3D          provides accurate 3D point cloud measurements, estimat-
                                        scene flow from unstructured point clouds is promising, it is         ing the motion between two such scans is a non-trivial task.
                                        also a challenging task. We show that the traditional global          Because of the sparse and non-uniform nature of the point
                                        representation of rigid body motion prohibits inference by            clouds, as well as the missing appearance information, the
                                        CNNs, and propose a translation equivariant representation            data association problem is complicated. Moreover, charac-
                                        to circumvent this problem. For training our deep network,            teristic patterns produced by the scanner, such as the circular
                                        a large dataset is required. Because of this, we augment real         rings in Fig. 1 (bottom), move with the observer and can
                                        scans from KITTI with virtual objects, realistically modeling         easily mislead local correspondence estimation algorithms.
                                        occlusions and simulating sensor noise. A thorough compar-                To address these challenges, we propose PointFlowNet,
                                        ison with classic and learning-based techniques highlights            a generic model for learning 3D scene flow from pairs of
                                        the robustness of the proposed approach.                              unstructured 3D point clouds. Our main contributions are:

                                        1. Introduction                                                         • We present an end-to-end trainable model for joint 3D
                                                                                                                  scene flow and rigid motion prediction and 3D object
                                           For intelligent systems such as self-driving cars, the pre-            detection from unstructured LIDAR data, as captured
                                        cise understanding of their surroundings is key. Notably, in              from a (self-driving) car.
                                        order to make predictions and decisions about the future,
                                        tasks like navigation and planning require knowledge about              • We show that a global representation is not suitable for
                                        the 3D geometry of the environment as well as about the 3D                rigid motion prediction, and propose a local translation-
                                        motion of other agents in the scene.                                      equivariant representation to mitigate this problem.
                                           3D scene flow is the most generic representation of this
                                        3D motion; it associates a velocity vector with 3D motion               • We augment the KITTI dataset with virtual cars, taking
                                        to each measured point. Traditionally, 3D scene flow is                   into account occlusions and simulating sensor noise, to
                                        estimated based on two consecutive image pairs of a cali-                 provide more (realistic) training data.
                                        brated stereo rig [17, 39, 40]. While the accuracy of scene             • We demonstrate that our approach compares favorably
                                        flow methods has greatly improved over the last decade [24],              to the state-of-the-art.
                                        image-based scene flow methods have rarely made it into
                                        robotics applications. The reasons for this are two-fold. First       We will make the code and dataset available.

                                                                                                          1
ISF [3]
     PointFlowNet

Figure 1: Motivation. To motivate the use of LIDAR sensors in the context of autonomous driving, we provide a qualitative
comparison of the state-of-the-art image-based scene flow method ISF [3] (top) to our LIDAR-based PointFlowNet (bottom)
using a scene from the KITTI 2015 dataset [24]. The left column shows the output of the two methods. The right column shows
a zoomed-in version of the inlet. While the image-based result suffers from the “curse of two-view geometry” (with noisy
geometry, and non-uniform background movement), our LIDAR-based approach is also accurate in distant regions. Moreover,
ISF relies on instance segmentation in the image space for detecting objects: depth estimation errors at the boundaries lead to
objects being split into two 3D clusters (e.g., the red car). For clarity, we visualize only a subset of the points.
2. Related Work                                                    depth information is available, two consecutive RGB-D
                                                                   frames are sufficient for estimating 3D scene flow. Initially,
   In the following discussion, we first group related meth-       the image-based variational scene flow approach was ex-
ods based on their expected input; we finish this section with     tended to RGB-D inputs [15, 30, 45]. Franke et al. [11] in-
a discussion of learning-based solutions.                          stead proposed to track KLT feature correspondences using
Scene Flow from Image Sequences: The most common                   a set of Kalman filters. Exploiting PatchMatch optimiza-
approach to 3D scene flow estimation is to recover corre-          tion on spherical 3D patches, Hornacek et al. [16] recover
spondences between two calibrated stereo image pairs. Early        a dense field of 3D rigid body motions. However, while
approaches solve the problem using coarse-to-fine varia-           structured light scanning techniques (e.g., Kinect) are able to
tional optimization [2, 17, 37, 39–41, 44]. As coarse-to-fine      capture indoor environments, dense RGB-D sequences are
optimization often performs poorly in the presence of large        hard to acquire in outdoor scenarios like ours. Furthermore,
displacements, slanted-plane models which decompose the            structured light sensors suffer from the same depth error
scene into a collection of rigidly moving 3D patches have          characteristics as stereo techniques.
been proposed [22, 24, 25, 42]. The benefit of incorporating
                                                                   Scene Flow from 3D Point Clouds: In the robotics com-
semantics has been demonstrated in [3]. While the state-of-
                                                                   munity, motion estimation from 3D point clouds has so far
the-art in image-based scene flow estimation has advanced
                                                                   been addressed primarily with classical techniques. Sev-
significantly, its accuracy is inherently limited by the geomet-
                                                                   eral works [6, 34, 36] extend occupancy maps to dynamic
ric properties of two-view geometry as previously mentioned
                                                                   scenes by representing moving objects via particles which
and illustrated in Figure 1.
                                                                   are updated using particle filters [6, 34] or EM [36]. Others
Scene Flow from RGB-D Sequences:              When per-pixel       tackle the problem as 3D detection and tracking using mean
shift [1], RANSAC [7], ICP [26], CRFs [38] or Bayesian            binarization, where any voxel containing at least one point
networks [14]. In contrast, Dewan et al. [8] propose a 3D         is set to 1 and all others are zero. However, better results
scene flow approach where local SHOT descriptors [35] are         can be achieved by aggregating high-order statistics over the
associated via a CRF that incorporates local smoothness and       voxel [5,27–29,32,48]. In this paper, we leverage the feature
rigidity assumptions. While impressive results have been          encoding recently proposed by Zhou et al. [48], which has
achieved, all the aforementioned approaches require signifi-      demonstrated state-of-the-art results for 3D object detection
cant engineering and manual model specification. In addi-         from point clouds.
tion, local shape representations such as SHOT [35] often             We briefly summarize this encoding, but refer the reader
fail in the presence of noisy or ambiguous inputs. In contrast,   to [48] for more details. We subdivide the 3D space of each
we address the scene flow problem using a generic end-to-         input point cloud into equally spaced voxels and group points
end trainable model which is able to learn local and global       according to the voxel they reside in. To reduce bias with
statistical relationships directly from data. Accordingly, our    respect to LIDAR point density, a fixed number of T points
experiments show that our model compares favorably to the         is randomly sampled for all voxels containing more than T
aforementioned classical approaches.                              points. Each voxel is processed with a stack of Voxel Feature
                                                                  Encoding (VFE) layers to capture local and global geometric
Learning-based Solutions: While several learning-based
                                                                  properties of its contained points. As more than 90% of the
approaches for stereo [19, 21, 46] and optical flow [9, 18, 33]
                                                                  voxels in LIDAR scans tend to be empty, we only process
have been proposed in literature, there is little prior work
                                                                  non-empty voxels and store the results in a sparse 4D tensor.
on learning scene flow estimation. A notable exception
is SceneFlowNet [23], which concatenates features from                We remark that alternative representations, e.g., those
FlowNet [9] and DispNet [23] for image-based scene flow           that directly encode the raw point cloud [13, 43], could be a
estimation. In contrast, this paper proposes a novel end-         viable alternative to voxel representations. However, as the
to-end trainable approach for scene flow estimation from          representation is not the main focus of this paper, we will
unstructured 3D point clouds. More recently, Wang et al.          leave such an investigation to future work.
[43] proposed a novel continuous convolution operation and
                                                                  3.2. 3D Detection, Ego-motion and 3D Scene Flow
applied it to 3D segmentation and scene flow. However, they
do not consider rigid motion estimation which is the main             As objects in a street scene are restricted to the ground
focus of this work.                                               plane, we only estimate objects and motions on this plane:
                                                                  we assume that 3D objects cannot be located on top of each
3. Method                                                         other and that 3D scene points directly above each other un-
                                                                  dergo the same 3D motion. This is a valid assumption for our
    We start by formally defining our problem. Let Pt ∈           autonomous driving scenario, and greatly improves memory
RN ×3 and Pt+1 ∈ RM ×3 denote the input 3D point clouds           efficiency. Following [48], we vertically downsample the
at frames t and t + 1, respectively. Our goal is to estimate      voxel feature map to size 1 by using three 3D convolutions
  • the 3D scene flow vi ∈ R3 and the 3D rigid motion             with vertical stride 2.
    Ri ∈ R3×3 , ti ∈ R3 at each of the N points in the                The resulting 3D feature map is reshaped by stacking the
    reference point cloud at frame t, and                         remaining height slices as feature maps to yield a 2D feature
                                                                  map. The first layer of each block downsamples the feature
  • the location, orientation, size and rigid motion of every     map via a convolution with stride 2, followed by a series of
    moving object in the scene (in our experiments, we            convolution layers with stride 1. Each convolution layer is
    focus solely on cars).                                        followed by Batch Normalization and a ReLU.
                                                                      Next, the network splits up in three branches for respec-
The overall network architecture of our approach is illus-        tively ego-motion estimation, 3D object detection and 3D
trated in Figure 2. The network comprises four main compo-        scene flow estimation. As there is only one observer, the
nents: (1) feature encoding layers, (2) scene flow estimation,    ego-motion branch further downsamples the feature map by
ego-motion estimation and 3D object detection layers, (3)         interleaving convolutional layers with strided convolutional
rigid motion estimation layers and (4) object motion decoder.     layers and finally using a fully connected layer to regress a
In the following, we provide a detailed description for each      3D ego-motion (movement in the ground-plane and rotation
of these components as well as the loss functions.                around the vertical). For the other two tasks, we upsample
                                                                  the output of the various blocks using up-convolutions: to
3.1. Feature Encoder
                                                                  half the original resolution for 3D object detection, and to the
   The feature encoding layers take a raw point cloud as          full resolution for 3D scene flow estimation. The resulting
input, partition the space into voxels, and describe each voxel   features are stacked and mapped to the training targets with
with a feature vector. The simplest form of aggregation is        one 2D convolutional layer each. We regress a 3D vector per
Figure 2: Network Architecture. The feature encoder takes a raw LIDAR point cloud as input, groups the points into
W × H × 10 voxels, and outputs 128D feature maps (for clarity, the size of the feature maps is not shown in the figure)
which are concatenated and passed to the context encoder. The context encoder learns a global representation by interleaving
convolution with strided convolution layers and “flattening” the third dimension (height above ground), i.e., we assume that
3D objects cannot be located on top of each other and that 3D scene points that project to the same location in the ground
plane undergo the same 3D motion. Feature maps at different resolutions are upsampled, stacked and fed into the decoding
branches. 3D scene flow is computed for every input voxel in the scene flow decoder and the result is passed to the rigid
motion decoder, which infers a rigid body transformation for every point. In parallel, the ego-motion regressor, further
downsamples the feature map by interleaving convolutional layers with strided convolutional layers and a fully connected
layer at the end to regress rigid motion for the ego vehicle. In addition, the object decoder predicts the location and size (i.e.,
3D bounding box) of objects in the scene. Finally, the object motion decoder takes the point-wise rigid body motions as
input and predicts the object rigid motions by pooling the rigid motion field over the detected 3D objects.
voxel for the scene flow, and follow [48] for the object detec-     work cannot model this. In the following, we first prove that
tions: regressing likelihoods for a set of proposal bounding        the rigid motion in the world coordinate system is not trans-
boxes and regressing the residuals (translation, rotation and       lation equivariant. Subsequently, we introduce our proposed
size) between the positive proposal boxes and correspond-           rigid motion representation in local coordinates and show it
ing ground truth boxes. A proposal bounding box is called           to be translation equivariant and therefore amenable to fully
positive if it has the highest Intersection over Union (IoU, in     convolutional inference.
the ground plane) with a ground truth detection, or if its IoU          Let us assume a point p in world coordinate system W
with any ground truth box is larger than 0.6, as in [48].           and let A denote a local coordinate system with origin oA as
                                                                    illustrated in Fig. 3a. A scene flow vector v is explained by
3.3. Rigid Motion Decoder                                           rigid body motion (RA , tA ), represented in local coordinate
                                                                    system A with origin oA , if and only if:
    We now wish to infer per-pixel and per-object rigid body
motions from the previously estimated 3D scene flow. For a                    v = [RA (p − oA ) + tA )] − (p − oA )            (1)
single point in isolation, there are infinitely many rigid body     Now assume a second world location q, also with scene
motions that explain a given 3D scene flow: this ambiguity          flow v as in Fig. 3a. Let B denote a second local coordinate
can be resolved by considering the local neighborhood.              system with origin oB such that p and q have the same
    It is unfortunately impossible to use a convolutional neu-      local coordinates in their respective coordinate system, i.e.,
ral network to regress rigid body motions that are represented      p − oA = q − oB . We now prove the following two claims:
in global world coordinates, as the conversion between scene
                                                                      1. There exists no rigid body motion RW , tW represented
flow and global rigid body motion depends on the location in
                                                                         in world coordinate system W that explains the scene
the scene: while convolutional layers are translation equiv-
                                                                         flow v for both p and q, unless RW = I.
ariant, the mapping to be learned is not. Identical regions of
flow lead to different global rigid body motions, depending           2. Any rigid body motion (RA , tA ) explaining scene flow
on the location in the volume, and a fully convolutional net-            v for p in system A also does so for q in system B.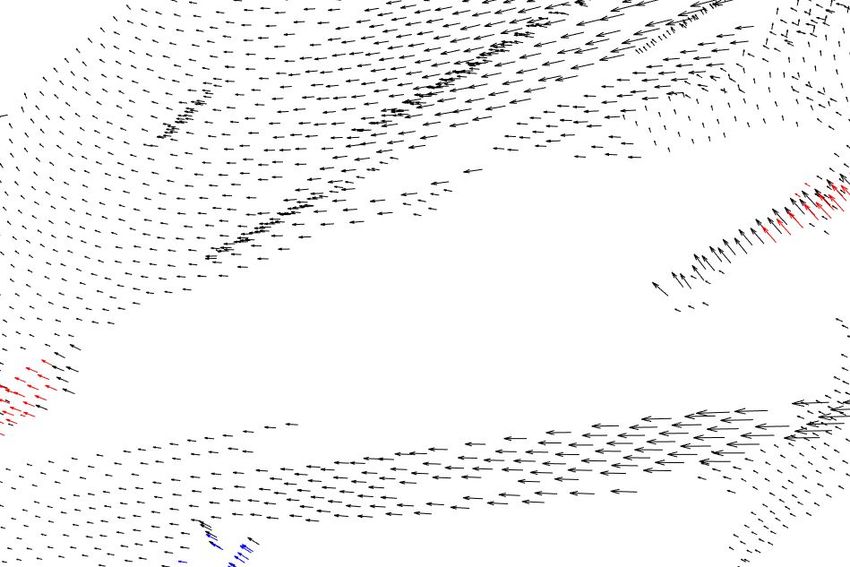
v
                                p
                                                     v
                                                         q
                  oA

                       oB

          (a) Local (A,B) and World Coordinate System (W)                         (b) Quantitative Comparison

Figure 3: Rigid Motion Estimation. In (a), indices A and B denote the coordinate system of points p and q at origin oA and
oB , respectively. The same scene flow v can locally be explained with the same rigid body motion (RL , tL ), but requires
different translations tp      q
                        W 6= tW in the global coordinate system. A simple example (b) provides empirical evidence that
translation cannot be learned in global coordinates with a CNN. Using global coordinates, the translation error increases
significantly with the magnitude of rotation (green). There is no such increase in error when using local coordinates (orange).

Towards this goal, we introduce the notation (Rp      p
                                                 W , tW ) to          We provide a simple synthetic experiment in Figure 3
indicate rigid motion in world coordinates W induced by vp .       to empirically confirm this analysis. Towards this goal, we
                                                                   warp a grid of 10 × 10 points by random rigid motions, and
                                                                   then try to infer these rigid motions from the resulting scene
Claim 1                                                            flow: as expected, the estimation is only successful using
        ∀p, q ∈ R3 , p − oA = q − oB , oA 6= oB :                  local coordinates. Note that a change of reference system
                                                                   only affects the translation component while the rotation
                 vp = vq =⇒ Rp     q
                             W 6= RW            or
                                                             (2)   component remains unaffected. Motivated by the preceding
                                    tp     q
                                     W 6= tW   or                  analysis, we task our CNN to predict rigid motion in local
                                    Rp    p
                                     W = RW = I                    coordinates, followed by a deterministic layer which trans-
                                                                   forms local coordinates into global coordinates as follows:
Proof of Claim 1 From vp = vq we get
                                                                           RL = RW          tL = (RW − I)oL + tW
Rp      p        q      q
 W p + tW − p = RW q + tW − q                                              RW = RL          tW = (I − RW )oL + tL
                                                                                                                             (4)

      Rp      p    q             q
       W p + tW = RW (p − ∆o) + tW + ∆o                            In our case, the origin of the world coordinate system W
  (Rp    q             q          q    p
    W − RW ) p = (I − RW ) ∆o + (tW − tW )
                                                                   coincides with the LIDAR scanner and the origin of the local
                                                                   coordinate systems is located at the center of each voxel.
where ∆o = oA − oB . Now, we assume that Rp       W = RW
                                                         q
            p      q
and that tW = tW (in all other cases the claim is already          3.4. Object Motion Decoder
fulfilled). In this case, we have ∆o = Rp    W ∆o. However,           Finally, we combine the results of 3D object detection and
any rotation matrix representing a non-zero rotation has no        rigid motion estimation into a single rigid motion for each
real eigenvectors. Hence, as oA 6= oB , this equality can          detected object. We first apply non-maximum-suppression
only be fulfilled if Rp
                      W is the identity matrix.                   (NMS) using detection threshold τ , yielding a set of 3D
                                                                   bounding boxes. To estimate the rigid body motion of each
Claim 2
                                                                   detection, we pool the predicted rigid body motions over the
      ∀p, q ∈ R3 , p − oA = q − oB , oA 6= oB :                    corresponding voxels (i.e., the voxels in the bounding box
                    v = R (p − oA ) + t + (p − oA )          (3)   of the detection) by computing the median translation and
                                                                   rotation. Note that this is only possible as the rigid body
               =⇒ v = R (q − oB ) + t + (q − oB )                  motions have been converted back into world coordinates.
Proof of Claim 2 Trivially from p − oA = q − oB .                 3.5. Loss Functions
   The first proof shows the non-stationarity of rigid body           This section describes the loss functions used by our
motions represented in global coordinates, while the sec-          approach. While it seems desirable to define a rigid motion
ond proof shows that the rigid motion represented in local         loss directly at object level, this is complicated by the need
coordinates is stationary and can therefore be learned by a        for differentiation through the non-maximum-suppression
translation equivariant convolutional neural network.              step and the difficulty associating to ground truth objects.
Furthermore, balancing the influence of an object loss across
voxels is much more complex than applying all loss functions
directly at the voxel level. We therefore use auxiliary voxel-
level loss functions. Our loss comprises four parts:
L = αLf low + βLrigmo + γLego + Ldet (5)
Figure 4: Augmentation. Simulating LIDAR measure-
Here, α, β, γ are positive constants for balancing the rela-
ments based on 3D meshes would result in measurements
tive importance of the task specific loss functions. We now
at transparant surfaces such as windows (left), wheres a
describe the task-specific loss functions in more detail.
real LIDAR scanner measures interior points instead. Our
Scene Flow Loss: The scene flow loss is defined as the simulation replicates the behavior of LIDAR scanners by tak-
average `1 distance between the predicted scene flow and ing into account model transparency and learning the noise
the true scene flow at every voxel model from real KITTI scans (right).
1 X where ppos and pneg represent the softmax output for posi-
Lf low = vj − vj∗ 1
(6) k l
tive proposal boxes apos and negative proposal boxes aneg ,
K j k l
respectively. rk ∈ R7 and r∗k ∈ R7 denote the regression
where vj ∈ R3 and vj∗ ∈ R3 denote the regression estimate estimates and ground truth residual vectors (translation, rota-
and ground truth scene flow at voxel j, and K is the number tion and size) for the positive proposal box k, respectively.
of non-empty voxels. Mpos and Mneg represent the number of positive and nega-
tive proposal boxes. Lcls denotes the binary cross entropy
Rigid Motion Loss: The rigid motion loss is defined as the loss, while Lreg represents the smooth `1 distance function.
average `1 error between the predicted translation tj ∈ R2 We refer to [48] for further details.
and its ground truth t∗j ∈ R2 in the local coordinate system
and the average `1 error between the predicted rotation θj 4. Experimental Evaluation
around the Z-axis and its ground truth θj∗ at every voxel j.
We now evaluate the performance of our method on the
1 X KITTI object detection dataset [12] as well as an extended
Lrigmo = tj − t∗j 1
+ λ θj − θj∗ 1
(7) version, which we have augmented by simulating virtual
K j
objects in each scene.
where λ is a positive constant to balance the relative impor- 4.1. Datasets
tance of the two terms. The conversion from world coordi-
nates to local coordinates is given by (see also Eq. 4) KITTI: For evaluating our approach, we use 61 sequences
of the training set in the KITTI object detection dataset [12],
RL = RW (θj ) tL = (RW (θj ) − I) pj + tW (8) containing a total of 20k frames. As there is no pointcloud-
based scene flow benchmark in KITTI, we perform our ex-
where pj ∈ R2 specifies the position of voxel j in the XY-
periments on the original training set. Towards this goal, we
plane in world coordinates and RW (θj ) is the rotation matrix
split the original training set into 70% train, 10% validation,
corresponding to rotation θj around the Z-axis.
20% test sequences, making sure that frames from the same
Ego-motion Loss: Similarly, the ego-motion loss is de- sequence are not used in different splits.
fined as the `1 distance between the predicted background
Augmented KITTI: However, the official KITTI object
translation tBG ∈ R2 and its ground truth t∗BG ∈ R2 and
∗ detection datasets lacks cars with a diverse range of motions.
the predicted rotation θBG and its ground truth θBG :
To generate more salient training example, we generate a
Lego = ktBG − t∗BG k1 + λkθBG − θBG
∗
k1 (9) realistic mixed reality LiDAR dataset exploiting a set of
high quality 3D CAD models of cars [10] by taking the
characteristics of real LIDAR scans into account.
Detection Loss: Following [48], we define the detection We discuss our workflow here. We start by fitting the
loss as follows: ground plane using RANSAC 3D plane fitting; this allows
1 X us to detect obstacles and hence the drivable region. In a
Ldet = Lcls (ppos ∗
k , 1) + Lreg (rk , rk ) second step, we randomly place virtual cars in the drivable
Mpos
k region, and simulate a new LIDAR scan that includes these
(10)
1 X virtual cars. Our simulator uses a noise model learned from
+ Lcls (pneg
l , 0)
Mneg the real KITTI scanner, and also produces missing estimates
lScene Flow (m) Object Motion Ego-motion
Eval. Training
Dataset Dataset FG BG All Rot.(rad) Tr.(m) Rot.(rad) Tr.(m)
K K 0.23 0.14 0.14 0.004 0.30 0.004 0.09
K K+AK 0.18 0.14 0.14 0.004 0.29 0.004 0.09
K+AK K 0.58 0.14 0.18 0.010 0.57 0.004 0.14
K+AK K+AK 0.28 0.14 0.16 0.011 0.48 0.004 0.12
Table 1: Ablation Study on our KITTI and Augmented KITTI validation datasets, abbreviated with K and AK, respectively.
Scene Flow (m) Object Motion Ego-motion
Eval.
Dataset Method FG BG All Rot.(rad) Tr.(m) Rot.(rad) Tr.(m)
K ICP+Det. 0.56 0.43 0.44 0.22 6.27 0.004 0.44
K 3DMatch+Det. 0.89 0.70 0.71 0.021 1.80 0.004 0.68
K FPFH+Det. 3.83 4.24 4.21 0.299 14.23 0.135 4.27
K Dewan et al.+Det. 0.55 0.41 0.41 0.008 0.55 0.006 0.39
K Ours 0.29 0.15 0.16 0.004 0.19 0.005 0.12
K+AK ICP+Det. 0.74 0.48 0.50 0.226 6.30 0.005 0.49
K+AK 3DMatch+Det. 1.14 0.77 0.80 0.027 1.76 0.004 0.76
K+AK FPFH+Det. 4.00 4.39 4.36 0.311 13.54 0.122 4.30
K+AK Dewan et al.+Det. 0.60 0.52 0.52 0.014 0.75 0.006 0.46
K+AK Ours 0.34 0.18 0.20 0.011 0.50 0.005 0.15
Table 2: Comparison to Baselines on test sets of KITTI and Augmented KITTI, abbreviated with K and AK, respectively.
at transparent surfaces using the transparency information correspondences of 3D features in two timesteps. We eval-
provided by the CAD models, as illustrated in Figure 4. uate two different descriptors: 3D Match [47], a learnable
Additionally, we remove points in the original scan which 3D descriptor trained on KITTI and Fast Point Feature His-
become occluded by the augmented car by tracing a ray togram features (FPFH) [31]. Based on the per-point scene
between each point and the LIDAR, and removing those flow, we fit rigid body motions to each of the objects and to
points whose ray intersects with the car mesh. Finally, we the background, again using the object detections from our
sample the augmented car’s rigid motion using a simple pipeline for a fair comparison.
approximation of the Ackermann steering geometry, place
the car at the corresponding location in the next frame, and Iterative Closest Point (ICP) [4] outputs a transformation
repeat the LIDAR simulation. We generate 20k such frames relating two point clouds to each other using an SVD-based
with 1 to 3 augmented moving cars per scene. We split the point-to-point algorithm. We estimate object rigid motions
sequences into 70% train, 10% validation, 20% test similar by fitting the points of each detected 3D object in the first
to our split of the original KITTI dataset. point cloud to the entire second point cloud.
4.2. Baseline Methods Evaluation Metrics: We quantify performance using sev-
eral metrics applied to both the detected objects and the
We compare our method to four baselines: a point cloud- background. To quantify the accuracy of the estimates in-
based method using a CRF [8], two point-matching methods, dependently from the detection accuracy, we only evaluate
and an Iterative Closest Point [4] (ICP) baseline. object motion on true positive detections.
Dewan et al. [8] estimate per-point rigid motion. To arrive
at object-level motion and ego-motion, we pool the estimates
over our object detections and over the background. As they • For 3D scene flow, we use the average endpoint error
only estimate valid scene flow for a subset of the points, we between the prediction and the ground truth.
evaluate [8] only on those estimates and the comparison is
therefore inherently biased in their favor.
• Similarly, we list the average rotation and translation
Method Matching 3D Descriptors yield a scene flow esti- error averaged over all of the detected objects, and
mate for each point in the reference point cloud by finding averaged over all scenes for the observer’s ego-motion.(a) Ground Truth (b) Our result
(c) Dewan et al. [8]+Det. (d) ICP+Det.
Figure 5: Qualitative Comparison of our method with the best performing baseline methods on an example from the
Augmented KITTI. For clarity, we visualize only a subset of the points. Additional results can be found in the supplementary.
4.3. Experimental Results on the dense evaluation is small they constitute a relatively
larger fraction of the object-based evaluation. Visual exam-
The importance of simulated augmentation: To quantify ination (Fig. 5) shows that the baseline methods predict a
the value of our proposed LIDAR simulator for realistic aug- reasonable estimate for the background motion, but fail to
mentation with extra cars, we compare the performance of estimate motion for dynamic objects; in contrast, our method
our method trained on the original KITTI object detection is able to estimate these motions correctly. This further rein-
dataset with our method trained on both KITTI and Aug- forces the importance of training our method on scenes with
mented KITTI. Table 1 shows the results of this study. Our many augmented cars and challenging and diverse motions.
analysis shows that training using a combination of KITTI Regarding execution time, our method requires 0.5 sec-
and augmented KITTI leads to significant performance gains, onds to process one point cloud pair. In comparison, Dewan
especially when evaluating on the more diverse vehicle mo- et al. (4 seconds) and the 3D Match- and FPFH-based ap-
tions in the validation set of Augmented KITTI. proaches (100 and 300 seconds, respectively) require signifi-
cantly longer, while the ICP solution also takes 0.5 seconds
Direct scene flow vs. object motion: We have also evalu-
but performs considerably worse.
ated the difference between estimating scene flow directly
and calculating it from either dense or object-level rigid
motion estimates. While scene flow computed from rigid 5. Conclusion
motion estimates was qualitatively smoother, there was no
In this paper, we have proposed a learning-based solution
significant difference in overall accuracy.
for estimating scene flow and rigid body motion from un-
Comparison with the baselines: Table 2 summarizes the structured point clouds. Our model simultaneously detects
complete performance comparison on the KITTI test set. objects in the point clouds, estimates dense scene flow and
Note that the comparison with Dewan et al. [8] is biased in rigid motion for all points in the cloud, and estimates object
their favor, as mentioned earlier, as we only evaluate their ac- rigid motion for all detected objects as well as the observer.
curacy on the points they consider accurate. Regardless, our We have shown that a global rigid motion representation is
method outperforms all baselines. Additionally, we observe not amenable to fully convolutional estimation, and propose
that the ICP-based method exhibits large errors for object to use a local representation. Our approach outperforms all
motions. This is because of objects with few points: ICP evaluated baselines, yielding more accurate object motions
often performs very poorly on these, but while their impact in less time.6. Acknowledgements worlds). In Proc. of the Asian Conf. on Computer Vision
(ACCV), Dezember 2018. 3
This work was supported by NVIDIA through its NVAIL [14] D. Held, J. Levinson, S. Thrun, and S. Savarese. Robust real-
program. time tracking combining 3d shape, color, and motion. Inter-
national Journal of Robotics Research (IJRR), 35(1-3):30–49,
References 2016. 3
[15] E. Herbst, X. Ren, and D. Fox. RGB-D flow: Dense 3D
[1] A. Asvadi, P. Girao, P. Peixoto, and U. Nunes. 3d object motion estimation using color and depth. In Proc. IEEE In-
tracking using RGB and LIDAR data. In Proc. IEEE Conf. ternational Conf. on Robotics and Automation (ICRA), 2013.
on Intelligent Transportation Systems (ITSC), 2016. 2 2
[2] T. Basha, Y. Moses, and N. Kiryati. Multi-view scene flow [16] M. Hornacek, A. Fitzgibbon, and C. Rother. SphereFlow: 6
estimation: A view centered variational approach. Interna- DoF scene flow from RGB-D pairs. In Proc. IEEE Conf. on
tional Journal of Computer Vision (IJCV), 101(1):6–21, 2013. Computer Vision and Pattern Recognition (CVPR), 2014. 2
2 [17] F. Huguet and F. Devernay. A variational method for scene
[3] A. Behl, O. H. Jafari, S. K. Mustikovela, H. A. Alhaija, flow estimation from stereo sequences. In Proc. of the IEEE
C. Rother, and A. Geiger. Bounding boxes, segmentations International Conf. on Computer Vision (ICCV), 2007. 1, 2
and object coordinates: How important is recognition for 3d [18] E. Ilg, N. Mayer, T. Saikia, M. Keuper, A. Dosovitskiy, and
scene flow estimation in autonomous driving scenarios? In T. Brox. Flownet 2.0: Evolution of optical flow estimation
Proc. of the IEEE International Conf. on Computer Vision with deep networks. Proc. IEEE Conf. on Computer Vision
(ICCV), 2017. 2 and Pattern Recognition (CVPR), 2017. 3
[4] P. Besl and H. McKay. A method for registration of 3d shapes. [19] A. Kendall, H. Martirosyan, S. Dasgupta, and P. Henry. End-
IEEE Trans. on Pattern Analysis and Machine Intelligence to-end learning of geometry and context for deep stereo regres-
(PAMI), 14:239–256, 1992. 7 sion. In Proc. of the IEEE International Conf. on Computer
[5] X. Chen, H. Ma, J. Wan, B. Li, and T. Xia. Multi-view 3d Vision (ICCV), 2017. 3
object detection network for autonomous driving. In Proc. [20] P. Lenz, J. Ziegler, A. Geiger, and M. Roser. Sparse scene
IEEE Conf. on Computer Vision and Pattern Recognition flow segmentation for moving object detection in urban envi-
(CVPR), 2017. 3 ronments. In Proc. IEEE Intelligent Vehicles Symposium (IV),
[6] R. Danescu, F. Oniga, and S. Nedevschi. Modeling and 2011. 1
tracking the driving environment with a particle-based occu- [21] Z. Liang, Y. Feng, Y. Guo, H. Liu, L. Qiao, W. Chen, L. Zhou,
pancy grid. IEEE Trans. on Intelligent Transportation Systems and J. Zhang. Learning deep correspondence through prior
(TITS), 12(4):1331–1342, 2011. 2 and posterior feature constancy. arXiv.org, 1712.01039, 2017.
[7] A. Dewan, T. Caselitz, G. D. Tipaldi, and W. Burgard. Motion- 3
based detection and tracking in 3d lidar scans. In Proc. IEEE [22] Z. Lv, C. Beall, P. Alcantarilla, F. Li, Z. Kira, and F. Dellaert.
International Conf. on Robotics and Automation (ICRA), A continuous optimization approach for efficient and accurate
2016. 3 scene flow. In Proc. of the European Conf. on Computer
Vision (ECCV), 2016. 2
[8] A. Dewan, T. Caselitz, G. D. Tipaldi, and W. Burgard. Rigid
[23] N. Mayer, E. Ilg, P. Haeusser, P. Fischer, D. Cremers, A. Doso-
scene flow for 3d lidar scans. In Proc. IEEE International
vitskiy, and T. Brox. A large dataset to train convolutional
Conf. on Intelligent Robots and Systems (IROS), 2016. 3, 7, 8
networks for disparity, optical flow, and scene flow estima-
[9] A. Dosovitskiy, P. Fischer, E. Ilg, P. Haeusser, C. Hazirbas, tion. In Proc. IEEE Conf. on Computer Vision and Pattern
V. Golkov, P. v.d. Smagt, D. Cremers, and T. Brox. Flownet: Recognition (CVPR), 2016. 3
Learning optical flow with convolutional networks. In Proc.
[24] M. Menze and A. Geiger. Object scene flow for autonomous
of the IEEE International Conf. on Computer Vision (ICCV),
vehicles. In Proc. IEEE Conf. on Computer Vision and Pattern
2015. 3
Recognition (CVPR), 2015. 1, 2
[10] S. Fidler, S. Dickinson, and R. Urtasun. 3d object detec- [25] M. Menze, C. Heipke, and A. Geiger. Joint 3d estimation of
tion and viewpoint estimation with a deformable 3d cuboid vehicles and scene flow. In Proc. of the ISPRS Workshop on
model. In Advances in Neural Information Processing Sys- Image Sequence Analysis (ISA), 2015. 2
tems (NIPS), December 2012. 6 [26] F. Moosmann and C. Stiller. Joint self-localization and track-
[11] U. Franke, C. Rabe, H. Badino, and S. Gehrig. 6D-Vision: ing of generic objects in 3d range data. In Proc. IEEE In-
fusion of stereo and motion for robust environment perception. ternational Conf. on Robotics and Automation (ICRA), 2013.
In Proc. of the DAGM Symposium on Pattern Recognition 3
(DAGM), 2005. 2 [27] P. Purkait, C. Zhao, and C. Zach. Spp-net: Deep absolute
[12] A. Geiger, P. Lenz, and R. Urtasun. Are we ready for au- pose regression with synthetic views. arXiv.org, 1712.03452,
tonomous driving? The KITTI vision benchmark suite. In 2017. 3
Proc. IEEE Conf. on Computer Vision and Pattern Recogni- [28] C. R. Qi, H. Su, K. Mo, and L. J. Guibas. Pointnet: Deep
tion (CVPR), 2012. 6 learning on point sets for 3d classification and segmentation.
[13] F. Groh, P. Wieschollek, and H. P. A. Lensch. Flex- In Proc. IEEE Conf. on Computer Vision and Pattern Recog-
convolution (million-scale point-cloud learning beyond grid- nition (CVPR), 2017. 3[29] C. R. Qi, L. Yi, H. Su, and L. J. Guibas. Pointnet++: Deep [44] A. Wedel, T. Brox, T. Vaudrey, C. Rabe, U. Franke, and
hierarchical feature learning on point sets in a metric space. In D. Cremers. Stereoscopic scene flow computation for 3D
Advances in Neural Information Processing Systems (NIPS), motion understanding. International Journal of Computer
2017. 3 Vision (IJCV), 95(1):29–51, 2011. 2
[30] J. Quiroga, T. Brox, F. Devernay, and J. L. Crowley. Dense [45] A. Wedel, C. Rabe, T. Vaudrey, T. Brox, U. Franke, and
semi-rigid scene flow estimation from RGB-D images. In D. Cremers. Efficient dense scene flow from sparse or dense
Proc. of the European Conf. on Computer Vision (ECCV), stereo data. In Proc. of the European Conf. on Computer
2014. 2 Vision (ECCV), 2008. 2
[31] R. B. Rusu, N. Blodow, and M. Beetz. Fast point feature [46] J. Žbontar and Y. LeCun. Stereo matching by training a con-
histograms (FPFH) for 3d registration. In Proc. IEEE Inter- volutional neural network to compare image patches. Journal
national Conf. on Robotics and Automation (ICRA), 2009. of Machine Learning Research (JMLR), 17(65):1–32, 2016.
7 3
[32] H. Su, V. Jampani, D. Sun, S. Maji, E. Kalogerakis, M. Yang, [47] A. Zeng, S. Song, M. Nießner, M. Fisher, J. Xiao, and
and J. Kautz. Splatnet: Sparse lattice networks for point cloud T. Funkhouser. 3dmatch: Learning local geometric descrip-
processing. In Proc. IEEE Conf. on Computer Vision and tors from rgb-d reconstructions. In Proc. IEEE Conf. on
Pattern Recognition (CVPR), 2018. 3 Computer Vision and Pattern Recognition (CVPR), 2017. 7
[33] D. Sun, X. Yang, M.-Y. Liu, and J. Kautz. Pwc-net: Cnns [48] Y. Zhou and O. Tuzel. Voxelnet: End-to-end learning for
for optical flow using pyramid, warping, and cost volume. In point cloud based 3d object detection. In Proc. IEEE Conf.
Proc. IEEE Conf. on Computer Vision and Pattern Recogni- on Computer Vision and Pattern Recognition (CVPR), 2018.
tion (CVPR), 2018. 3 3, 4, 6
[34] G. Tanzmeister, J. Thomas, D. Wollherr, and M. Buss. Grid-
based mapping and tracking in dynamic environments using a A. Appendix
uniform evidential environment representation. In Proc. IEEE The following appendix provides additional qualitative
International Conf. on Robotics and Automation (ICRA),
comparisons of our method with the baselines methods along
2014. 2
with examples of failure cases for our method. We also
[35] F. Tombari, S. Salti, and L. di Stefano. Unique signatures
describe our workflow for generating the Augmented KITTI
of histograms for local surface description. In Proc. of the
European Conf. on Computer Vision (ECCV), 2010. 3
dataset here.
[36] A. K. Ushani, R. W. Wolcott, J. M. Walls, and R. M. Eustice.
A learning approach for real-time temporal scene flow esti-
B. Augmented KITTI
mation from LIDAR data. In Proc. IEEE International Conf. Figure 6 describes our workflow for generating the Aug-
on Robotics and Automation (ICRA), 2017. 2 mented KITTI. We start by fitting the ground plane using
[37] L. Valgaerts, A. Bruhn, H. Zimmer, J. Weickert, C. Stoll, RANSAC 3D plane fitting; this allows us to detect obstacles
and C. Theobalt. Joint estimation of motion, structure and and hence the drivable region. In a second step, we randomly
geometry from stereo sequences. In Proc. of the European
place virtual cars in the drivable region, and simulate a new
Conf. on Computer Vision (ECCV), 2010. 2
LIDAR scan that includes these virtual cars. Our simulator
[38] J. van de Ven, F. Ramos, and G. D. Tipaldi. An integrated
uses a noise model learned from the real KITTI scanner,
probabilistic model for scan-matching, moving object detec-
tion and motion estimation. In Proc. IEEE International Conf. and also produces missing estimates at transparent surfaces
on Robotics and Automation (ICRA), 2010. 3 using the transparency information provided by the CAD
[39] S. Vedula, S. Baker, P. Rander, R. Collins, and T. Kanade. models. Additionally, we remove points in the original scan
Three-dimensional scene flow. In Proc. IEEE Conf. on Com- which become occluded by the augmented car by tracing
puter Vision and Pattern Recognition (CVPR), 1999. 1, 2 a ray between each point and the LIDAR, and removing
[40] S. Vedula, P. Rander, R. Collins, and T. Kanade. Three- those points whose ray intersects with the car mesh. Finally,
dimensional scene flow. IEEE Trans. on Pattern Analysis and we sample the augmented car’s rigid motion using a simple
Machine Intelligence (PAMI), 27(3):475–480, 2005. 1, 2 approximation of the Ackermann steering geometry, place
[41] C. Vogel, K. Schindler, and S. Roth. 3D scene flow estimation the car at the corresponding location in the next frame, and
with a rigid motion prior. In Proc. of the IEEE International repeat the LIDAR simulation.
Conf. on Computer Vision (ICCV), 2011. 2
[42] C. Vogel, K. Schindler, and S. Roth. 3d scene flow estimation C. Qualitative Comparison to Baseline Meth-
with a piecewise rigid scene model. International Journal of ods
Computer Vision (IJCV), 115(1):1–28, 2015. 2
[43] S. Wang, S. Suo, W.-C. Ma, A. Pokrovsky, and R. Urtasun. Figures 7 - 28 show qualitative comparison of our method
Deep parametric continuous convolutional neural networks. with the best performing baseline methods on examples
In Proc. IEEE Conf. on Computer Vision and Pattern Recog- from the test set of the Augmented KITTI dataset. The
nition (CVPR), June 2018. 3 qualitative results show that our method predicts motion forRANSAC ground Sample location in
plane fitting drivable region
LiDAR scan at time =t Detected the ground plane and obstacles in 3D LiDAR Scan of a real outdoor scene at t augmented
LiDAR data with scan & 3D bounding box of a synthetic car
Sample CAD model
Sample realistic rigid
body motion
Sample CAD model
Over 100 detailed 3D car CAD models
LiDAR scan at time =t+1 LiDAR Scan of a real outdoor scene at t+1 augmented
with scan & 3D bounding box of a synthetic car
Figure 6: Augmented KITTI. Workflow for generating the Augmented KITTI dataset.
both background and foreground parts of the scene with
higher accuracy than all the baselines on a diverse range of
scenes and motions.
In Figures 26 - 28, we provide challenging examples
where our method fails to predict the correct scene flow. We
observe here that in case of scenes with two or more cars in
very close proximity, our method may predict wrong scene
flow for points on one car in the reference point cloud at
frame t by matching them with points on the other car in
close proximity at frame t + 1. However, we note that, even
for these failure cases our method performs better than the
baseline methods.Figure 7: Qualitative Comparison of our method with the best performing baseline methods on an example from the test set of the Augmented KITTI dataset. For clarity, we visualize only a subset of the points.
Figure 8: Qualitative Comparison of our method with the best performing baseline methods on an example from the test set
of the Augmented KITTI dataset. For clarity, we visualize only a subset of the points.
Figure 9: Qualitative Comparison of our method with the best performing baseline methods on an example from the test set
of the Augmented KITTI dataset. For clarity, we visualize only a subset of the points.
Figure 10: Qualitative Comparison of our method with the best performing baseline methods on an example from the test
set of the Augmented KITTI dataset. For clarity, we visualize only a subset of the points.
Figure 11: Qualitative Comparison of our method with the best performing baseline methods on an example from the test
set of the Augmented KITTI dataset. For clarity, we visualize only a subset of the points.
Figure 12: Qualitative Comparison of our method with the best performing baseline methods on an example from the test
set of the Augmented KITTI dataset. For clarity, we visualize only a subset of the points.
Figure 13: Qualitative Comparison of our method with the best performing baseline methods on an example from the test
set of the Augmented KITTI dataset. For clarity, we visualize only a subset of the points.
Figure 14: Qualitative Comparison of our method with the best performing baseline methods on an example from the test
set of the Augmented KITTI dataset. For clarity, we visualize only a subset of the points.
Figure 15: Qualitative Comparison of our method with the best performing baseline methods on an example from the test
set of the Augmented KITTI dataset. For clarity, we visualize only a subset of the points.
Figure 16: Qualitative Comparison of our method with the best performing baseline methods on an example from the test
set of the Augmented KITTI dataset. For clarity, we visualize only a subset of the points.
Figure 17: Qualitative Comparison of our method with the best performing baseline methods on an example from the test
set of the Augmented KITTI dataset. For clarity, we visualize only a subset of the points.
Figure 18: Qualitative Comparison of our method with the best performing baseline methods on an example from the test
set of the Augmented KITTI dataset. For clarity, we visualize only a subset of the points.
Figure 19: Qualitative Comparison of our method with the best performing baseline methods on an example from the test
set of the Augmented KITTI dataset. For clarity, we visualize only a subset of the points.
Figure 20: Qualitative Comparison of our method with the best performing baseline methods on an example from the test
set of the Augmented KITTI dataset. For clarity, we visualize only a subset of the points.
Figure 21: Qualitative Comparison of our method with the best performing baseline methods on an example from the test
set of the Augmented KITTI dataset. For clarity, we visualize only a subset of the points.
Figure 22: Qualitative Comparison of our method with the best performing baseline methods on an example from the test
set of the Augmented KITTI dataset. For clarity, we visualize only a subset of the points.
Figure 23: Qualitative Comparison of our method with the best performing baseline methods on an example from the test
set of the Augmented KITTI dataset. For clarity, we visualize only a subset of the points.
Figure 24: Qualitative Comparison of our method with the best performing baseline methods on an example from the test
set of the Augmented KITTI dataset. For clarity, we visualize only a subset of the points.
Figure 25: Qualitative Comparison of our method with the best performing baseline methods on an example from the test
set of the Augmented KITTI dataset. For clarity, we visualize only a subset of the points.
Figure 26: Qualitative Comparison of our method with the best performing baseline methods on an example from the test
set of the Augmented KITTI dataset. We observe here that our method predicts wrong scene flow for points on the green car in
the reference point cloud at frame t by matching them with points on the other car (pink) in close proximity at frame t + 1.
For clarity, we visualize only a subset of the points.
Figure 27: Qualitative Comparison of our method with the best performing baseline methods on an example from the test
set of the Augmented KITTI dataset. We observe here that our method predicts wrong scene flow for points on the red car in
the reference point cloud at frame t by matching them with points on the other car (green) in close proximity at frame t + 1.
For clarity, we visualize only a subset of the points.
Figure 28: Qualitative Comparison of our method with the best performing baseline methods on an example from the test
set of the Augmented KITTI dataset. We observe here that our method predicts wrong scene flow for points on the green car in
the reference point cloud at frame t by matching them with points on the other car (yellow) in close proximity at frame t + 1.
For clarity, we visualize only a subset of the points.
You can also read