OLYMPIC MARKETING FACT FILE 2021 EDITION - International Olympic Committee Updated March 2021 - Olympics
←
→
Page content transcription
If your browser does not render page correctly, please read the page content below
International
Olympic
Committee

OLYMPIC
                Updated
                March 2021

MARKETING
FACT FILE
2021 EDITION
Contents   Introduction           Olympic Marketing Fact File   2021 Edition                      2

                          The Olympic Marketing Fact File is a reference document on the
                          marketing policies and programmes of the International Olympic
                          Committee (IOC), the Olympic Movement and the Olympic Games.

                          In this document, the IOC has endeavoured to present a clear, sim-
                          plified overview of Olympic Movement revenue generation and
                          distribution. Nevertheless, revenue comparisons between Olympic
                          marketing programmes must be carefully considered because mar-
                          keting programmes evolve over the course of each Olympiad, and
                          each marketing programme is subject to different contractual terms
                          and distribution principles.

                          Please note that commercial agreements reached with the IOC
                          may be paid in different currencies depending on the nature of
                          the agreement and the location of the parties. For the purposes
                          of the Marketing Fact File, in order to provide comparisons across
                          agreements/locations, exchange rates have been converted where
                          possible to a single currency, United States Dollars, based on the
                          exchange rate at the time of the agreement.

                          N.B. The financial figures contained in this document are provided
                          for general information purposes, are estimates and are not intended
                          to represent formal accounting reports of the IOC, the Organising
                          Committees for the Olympic Games (OCOGs) or other organisa-
                          tions within the Olympic Movement. For the formal accounting
                          reports of the IOC, please visit www.olympics.com/ioc/documents/
                          international-olympic-committee/ioc-annual-report

                          The financial reports and statements of OCOGs may differ from this
                          document due to different accounting principles and policies, such
                          as those related to goods and services, that have been adopted. The
                          goods and services (i.e. the provision of products, services and sup-
                          port) figures cited in this document have generally been accounted
                          for based on contractual values, where available.

                          The financial figures presented here do not include any public
                          moneys, including donations, provided to the OCOGs, the National
                          Olympic Committees (NOCs), the International Federations of
                          Olympic sports (IFs), or other governing bodies.

                          This edition of the Olympic Marketing Fact File contains the most
                          complete information available as of 1 January 2021. Further infor-
                          mation on the marketing programmes of each Olympic Games
                          are available in the IOC’s Marketing Reports (available at
                          www.olympics.com/ioc/documents/
                          international-olympic-committee/ioc-marketing-and-broadcasting).

Introduction
Contents         Contents                                     Olympic Marketing Fact File   2021 Edition           3

CHAPTER 1                                                   CHAPTER 4
OLYMPIC MARKETING OVERVIEW                                  OLYMPIC GAMES TICKETING

5      Fundamental Objectives of Olympic Marketing          26   Olympic Games Ticketing Overview
7      Olympic Marketing Revenue Generation                 27   Olympic Games Ticket Sales
7      IOC Revenue Distribution
7      IOC Contribution to Support the Olympic Games        CHAPTER 5
8      Olympic Marketing Contributions to the NOCs          OLYMPIC LICENSING
8      IOC Contributions to the International Federations
                                                            29   The IOC Global Licensing Strategy
CHAPTER 2                                                   30   Olympic Games Licensing Programmes
OLYMPIC PARTNERSHIP                                         31   Olympic Numismatic Programmes
                                                            31   Olympic Philatelic Programmes
10     Olympic Sponsorship Overview                         32   Olympic Licensing, Numismatic and Philatelic History
12     Worldwide Olympic Partnership
13     TOP Partnerships                                     APPENDIX
16     Olympic Games Domestic Sponsorship
16     Olympic Sponsorship History                          34   The Olympic Movement and Commercial Partnerships
                                                            35   The IOC Executive Board
CHAPTER 3                                                   35   IOC Marketing Commission
OLYMPIC BROADCASTING                                        35   IOC Television & Marketing Services Sa
                                                            36   Rio 2016: Basic Facts
19     Olympic Broadcast Overview                           36   PyeongChang 2018: Basic Facts
19     Olympic Broadcast Partnerships                       36   Tokyo 2020: Basic Facts
20     Olympic Broadcast: Worldwide Coverage                36   Beijing 2022: Basic Facts
21     Olympic Broadcast: Global Viewership                 36   Paris 2024: Basic Facts
21     Olympic Broadcast: Glossary Of Terms                 36   Milano Cortina 2026: Basic Facts
21     Olympic Broadcast Programming                        36   Los Angeles 2028: Basic Facts
22     Olympic Broadcast Revenue Generation
23     Olympic Broadcasting History

Contents
Contents   Chapter 1   Olympic Marketing Fact File   2021 Edition   4

Chapter 1
Contents        Chapter 1                                                Olympic Marketing Fact File   2021 Edition                5

OLYMPIC
MARKETING OVERVIEW
This chapter provides an overview of the fundamental
principles of Olympic marketing, as well as facts and
figures regarding the generation of Olympic marketing
revenue and the distribution of revenue throughout the
Olympic Movement.

Fundamental Objectives of Olympic Marketing                           Organising Committee for the Olympic Games (OCOG) and
                                                                      thereby eliminate the need to recreate the marketing structure
                                                                      with each Olympic Games.
                                                                  •   To ensure that the Olympic Games can be experienced by the
The IOC coordinates Olympic marketing programmes with the             maximum number of people throughout the world principally via
following objectives:                                                 broadcast coverage.
• To generate revenue to be distributed throughout the entire     •   To protect and promote the equity that is inherent in the Olympic
  Olympic Movement – including the OCOGs, the National                image and ideals.
  Olympic Committees (NOCs) and their continental associations,   •   To control and limit the commercialisation of the Olympic Games.
  the International Federations (IFs) and other recognised        •   To create and maintain long-term marketing programmes.
  international sports organisations – and to provide financial   •   To enlist the support of Olympic marketing partners in the
  support for sport in emerging nations.                              promotion of the Olympic ideals.
• To build on the successful activities developed by each
Contents             Chapter 1                                                          Olympic Marketing Fact File   2021 Edition                            6

WHERE OLYMPIC MARKETING REVENUE COMES FROM

                          Managed                                                              Managed by the Organising Committees for the Olympic
                          by the IOC                                                              Games (OCOGs), under the direction of the IOC

                                                                            In addition,
                                                                             the NOCs
                                                                           and IFs gen-
                                                                           erate revenue
The Olympic Partner        Broadcast          IOC official sup-            through their                Domestic         Ticketing               Licensing
       (TOP)              partnerships       plier and licensing                                       sponsorship                               within the
    programme
                                                                          own commercial                                                        host country
                                                 programme
                                                                           programmes

IOC CONTRIBUTIONS TO SUPPORT THE OLYMPIC GAMES1                                   WHERE IOC REVENUES GO

    $965m             $1,250m            $1,374m               $1,531m            • NOCs to help them support their athletes at national and
                                                                                    local levels
                                                                                  • IFs to run and promote their sports globally
                                                                                  • Individual athletes and coaches, via Olympic Solidarity funding
                                                                                  • The Organising Committee of each Olympic Games
                                                                                  • Other Olympic Movement and sport organisations to promote
                                                                                    worldwide development of sport
    Athens            Beijing            London                     Rio
                                                                                  • IOC activities, projects and programmes aimed at supporting the
     2004             2008                2012                     2016
                                                                                    staging of the Games and promoting the worldwide development
                                                                                     of sport and the Olympic Movement

1 The IOC contribution supports the staging of the Summer and
  Winter editions of the Games. This includes direct contributions to
  the OCOGs (through the share of the television broadcasting rights
  and TOP rights), considerable costs that previously had been borne
  by the OCOG, such as the host broadcast operation, and various                   • IOC activities to develop sport and operations of the IOC
  forms of Games support to the OCOG, including through
  its “Transfer of Knowledge” programmes. The OCOGs also raise
  additional revenue through domestic commercial activities facili-               2021-2024
  tated by the authorised use of the Olympic marks together with                  OLYMPIC SOLIDARITY HIGHLIGHTS
  the OCOGs’ symbols.

                                                                                             $590m                                        25%
                                                                                       Olympic Solidarity budget for           increase in budget allocated to
                                                                                      2021-2024 (in USD), represent-            athlete support programmes,
                                                                                     ing a 16% increase on 2017-2020             compared with 2017-2020
Contents               Chapter 1                                                                             Olympic Marketing Fact File      2021 Edition                     7

Olympic Marketing Revenue Generation                                                                 and licensing programme. In addition, the NOCs, OCOGs
                                                                                                     and IFs generate revenue through their own respective com-
                                                                                                     mercial programmes.

The Olympic Movement generates revenue through several pro-                                          The following chart provides details of the total revenue gen-
grammes. The IOC manages broadcast partnerships, the TOP                                             erated from broadcast partnerships and the TOP programme
worldwide sponsorship programme and the IOC official supplier                                        during the past six Olympiads.

IOC REVENUE FROM BROADCAST AND TOP PROGRAMME: THE PAST SIX OLYMPIADS*

 Source
                                              1993-1996                  1997-2000             2001-2004                   2005-2008            2009-2012               2013-2016
 (in USD millions)

 Broadcast                                    1,251                      1,845                 2,232                       2,570                3,850                   4,157

 TOP Programme                                279                        579                   663                         866                  950                     1,003

 Total                                        1,530                      2,424                 2,895                       3,436                4,800                   5,160

* All figures in the charts of this document have been rounded to the nearest USD 1 million.

Ioc Revenue Distribution
                                                                                                            90%
                                                                                                            Distribution, Olympic
The IOC distributes 90% of its revenue to organisations through-
                                                                                                            Games and Promotion
out the Olympic Movement, in order to support the staging of the
                                                                                                            of Olympic Movement
Olympic Games and to promote the worldwide development of
sport. The IOC retains 10% of its revenue for the operational and
administrative costs of governing the Olympic Movement.
                                                                                                            10%
This means that every day the equivalent of over USD 3.4 million is                                         IOC Activities to
distributed by the IOC to support athletes and sports organisations                                         Develop Sport and
at all levels around the world.                                                                             Operations of the IOC

                                                                                                     Olympic Winter Games (in USD millions)
Ioc Contribution to Support the Olympic Games
                                                                                                     Salt Lake City 2002                                          552

                                                                                                     Turin 2006                                                   561

                                                                                                     Vancouver 2010                                               775
The IOC supports the staging of the Olympic Games and Olympic
                                                                                                     Sochi 2014                                                   833
Winter Games with a financial contribution from the revenue it raises
through its broadcast agreements and the global TOP sponsorship                                      PyeongChang 2018                                             887

programme. Since Vancouver 2010, the IOC has also entirely funded
the host broadcaster operations, managed by Olympic Broadcasting
Services (www.obs.tv).
                                                                                                     In addition to the support received from the IOC, the OCOGs
IOC CONTRIBUTION TO SUPPORT THE OLYMPIC GAMES                                                        manage domestic sponsorship, ticketing and licensing programmes
                                                                                                     within the host country, under the direction of the IOC.
 Olympic Games (in USD millions)
                                                                                                     The following chart provides details of the total revenue generated
 Athens 2004                                                       965                               from each major programme managed by the OCOGs during the
                                                                                                     past six Olympiads.
 Beijing 2008                                                      1,250

 London 2012                                                       1,374

 Rio 2016                                                          1,531

OCOG REVENUE: THE PAST SIX OLYMPIADS

 Source
                                              1993-1996                  1997-2000             2001-2004                   2005-2008            2009-2012               2013-2016
 (in USD millions)

 OCOG Domestic Sponsorship                    534                        655                   796                         1,555                1,838                   2,037

 OCOG Ticketing                               451                        625                   411                         274                  1,238                   527

 OCOG Licensing                               115                        66                    87                          185                  170                     74

 Total                                        1,100                      1,346                 1,294                       2,014                3,246                   2,638
Contents           Chapter 1                                                       Olympic Marketing Fact File        2021 Edition                                8

Olympic Marketing Contributions                                         Ioc Contributions to the
to the National olympic committees                                      International Federations

The continued success of the worldwide TOP Programme and rev-           The IOC provides financial support from Olympic marketing to the
enue from broadcast agreements has enabled the IOC to provide           Olympic summer sports and Olympic winter sports International
increased support for the National Olympic Committees (NOCs)            Federations. These financial contributions are provided to support
with each Olympiad. Substantial additional indirect financial support   the development of sport at all levels worldwide.
is provided to the NOCs, for example through the provision of the
athletes’ village and travel grants for the Olympic Games.              In addition, the International Federations generate revenue through
                                                                        their own commercial programmes.
The NOCs receive financial support for the training and development
of Olympic teams, Olympic athletes and Olympic hopefuls. The IOC        IOC CONTRIBUTIONS TO THE INTERNATIONAL FEDERATIONS
distributes TOP Programme revenue to each of the NOCs throughout
the world. The IOC also contributes Olympic broadcast revenue to         Olympic                                        Distribution
Olympic Solidarity – the body responsible for managing and adminis-      Games                                          (in USD millions)
tering the share of the television rights of the Olympic Games (www.
olympics.com/ioc/olympic-solidarity-commission) – that is in turn
                                                                         Athens 2004                                    257
allocated to the NOCs. Olympic Solidarity assists the NOCs and the
continental associations with their efforts to develop sport through     Beijing 2008                                   297
programmes devised to match their specific needs and priorities.
                                                                         London 2012                                    520

                                                                         Rio 2016                                       540
IOC CONTRIBUTIONS TO NOCS

Olympic                             Distribution
                                                                         Olympic                                        Distribution
Games                               (in USD millions)
                                                                         Winter Games                                   (in USD millions)

Athens 2004                         234
                                                                         Salt Lake City 2002                            92

Beijing 2008                        301                                  Turin 2006                                     128

London 2012                         520                                  Vancouver 2010                                 209

                                                                         Sochi 2014                                     199
Rio 2016                            540
                                                                         PyeongChang 2018                               215

Olympic                             Distribution                        For further information on IOC revenues and distribution, please refer to the IOC’s Annual
                                                                        Reports on www.olympics.com/ioc/documents/international-olympic-committee/
Winter Games                        (in USD millions)                   ioc-annual-report

Salt Lake City 2002                 87

Turin 2006                          136

Vancouver 2010                      215

Sochi 2014                          199

PyeongChang 2018                    215

In addition, the NOCs generate revenue through their own domestic
commercial programmes.
Contents   Chapter 2   Olympic Marketing Fact File   2021 Edition   9

Chapter 2

Contents         Chapter 2                                                   Olympic Marketing Fact File   2021 Edition                 10

OLYMPIC PARTNERSHIP
This chapter provides facts, figures and historical information
regarding the TOP sponsorship programme (managed by the
IOC) and the Olympic Games domestic sponsorship programmes
(managed by the OCOGs).

                                                                        OLYMPIC SPONSORSHIP PROGRAMMES BENEFIT THE OLYMPIC
Olympic Sponsorship Overview                                            MOVEMENT IN THE FOLLOWING WAYS:
                                                                        • Sponsorship provides valuable financial resources to the
                                                                          Olympic family.
                                                                        • Sponsors provide support for the staging of the Olympic Games
Olympic sponsorship is an agreement between an Olympic organ-
                                                                          and the operations of the Olympic Movement in the form of prod-
isation and a corporation, whereby the corporation is granted the
                                                                          ucts, services, technology, expertise and staff deployment.
rights to specific Olympic intellectual property and Olympic market-
                                                                        • Sponsors provide direct support for the training and develop-
ing opportunities in exchange for financial support and goods and
                                                                          ment of Olympic athletes and hopefuls around the world, as well
services contributions. Olympic sponsorship programmes operate on
                                                                          as essential services for athletes participating in the Games.
the principle of product-category exclusivity. Under the direction of
                                                                        • Sponsorship activation enhances the Olympic Games experience
the IOC, the Olympic family works to preserve the value of Olympic
                                                                          for spectators and provides the youth of the world with opportu-
properties and to protect the exclusive rights of Olympic sponsors.
                                                                          nities to experience the Olympic ideals at global and local levels.
                                                                          Sponsorship support contributes to the success of the educa-
                                                                          tional, environmental, cultural and youth-oriented initiatives of
                                                                          the Olympic Movement.
                                                                        • Sponsors develop advertising and promotional activities that help
                                                                          to promote the Olympic ideals, heighten public awareness of the
                                                                          Olympic Games and increase support for the Olympic athletes.
Contents Chapter 2 Olympic Marketing Fact File 2021 Edition 11
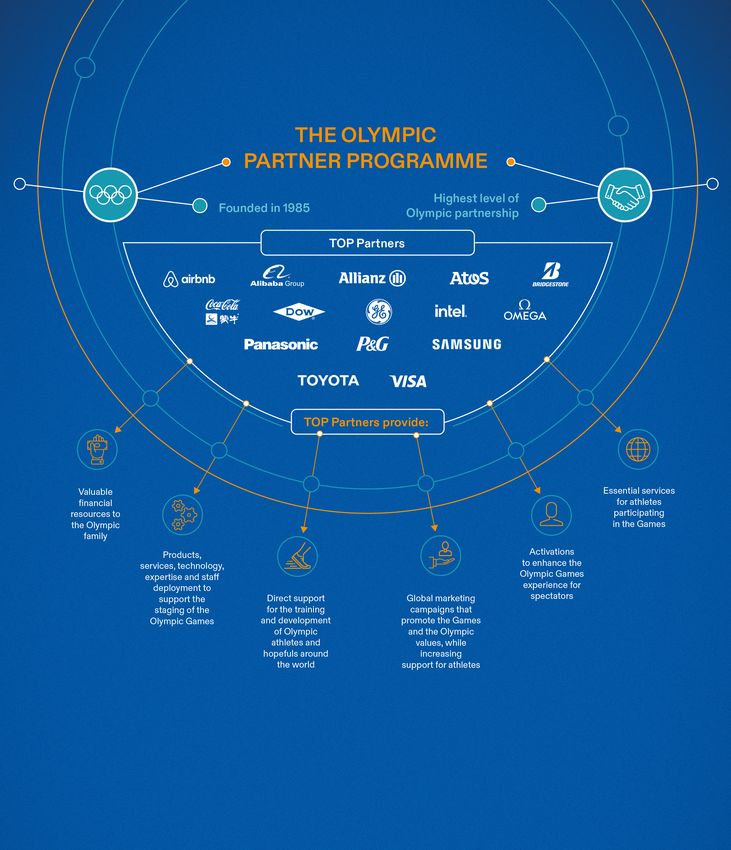
THE OLYMPIC
PARTNER PROGRAMME
Highest level of
Founded in 1985 Olympic partnership
TOP Partners
TOP Partners provide:
Valuable Essential services
financial for athletes
resources to participating
the Olympic in the Games
family
Products, Activations
services, technology, to enhance the
expertise and staff Olympic Games
deployment to experience for
support the Direct support Global marketing spectators
staging of the for the training campaigns that
Olympic Games and development promote the Games
of Olympic and the Olympic
athletes and values, while
hopefuls around increasing
the world support for athletesContents Chapter 2 Olympic Marketing Fact File 2021 Edition 12
Worldwide Olympic Partnership
TOP: THE OLYMPIC PARTNERS
The Olympic Partners (TOP) Programme is the worldwide spon-
sorship Programme managed by the IOC. The IOC created the TOP
Programme in 1985 in order to develop a diversified revenue base for
the Olympic Games and to establish long-term corporate partner-
ships that would benefit the Olympic Movement as a whole. The TOP
Programme operates on a four-year term – the Olympiad.
The TOP Programme supports the Organising Committees of the
Olympic Games and Olympic Winter Games, the NOCs and the IOC.
The TOP Programme provides each Worldwide Olympic Partner
with exclusive global marketing rights and opportunities within a
designated product or service category. The global marketing rights
include partnerships with the IOC, all active NOCs and their Olympic
teams, and the two OCOGs and the Games of each Olympiad. The
TOP Partners may exercise these rights worldwide and may activate
marketing initiatives with all the members of the Olympic Movement
that participate in the TOP Programme.
TOP PROGRAMME EVOLUTION
No. participating Revenue
Olympiad Games Partners
NOCs (in USD millions)
1985 – 1988 Calgary / Seoul 9 159 96
1989 – 1992 Albertville / Barcelona 12 169 172
1993 – 1996 Lillehammer / Atlanta 10 197 279
1997 – 2000 Nagano / Sydney 11 199 579
2001 – 2004 Salt Lake City / Athens 11 202 663
2005 – 2008 Turin / Beijing 12 205 866
2009 – 2012 Vancouver / London 11 205 950
2013 – 2016 Sochi / Rio 12 205 1,003Contents Chapter 2 Olympic Marketing Fact File 2021 Edition 13
TOP Partnerships
WORLDWIDE PARTNER
WORLDWIDE PARTNERContents Chapter 2 Olympic Marketing Fact File 2021 Edition 14
Airbnb Bridgestone
CORPORATE WEB ADDRESS CORPORATE WEB ADDRESS
www.airbnb.com www.bridgestone.com
Exclusive Category Exclusive Category
Unique Accommodation Products and Unique Experiences Services Tyres, restrictive automotive vehicle services, non-motorised bicy-
cles and diversified (rubber) products
TOP Partnership History
Member of the TOP Programme since 2019 TOP Partnership History
Member of the TOP Programme since 2014
Alibaba
CORPORATE WEB ADDRESS
www.alibabagroup.com Coca-Cola & Mengniu
CORPORATE WEB ADDRESSES
www.coca-cola.com / www.mengniu.com.cn
Exclusive Category
Cloud infrastructure, Cloud Services and E-Commerce Exclusive Category
Platform Services Non-alcoholic Beverages
TOP Partnership History Olympic Partnership History
Member of the TOP Programme since 2017 Coca-Cola sponsored the 1928 Olympic Games in Amsterdam and
every Olympic Games since. Longest continuous partnership with
the Olympic Movement
Allianz
CORPORATE WEB ADDRESS TOP Partnership History
www.allianz.com Coca-Cola: Charter TOP Partner (TOP I)
Coca-Cola: Member of the TOP Programme since 1986
Mengniu: Announced first-ever Joint TOP Partnership in 2019
Exclusive Category
Insurance
Dow
TOP Partnership History CORPORATE WEB ADDRESS
Member of the TOP Programme since 2021 www.dow.com
Exclusive Category
Atos
CORPORATE WEB ADDRESS Chemicals, raw materials and compounds used across
www.atos.net selected industries
TOP Partnership History
Exclusive Category Joined the TOP Programme in 2010
Information technology products, services and solutions
Olympic Partnership History GE
Supported the 1992 Olympic Games in Barcelona as Sema CORPORATE WEB ADDRESS
www.ge.com
TOP Partnership History
Joined the TOP Programme in 2001 (TOP V) as SchlumbergerSema
Exclusive Category
Selected industrial equipment for systems used in energy, health-
care, transportation and infrastructure industries
TOP Partnership History
Joined the TOP Programme in 2005 (TOP VI)WORLDWIDE PARTNER
Contents Chapter 2 Olympic Marketing Fact File 2021 Edition 15
Intel Samsung
CORPORATE WEB ADDRESS CORPORATE WEB ADDRESS
www.intel.com www.samsung.com
Exclusive Category Exclusive Category
WORLDWIDE PARTNER
1. P
rocessors, chips and similar silicon platforms, in particular those Wireless Communications and Computing Equipment
specifically used for:
• 5G Technology TOP Partnership History
• VR, 3D and 360-degree Content Development Joined the TOP Programme in 1997 (TOP IV)
• Sports Performance
• Artificial Intelligence
2. Drones Toyota
CORPORATE WEB ADDRESS
TOP Partnership History www.toyota.com
Member of the TOP Programme since 2017
Exclusive Category
Omega Vehicles, mobility support robots and mobility services
CORPORATE WEB ADDRESS
www.omega.ch TOP Partnership History
Member of the TOP Programme since 2017
Exclusive Category
Time pieces, Timing, Scoring and Venue Results Systems Visa
and Services CORPORATE WEB ADDRESS
www.visa.com
Olympic Partnership History
Timing and Scoring sponsor of Atlanta 1996 and Sydney 2000.
Longstanding IOC worldwide Olympic licensee Exclusive Category
Payment services, transaction security, pre-paid cards
TOP Partnership History
Joined the TOP Programme in 2003 (TOP V) TOP Partnership History
Charter TOP Partner (TOP I)
Member of the TOP programme since 1986
Panasonic
CORPORATE WEB ADDRESS
www.panasonic.com
Exclusive Category
Audio/TV/Video Equipment
TOP Partnership History
Charter TOP Partner (TOP I)
Member of the TOP Programme since 1987
Procter & Gamble
CORPORATE WEB ADDRESS
www.pg.com
Exclusive Category
Personal Care, Healthcare and Household Care Products
TOP Partnership History
Joined the TOP programme in 2010Contents Chapter 2 Olympic Marketing Fact File 2021 Edition 16
OLYMPIC GAMES: HISTORY OF OCOG SPONSORSHIP PROGRAMMES
Olympic Games Domestic Sponsorship
Number Revenue (in USD
Olympic Games
of Partners* millions)
The Olympic Games domestic sponsorship programme is man-
aged by the OCOG within the host country under the direction of Atlanta 1996 111 426
the IOC. The programmes support the operations of the OCOG, Sydney 2000 93 492
the planning and staging of the Games, the host country NOC
Athens 2004 38 302
and the host country Olympic team.
Beijing 2008 51 1,218
The Olympic Games domestic sponsorship programme grants London 2012 42 1,150
marketing rights within the host country or territory only. The
host country NOC and the host country Olympic team participate Rio 2016 53 848
in the OCOG sponsorship programme because the Marketing
Plan Agreement requires the OCOG and the host country NOC OLYMPIC WINTER GAMES: HISTORY OF OCOG SPONSORSHIP
PROGRAMMES
to centralise and coordinate all marketing initiatives within the
host country.
Olympic Number Revenue (in USD
Winter Games of Partners* millions)
Nagano 1998 26 163
Salt Lake City 2002 53 494
Turin 2006 57 348
Vancouver 2010 57 688
Sochi 2014 46 1,189
PyeongChang 2018 86 649
* Domestic OCOG sponsorship programmes usually include several tiers of partnership,
which may include sponsors, suppliers and providers. The figures in this column represent
the total number of marketing partners from all tiers of the domestic programme
Olympic Sponsorship History
Sponsorship in various forms has supported the Olympic
Movement since the first modern Olympic Games in Athens in
1896. The follow-ing is a brief overview of key milestones and
informative anecdotes from the history of sponsorship in the
modern Olympic Games.
Athens 1896 Companies provide revenue through advertising during the Olympic Games.
Stockholm 1912 Approximately 10 Swedish companies purchase sole rights to take photographs and sell memorabilia of the Olympic Games.
Antwerp 1920 The official Olympic Games programme contains a great deal of corporate advertising.
Paris 1924 Advertising signage appears within view of the Olympic Games venues for the first and only time in history.
Amsterdam 1928 Current TOP Partner Coca-Cola begins the longest continuous Olympic partnership. Concessionaires are granted rights to operate restaurants on stadium
grounds. Advertising continues in the official Olympic Games programme.
The IOC stipulates that posters and billboards may not be displayed on the stadium grounds and buildings.
Lake Placid 1932 The OCOG solicits businesses to provide free merchandising and advertising tie-ins. Many major department stores in the eastern US feature the Olympic
Games marks in window displays, and many national businesses use the Games as an advertising theme.
Helsinki 1952 The first Olympic Games to launch an international marketing programme. Companies from 11 countries make contributions of goods and services ranging
from food for the athletes to flowers for medallists.
Rome 1960 An extensive sponsor/supplier programme includes 46 companies that provide technical support and products such as perfume, chocolate, toothpaste
and soap.
Tokyo 1964 250 companies develop marketing relationships with the Games.
The new “Olympia” cigarette brand generates more than USD 1 million in revenue for the OCOG. (The tobacco sponsorship category is later banned.)
Montreal 1976 With 628 sponsors and suppliers, domestic sponsorship generates USD 7 million for the OCOG.
Sarajevo 1984 The OCOG signs 447 foreign and domestic sponsorship agreements.Contents Chapter 2 Olympic Marketing Fact File 2021 Edition 17
Los Angeles 1984 For the first time, the domestic sponsorship programme is divided into three categories. Each category is granted designated rights and product
category exclusivity.
The marketing programme is limited to the host country and US companies.
Calgary 1988/ The IOC creates The Olympic Partners (TOP) worldwide sponsorship programme, in coordination with the OCOGs in Seoul and Calgary, as well as 159
NOCs. TOP is based on the 1984 Los Angeles model of product category exclusivity. Prior to the establishment of the TOP Programme, fewer than 10 NOCs
Seoul 1988
in the world had a source of marketing revenue.
The OCOGs launch independent marketing programmes.
For the first time, the IOC requires the OCOG to form a joint marketing programme with the host country NOC.
Albertville 1992/
TOP grows from nine to 12 partners in the programme’s second generation.
Barcelona 1992
Lillehammer 1994 Broadcast and marketing programmes generate more than USD 500 million, breaking almost every major marketing record for an Olympic Winter Games.
Atlanta 1996 The Games are funded entirely via private sources.
Sydney 2000 The OCOG develops the most financially successful domestic sponsorship programme to date, generating more revenue (USD 492 million) than the
domestic sponsorship programme of Atlanta 1996 in a host country marketplace 15 times smaller.
A new standard for brand protection through education, legislation and advertising controls.
Salt Lake City 2002 The Olympic Properties of the United States (OPUS) sponsorship for 2002 breaks records for both Winter and Summer Games.
Athens 2004 In the smallest country to host the Olympic Games to date, Athens 2004 achieved its sponsorship revenue target two years before the Games and
ultimately generated revenue from national and torch relay sponsorship that was 50% higher than initial estimates.
Turin 2006 Turin 2006 stands as the most lucrative and successful sponsorship programme in Italian history. The programme accounted for 6.14% of the total
sponsorship spending in the market, which was significantly higher than previous Olympic Winter Games sponsorship programmes and represented
nearly 1% of the total advertising spend in the Italian market, 35 times greater than that of Salt Lake City 2002.
Beijing 2008 The Beijing 2008 domestic sponsorship programme provided significant support to the operational needs of the OCOG in revenue, goods and services,
which contributed towards the staging of the Olympic Games.
For more information on the Beijing Marketing programmes, visit:
https://olympics.com/ioc/documents/international-olympic-committee/ioc-marketing-and-broadcasting
Vancouver 2010 For more information on the Vancouver 2010 Marketing programmes, visit:
https://olympics.com/ioc/documents/international-olympic-committee/ioc-marketing-and-broadcasting
London 2012 For more information on the London 2012 Marketing programmes, visit:
https://olympics.com/ioc/documents/international-olympic-committee/ioc-marketing-and-broadcasting
Sochi 2014 For more information on the Sochi 2014 Marketing programmes, visit:
https://olympics.com/ioc/documents/international-olympic-committee/ioc-marketing-and-broadcasting
Rio 2016 For more information on the Rio 2016 Marketing programmes, visit:
touchline.digipage.net/iocmarketing/reportrio2016
PyeongChang 2018 For information on the PyeongChang 2018 Marketing programmes, visit:
iocmarketingreport.touchlines.com/pyeongchang2018Contents Chapter 3 Olympic Marketing Fact File 2021 Edition 18 Chapter 3
Contents        Chapter 3                         Olympic Marketing Fact File   2021 Edition              19

OLYMPIC BROADCASTING
This chapter provides facts and figures regarding Olympic broad-
casting, including information on the IOC broadcast policy, global
broadcast viewing statistics from recent history, broadcast rev-
enue support for the Olympic Movement, and broadcast rights
fees from past Olympic Games and Olympic Winter Games.

Olympic Broadcast Overview                   Olympic Broadcast Partnerships

“The IOC takes all necessary                 The long-term Olympic broadcast marketing strategy is designed
                                             to achieve the following objectives:
steps in order to ensure the fullest         • To establish broadcast partnerships to (1) ensure improved
                                               global coverage of the Olympic Games, (2) promote the ideals
coverage by the different media and            of Olympism, and (3) raise awareness of the work of the Olympic
                                               Movement throughout the world.
the widest possible audience in the          • To ensure the long-term financial security of the Olympic
world for the Olympic Games.”                  Movement and the Olympic Games.
                                             • To ensure that broadcast partners are experienced in providing
                                               the highest quality Olympic programming.
Rule 48, Olympic Charter                     • To allow broadcast partners to develop strong Olympic associ-
                                               ations and to strengthen each partner’s identity as the Olympic
                                               broadcaster within its country or territory.
                                             • To maximise exposure across all available media platforms and
                                               exploit latest media technologies.
                                             • To strengthen the continuing legacy of broadcasting support
                                               from one Olympic Games to the next, allowing future OCOGs to
                                               draw on their support, experience and technology.
Contents Chapter 3 Olympic Marketing Fact File 2021 Edition 20
Olympic Broadcast: Worldwide Coverage OLYMPIC WINTER GAMES: COUNTRIES BROADCASTING
The television broadcast of the Olympic Games is the most signifi- Olympic Number of Countries/
cant factor in the communication of the Olympic ideals worldwide. Winter Games Territories Broadcasting
The primary broadcasting objective of the Olympic Movement is to
ensure the most television viewers possible have the opportunity to
Cortina 1956 22
experience the Olympic Games. In pursuit of this objective, cover-
age of the Olympic Games has been made available in an increasing Squaw Valley 1960 27
number of territories and media platforms throughout the world.
Innsbruck 1964 30
OLYMPIC GAMES: COUNTRIES BROADCASTING Grenoble 1968 32
Sapporo 1972 41
Olympic Number of Countries/
Games Territories Broadcasting Innsbruck 1976 38
Lake Placid 1980 40
Berlin 1936 1
Sarajevo 1984 100
London 1948 1
Calgary 1988 64
Helsinki 1952 2
Albertville 1992 86
Melbourne 1956 1
Lillehammer 1994 120
Rome 1960 21
Nagano 1998 160
Tokyo 1964 40
Salt Lake City 2002 160
Mexico City 1968 n/a
Turin 2006 Global
Munich 1972 98
Vancouver 2010 Global
Montreal 1976 124
Sochi 2014 Global
Moscow 1980 111
PyeongChang 2018 Global
Los Angeles 1984 156
Seoul 1988 160
Barcelona 1992 193
Atlanta 1996 214
Sydney 2000 Global
Athens 2004 Global
Beijing 2008 Global
London 2012 Global 0 50 100 150 200 250 0 50 100 150 200
Rio 2016 Global
Tokyo 2020 Global
0 50 100 150 200 250 0 50 100 150 200Contents Chapter 3 Olympic Marketing Fact File 2021 Edition 21
Olympic Broadcast: Global Viewership enabled the broadcast partners to deliver more complete Olympic
coverage to their audiences around the world. The IOC works in part-
nership with its broadcasters to ensure that an increasing amount of
live coverage is available, and that the latest technologies, including
HDTV, live coverage on the internet and coverage on mobile phones
OLYMPIC GAMES: BROADCAST AUDIENCE are available in as many territories as possible.
Olympic OLYMPIC GAMES: HOURS OF CONTENT PROVIDED TO THE RHBS
Television Digital Platforms - RHB
Games
Olympic
Host Broadcast Feed Hours
Games
Global Audience Reach Digital Unique
Video Views (billion)
(billion) Users (billion)
Rio 2016 3.2 1.3 4.4 Seoul 1988 2,572
London 2012 3.6 1.2 1.9 Barcelona 1992 2,800
Beijing 2008 3.5 0.4 0.7 Atlanta 1996 3,000
Sydney 2000 3,500
Athens 2004 3,800
Olympic
Television Digital Platforms - RHB
Winter Games Beijing 2008 5,000
London 2012 5,600
Global Audience Reach Digital Unique Video Views
(billion) Users (million) (billion) Rio 2016 7,100
PyeongChang 2018 1.92 670 3.2 Tokyo 2020 9,500 (planned)
Sochi 2014 2.1 300 1.4
OLYMPIC WINTER GAMES: HOURS OF CONTENT PROVIDED
Vancouver 2010 1.8 130 0.3
TO THE RHBS
Olympic
Host Broadcast Feed Hours
Winter Games
Olympic Broadcast: Glossary Of Terms Albertville 1992 350
Lillehammer 1994 331
Nagano 1998 600
• Global Audience Reach – The net number of people who saw
Salt Lake City 2002 900
at least one minute of the Olympic Games coverage on TV.
• Unique Users – The number of different individuals who visit Turin 2006 1,000
a site within a specific time period.
Vancouver 2010 2,700
• Video Views – The number of times a video is watched.
• RHB – Rights-Holding Broadcasters Sochi 2014 3,100
PyeongChang 2018 5,600
For more details on broadcast statistics, please refer to the broadcast reports of each
Games available at: www.olympics.com/ioc/documents/international-olympic-committee/ TOKYO 2020 BROADCAST FEED HOURS
ioc-marketing-and-broadcasting
Olympic Broadcast Programming
9,500
Olympic broadcast programming is generated by Olympic
HOURS
Broadcasting Services, (OBS) (www.obs.tv), which captures the (planned)
broadcast signal from each Olympic venue and delivers the signal to
the Olympic broadcast partners to air over various media platforms
throughout the world. From 2009 onwards, Olympic Broadcasting
Services has overseen the host broadcaster function for the Games. For more information:
OBS was formed by the IOC to serve as the permanent host broad- www.olympics.com/ioc/broadcasters
cast organisation for both the Summer and Winter Games.
From the full range of available material, each Olympic broadcast
partner may select the particular events to include in its schedule
of Olympic programming. Each Olympic broadcast partner has the
opportunity to deliver those events and images that it determines
to be of greatest interest to the target audience in its home country
or territory.
Increased host broadcast coverage has afforded the Olympic broad-
cast partners greater programming opportunities in more sports andContents Chapter 3 Olympic Marketing Fact File 2021 Edition 22
BROADCAST REVENUE HISTORY: OLYMPIC WINTER GAMES
Olympic Broadcast Revenue Generation
Olympic
Broadcast Revenue (in USD millions)
Winter Games
Olympic broadcast partnerships have provided the Olympic
Movement with a secure financial base and helped to ensure the Squaw Valley 1960 0.05
future viability of the Olympic Games. Olympic broadcast part- Innsbruck 1964 0.9
nerships have been the single greatest source of revenue for the
Olympic Movement for more than three decades. Grenoble 1968 2.6
Sapporo 1972 8.5
BROADCAST REVENUE HISTORY: OLYMPIC GAMES
Innsbruck 1976 12
Olympic Lake Placid 1980 21
Broadcast Revenue (in USD millions)
Games
Sarajevo 1984 103
Calgary 1988 325
Rome 1960 1.2
Albertville 1992 292
Tokyo 1964 1.6
Lillehammer 1994 353
Mexico City 1968 9.8
Nagano 1998 514
Munich 1972 18
Salt Lake City 2002 738
Montreal 1976 35
Turin 2006 831
Moscow 1980 88
Vancouver 2010 1,280
Los Angeles 1984 287
Sochi 2014 1,289
Seoul 1988 403
PyeongChang 2018 1,436
Barcelona 1992 636
Atlanta 1996 898
Sydney 2000 1,332
Athens 2004 1,494
Beijing 2008 1,739
London 2012
Rio 2016
2,569
2,868
USD USD
0.05M 1,436M
Squaw
Valley
1960
USD USD PyeongChang 2018
1.2M 2,868M
Rome 1960
Rio 2016Contents Chapter 3 Olympic Marketing Fact File 2021 Edition 23
BROADCAST RIGHTS FEES HISTORY: OLYMPIC GAMES
(all figures in USD millions)
Central America,
North America
South America Asia Middle East/ Africa Europe* Oceania Total
(US and Canada)
and Caribbean
1997-2000 1,124 14 208 12 422 65 1,845
2001-2004 1,397 21 233 13 514 54 2,232
2005-2008 1,579 34 274 25 578 80 2,570
2009-2012 2,154 106 575 41 848 126 3,850
2013-2016 2,119 326 663 46 941 61 4,157
* Please note certain North African territories and Central Asian territories are included as part of the EBU agreement
For a list of rights-holding broadcasters for each Games please visit: www.olympics.com/ioc/documents/international-olympic-committee/ioc-marketing-and-broadcasting
Olympic Broadcasting History
Television broadcasting has been the most significant factor in the
promotion of the Olympic ideals and the growth of the Olympic
Games worldwide. The following is a brief overview of key milestones
in the history of Olympic television broadcasting.
Berlin 1936 The first Olympic Games to be televised, in and around Berlin only, with a total of 138 viewing hours and 162,000 viewers.
One of three cameras is capable of live coverage – only when the sun is shining.
London 1948 The first Olympic Games to establish the principle of the broadcast rights fee.
The BBC agrees to pay 1,000 guineas (approximately USD 3,000). Concerned about financial hardship to the BBC, the OCOG does not accept payment.
More than 500,000 viewers, most residing within a 50-mile radius of London, watch the 64 hours of Olympic programming.
Helsinki 1952 The OCOG conducts broadcast rights negotiations for the first time.
Melbourne 1956 The breakdown of negotiations prevents transmission of the Olympic broadcast to important markets including the US.
Cortinad’Ampezzo 1956 The Olympic Winter Games are broadcast live for the first time.
During the Opening Ceremony, the final Olympic torchbearer stumbles and falls over the television cable placed on the ice surface of the stadium.
1958 Television rights issues are incorporated into the Olympic Charter with the introduction of Article 49: “the rights shall be sold by the Organising Committee,
with the approval of the IOC, and the revenues distributed in accordance with its instructions”.
Rome 1960 The Olympic Games are televised live for the first time to 18 European countries, and only hours later in the United States, Canada and Japan.
Tokyo 1964 For the first time, satellite broadcast coverage is used to relay images overseas.
1966 The IOC expands revenue sharing to include NOCs and IFs for the first time.
Mexico City 1968 The Olympic Games are broadcast live in colour for the first time.
Slow-motion footage is available live.
Sapporo 1972 Japanese network NHK provides the television feed for broadcasters to choose the coverage they want – the model for today’s host broadcast
organisation.
Los Angeles 1984 Television and radio rights acquired by 156 nations.
More than 2.5 billion people view the Olympic Games.
Albertville 1992/ Barcelona 1992 For the first time in Olympic broadcast history, a multi-tier television structure is operated in several countries.
The main national broadcaster sub-licenses coverage of additional events to other cable and satellite broadcasters, expanding the total sports coverage.
Surveys of the US, the UK and Spain show an average of seven out of ten people tune in to Albertville, and more than nine out of ten tune in to Barcelona.
Lillehammer 1994 Broadcast and marketing programmes generate more than USD 500 million, breaking almost every major Olympic Winter Games marketing record.
More than 120 countries and territories view television coverage of the Games, compared to the 86 countries that broadcast 1992 Albertville.
For the first time, the Winter Games are broadcast on the African continent, via M-Net and ART satellites.
Atlanta 1996 The Games are funded entirely via private sources, including broadcast rights.
The IOC underwrites the cost of the transmissions to Africa.
The broadcast reaches a record 214 countries.Contents Chapter 3 Olympic Marketing Fact File 2021 Edition 24
Nagano 1998 Television coverage of the Games is provided to 180 countries and territories, compared to 120 countries for Lillehammer 1994.
The Olympic Winter Games are broadcast live in Australia for the first time.
Olympic broadcasting firsts include video-on-demand and 3D high-definition.
Sydney 2000 Olympic broadcast reaches 3.7 billion viewers in 220 countries.
The IOC introduces Total Viewer Hours (TVH), a new method of measuring the Olympic television audience levels.
The Games broadcast generates 36.1 billion Television Viewer Hours.
Salt Lake City 2002 The IOC and broadcast partners work to provide satellite coverage to East Timor.
2.1 billion viewers in 160 countries consume more than 13 billion TVH.
For the first time, the host broadcaster covers all Winter events live. For the first time, 100 million viewers in India receive free-to-air coverage.
Athens 2004 More than 300 television channels provide a total of 35,000 hours of dedicated coverage, and 3.9 billion viewers in 220 countries and territories each
watched an average of more than 12 hours of coverage.
For the first time, the Olympic Games are broadcast live in Azerbaijan. Live coverage is also available on the internet in several territories for the first time.
Turin 2006 The Turin Olympic Broadcast Organisation provided nearly 1,000 hours of live content – the most in Olympic Winter Games history. The Olympic broad-
casters also maximised opportunities in new media technology, providing viewers with more access and greater choice through the internet, mobile
phones and multiple television channels. Television coverage is offered for the first time in HDTV and coverage is available for the first time on mobile
phones.
Beijing 2008 Olympic Broadcasting Services provide a record 5,000 hours of live HD content – the most in Olympic history. Digital media is made available across the
world, including via the IOC’s own digital channel in 78 countries in the Middle East, Asia and Africa. For more information on the broadcast of Beijing
2008, visit: https://olympics.com/ioc/documents/international-olympic-committee/ioc-marketing-and-broadcasting
Vancouver 2010 Vancouver 2010 was a defining moment in Olympic broadcasting history, with the most extensive coverage ever produced for the Winter Games reaching
a record potential audience of 3.8 billion people worldwide and approximately 1.8 billion viewers. For more information on the broadcast of the Vancouver
2010, visit: https://olympics.com/ioc/documents/international-olympic-committee/ioc-marketing-and-broadcasting
London 2012 The Olympic Games London 2012 were a milestone in the history of Olympic broadcasting, with more coverage available on more platforms than ever
before. Approximately 100,000 hours of Olympic coverage was broadcast across more than 500 TV channels around the world. For more information on
the broadcast of London 2012, visit: https://olympics.com/ioc/documents/international-olympic-committee/ioc-marketing-and-broadcasting
Sochi 2014 For the first time at any Olympic Games, the amount of digital coverage available exceeded that of traditional broadcasts, with 230 dedicated digital chan-
nels, including 155 websites and 75 apps- carrying a total of 60,000 hours of digital broadcast coverage. For more information on the broadcast of Sochi
2014, visit: https://olympics.com/ioc/documents/international-olympic-committee/ioc-marketing-and-broadcasting
Rio 2016 Half the world’s population watched the Olympic Games Rio 2016, with viewers having access to more Olympic content than ever before. The average TV
viewer watched over 20% more coverage of Rio 2016 then London 2012, with 584 TV channels, more than 270 dedicated digital platforms and hundreds of
official broadcaster pages on social media. For more information on the broadcast of Rio 2016 visit: touchline.digipage.net/iocmarketing/reportrio2016/
PyeongChang 2018 More than a quarter of the world’s population followed the Olympic Winter Games PyeongChang 2018 across various media platforms. In total, the IOC’s
global broadcast partners made more coverage available from PyeongChang than any previous Olympic Winter Games, offering a combined 157,812 hours
– an increase of 38 per cent from Sochi 2014. The increased digital coverage helped make PyeongChang 2018 the most digitally viewed Olympic Winter
Games ever, with 670 million global online users viewing digital broadcast coverage – 120 per cent more than watched Sochi 2014. For information on the
broadcast of PyeongChang 2018, visit: iocmarketingreport.touchlines.com/pyeongchang2018Contents Chapter 4 Olympic Marketing Fact File 2021 Edition 25 Chapter 4
Contents        Chapter 4                                               Olympic Marketing Fact File   2021 Edition                 26

OLYMPIC GAMES TICKETING

Olympic Games Ticketing Overview                                  secondary goal of Olympic Games ticketing programmes is to gener-
                                                                  ate necessary financial revenue to support the staging of the Olympic
                                                                  Games.

The Olympic Games ticketing programme is managed by the OCOG,     The OCOGs and the IOC work to establish ticket prices which
with the support of the IOC. The primary goal of Olympic Games    accommodate the wide range of economic circumstances of the
ticketing programmes is to enable as many people as possible to   public and which are in line with the domestic prices for major sport-
experience Olympic Games ceremonies and competitions. The         ing events.
Contents Chapter 4 Olympic Marketing Fact File 2021 Edition 27
Olympic Games Ticket Sales
Olympic ticketing programmes continue to generate substantial reve-
nue to support the staging of the Games. The charts below present
an overview of recent Olympic Games and Olympic Winter Games
ticketing programmes.
OLYMPIC GAMES TICKETING PROGRAMMES
Tickets Available Tickets Sold Revenue to OCOG
Olympic Games (million) (million) % of Tickets Sold (in USD millions)
Los Angeles 1984 6.9 5.7 82% 156
Seoul 1988 4.4 3.3 75% 36
Barcelona 1992 3.9 3.0 77% 79
Atlanta 1996 11 8.3 75% 425
Sydney 2000 7.6 6.7 88% 551
Athens 2004 5.3 3.8 71% 228
Beijing 2008 6.8 6.5 96% 185
London 2012 8.5 8.2 97% 988
Rio 2016 6.8 6.2 91% 321
OLYMPIC WINTER GAMES TICKETING PROGRAMMES
Tickets Available Tickets Sold Revenue to OCOG
Olympic
(million) (million) % of Tickets Sold (in USD millions)
Winter Games
Calgary 1988 1.9 1.6 84% 32
Albertville 1992 1.2 0.9 75% 32
Lillehammer 1994 1.3 1.2 92% 26
Nagano 1998 1.4 1.3 89% 74
Salt Lake City 2002 1.6 1.5 95% 183
Turin 2006 1.1 0.9 81% 89
Vancouver 2010 1.5 1.5 97% 250
Sochi 2014 1.1 1.0 90% 205
PyeongChang 2018 1.3 1.1 85% 143Contents Chapter 5 Olympic Marketing Fact File 2020 Edition 28 Chapter 5
Contents         Chapter 5                                                 Olympic Marketing Fact File   2021 Edition                  29

OLYMPIC LICENSING

The Ioc Global                     The Olympic                        The Olympic Heritage                  The Olympic Games
Licensing Strategy                 Collection                         Collection                            Programme

Building on Olympic Agenda         The Olympic Collection is devel-   The Olympic Heritage Collection       The Olympic Games Programme
2020, the IOC Global Licensing     oped by the IOC and aims to        is being developed by the IOC as      is developed and managed by
Strategy aims to create a tangi-   engage young people and to         one of its three Global Licensing     the Organising Committee of
ble connection to the Olympic      connect with a large audience      core programmes, and it aims to       the Olympic Games (OCOG) in
Games and Olympism through         through remarkable, authentic,     celebrate the art and design of       each Host Country and is aimed
merchandising programmes that      high-quality products, mainly      the past Olympic Games, with          at Olympic fans either visiting
are aligned with the Olympic       sports equipment and toys.         lifestyle and high-end products       the Host City or following the
image and enhance brand value      Its goal is to communicate         released in limited editions          Games from home and looking
and goodwill. The objective        the essence of the Olympic         aiming to connect the audience        for a souvenir of their Olympic
is to strengthen and promote       brand and values to sports         with Olympic history. The target      experience.
the Olympic brand, not only        enthusiasts, people with an        is Olympic enthusiasts and
during the Olympic Games, but      active lifestyle and those who     anyone who would like to own a        The Olympic Movement works
between Games as well. The         love to watch sport.               piece of Olympic history.             to ensure the authenticity and
IOC Global Licensing Strategy                                                                               quality of Olympic Games
is divided into three core                                                                                  merchandise through a com-
licensing programmes aimed                                                                                  prehensive programme of
at specific target groups: The                                                                              trademark legislation, education,
Olympic Heritage Collection,                                                                                monitoring and enforcement.
The Olympic Collection and The                                                                              These efforts protect consumers
Olympic Games Programme.                                                                                    from unauthorised or coun-
                                                                                                            terfeit goods, protect official
                                                                                                            Olympic licensees from rights
                                                                                                            infringements and protect the
                                                                                                            Olympic brand from the potential
                                                                                                            negative impact of low quality
                                                                                                            unauthorised merchandise.
Contents Chapter 5 Olympic Marketing Fact File 2021 Edition 30
Olympic Games Licensing Programmes
The charts below present an overview of recent licensing pro-
grammes and the revenue generated to support the Olympic Games
and Olympic Winter Games.
OLYMPIC GAMES LICENSING FACTS AND FIGURES
Olympic Games Licensees Revenue to OCOG (in USD millions)
Seoul 1988 62 19
Barcelona 1992 61 17
Atlanta 1996 125 91
Sydney 2000 100 52
Athens 2004 23 62
Beijing 2008 68 163
London 2012 65 119
Rio 2016 59 31
OLYMPIC WINTER GAMES LICENSING FACTS AND FIGURES
Olympic Winter Games Licensees Revenue to OCOG (in USD millions)
Lillehammer 1994 36 24
Nagano 1998 190 14
Salt Lake City 2002 70 25
Turin 2006 32 22
Vancouver 2010 48 51
Sochi 2014 49 35
PyeongChang 2018 4 79
PYEONGCHANG 2018 LICENSING & MERCHANDISE
6m
650,000 25% Commemorative 1ST
1,500 Visitors to two
stamps produced
383,000 Korea’s first-ever
Mascot plush commemorative
Games-time Commemorative
Different toys accounted bank note released
superstores coins issued
products for 25% of
available all salesContents Chapter 5 Olympic Marketing Fact File 2021 Edition 31
Olympic Numismatic Programmes Olympic Philatelic Programmes
For decades, Olympic numismatic programmes have provided finan- Since the first modern Olympic Games in 1896, Olympic philatelic
cial support to the Olympic Games and Olympic teams. Governments programmes have raised awareness of the Olympic Games through-
that issue Olympic coins have often contributed some or all of the out the world, heightened interest in the history of the Olympic
seignioragen (i.e. the difference between the coin’s retail value and Movement and generated revenue for the Olympic Games and
the production cost) to the cost of staging the Olympic Games or Olympic teams.
developing the nation’s Olympic team. A government that issues legal
tender promises to redeem to the bearer the face value of the coin. OLYMPIC PHILATELIC PROGRAMMES: BASIC FACTS
The seigniorage remains as a profit to the issuing government. • The partnership between the Olympic Games and philately, the
collection and study of stamps, dates back to the first modern
OLYMPIC NUMISMATIC PROGRAMMES: BASIC FACTS Olympic Games in 1896.
• Olympic coins date back to 425 BC, when tetra drachmas were • More than 50 million Olympic stamp series have been issued
struck by the competition victors to commemorate success in by countries since the first modern Olympic Games.
the ancient Olympic Games. • Since 1920, OCOGs have received revenue from philately and
• Olympic coins were first struck in modern times to commem- postal services either through a surcharge on stamps or through
orate the 1952 Helsinki Olympic Games. Issued at face value, a gross sum on the sale of stamps.
legal-tender, Olympic coins provided a means of raising funds • Olympic philatelic brochures are distributed by a series of agents
without resorting to increased government taxation. throughout the world. By 2000, agents covered the globe,
• Since 1951, more than 350 million Olympic coins have been making Olympic stamps and brochures readily available.
sold, raising more than USD 1 billion for the issuing authorities
and the Olympic family.Contents Chapter 5 Olympic Marketing Fact File 2021 Edition 32
Olympic Licensing, Numismatic and Philatelic History
Athens 1896 A Greek philatelist proposes the issue of commemorative Olympic stamps.
Olympic philatelic revenue helps to finance the building of Olympic venues including the rifle range in
Kallathea and the cycle track in New Phaliron.
A series of 12 stamps is issued on the inaugural day of the first modern Games.
Stockholm 1912 Approximately 10 Swedish companies purchase sole rights to take photographs and sell memorabilia
of the Games.
Amsterdam 1928 The OCOG covers 1.5% of expenditures with philatelic programme revenue.
Portugal issues stamps to finance its Olympic team’s participation in the Amsterdam Games.
The stamp is obligatory in Portugal for three days.
Lake Placid 1932 The OCOG solicits business organisations and retail stores to provide free merchandising and adver-
tising tie-ins.
Helsinki 1952 The first modern Olympic coin is struck. Finland begins what was soon to become
a tradition by issuing a 500 Markaa circulating coin.
Munich 1972 The first Olympic coin programme dedicated to raising revenues to offset the cost
of the Olympic Games is implemented. An extraordinary cooperation between the Ministry of Finance
and the Bundesbank in Germany gave birth to a combined circulating and numismatic coin programme
from which all revenues are directed to the OCOG. Over USD 300 million is raised from the market,
thereby allowing the government to avoid increased taxation to pay for the cost of the Games.
An advertising agency acts as the Olympic licensing agent for the first time.
Rights to use the official Olympic Games emblem are sold.
Several types of licensing and advertising agreements are available.
The image of the first official Olympic Games mascot, “Waldi”, is licensed.
1992 137 countries issue 1,230,000 stamp series bearing the Olympic rings.
In the period between 1992 and 1996, the IOC also became active in the field of Olympic numismatics.
Rather than commemorating the Games edition, however,
the IOC launched a programme designed to specifically celebrate the Centenary
of the Olympic Movement in 1994.
In collaboration with the mints of Canada, Australia, France, Austria and Greece, five consecutive series
of three coins were created to pay tribute to the founding of the IOC, its ideals and the first edition of
the modern Olympic Games that took place in Athens in 1896.
Through this programme, a total of 93,879 gold and 526,750 silver coins were sold, representing a
sales value of USD 48.4 million, making it one of the most successful coin programmes of that period.
The IOC received a higher than normal royalty in recognition of its role as organiser and manager of its
first Olympic coin programme.
Lillehammer 1994 Broadcast and marketing programmes generate more than USD 500 million, breaking almost every
major Olympic Winter Games marketing record.
The licensing programme results in three times the forecast revenue and sets new standards of organi-
sation and quality for future OCOGs.
1994 Four albums of stamps commemorate the Olympic Movement centennial.
1996 More than 150 countries issue a total of 15 million Olympic stamps.
Nagano 1998 Three albums of Olympic stamps commemorate the Games.
Sydney 2000 A large and very successful coin programme was introduced with the cooperation
of the federal mint in Canberra and the state mint in Perth, Australia. This coin programme used
modern marketing strategies and offered the first coloured Olympic coin.
Merchandise is coded with the DNA of renowned Olympic athletes to ensure product authenticity.
Online retailing is available for the first time.
The concept of the Olympic Store is implemented for the first time, including
the Olympic Superstore in Sydney Olympic Park.
Athens 2004 The Bank of Greece and the Ministry of Finance understood the potential of using seigniorage as
a source of revenue for the Olympic Games. Greece successfully issues 24 million 500 Drachma
Olympic coins into circulation and followed this
up with 50 million 2 Euro Olympic coins.
Olympic philatelic programme is launched in November 2000 in cooperation with Elta, the Hellenic
Post. A series of six non-royalty-bearing stamps were issued to commemorate the Athens 2004
Olympic Games, with new stamp designs released each year up to the commencement of the Games.You can also read