BUSINESS PLAN 2018-2019 - mohawkcollege.ca - Mohawk College
←
→
Page content transcription
If your browser does not render page correctly, please read the page content below
2018-2019
BUSINESS PLAN

mohawkcollege.ca

Table of Contents
Section 1: Board of Governors............................................................................................................................ 3

Section 2: Introduction......................................................................................................................................... 4

Section 3: Strategic Plan...................................................................................................................................... 5

Section 4: 2018–19 Key Priorities........................................................................................................................ 7

Section 5: Financial Position and Operations.................................................................................................... 9

Section 6: 2018–19 Enrolment Targets................................................................................................................ 10

Section 7: Approved 2018-2019 Budget Book ................................................................................................. 11

Glossary of Terms ................................................................................................................................................. 31

Abbreviations and Acronyms................................................................................................................................ 34

Mohawk College 2018–2019 Business Plan mohawkcollege.ca                                                                                                                  2

Section 1: Board of Governors*
Chair:
Joe Parker

Vice Chair:
Katrina McFadden

Stephen Bauld
Gary Crowell
Mila Ray-Daniels
Mark Farrow
Heather Giardine-Tuck
Benjamin Kamminga
Sheri Longboat
Sheree Meredith
Paul Pastirik
Elizabeth Pietrantonio
Tracey Richardson
Raymond Simmons
Steve Stipsits
David A. van der Woerd

President:
Ron J. McKerlie

*As of June 6, 2018

Mohawk College 2018–2019 Business Plan mohawkcollege.ca   3

Section 2: Introduction
The way to achieve community transformation and prosperity is to leverage education as an enabler of hope
and opportunity. To be successful, communities of the future will need to have a strong alignment between
economic expectations and workforce skills, welcoming everyone to play a role in building a healthy, resilient and
prosperous region.

In 2018-2019 Mohawk will continue its focus on key initiatives aligned with its 2016-2021 Strategic Plan and its
2017-2020 Strategic Mandate Agreement with the Government of Ontario. At the same time it will continue
to deliver an exceptional college education and experience to a record number of students. Mohawk is well
positioned to meet the financial challenge ahead and continue advancing its strategic priorities of Student
Success, Graduate Success, Collaboration and Partnerships, Community Leadership, and Strong Foundations.

This plan sets Mohawk apart with competitive differentiators like our new Job Ready Guarantee and lifelong
learning support for our graduates. Its goals are grounded in work that is already underway. It also drives
completion of many of our key investments including new student learning spaces, investment in student
supports, launch of our College Student Success Innovation Centre and furthering our reach of our City School
programming.

Mohawk College 2018–2019 Business Plan mohawkcollege.ca                                                            4

Section 3: Strategic Plan
Vision: Future Ready. Learning for Life
Mission: We educate and prepare highly skilled graduates for success and contributions to the community,
Canada and the world.

Values:
We are student focused.

We are committed to excellence.

We engage our community.

We are inclusive.

We are accountable.

Strategic Themes and Priorities
Student Success
    • Provide more entry points and pathways to a credential.
    • Address financial barriers.
    • Grow our reach and impact.
    • Student engagement to support success.

Graduate Success
    • Ensure graduates are Job Ready. Guaranteed.
    • Provide career support for life.
    • Foster entrepreneurship, innovation and global competencies.
    • Become a leader in simulation-based learning.
    • Rank highest for most satisfied employers.

Collaboration and Partnerships
    • Leaders in applied research.
    • Generate innovative solutions for industry and community challenges.
    • Reframe the definition of campus to support growth and collaboration.

Mohawk College 2018–2019 Business Plan mohawkcollege.ca                                                    5
Section 3: Strategic Plan
Community Leadership
• Lead in Indigenous education in Ontario.
• Lead in social inclusion.
• Lead in internationalization and global experiences.
• Lead in environmental sustainability.
Strong Foundations
• Build reputation and pride.
• Foster excellence in staff and faculty.
• Maintain financial stability to ensure long-term viability.
• Plan for the future.
Mohawk College 2018–2019 Business Plan mohawkcollege.ca 6Section 4: 2018–2019 Key Priorities
STUDENT SUCCESS
Strategic Plan Priority 2018–2019 Business Plan
More Entry Points, more Pathways • Develop digital badge or competency-based strategy to support
to Completion with a Credential increased pathways to credential.
Address Financial Barriers • Launch the Financial Literacy Module and provide additional supports
for students tied to financial health support and awareness for students.
Grow our Reach and Impact • Increase City School reach to community-based “pop up” locations
across Hamilton and region.
Student Engagement to Support • Expand Campus to Community initiative both in number of partners
Success (to 12) and reach of volunteers, by extending volunteer opportunities to
staff and alumni.
GRADUATE SUCCESS
Strategic Plan Priority 2018–2019 Business Plan
Job Ready, Guaranteed • Pilot Job Ready Guarantee (JRG).
Career Support for Life • Expand career development programming through Alumni Backpack
to Briefcase workshop series including The Art of Career Networking
and Conflict and Leadership.
Entrepreneurship, Innovation and • Pilot Entrepreneurship Apprentice program. Provide 24 students with
Global Competencies community impact and social innovation experiences through
City School course deliveries.
A Leader in Simulation-Based • Implement Virtual and Augmented Reality Centre of Excellence
Learning (pending partnership agreement).
Most Satisfied Employers • Implement strategy for employer engagement in increased connections,
cohesion and inventory of what currently exists.
COLLABORATION AND PARTNERSHIPS
Strategic Plan Priority 2018–2019 Business Plan
Leaders in Applied Research • Launch College Student Success Innovation Centre.
• Explore opportunities with non-traditional partners.
• Participate in Supercluster strategies that are approved for this region.
Generating Innovative Solutions for • Create an apprenticeship hub engaging industry, employers and
Industry and Community apprentices, allowing for sustained growth and advancement of
Skilled Trades.
Redefining Campus to Support • Launch Wentworth Heights project with PSW students in January 2019.
Growth and Collaboration
Mohawk College 2018–2019 Business Plan mohawkcollege.ca 7Section 4: 2018–19 Key Priorities
COMMUNITY LEADERSHIP
Strategic Plan Priority 2018–2019 Business Plan
Leaders in Indigenous • Launch SNP/IBM Early College partnership.
Education • Establish McMaster/Mohawk Indigenous diploma to degree pathway Fall 2019.
Leaders in Social Inclusion • Implement Social Inclusion Roadmap.
Leaders in • Continue to diversify international student population.
Internationalization and • Create model and business case to increase international experiences for
Global Experiences domestic students.
Leaders in Environmental • Launch CE certificate in Sustainable Local Foods in Fall.
Sustainability • Launch campus-wide energy monitoring program to identify wasted energy in
classrooms, offices and common areas.
• Expand EV charging stations at Fennell and Stoney Creek campuses by Fall.
• Complete Greenhouse Gas audit in late 2018.
STRONG FOUNDATIONS
Strategic Plan Priority 2018–2019 Business Plan
Reputation and Pride • Launch of the Joyce Centre promotion, CE brand; refresh Alumni brand.
• Undertake a reputation check (Community-focused).
Excellence in Staff and • Refocus ARIE grant (now Applied Research Catalyst Fund).
Faculty • Review CE business model.
• Launch Employee Engagement Survey.
Financial Sustainability • Implement upgrade to payment system to bring cashiering system to current
standards and enable integration with new software.
Planning for the Future • Complete the Joyce Centre building and prepare 4th floor for
Centre for Climate Change Management.
• Develop Campus Master Plan.
• Develop multi-year SEM enrolment strategy that incorporates a formal process
to review program sustainability, program delivery options and takes into
account partner institutions (MCE, Six Nations Polytechnic).
Mohawk College 2018–2019 Business Plan mohawkcollege.ca 8AGENDA ITEM NO.: 4.2
REPORT NUMBER: PO.18.06.139
Section 5: Financial Position and Operations
Section 5 - FINANCIAL POSITION AND OPERATIONS
Page 10 of 34
Form Revised: 15/01/09
Mohawk College 2018–2019 Business Plan mohawkcollege.ca 9AGENDA ITEM NO.: 4.2
REPORT NUMBER: PO.18.06.139
SECTION 6: 2018-2019 ENROLMENT TARGETS
Section 6: 2018–2019 Enrolment Targets
Full Time Enrolments
(Domestic & International)
Full Time Enrolments (Domestic & International)
%
Increase
over
Spring Fall Winter Total 2017/18
2017/18 Total
2,453 13,328 13,056 28,837
Actual Enrolments
2018/19 Financial
2,711 13,632 13,620 29,963
Plan Target
Year over Year
258 304 564 1,126 3.9%
Semester Growth
Page 11 of 34
Form Revised: 15/01/09
Mohawk College 2018–2019 Business Plan mohawkcollege.ca 10Section 7: Approved 2018-2019 Budget Book
Financial Planning Framework
The Financial Plan comprises three main budget components:
• The Operating Budget represents the revenue and expenses associated with the day-to-day operations
of academic, student, ancillary and corporate services. Primary sources of revenue are government grants,
student tuition fees, contracted services and ancillary business operations (campus stores, facility rentals,
residence). These revenue sources support the cost of salaries and benefits, supplies, commodities and
other non-salary related expenses.
• The Fee Supported Budget represents the compulsory ancillary fees paid by students for specific
services. These include fees such as alumni, convocation, technology enhancement and the David Braley
Athletic and Recreation Centre (DBARC) fee. Compulsory ancillary fees are governed by the MAESD
“Tuition and Ancillary Fees” operating procedure. The Mohawk Student Association (MSA) is included in
the decision making process for fee levels.
• The Capital Budget reflects the funding sources and uses for capital, including building projects,
facility improvements, deferred maintenance, information technology and equipment.
What is an Operating Budget?
The college’s annual Operating Budget shows the spending requirements and revenue estimates needed to
support the day-to-day ongoing operations of Mohawk’s programs, services and activities in the academic,
student, ancillary and corporate services areas. Each year, a balanced budget is prepared such that budgeted
expenditures equal budgeted revenue. The operating budget includes amortization of capital assets and,
interest costs associated with the repayment of debt financing.
College expenses include but are not limited to:
• Salaries and fringe benefits
• Supplies and materials
• Commodities (e.g., hydro, diesel fuel and gasoline)
• Contracted services
• Other non-salary related expenses
The academic expenditure level represents direct academic delivery costs for the projected program enrolments
and also program development, program review and accreditation activities. The contribution margin from the
academic area (operating grant plus tuition less academic delivery costs) in turn contributes towards learning
resource centres, innovation & research and academic related overhead costs.
Mohawk College 2018–2019 Business Plan mohawkcollege.ca 11Section 7: Approved 2018-2019 Budget Book
These expenses are paid for by revenue generated by various sources such as:
• General and specific grants from both the Federal and Provincial levels of government
• Student tuition fees and other compulsory student fees
• Ancillary revenue such as, campus stores, parking, residence, food services and facility rentals
• Investment income
• Donations
Student enrolment is the key driver in determining operating budget revenue levels because enrolment influences
the Ontario Ministry of Advanced Education and Skills Development (MAESD) operating grant, tuition fees and
ancillary revenue. The operating grants and tuition fees account for 79% percent of total revenue.
What is a Fee Supported Budget?
In addition to tuition fees, all students are required to pay compulsory ancillary fees. Compulsory ancillary fees
are charged to postsecondary and continuing education students. The fees are collected for activities MAESD
deems are not directly related to academics. Compulsory ancillary fees account for approximately 5% percent
of total revenue and have equal, offsetting expenses.
Compulsory Ancillary Fees are governed by the MAESD “Tuition and Ancillary Fees Reporting” operating
procedure and mandates that student governing bodies be involved in decisions regarding compulsory
ancillary fees. The proposed revenue and expenses were presented to and approved by the MSA.
What is a Capital Budget and Forecast?
Mohawk College’s Capital Budget and Forecast outlines the college’s capital plans for upcoming years and
identifies how to pay for infrastructure projects such as facility and lab improvements, building projects,
deferred maintenance, information technology and equipment.
Mohawk relies on a number of funding sources, some that occur each year and others that are one-time in
nature. Funds for new capital projects include government grants for facility renewal and academic equipment,
student levies, donations, board reserves and debt financing. In addition to new initiatives, the existing
infrastructure continues to age and require capital spending on renewal and replacement.
Financing decisions associated with each capital request were assessed for such factors as availability of
internal funds (operating, ancillary fees, restricted funds, board reserves), accessibility to provincial grant
programs and fundraising opportunities.
Mohawk College 2018–2019 Business Plan mohawkcollege.ca 12Section 7: Approved 2018-2019 Budget Book
Financial Policies & Practices
College budget policy is influenced by Generally Accepted Accounting Principles and MAESD guidelines,
policies and operating procedures. In addition, Mohawk also maintains several policies that are well
established in this organization and others that are equally as important but less formalized. Examples of
budget practices or policies include:
Balanced Financial Plan
Under its governing legislation, the college is required and will prepare a balanced annual financial plan each
year, whereby revenue and expenditures net to zero.
Academic Contribution Margins
For the academic areas, the guidelines approved by the Mohawk Executive Group (MEG) require that
allowable expenditures must be less than forecasted revenue in an amount sufficient to return 42.5% of
revenue as an overall contribution to the college (the “Contribution Margin”). The contribution is allocated
towards learning resource centres, innovation and research and academic related overhead costs. The
academic expenditure budgets are created in relation to revenue targets.
Compulsory Ancillary Fees
In addition to tuition fees, all students are required to pay compulsory ancillary fees. Compulsory ancillary fees
are charged to postsecondary and continuing education students for activities MAESD deems not directly
related to academics. Compulsory Ancillary Fees are governed by the MAESD “Tuition and Ancillary Fees
Reporting” operating procedure and mandates that student governing bodies (e.g., MSA) be involved in
decisions regarding compulsory ancillary fees and subsequent increases.
Compulsory ancillary revenue and offsetting expenses are presented separately from the college’s operating
budget. This level of reporting provides the board with an understanding of how the fees collected will be
utilized. Any fees unspent in the current year may be deferred to the following year.
Approval of Capital, Renovation and Maintenance Projects
Requests for the use of funds to be directed towards capital, renovation and maintenance projects are
submitted through the Capital Planning Committee (CPC). Criteria for capital, renovation and maintenance
project requests require that:
• Expenses should be one-time in nature
• Requests should be in excess of $5,000
Capital requests must align with the strategic priorities of the college. The criteria used to evaluate the
projects include:
• Direct support of business priorities
• Improvements related to health and safety
• Legislative requirements (e.g., accessibility)
• Maintaining infrastructure
Mohawk College 2018–2019 Business Plan mohawkcollege.ca 13Section 7: Approved 2018-2019 Budget Book
The funding sources for capital, renovation and maintenance projects are subject to annual MAESD approved
funding allocations and the college’s operating budget availability. As such, the CPC will review the financial
impact of each priority project and prioritize projects to be presented to MEG based on financial availability.
The recommended projects are presented to MEG for their approval based on their alliance with the strategic
objectives of the college.
All capital, renovation and maintenance projects valued over $2,500,000 require the approval of the Audit,
Finance & Infrastructure Committee of the Board of Governors.
Risk Mitigation Strategies
In light of possible budget uncertainties, the college prepares for and budgets for certain contingencies.
Contingency may be used to support such things as reductions in enrolment, major repairs etc. The
contingency attempts to prudently recognize the risk and the potential negative impact resulting from lost
revenue or unexpected expenditures.
Net Assets
The college manages both “restricted” and “unrestricted” net assets. Internally Restricted Net Assets
represent college surpluses that are subject to internal restrictions imposed in a formal manner by resolution
of the Board of Governors. These restrictions represent specific projects, new initiatives or future obligations.
Internal restrictions form part of the budget following board approval.
Financial Health Indicators
The college’s financial health indicators will reflect and align with the Financial Sustainability Metrics as outlined
in the college’s 2017-2020 Strategic Mandate Agreement (SMA) with MAESD. The 2017-2020 SMA signed by
the college acknowledged that financial sustainability and accountability are critical to achieving institutional
mandates and realizing Ontario’s vision for the postsecondary education system. To that end, seven metrics
were identified to assess the financial health and sustainability of each institution:
1. Annual Surplus/Deficit
2. Net Income to Revenue Ratio
3. Accumulated Surplus/Deficit
4. Net Assets to Expense Ratio
5. Quick Ratio
6. Debt Servicing Ratio
7. Debt to Asset Ratio
Mohawk College 2018–2019 Business Plan mohawkcollege.ca 14Section 7: Approved 2018-2019 Budget Book
Budget Process Timetable
The Budget Process Timetable identifies the key dates and milestones in Mohawk’s development, review and
approval of its respective budget processes.
Planning (Sept-Dec 2017)
• Budget Directions approved by Board of Governors
Planning
• Academic enrolment planning and contribution margin targets
• Non-Academic starting point was 2017/18 original base budget
• Compulsory Ancillary Fee proposals
• Capital equipment and project submissions
Review (Jan-Mar 2018)
• Submission of operating investment proposals
Review
• Community Access & Engagement, Applied Research and Ancillary business
operations detail reviews
• Capital Planning Committee (CPC) prioritize submissions
• Mohawk Executive Group (MEG) review of operating, fee supported and capital
budget plans
• Board approval of tuition fees and compulsory ancillary fees
Approval (Mar-Apr 2018)
• MEG approval of operating budget and capital plan
Approval • Communication with management teams
• Recommendation to Audit, Finance & Infrastructure Committee
• Board of Governors approval of overall 2018/19 Financial Plan
Mohawk College 2018–2019 Business Plan mohawkcollege.ca 15Section 7: Approved 2018-2019 Budget Book Operating Budget Budget reflects Strategic Priorities Mohawk’s Strategic Plan is viewed as an important element in guiding the actions and decisions of the Board of Governors and senior management over the life of the plan. The strategies outlined in the plan heavily influence the various departmental work plans, which in turn have an effect on the budget requirements needed to achieve the board’s vision. Therefore, virtually every short-term and long-term goal has an impact on the approved operating, fee supported and capital budget plans. Enrolment Planning Mohawk has developed a robust approach to Strategic Enrolment Management (SEM) and created an automated tool to model enrolment potential and trajectories, measure success and determine areas of risk. Initially, the Deans and Associate Deans provide enrolment forecasts in all postsecondary activity for domestic and international students which are informed by the strategic mandate agreement, academic plan and international strategy. The SEM Planning Committee oversees the forecasting of enrolments which are ultimately approved by MEG. The committee is represented by staff from across the organization, including Administration, Deans and Associate Deans, Finance, Institutional Research, Registrar and Scheduling. Enrolment Planning is the basis upon which operating budget revenue is calculated for the college. In developing the 2018/19 budget, substantial effort was placed on reviewing academic activity through the SEM tool and committee. Each existing program was examined and forecasted for both domestic and international enrolments, recognizing historical trends in enrolment, changing community needs and demographic shifts. Retention of students was also analyzed at length to ensure projections reflected likely attrition rates. International student enrolments were projected with added emphasis. Key marketing directions will see Mohawk continuing to dominate the Hamilton market. Increased focus will be placed on the recruitment of non-direct students as well as strategic outreach into regions where the youth market is growing. The college will work to increase enrolment among Aboriginal, International and the Access population. As well, marketing will work with the academic area to identify program opportunities that will assist in attracting our target audiences with special emphasis on postgraduate certificates and continuing education programming. International Education is closely integrated into the enrolment planning process to ensure the recruitment targets are synchronized with the enrolment plans developed by the Academic areas. Postsecondary enrolments drive expected revenue from grants, tuition and fees, food services, campus stores, parking etc. They correspondingly drive staffing requirements throughout the college. Mohawk College 2018–2019 Business Plan mohawkcollege.ca 16
Section 7: Approved 2018-2019 Budget Book

Investment Strategies
Financial Managers were given the opportunity to submit investment proposals requesting funding in support of
new service expectations or expanded responsibilities in their respective areas. An investment pool of $6M was
available to support these requests. Financial Managers presented investments for consideration by MEG. Each
investment proposal was linked to the Strategic Plan and anticipated outcomes were identified by linking to the
2018/19 business priorities and how the investment proposal will be measured against the 5-year metrics.

Decisions were also based upon whether the request was one-time in nature or ongoing. After a thorough and
detailed review process, the approved investments will support the following initiatives:

•   Internationalization

•   New Program Development

•   College Quality Assurance Audit Process (CQAAP) Review

•   College Student Success Innovation Centre

•   Job Ready Guarantee

•   IBM Partnership

•   Future Ready Campus Master Plan

•   Investment in Human Resources to Implement Bill 148

•   Information Technology Deferred Maintenance and Strategy

Unpredictable Revenue
Budgeting best practices encourages the avoidance of building a dependence upon unpredictable revenue.
While all revenue sources have some degree of volatility, the financial impact resulting from changes in
international enrolments is more pronounced given the higher value of the tuition fees associated with each
student. With a projected overall enrolment increase of 3.9% and the high tuition value for international
students, the financial plan includes a contingency for domestic and international enrolments.

Mohawk College 2018–2019 Business Plan mohawkcollege.ca                                                       17
Section 7: Approved 2018-2019 Budget Book

Approved Operating Budget at a Glance
The college, while recognizing changes in the economic and demographic environment, continues to maintain
a balanced budget on an ongoing basis. By this, we mean total operating expenditures equal total operating
revenue.

Operating Plan Highlights
The proposed 2018/19 Financial Plan has been developed in accordance with the approved budget directions
and thoroughly reviewed by MEG.

     • The Plan delivers a balanced budget. Gross revenue and expenditures are budgeted at $256M,
       including amortization of capital assets.
     • The Plan was developed around delivering educational programming to 14,982 1 postsecondary      0F

       full-time equivalents (FTE).
     • The full-time staffing complement for 2018/19 is 1,037, representing 418 Faculty, 212 Administrative
       staff and 407 Support staff 2.  1F

     • Throughout the budget deliberations, the full-time complement was increased by a net 32 regular full-
       time permanent positions over the 2018/19 initial staffing plan.

1
    The number of student FTEs includes both domestic and international students in a postsecondary program.
2
    Faculty and Support staff are determined by those positions covered under the respective collective agreements.

Mohawk College 2018–2019 Business Plan mohawkcollege.ca                                                               18
AGENDA ITEM NO.: 4.2
Section 7: Approved 2018-2019 Budget Book REPORT NUMBER: PO.18.06.139
Total Expenditures by Object ($256 Million)
The pie chart
Total Expenditures bybelow illustrates
Object the college’s
($256 Million)2018/19 Approved Operating Budget expenditures by cost
component. Human Resource costs (full-time, part-time and benefits) account for $154M or approximately
The pie chart60%
below illustrates the college’s 2018/19 Approved Operating Budget expenditures by cost
of the total expenditure budget.
component. Human Resource costs (full-time, part-time and benefits) account for $154M or approximately 60%
of the total expenditure budget.
Cost of Goods Sold, Scholarship,
4,127,555 , 2% Bursary & Award
Payments,
Amortization 4,900,000 , 2%
Contracted Expense,
Services & 17,249,250 , 7%
Professional
Fees,
24,871,066 ,
10%
Interest on long-
term liabilities,
2,146,069 , 1%
Utilities &
Building
Maintenance,
Salaries,
19,360,431 , 7%
154,343,674 ,
60%
Supplies and
other
expenses,
22,640,659 ,
9%
Instructional
Supplies,
6,604,456 , 2%
Expenditure Highlights
Expenditure
Human Resources: TheHighlights
2018/19 plan projects 60% of the budgeted expenditures are full-time and part-time
human resources.
Human Resources: The 2018/19 plan projects 60% of the budgeted expenditures are full-time and part-time
human resources.
Full-time Salaries: Full-time salary rate increases for faculty and support are in accordance with the respective
collective agreements. ForFull-time
Full-time Salaries: the approved
salary ratefull-time
increases forcomplement, theare
faculty and support Financial Planwith
in accordance includes the rate increases,
the respective
step increases on anniversary
collective agreements. dates
For the and support
approved staff
full-time special allowances.
complement, Administrative
the Financial Plan includes the rate staff salaries are
increases,
budgeted instep
accordance
increases onwith the current
anniversary dates andreview
supportof administrative
staff salaries.
special allowances. Administrative staff salaries are
budgeted in accordance with the current review of administrative salaries.
Fringe Benefits: The 2018/19 employee fringe benefit rates are as follows: 25% for full-time and 14% for part-
Fringe Benefits: The 2018/19 employee fringe benefit rates are as follows: 25% for full-time and 14% for part-
time employee. Employer deductions include both legislated (e.g., CPP, EI etc.) and discretionary (e.g., health
time employee. Employer deductions include both legislated (e.g., CPP, EI etc.) and discretionary (e.g., health
and life insurance) fringe benefits as well as contributions to a defined benefit pension plan (CAAT).
and life insurance) fringe benefits as well as contributions to a defined benefit pension plan (CAAT).
Full-Time Equivalents (FTE): The 2018/19 initial full-time staffing plan consists of 1,005 permanent FTE positions
across the faculty, administrative and support groups.
PageThrough
20 of 34 the consideration of investment proposals, MEG
Form Revised: 15/01/09
recommended an increase of 32 new full-time positions for a total of 1,037 permanent positions at a cost of $111M,
as shown on the table below. Increases to the staffing plan support existing growth, prepares for future growth in
enrolments, and supports our leadership role in social inclusion, Aboriginal, sustainability and internationalization.
Mohawk College 2018–2019 Business Plan mohawkcollege.ca 19Section 7: Approved 2018-2019 Budget Book
2018–19 Staffing Plan
FACULTY ADMINISTRATIVE SUPPORT TOTAL
Count $ Count $ Count $ Count $
Initial Full Time
412 51,584,913 207 25,984,211 386 31,235,730 1005 108,804,854
Staffing Plan
Final MEG
Approved 418 52,170,444 212 26,486,086 407 32,151,047 1037 110,807,577
Staffing Plan
Contribution Margins: The overall contribution margin targets were established for the different academic
streams: Postsecondary 42.5%, Apprenticeship 30% and Continuing Education 40%.
Non-Salary Expenditures: Non-salary expenses associated with running operations includes supplies, utilities,
maintenance, contract services, insurance, financing charges, travel, professional development and promotion.
Generally speaking, the 2018/19 non-salary operating budget allocations represent the 2017/18 approved
initial levels adjusted for one-time investments. Finance assessed expenses that impact all areas of the college
which include utilities, credit card commission, insurance, legal and US exchange rate implications.
Mohawk College 2018–2019 Business Plan mohawkcollege.ca 20Section 7: Approved 2018-2019 Budget Book
AGENDA ITEM NO.: 4.2
REPORT NUMBER: PO.18.06.139
Where the Money Comes From ($256 Million)
Where the Money Comes From ($256 Million)
The Mohawk College operating budget of $256M is balanced with the use of a variety of revenue sources. The
following pieThe
chart shows
Mohawk the
College funding
operating sources
budget of $256Mof the 2018/19
is balanced Approved
with the use Operating
of a variety of Budget.
revenue sources. The
following pie chart shows the funding sources of the 2018/19 Approved Operating Budget.
Amortization of Miscellaneous,
Deferred 12,572,522 , 5%
Contributions ,
13,068,025 , 5%
Compulsory Student
Fees, 12,734,713 , 5%
Ancillary
Operations,
15,121,013 , 6%
Grants, 105,486,857 , 41%
Tuition Fees,
97,260,032 , 38%
The college’sThe
single largest revenue source comes from MAESD in the form of grants. In 2018/19, $105M or
college’s single largest revenue source comes from MAESD in the form of grants. In 2018/19, $105M or
41% of the college’s total funding
41% of the college’s total fundingwill
willbe operating
be operating grants.
grants. TheOperating
The Corridor Corridor Operating
Grant (COG), which Grant
was (COG), which was
introduced inintroduced
2017/18, in 2017/18, will replace the General Purpose Operating Grant (GPOG). During the transition, years the transition, years
will replace the General Purpose Operating Grant (GPOG). During
of 2018/19 and 2019/20
of 2018/19 the college
and 2019/20 will
the college will be funded
be funded atgreater
at the the greater
of COG or of COG
GPOG. The or
GPOG GPOG.
comprisesThe GPOG comprises
base and growth
base andfunding envelopes
growth funding envelopesand these
and these allocations
allocations are basedare basedcalculations
on complex on complex calculations
involving a rate involving a rate
per weightedperfunding unit and
weighted funding averages
unit and averages of ofprior
prior
year year enrolments.
enrolments. The COG
The COG is calculated in a is calculated
similar manner as in a similar manner as
the GPOG; however, it will be
the GPOG; however, it willbecome
be become the baseline
the baseline grant grant in and
in 2019/20 2019/20
onwards.and onwards.
MAESD has notified the college of $8M of support under the Supporting Quality Programs and Student
MAESD has Outcomes
notifiedprogram.
the college of $8M
This funding is toof support
help underandthe
support quality Supporting
student Quality
outcomes, and to helpPrograms
towards and Student
Outcomes program. This
implementing fundingof is
the provisions theto
Fairhelp support
Workplace quality
Better Jobs Act. and student outcomes, and to help towards
implementing the provisions of the Fair Workplace Better Jobs Act.
Tuition revenue was modelled directly from the enrolment plan and approved fees schedule. Deans and
Tuition revenue wasDeans
Associate modelled directly
used the SEM from
planning the
tool to enrolment
model plan
enrolments and and revenue.
resulting approved fees schedule.
The enrolment plan Deans and
Associate Deans
projectsused the SEM
the delivery planning
of full-time tooldomestic
postsecondary to model enrolments
and international andfor
education resulting revenue. The enrolment plan
29,963 enrolments
projects the (14,9820
delivery of full-time postsecondary domestic and international education for 29,963 enrolments
FTEs).
(14,982 FTEs).
The MAESD mandate of a four-year tuition fee framework, that caps the average annual tuition fee increase
Page 22 of 34
at 3%, has been extended
Form Revised: 15/01/09 for a further two years. The “2018/19 Tuition Fees” report approved by the Board of
Governors on November 8, 2017 outlined the fee increases for first year students, returning students, regular
programs, high demand, etc. with the overall enrolment mix yielding an increase of 3% and therefore, not
exceeding the allowable limit.
As a result, the full-time postsecondary and international tuition revenue increased by $10.3M over the 2017/18
actuals which is attributable to an increase in both the domestic and international tuition rate and enrolment
projections. Continuing education revenue is slightly higher than in 2017/18 due to the growth in distance
education deliveries.
Mohawk College 2018–2019 Business Plan mohawkcollege.ca 21Section 7: Approved 2018-2019 Budget Book Tuition revenue varies directly with in-year enrolment activity and failure to attain the planned enrolments poses a risk to the Financial Plan. This is more pronounced with international enrolments, given their tuition is four times greater than domestic. Recognizing this risk, staff have appropriately planned mitigating contingencies for both domestic and international enrolment. Ancillary revenue is derived from the campus stores, residence, food services, printing and campus copying, summer camp, conferences, parking and DBARC operations. The projected net contribution from ancillary operations of $3.8M represents 25% of total $15.1M revenue. The Centre for Community Partnerships & Experiential Learning offers a broad range of programs including employment services, academic upgrading, City School, school-college works initiatives and enhanced language training. The projected net contribution of $859K represents 10% of total $8.4M revenue. Innovation and Research initiatives include, Medic, Energy and Additive Manufacturing projects; primary funding sources are the Natural Sciences & Engineering Research Council of Canada and Panorama. The college’s operating budget will support $922K net contribution for administrative functions. Fee Supported Budget In addition to tuition fees, all students are required to pay compulsory ancillary fees. These fees generate approximately $13M, which is 5% of total revenue. The fees have equal, offsetting expenses and are critical in supporting services including, technology enhancement, health, athletics, counselling, convocation and alumni. Compulsory ancillary fees are governed by the MAESD “Tuition and Ancillary Fees Reporting” operating procedure and mandates that student governing bodies (e.g., MSA) be involved in decisions regarding compulsory ancillary fees and subsequent increases. The fee supported budgets presented to the Board of Governors are in compliance with the binding policy directive. The following table represents the 2018/19 Compulsory Ancillary Fee gross budget plan. Mohawk College 2018–2019 Business Plan mohawkcollege.ca 22
Section 7: Approved 2018-2019 Budget Book
                                                                                       AGENDA ITEM NO.: 4.2
                                                                              REPORT NUMBER: PO.18.06.139

                                                                          2018/19         *2019/20
                                                                       Planned in year Planned in year
              Name of Fee                                              revenue $(000) revenue $(000)
              Postsecondary Fees ‐ College:
               Alumni                                                  $          381   $         387
               Assessment for Success                                  $          432   $         437
               Convocation                                             $          470   $         479
               Student Success Fee (formerly Student Experience Fee)   $        2,403   $       2,442
               ID Card                                                 $          433   $         439
               Student Centre Building                                 $          156   $         158
               Technology Enhancement                                  $        2,268   $       2,312
               Transcript                                              $          210   $         213
               Access Copyright                                        $          127   $         127
               Student Life (formerly Athletics)                       $        2,156   $       2,278
               DBARC                                                   $        2,596   $       2,656
               Sustainability Initiatives Fee                          $          154   $         157
              Sub‐total Postsecondary Fees ‐ College                   $       11,786   $      12,085
              Postsecondary Fees ‐ MSA:
               Student Activity                                        $        3,196   $       3,375
               HSR Bus Pass                                            $        2,687   $       2,964
               Health and Dental Plan                                  $        2,710   $       2,759
              Sub‐total Postsecondary Fees ‐ MSA                       $        8,593   $       9,098
              Total Postsecondary Fees                                 $       20,379   $      21,183

              Continuing Education Fees:
               Academic Service Fee                                    $         446    $         452
               Student Experience and Activity Fee (College)           $         264    $         267
               Technology Enhancement                                  $          20    $          21
               Access Copyright                                        $          14    $          14
               Capital Campaign                                        $          34    $          35
               Student Bursary                                         $          34    $          35
               Recreation Centre Fee                                   $          34    $          35
               Student Activity Fee (MSA portion)                      $         119    $         120
              Total Continuing Education Fees                          $         965    $         979

              Apprenticeship Fees:
               Apprenticeship Service Fee ‐ College                    $          97 $             99
               Apprenticeship Service Fee ‐ MSA                        $          33 $             34
                Total Apprenticeship Fees                              $         130 $            133

              Total Fees Collected                                   $     21,474 $            22,295
              * 2018/19 enrolment used to estimate 2019/20 planned revenue

                                                      Page 24 of 34
       Form Revised: 15/01/09
Mohawk College 2018–2019 Business Plan mohawkcollege.ca                                                       23
Section 7: Approved 2018-2019 Budget Book
Capital Budget
The 2018/19 Financial Plan aligns capital priorities with funding sources and financing strategies in a concerted
effort to improve the learning environment and building infrastructure needs. Sources such as ministry grants,
student levies, fundraising, research grants, funds from operations and strategic use of board reserves are
carefully considered and employed in a fiscally prudent manner to yield the best results for our student body.
The board approved Joyce Centre for Partnership and Innovation (Joyce Centre), which began in 2016/17
and will be financed by the Federal Government Strategic Investment Fund, donations, board reserves, debt
financing, and Brantford campus sale proceeds is nearing completion. The capital plan also includes the new
parking lots at Fennell and Stoney Creek campuses, upgrades to the McIntyre Performing Arts Centre (MPAC),
a provision for an investment in a virtual reality centre, greenhouse gas reduction program, and essential
deferred maintenance.
In addition to the major capital projects, other capital requests for equipment and smaller scale projects were
evaluated by the college’s Capital Planning Committee. Project charters were developed defining project
deliverables, risks, milestones, staffing and financial requirements. The committee prioritized capital projects
and performed an overall assessment of facilities’ support requirements. The criteria used to evaluate the
projects include:
• Direct support of 2018/19 business priorities
• Improvements related to health & safety or accessibility
• Legislative requirements
• Maintaining infrastructure
Financing decisions associated with each capital request were based on provincial capital grant programs,
student levies, donations, restricted funds and availability of internal operating and board reserve funding.
Debt financing of $12M has been sought for the Joyce Centre to help finance the cost of the $54.25M project.
Advances were received during 2017/18 with the remainder expected in 2018/19. The ‘Debt Servicing’ ratio
and the ‘Debt to Assets’ ratio will be well within their respective MAESD benchmarks
2018–19 Capital Additions & Funding Sources
The total gross capital value of additions is $48M and is summarized in the table below. Campus Renewal
is $23M or 48% of the total and includes the Joyce Centre, new parking lots at Fennell and Stoney Creek
campuses, upgrades to the MPAC and a provision for a Virtual Reality Centre. Facilities renewal projects are
$15M or 31% and include $4.5M for essential deferred maintenance, $7.3M for the Greenhouse Gas Reduction
Program, academic classroom and lab upgrades, renovations to meet the Accessibility for Ontarians with
Disabilities Act (AODA), and health and safety requirements. There is continued investment in information
technology and academic equipment.
Mohawk College 2018–2019 Business Plan mohawkcollege.ca 24Campus Renewal 23,078 48
Facilities Renewal College-wide 15,003 31
Section 7: Approved 2018-2019 Budget Book
Facilities Renewal Academic 2,041 4
Academic
2018–19 Equipment
Capital Plan Additions by Major Category 2,595 5
Information Technology – College-wide 2,804 6
Gross Costs % of
Information Technology – Academic ($ 000’s) 2,897
Total 6
Campus Renewal 23,078 48
Total
Facilities Renewal College-wide 15,003
48,418
31
100
Facilities Renewal Academic 2,041 4
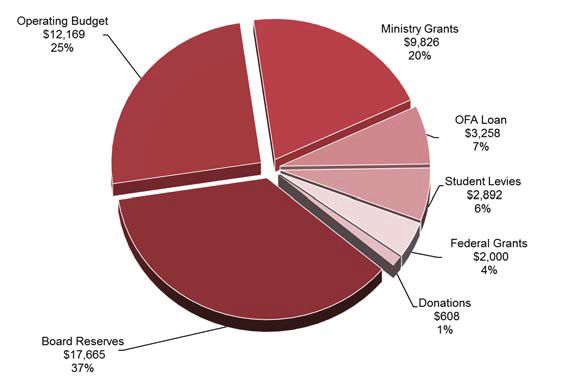
rating funds
Academicsupport
Equipment $12.2M or 25% of the total capital additions. Federal
2,595 5 grants and Ontario Financ
Information Technology – College-wide 2,804 6
hority (OFA) loan totaling $5.3M or 11% of the plan are2,897
Information Technology – Academic
solely for the6 JCPI. Other funding sources inc
stry grants
Total for apprenticeship renewal $1.4M, Greenhouse
48,418 Gas Reduction
100 Program $7.3M, essential
rred maintenance $691K,
Operating funds supportand academic
$12.2M or 25% of equipment $426K;
the total capital student
additions. Federallevies
grants for
and information technology
Ontario Financing
Authority (OFA) loan totaling $5.3M or 11% of the plan are solely for the Joyce Centre. Other funding sources
ancements $2.5M;
include Ministryand donations
grants for facilities
for apprenticeship renewalrenewals at all three
$1.4M, Greenhouse campuses.
Gas Reduction Program $7.3M,
essential deferred maintenance $691K, and academic equipment $426K; student levies for information
rd reserve funding
technology is $17.7M$2.5M;
enhancements or 37%and of the plan.
donations Capitalrenewals
for facilities projects
at allinclude the JCPI of $11.5M, new pa
three campuses.
at Fennell
Boardand Stoney
reserve Creek
funding campuses
is $17.7M or 37% ofof
the$3.2M, upgrades
plan. Capital projectsto the MPAC
include ofCentre
the Joyce $1.065M and a provision
of $11.5M,
new parking lots at Fennell and Stoney Creek campuses of $3.2M, upgrades to the MPAC of $1.065M and a
ual Reality Centre of $1.9M.
provision for a Virtual Reality Centre of $1.9M.
GRAPH - 2018/19 Funding Sources for Capital Additions ($000’s)
APH – 2018/19 Funding Sources for Capital Additions ($000’s)
Mohawk College 2018–2019 Business Plan mohawkcollege.ca 25AGENDA ITEM NO.: 4.2
REPORT NUMBER: PO.18.06.139
Debt Capacity:
Section 7: Approved 2018-2019 Budget Book
The college’s debt level is projected to be $56M at March 31, 2019, which comprises the DBARC $31M,
Brantford
Debt Campus Repatriation $8M, Energy Savings $5M and the new debt for the JCPI $12M. The debt
Capacity
financial
The health
college’s indicators
debt level isfor the next to
projected three year period
be $56M provide
at March the following
31, 2019, projected the
which comprises results compared
DBARC $31M,to
Brantford Campus Repatriation $8M, Energy Savings $5M and the new debt for the Joyce Centre $12M. The
MAESD benchmarks:
debt financial health indicators for the next three year period provide the following projected results compared
to MAESD benchmarks:
Debt to Assets ratio: Average 30% projection is below 35% benchmark (favourable)
• Debt to Assets ratio: Average 30% projection is below 35% benchmark (favourable)
Debt Service ratio: Average 1.82% projection is below 3% benchmark (favourable)
• Debt Service ratio: Average 1.82% projection is below 3% benchmark (favourable)
The Debt
The Debt toto Assets
Assets ratio
ratio measures
measuresthe theproportion
proportionof of
thethe
total assets
total thatthat
assets are are
financed by debt;
financed and, and,
by debt; the Debt
the Debt
Service
Service ratio measuresthe
ratio measures thecost
costofofservicing
servicing debt
debt (principal
(principal & interest)
& interest) as a as a proportion
proportion of revenue.
of total total revenue.
The following graph reflects the projected debt level and interest expense for the next twenty years.
The following graph reflects the projected debt level and interest expense for the next twenty years.
GRAPH – Interest & Debt
GRAPH – Interest & Debt
$60,000 $6,000
$50,000 $5,000
Total Outstanding Debt
Interest Payment
$40,000 $4,000
($000's)
($000's)
$30,000 $3,000
$20,000 $2,000
$10,000 $1,000
$0 $0
Energy Savings Debt DBARC Debt Brant Repatriation Debt
JCPI Debt Interest Payments
The following Graph identifies the sources of funds for existing loans. The DBARC loan (red) is supported by
the student capital levy fee (yellow line). The student levy amount will increase over time with the levy price
indexing. The annual levy started to be enough to cover the annual principal and interest payments in fiscal
2017/18. The college should be fully repaid by 2032/33 (15 years). Savings from operations cover the energy
savings loan (lower utility costs) and the Brantford repatriation loan (closure of Brant-Elgin Street campus), and
increased revenue from opening the new Joyce Centre will cover the costs of the related loan.
Page 27 of 34
Mohawk College
Form Revised: 2018–2019 Business Plan mohawkcollege.ca
15/01/09 26student capital levy fee (yellow line). The student levy amount will increase over timeAwith
GENDAtheITEM
levyNprice
O.: 4.2
indexing.
REPORT NUMBER: PO.18.06.139
The annual levy started to be enough to cover the annual principal and interest payments in fiscal 2017/18. The
The following
college Graph
should beidentifies the sources
fully repaid of funds
by 2032/33 (15for existing
years). loans.from
Savings The DBARC loan (red)
operations coveris the
supported
energyby the
savings loan
Section 7: Approved 2018-2019 Budget Book
student capital levy fee (yellow line). The student levy amount will increase over time with the levy price indexing.
(lower utility costs) and the Brantford repatriation loan (closure of Brant-Elgin Street campus), and increased
The annualfrom
revenue levy started
openingto the
be enough to cover
new JCPI the annual
will cover principal
the costs of theand interest
related payments in fiscal 2017/18. The
loan.
college should
GRAPH be fully repaid
– Sources by 2032/33
of Funds (15 years). Savings from operations cover the energy savings loan
for Loans
GRAPH
(lower utility– costs)
Sourcesand of
theFunds for repatriation
Brantford Loans loan (closure of Brant-Elgin Street campus), and increased
revenue from opening the new JCPI will cover the costs of the related loan.
$5,000
GRAPH – Sources of Funds for Loans
($000's)& Interest Payments
$4,000
$5,000
$3,000
Principal & Interest Payments
($000's)
$4,000
$2,000
$3,000
Principal
$1,000
$2,000
$0
$1,000
$0
DBARC Operations Student Levy
DBARC Operations Student Levy
Multi-Year Infrastructure Capital Projections
Multi-Year Infrastructure Capital Projections
The Essential Deferred Maintenance items and Multi-Year Infrastructure Capital projections are provided on
the following
The two
Essential
Multi-Year tables.
Deferred
Infrastructure The college
Maintenance
Capital plans
items
ProjectionsandtoMulti-Year
continue Infrastructure
to fund $3.8M per year
Capital from operations
projections foron
are provided priority
essential deferred maintenance items.
the following two tables. The college plans to continue to fund $3.8M per year from operations for priority
The Essential Deferred Maintenance items and Multi-Year Infrastructure Capital projections are provided on
essential deferred maintenance items.
the followingDeferred
Essential two tables. Maintenance
The college plans Items
to continue to fund $3.8M per year from operations for priority
2018/19 2019/20 2020/21* 2021/22* 2022/23* Total
essential deferred
Maintenance maintenance items.
Categories $ $ $ $ $ $
2018/19 2019/20 2020/21* 2021/22* 2022/23* Total
$ $ $
Maintenance Categories
Project Planning 425,000 300,000 300,000 $ 300,000 $ 300,000$ 1,625,000
Interior Finishes 130,000 130,000 130,000 130,000 200,000 720,000
Project Planning 425,000 300,000 300,000 300,000 300,000 1,625,000
Mechanical/HVAC/Plumbing 1,800,000 1,760,000 1,945,000 840,000 3,132,000 9,477,000
Interior Finishes 130,000 130,000 130,000 130,000 200,000 720,000
Electrical 910,000 590,000 50,000 50,000 50,000 1,650,000
Mechanical/HVAC/Plumbing 1,800,000 1,760,000 1,945,000 840,000 3,132,000 9,477,000
Conveyance
Electrical 910,000 ‐ 590,000 ‐ 50,000495,000 50,000 ‐ 50,000 ‐ 1,650,000 495,000
Fire Safety
Conveyance ‐600,000 ‐ 360,000 495,000 ‐ ‐ ‐ ‐ ‐ 495,000 960,000
Security
Fire Safety 435,000
600,000 150,000
360,000 ‐ 150,000 ‐ 150,000 ‐ 150,000 960,000 1,035,000
Site: Roads, Sidewalks, Hardscape
Security 30,000
435,000 150,00030,000 150,000 50,000 150,000 50,000 150,000 50,0001,035,000 210,000
Building
Site: Roads,Envelope
Sidewalks, Hardscape 170,000
30,000 1,180,000
30,000 1,380,000
50,000 2,980,000
50,000 50,000 618,000 210,000 6,328,000
Building
TOTALEnvelope 170,000
4,500,000 1,180,000
4,500,000 1,380,000
4,500,000 2,980,000
4,500,000 618,0004,500,0006,328,00022,500,000
TOTAL 4,500,000 4,500,000 4,500,000 4,500,000 4,500,000 22,500,000
* ‐ years 2020/21 to 2022/23 are shown for future consideration
* ‐ years 2020/21 to 2022/23 are shown for future consideration
Page 28 of 34
Form Revised: 15/01/09 Page 28 of 34
Form Revised: 15/01/09
Mohawk College 2018–2019 Business Plan mohawkcollege.ca 27Section 7: Approved 2018-2019 Budget Book
AGENDA ITEM NO.: 4.2
REPORT NUMBER: PO.18.06.139
Multi-Year
Multi-Year Infrastructure Capital
Infrastructure Capital Projections
Projections
2018/19 2019/20 2020/21 2021/22 2022/23 Total
$ $ $ $ $ $
Joyce Centre for Partnership & Innovation
OFA Loan 3,257,540 ‐ ‐ ‐ ‐ 3,257,540
Federal Grants 2,000,000 ‐ ‐ ‐ ‐ 2,000,000
Donations 155,344 ‐ ‐ ‐ ‐ 155,344
5,412,884 ‐ ‐ ‐ ‐ 5,412,884
Joyce Centre for Partnership & Innovation ‐ additional requirements
Board Reserves ‐ Permanent 11,500,000 ‐ ‐ ‐ ‐ 11,500,000
11,500,000 ‐ ‐ ‐ ‐ 11,500,000
New Parking Lots (Fennell & Stoney Creek)
Board Reserves ‐ Permanent 3,200,000 ‐ ‐ ‐ ‐ 3,200,000
3,200,000 ‐ ‐ ‐ ‐ 3,200,000
McIntyre Performing Arts Centre Upgrades
Board Reserves ‐ Permanent 1,065,000 ‐ ‐ ‐ ‐ 1,065,000
1,065,000 ‐ ‐ ‐ ‐ 1,065,000
Virtual Reality Centre
Board Reserves ‐ Permanent 1,900,000 ‐ ‐ ‐ ‐ 1,900,000
1,900,000 ‐ ‐ ‐ ‐ 1,900,000
Century Manor Improvements
Board Reserves ‐ Permanent ‐ 750,000 2,000,000 2,000,000 2,000,000 6,750,000
‐ 750,000 2,000,000 2,000,000 2,000,000 6,750,000
Greenhouse Gas Reduction Program
MAESD Greenhouse Gas Reduction Program 7,318,762 ‐ ‐ ‐ ‐ 7,318,762
7,318,762 ‐ ‐ ‐ ‐ 7,318,762
Essential Deferred Maintenance*
Operating Budget 3,809,100 3,809,100 3,809,100 3,809,100 3,809,100 19,045,500
MAESD Facility Renewal Program 690,900 690,900 690,900 690,900 690,900 3,454,500
4,500,000 4,500,000 4,500,000 4,500,000 4,500,000 22,500,000
Capital Planning Committee
Operating Budget 8,360,202 ‐ ‐ ‐ ‐ 8,360,202
Student Levies 2,892,038 ‐ ‐ ‐ ‐ 2,892,038
MAESD Apprenticeship Enhancement Fund 1,390,643 ‐ ‐ ‐ ‐ 1,390,643
MAESD Capital Equipment Renewal Fund 426,100 ‐ ‐ ‐ ‐ 426,100
Donations 452,028 ‐ ‐ ‐ ‐ 452,028
13,521,011 ‐ ‐ ‐ ‐ 13,521,011
TOTALS 48,417,657 5,250,000 6,500,000 6,500,000 6,500,000 73,167,657
SUMMARY OF SOURCES OF CAPITAL
%
Board Reserves ‐ Permanent 17,665,000 750,000 2,000,000 2,000,000 2,000,000 24,415,000 33%
Operating Budget 12,169,302 3,809,100 3,809,100 3,809,100 3,809,100 27,405,702 37%
Ministry Grants 9,826,405 690,900 690,900 690,900 690,900 12,590,005 17%
OFA Loan 3,257,540 ‐ ‐ ‐ ‐ 3,257,540 4%
Student Levies 2,892,038 ‐ ‐ ‐ ‐ 2,892,038 4%
Federal Grants 2,000,000 ‐ ‐ ‐ ‐ 2,000,000 3%
Donations 607,372 ‐ ‐ ‐ ‐ 607,372 1%
Totals 48,417,657 5,250,000 6,500,000 6,500,000 6,500,000 73,167,657 100%
* ‐ years 2020/21 to 2022/23 are shown for future consideration
Mohawk College 2018–2019 Business Plan mohawkcollege.ca 28
Page 29 of 34Section 7: Approved 2018-2019 Budget Book AGENDA ITEM NO.: 4.2
REPORT NUMBER: PO.18.06.139
The Outlook: 2019/20 – 2020/21 Financial Plan
The Outlook: 2019/20 – 2020/21 Financial Plan
StaffStaff
havehave
simulated multi-year
simulated balancedbalanced
multi-year financial plans. The years
financial 2019/20
plans. to 2020/21
The years 2019/20have tobeen modelled
2020/21 have been modelled
basedbased on enrolments
on enrolments plannedplanned for 2018/19,
for 2018/19, which are which aretoprojected
projected to remain
remain relatively relatively
stable. stable.
This activity This activity drives
drives
expense
expense plans plans
based based on Mohawk’s
on Mohawk’s strategic strategic
directions.directions. Costs with
Costs vary directly varyplanned
directlyactivity
with planned
which hasactivity which has
beenbeen captured
captured in all out-years.
in all out-years. The
The results of results of theprocess
the planning planning process
allowed allowed
staff to plan forstaff
othertoout-year
plan for other out-year
pressures,
pressures, including
including capital capital
buildingbuilding and in
and increases increases
operatingincosts
operating costs
associated withassociated withMulti-
major projects. major projects. Multi-
year projections also allow for more informed and timely maintenance and renovation schedules.
year projections also allow for more informed and timely maintenance and renovation schedules.
2016/17 2017/18 2018/19 2019/20 2020/21
Actual Actual Budget Outlook Outlook
$ $ $ $ $
Revenue:
Grants 96,800,418 98,387,310 105,486,857 97,328,196 97,461,094
Tuition Fees 79,251,854 86,928,108 97,260,032 101,275,612 105,573,985
Ancillary Operations 14,594,366 14,017,695 15,121,013 15,423,433 15,731,902
Compulsory Student Fees 11,477,436 11,489,913 12,734,713 13,053,081 13,379,408
Amortization of Deferred Contributions - Capital 7,436,374 8,024,028 8,168,025 7,859,996 7,160,202
Amortization of Deferred Contributions 4,926,907 4,776,132 4,900,000 5,000,000 5,100,000
Miscellaneous 23,206,528 14,938,356 12,572,522 12,823,972 13,080,452
Total Revenue 237,693,883 238,561,542 256,243,162 252,764,291 257,487,042
Salaries & Benefits:
Salary-Academic 55,093,175 55,180,532 65,414,782 66,723,078 68,057,539
Salary-Admin 20,642,499 22,029,429 26,854,532 27,391,623 27,939,455
Salary-Support 29,067,382 32,076,242 34,213,773 34,898,048 35,596,009
Fringe Benefits 23,492,287 23,827,903 27,860,587 28,128,924 28,691,502
Subtotal - Salaries & Benefits 128,295,343 133,114,106 154,343,674 157,141,672 160,284,506
Non Salary Expenses:
Instructional Supplies 6,099,798 6,417,588 6,604,456 6,736,545 6,871,276
Supplies and other expenses 17,045,988 20,424,707 18,696,643 18,070,576 18,431,987
Utilities & Building Maintenance 17,464,318 18,922,196 19,360,431 18,702,463 19,075,624
Interest on long-term liabilities 2,575,285 2,071,984 2,146,069 2,339,239 2,215,352
Contracted Services & Professional Fees 19,484,141 21,288,782 24,871,066 20,268,487 20,673,857
Amortization Expense 14,451,134 15,164,336 17,249,250 18,206,405 17,514,124
Cost of Goods Sold 4,042,314 3,911,121 4,127,555 4,210,106 4,294,308
Scholarship, Bursary & Award Payments 4,926,907 4,776,132 4,900,000 5,000,000 5,100,000
Miscellaneous & Contingencies - - 3,944,016 2,088,799 3,026,008
Subtotal - Non Salary Expenditures 86,089,885 92,976,846 101,899,488 95,622,619 97,202,537
Total Expenditures 214,385,228 226,090,952 256,243,162 252,764,292 257,487,043
Net Surplus 23,308,655 12,470,590 ‐ ‐ ‐
Page 30 of 34
Form Revised: 15/01/09
Mohawk College 2018–2019 Business Plan mohawkcollege.ca 29You can also read