SEATTLE BICYCLE MASTER PLAN - 2017-2021 Implementation Plan Seattle Department of Transportation - Seattle.gov
←
→
Page content transcription
If your browser does not render page correctly, please read the page content below
Seattle Department of Transportation

SEATTLE BICYCLE MASTER PLAN
2017-2021 Implementation Plan

APRIL 2017
CONTENTS

     Chapters

         1. Introduction                              4

         2. Safety                                    5

         3. Bicycle Master Plan Progress              6

         4. Prioritization                            8

         5. 2017-2021 Projects                        9

         6. Coordination Projects Update              22

        7. Project Delivery: Taking Projects
        		 from 1% Design to 100% Construction        24

         8. Funding and Costs                         26

     Appendices

         Appendix 1: Performance Measures             29

         Appendix 2: Strategies and Actions           30

         Appendix 3: Project Changes in this Update   36
1. INTRODUCTION
BACKGROUND PURPOSE
The Seattle Bicycle Master Plan’s (BMP) vision is This implementation plan describes the work that
that riding a bicycle is a comfortable and integral the Seattle Department of Transportation (SDOT)
part of daily life in Seattle for people of all ages and and our partners will undertake to implement
abilities. The BMP identifies projects and programs the BMP over the next five years. We update the
to be implemented from 2014 to 2033 to achieve implementation plan each year to:
the vision and meet the plan’s goals for safety, • Provide a list of specific projects SDOT is
ridership, equity, connectivity, and livability. planning to build each year;
• Serve as an accountability and reporting
Implementing the BMP also supports other city tool; and
plans and priorities, including the • Guide future budget requests.
Housing Affordability and Livability Agenda,
Age-Friendly Seattle, Vision Zero, and Seattle 2035. REPORTING REQUIREMENTS
Consistent with Council Resolution 31515, this
To achieve its vision and goals, the BMP calls for implementation plan is updated annually by
a connected network that includes approximately March 31. Adjustments are made to the project
100 miles of protected bicycle lanes and nearly lists and maps to reflect changes to project
250 miles of neighborhood greenways. The BMP schedules, changes to project types, and to add or
also identifies activities designed to support and remove projects.
encourage riding such as facility maintenance,
bicycle parking, and educational events. Also consistent with Council Resolution 31515,
SDOT submits a progress report to the City
This 2017-2021 BMP Implementation Plan Council as part of the annual implementation plan
identifies projects and programs that, combined update. The progress report summarizes work
with existing facilities, will make significant done during the prior year, and was reviewed
progress towards implementing the BMP in the and endorsed by the Seattle Bicycle Advisory
next 5 years. Board (SBAB). SDOT also provides updates to
the City Council and SBAB every 6 months on the
Since 2016, BMP implementation has been funded status of projects, programs, and actions in the
primarily by the Levy to Move Seattle, which was implementation plan.
approved by voters in 2015. The new levy targets
building a total of 50 miles of protected bicycle
lanes and 60 miles of neighborhood greenways
over the 9-year levy period.
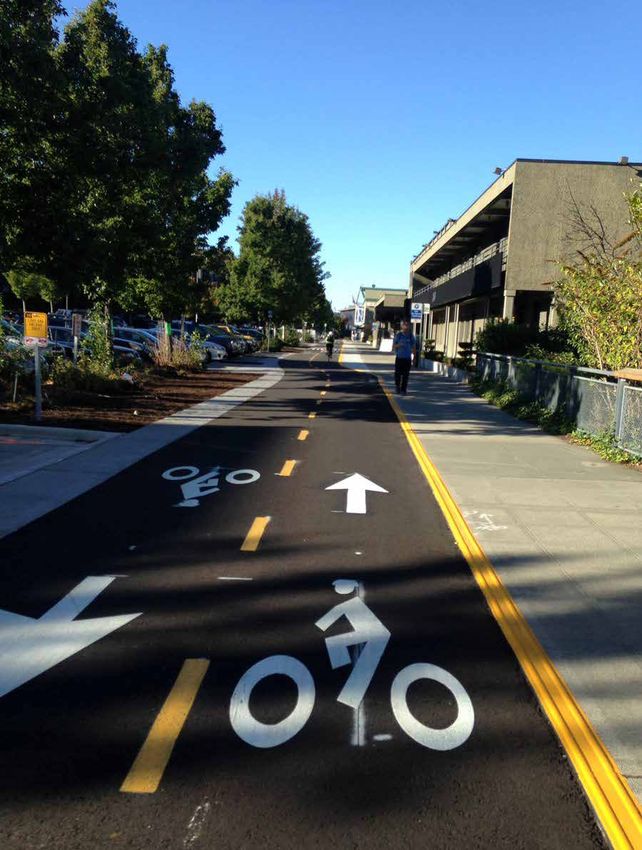
Protected bicycle lanes: facilities physically separated from motor vehicle traffic and distinct from the sidewalk; they may be
1-way or 2-way, and may be at street level or raised several inches above.
Neighborhood greenways: residential streets with low motorized traffic volumes and speeds that are designated and designed
to give people walking and biking safe and pleasant travel priority.
4 | SEATTLE DEPARTMENT OF TRANSPORTATION
2. SAFETY

A central focus of the BMP is to design and              BICYCLE AND PEDESTRIAN SAFETY
implement bicycle facilities that are safe and           ANALYSIS
comfortable for riders of all ages and abilities.        In 2016, we completed the Bicycle and Pedestrian
Since the BMP was adopted in 2014, we have               Safety Analysis, which studied 8 years of citywide
launched our Vision Zero initiative, which               data to identify the roadway designs and user
addresses safety for all roadway uses, and               behavior characteristics most highly correlated
completed the Bicycle and Pedestrian Safety              with collisions involving people walking or biking.
Analysis (BPSA). These complement the BMP’s              Based on the data analysis, we developed a safety
focus on safety, and are described below.                prioritization model to identify opportunities
                                                         for spot and corridor improvement projects.
VISION ZERO                                              Understanding the contributing circumstances
In 2015, the City of Seattle launched Vision             of bicycle and pedestrian crashes will inform our
Zero, our plan to end traffic deaths and serious         work going forward, and move us more quickly
injuries by 2030 through innovative engineering,         towards our Vison Zero goal.
enforcement, and education initiatives. Staff who
implement the BMP are now part of SDOT’s Vision
Zero team, which enhances collaboration and
leverages our commitment to safety.

The bike facilities included in this plan (see
Chapter 5) provide innovative engineering and
smarter street designs that support Vision Zero,
and the bicycle safety programs in Appendix 3
help implement the education components of the
BMP and Vision Zero. To address the enforcement
component, the Seattle Police Department (SPD)
will continue to conduct targeted enforcement
throughout the city to improve safety for our most
vulnerable users, along with enhanced driving
under the influence enforcement. We will work
with SPD to educate people in advance of these
patrols, so everyone will expect appropriate
enforcement and develop a better understanding
of the rules of the road.

                                                    SEATTLE BICYCLE MASTER PLAN IMPLEMENTATION PLAN 2017-2021 | 5
3. BICYCLE MASTER PLAN PROGRESS

The projects in the table below were completed
in 2016 and collectively added more than 5 miles
to the network. They range from short extensions
like that on 2nd Ave, to projects like Westlake that
dramatically increased network connectivity.

                                     PROJECTS COMPLETED IN 2016
                                                                                        Facility Facility
       Project Name            On Street                From Street        To Street     Type Mileage
2nd Ave PBL Demonstration   2nd Ave Ext S              Yesler Way       S Washington St PBL      0.07
Delridge Way SW PBL         Delridge Way               SW Myrtle St     SW Holden St    PBL      0.38
                            SW
N 34th St PBL               N 34th St                  Fremont Ave N Phinney Ave N      PBL      0.23
Roosevelt Way NE Paving and Roosevelt Way              NE 65th St    University         PBL      1.37
Safety Improvements         NE                                       Bridge
University Bridge PBL       University                 Roosevelt Way Fuhrman Ave E      PBL      0.35
                            Bridge                     NE
Westlake Ave N PBL          Westlake Ave N             W Raye St     Valley St          PBL      1.23
Meridian Ave N Paving and   Meridian Ave N             N 103rd St    N 112th St         BL       0.44
Safety Improvements
Renton Ave S BL             Renton Ave S               51st Ave S       City Limits     BL       1.34
SW Admiral Way BL           SW Admiral                 California Ave   63rd Ave SW     BL       1.39
                            Way                        Sw
39th Ave NE NGW Extension 39th Ave NE                  NE 80th St       32nd Ave NE     NGW      0.8
                            / NE 85th St /
                            38th Ave NE /
                            NE 89th St
E Columbia St NGW           E Columbia St              12th Ave         29th Ave        NGW      1.02
Wallingford NGW Upgrade     N 43rd St /                Stone Way N      Latona Ave NE   NGW      N/A
(Added improvements to      Burke Ave N /
existing)                   N 44th St / NE
                            44th St
39th Ave NE NGW Upgrade     39th Ave NE                Burke-Gilman     NE 80th St      NGW      N/A
(Added improvements to                                 Trail
existing)

PBL = Protected Bike Lane
BL = Bike Lane
NGW = Neighborhood Greenway

6 | SEATTLE DEPARTMENT OF TRANSPORTATION
At the beginning of 2016, we set goals for project
and program delivery as shown in the table below.

                                               2016 MOVE SEATTLE DELIVERABLES
                  Deliverable                                  2016 Goal                                2016 Status
    Education (Schools Reached)               N/A   1
                                                                                         Every 3rd, 4th, and 5th grade class in
                                                                                         Seattle Public Schools
    Bike Parking Spaces                       500                                        622
    Wayfinding (miles)                        N/A   1
                                                                                         2.13
    Spot Improvements                         10                                         11
    Move Seattle Neighborhood Greenways       6.67 (60 miles over 9 years)               1.82
    (miles constructed)
    Move Seattle Protected Bike Lanes         5.56 (50 miles over 9 years)               3.63
    (miles completed)

1
 Though the Levy to Move Seattle didn't set goals for these programs they are carry-over goals from Bridging the Gap being
pursued by partner programs.

These goals are intended to help us reach the                        6-mile corridor and the opportunity for coordination
9-year targets established in Move Seattle. We met                   with pavement repair. Other projects were not
or exceeded the education, bike parking, wayfinding                  completed before year-end due to a particularly
and spot improvement goals, and did not meet                         wet and severe winter, construction/utility conflicts,
the neighborhood greenway and protected bicycle                      and inter-agency coordination issues. Those
lane goals. Several factors contributed to us not                    projects are listed below, with their new completion
meeting those goals. For example, the Rainier                        dates. In spite of not meeting all of our 2016 goals,
Valley Neighborhood Greenway was delayed due to                      we are on track to catch up with our Move Seattle
the need for additional public outreach along the                    deliverable goals in the next few years.

                                                        DELAYED 2016 PROJECTS1
                                                               Estimated
                         Project Name                          Completion                       Reason(s) for delay
    Banner Way NE Corridor                                         2017       Weather delay
    Dexter Ave N PBL                                               2017       Weather delay
    N 92nd St PBL                                                  2017       Weather delay
    Gilman Ave W (Part of the Interbay Trail Connections)          2017       Added to contract with Nickerson St paving
    Center City - 9th Ave N PBL (Northern segment)                 2017       Weather delay
    Center City - 9th Ave N PBL (Southern segment)              2017-2018     Private construction and utility coordination
    Rainier Valley NGW                                          2017-2018     Needed additional public outreach and paving
                                                                              project coordination
    S Dearborn St PBL                                           2017-2018     WSDOT and paving project coordination
    SODO Trail                                                  2018-2019     WSDOT and Metro coordination

1
 Please note that all projects listed in this table are included in the Project Lists and Maps in Section 5 along with their extents
and associated mileage.

PBL = Protected Bike Lane
BL = Bike Lane
NGW = Neighborhood Greenway

                                                               SEATTLE BICYCLE MASTER PLAN IMPLEMENTATION PLAN 2017-2021 | 7
4. PRIORITIZATION
The project list in this plan was developed using
the prioritization process established in the QUALITATIVE PRIORITIZATION
BMP, which includes both a quantitative and a The next step of our prioritization process
qualitative process. considers qualitative factors including policy
directives, community interest, and geographic
QUANTITATIVE PRIORITIZATION balance. In collaboration with the Seattle Bicycle
Quantitatively, projects are assigned scores based Advisory Board (SBAB) these factors were
on 5 factors, listed below from highest weight to considered along with the quantitative data to
lowest: select projects that helped to connect and extend
• Safety Seattle’s all ages and abilities network.
• Connectivity
• Equity LEVERAGING OPPORTUNITIES
• Ridership Leveraging the benefits of other SDOT projects
• Livability was another high priority in this year’s project
selection process. SDOT and SBAB prioritized
The sum of these scores is assigned to individual BMP projects if they could be completed at the
project segments, which are then divided into 5 same time as another project involving major
different priority ‘Tiers’ of projects. Tier 1 is the work on a street, including bus rapid transit,
highest scoring 20% of the projects, Tier 2 is the paving, or safety projects.1 This complete streets
next highest 20%, and so on. approach helps to reduce construction impacts
and provides benefits to multiple SDOT and
partner agency programs. We also look for
opportunities to partner with private development
to support HALA through BMP investments.
Throughout the next 5 years, we will also be
looking to leverage funding opportunities
outside SDOT and the City, including those
available through Sound Transit Station
Access Improvement funding. SDOT will also
leverage opportunities presented by WSDOT's
replacement of the SR 520 bridge in improving
bike connections.
1
Approximately 25 miles of bike facilities will be delivered by
other programs over the next 5 years.
8 | SEATTLE DEPARTMENT OF TRANSPORTATION5. 2017-2021 PROJECTS
The following pages describe the selected projects There are several projects on the list and map
for implementation for 2017 through 2021. where the exact route, length, and/or facility
type of each project are still unknown. In those
For ease of review and discussion, the project instances, we listed “TBD” (to be determined) and
list and maps are organized by geographic showed the projects on the maps as dashed blue
sector (north, central, and south), and provide lines (indicating potential routes). Subsequent
a description including year, facility type, and implementation plans will be updated with more
project length. All projects for the 5-year specific information as these projects enter into
implementation plan are included to show the the project definition phase.
connected network.
QUICK WINS (3) 4th Ave
We consistently look for opportunities to install We are still planning the One Center City bike
low-cost bike facilities to quickly enhance safety network. Rather than wait until a final configuration
and comfort - both for permanent and interim is figured out, we are installing minor-separation
facilities. This can include installing minor- bike lanes on 4th Ave in 2017 and 2018 to improve
separation bike lanes and later upgrading them near-term bike connectivity downtown.
to protected bike lanes, or installing “paint and
post” bike lanes and later upgrading to more (4) Chief Sealth Trail
permanent separation. 4 examples of upcoming In collaboration with the southeast Seattle
quick wins are described here. community, we have identified several locations
along the Chief Sealth Trail where we can make
(1) S Dearborn St connections between the existing trail and the
We will be repaving S Dearborn St in 2018, but existing road network quickly and cost-effectively.
rather than wait until then to provide improved While these connections are less than ¼ mile in
bike facilities, we will be installing a low-cost length, they will improve convenience for trail
buffered bike in lane in 2017 as an interim step users without major capital investment.
to enhance safety. We will upgrade this facility to
be a protected bike lane during the paving project (5) Spot Improvements
the following year. Bike Master Plan work is coordinated with Vision
Zero, the Pedestrian Master Plan, and the Bicycle
(2) Western Ave Pedestrian Safety Analysis to implement spot
We are installing a low-cost protected bike lane improvements every year. The Levy to Move
on Western Ave from University St to Virginia Seattle has allocated funding for 2017 to improve
St (0.34 miles) in partnership with Pike Place safety on bridges throughout the City, including
improvements. the Ballard Bridge.
SEATTLE BICYCLE MASTER PLAN IMPLEMENTATION PLAN 2017-2021 | 9NORTH SECTOR PROJECT MAP
N 145TH ST NE 145TH ST
Legend
Proposed 2017-2021 Projects
32 05 03
Final route pending selection
Existing Bike Facilities (Excluding Sharrows) N 130TH ST
Study Areas
NE 125TH ST
E
YN
WA
SA N
5TH AVE NE
U RBAN TRL
Y
35
CIT
D PO
GREENWOOD AVE N
IN
29
INTER
AK E
AURORA AVE N
L
NE NORTHGATE WAY T WA
25
Y NE
31
10 | SEATTLE DEPARTMENT OF TRANSPORTATION
N 105TH ST
3RD AVE NW
Puget Sound 27 22
31
26 19
NW 16 01
RD 15 NE 95TH ST
Lake Washington
AN
LM 31
HO 28
35TH AVE NE
N 85TH ST
ROOSEVELT WAY NE
34 04 24
NW 85TH ST
NW 80TH ST NE 80TH ST
15TH AVE NE
N 80TH ST
02 08
AVE NW
NE 75TH ST
12
EW
20 09 17
15TH AVE NW
AVI
Green Lake
SE
10
NW 65TH ST NE 65TH ST
24TH AVE NW
18
12TH AVE NE
8TH AVE NW
30
07 13
06 NW MARKET ST 14 BURK E R L
25TH AVE NE
21 T
PHINNEY AVE N
NE 50TH ST GILMAN
11TH AVE NE
N 50TH ST
NW 46TH ST 37
N 45TH ST NE 45TH ST
LE
GI
N 46TH ST
AR
E
LM
AN
YW
VD N
AY
AV
23
7TH AVE NE
E
STONE WAY N
N
W
W
E BL
BALLARD BR
W EMERSON ST
K
W N 40TH ST
40 NI
T LA
CK NE P
ER AC
FREMONT AVE N
11 IFI
SO N C
MO N
ST ST
W DRAVUS ST
34TH AVE W
N 34 72 Miles
TH S T 33 38
15TH AVE W
0 0.5 1
3RD AVE W
AURORA BRNORTH SECTOR PROJECT LIST
Facility Facility Target
Project # Project Name On Street From Street To Street Type Mileage Year**
2017
01 N 92nd St PBL N 92nd St Wallingford Ave N 1st Ave NE PBL 0.38 2017
02 Banner Way NE Corridor Banner Way NE 5th Ave NE 15th Ave NE BL 0.57 2017
03 Cedar Park Elementary NGW 37th Ave NE / NE 125th St / NE 123rd St NE 145th St NGW 1.21 2017
Connection* 38th Ave NE
04 Greenwood Elementary NGW 1st Ave NW N 73rd St N 92nd St NGW 0.98 2017
Connection*
05 Olympic Hills NGW Connection* 25th Ave NW / NE 130th St / NE 127th St NE 135th St NGW 0.76 2017
27th Ave NE
2018
06 Burke Gilman Trail Missing Link Burke-Gilman Trail 11th Ave NW / NW Market St / TRL 1.42 2018
NW 45th St NW 54th St
07 11th / 12th Ave NE 2018 Paving Eastlake Ave NE / 11th Ave University Bridge NE 75th St PBL 1.94 2018
NE / 12th Ave NE
08 35th Ave NE 2018 Paving - 35th Ave NE NE 65th St Ne 89th St PBL 1.20 2018
Northern Segment
09 15th Ave NE 2018 Paving - 15th Ave NE NE 62nd St Lake City Way NE PBL 0.94 2018
Northern Segment*
10 Roosevelt PBL Extension* Roosevelt Way NE NE 65th St NE 75th St PBL 0.50 2018
11 N 34th St PBL N 34th St Fremont Ave N Stone Way N PBL 0.33 2018
12 NE 70th St PBL* NE 70th St 8th Ave NE Roosevelt Way NE PBL 0.12 2018
13 35th Ave NE 2018 Paving - 35th Ave NE Burke-Gilman Trail NE 65th St BL 0.98 2018
Southern Segment*
14 15th Ave NE 2018 Paving - 15th Ave NE NE 47th St Cowen Pl NE BL 0.62 2018
Southern Segment*
15 North Seattle NGW N 92nd St / 1st Ave NW / 15th Ave NW College Way N NGW 2.70 2018
N 100th St
16 Eagle Staff Middle School NGW N 92nd St Fremont Ave N Wallingford Ave N NGW 0.62 2018
Connection*
17 Wedgwood NGW Connection* NE 68th St 34th Ave NE 39th Ave NE NGW 0.26 2018
18 NE 65th St Vision Zero Corridor* NE 65th St / NE 68th St / NE Ravenna Blvd 34th Ave NE TBD 1.56 2017-2018
NE 70th St
*These projects were not included in the 2016-2020 Implementation Plan and are new to this year's plan.
SEATTLE BICYCLE MASTER PLAN IMPLEMENTATION PLAN 2017-2021 | 11
**Target year is year of completion.NORTH SECTOR PROJECT LIST (CONTINUED)
Facility Facility Target
Project # Project Name On Street From Street To Street Type Mileage Year**
2019
19 Northgate Light Rail Station 1st Ave NE NE 92nd St NE 100th St TRL 0.38 2019
Corridor -Segment 1
20 Green Lake 2019 Paving Green Lake Dr N / E Green Aurora Ave N / N 50th St PBL 2.55 2019
Lake Dr N / E Green Lake N 83rd St
Way N / Green Lake Way N
21 N 50th St 2019 Paving N 50th St Phinney Ave N Green Lake Way N PBL 0.64 2019
22 NE 100th St PBL NE 100th St 1st Ave NE 5th Ave NE PBL 0.31 2019
23 N / NE 40th St 2019 Paving N 40th St / NE 40th St Woodland Park Ave N 7th Ave NE BL 1.12 2019
24 Ballard NGW - Eastern Segment N 83rd St Fremont Ave N Aurora Ave N NGW 0.25 2019
12 | SEATTLE DEPARTMENT OF TRANSPORTATION
2020
25 Northgate Light Rail Station 1st Ave NE NE 103rd St NE Northgate Way TRL 0.38 2020
Corridor - Segment 3
26 Northgate Pedestrian and Bicycle New Facility N 100th St 1st Ave NE TRL 0.27 2020
Bridge
27 Northgate Light Rail Station 1st Ave NE NE 100th St NE 103rd St TRL 0.13 2020
Corridor - Segment 2
28 Greenwood Ave N PBL* Greenwood Ave N N 77th St N 100th St PBL 1.15 2020
29 Northgate Light Rail Station 1st Ave NE NE Northgate Way N 117th St PBL 0.45 2020
Corridor - Segment 4
30 NW Market St 2020 Paving*/*** 32nd Ave NW / NW 54th St / 32nd Ave NW / NW 24th Ave NW BL 0.60 2020
NW Market St Market St
31 Northgate Light Rail Connection NE 103rd St 1st Ave NE 20th Ave NE NGW 1.25 2019-2020
NGW*
*These projects were not included in the 2016-2020 Implementation Plan and are new to this year's plan.
**Target year is year of completion.
***This project will be coordinated with Project #6, Burke-Gilman Trail Missing Link.NORTH SECTOR PROJECT LIST (CONTINUED)
Facility Facility Target
Project # Project Name On Street From Street To Street Type Mileage Year**
2021
32 N 130th St 2021 Paving* N 130th St 1st Ave NW 5th Ave NE PBL 1.62 2021
33 Montlake Blvd NE PBL* Montlake Blvd E / Montlake NE Pacific Pl E Roanoke St PBL 0.57 2021
Blvd NE
34 Ballard NGW - Western Segment NW 83rd St / NW 77th St Loyal Way NW Fremont Ave N NGW 2.81 2020-2021
35 Pinehurst NGW* 25th Ave NE / NE 115th St NE 125th St 15th Ave NE NGW 1.00 2021
36 NGW Connections (2018-2021)* Various Various Various NGW 1.33 2018-2021
37 Market / 45th Transit Improvement NE 45th St 4th Ave NE Brooklyn Ave NE TBD 0.46 2021
Area*
Northern
Facility 2021 5-year Mileage
Type 2017 Mileage 2018 Mileage 2019 Mileage 2020 Mileage Mileage Totals Total
TRL 0 1.42 0.38 0.78 0 2.58 34.36
PBL 0.38 5.03 3.5 1.6 2.19 12.7
BL 0.57 1.6 1.12 0.6 0 3.89
NGW 2.95 3.58 0.25 1.25 5.14 13.17
Facility 0 1.56 0 0 0.46 2.02
TBD
*These projects were not included in the 2016-2020 Implementation Plan and are new to this year's plan.
**Target year is year of completion.
SEATTLE BICYCLE MASTER PLAN IMPLEMENTATION PLAN 2017-2021 | 13CENTRAL SECTOR PROJECT MAP
09
Puget Sound E NE
30 20 BURK TR L AY
NW MARKET ST MAN W
07 GIL
13 NT
25TH AVE NE
14
35TH AVE NE
21 P OI
D
15TH AVE NW
NE 50TH ST SAN
PHINNEY AVE N
06 N 50TH ST
37
8TH AVE NW
11TH AVE NE
L
N 45TH ST NE 45TH ST
E
GI
N 46TH ST
AR
LM
NE
YW
AN
AY
AV
LVD
23
7TH AVE NE
E
N
STONE WAY N
BALLARD BR
15TH AVE NE
W
W
W EMERSON ST N 40TH ST
KE B
TRL
W
40 AN
LM
NI
T LA
CK NE P
AC
GI
FREMONT AVE N
ER 11 IFI
SON C
KE
MO N
W DRAVUS ST ST S
T
B UR
N 34
TH S T 33 38
34TH AVE W
AURORA BR
EW
3RD AVE W
14 | SEATTLE DEPARTMENT OF TRANSPORTATION
AV
15TH AVE W
KE
60
DY
Lake
Union
RN
50
O
EASTLAKE AVE E
TH
BLV
DE 39
72 55
24TH AVE E
I E W
N
10TH AVE E
One Center City Planned Facilities
E
EV
QUEEN ANNE AVE N
DEXTER AVE N
VE
69
AURORA AVE N
K
LL
TAYLOR AVE N
47 YA 61
L ROY ST
IO
LA
E
15TH AVE E
67 53
TT
65 8T AV Lake Washington
H E 45
AV
72 42
E
AV 44
E 54
W
66 66 58
FAIRVIEW A
61
23RD AVE E
59 65 47
12TH AVE E
48 56
1ST AVE N
41 43 51 67 68 ST
72 4T N
56 H 58 59
7T
1S
T
3R 51 AV ISO
H
63 AV D E E PINE ST AD
8T
EM
AV
E AV 66
E
H
E
48 43
57 E UNION ST
23RD AVE
E PIKE ST
AV
AL 57
E
A 63 41 66 51
SK
A 46 52 51 56
AV 52 56
2N
E
D
9T
E CHERRY ST
12TH AVE
R
AV
46
E
HA
2N
E
AL
70 70
N
D
57
BO VE
9T
AV
AV
H
A SK
E
M L KING JR WAY
E
AV
AN
E
Elliott Bay
57 E YESLER WAY
W
62
49
62
YV
S JACKSON ST
ALKI 64 S DEARBORN ST
I NB
B
TRL
VI S
Legend 94 76
23RD AVE S
Miles
WY
Proposed 2017-2021 Projects 97
HA
SW
0 0.5 1 O
E
K AN
M OUNTAIN S T SOUND TRL
RB
4TH AVE S
Final route pending selection
S
AV
A
OR
KI
Existing Bike Facilities (Excluding Sharrows) 93
AL
AV
AL
50
1ST AVE S
ES
Study Areas
W
73
6TH AVE S
86
15TH AVE S
96
AIRPORT WAY SCENTRAL SECTOR PROJECT LIST
Facility Facility Target
Project # Project Name On Street From Street To Street Type Mileage Year**
2017***
38 520 Bridge Trail (WSDOT) SR-520 Bridge Montlake Blvd E City Limits TRL 2.18 2017
39 Washington Park Arboretum Loop New Facility Graham Visitor Center E Madison St TRL 1.20 2017
Trail (Seattle Parks Dept.)
40 Interbay Trail Connections 20th Ave W / Gilman Ave W Elliot Bay Trail 20th Ave W PBL 1.92 2017
41 One Center City - 2nd Ave PBL 2nd Ave Broad St Pike St PBL 0.83 2017
42 One Center City - 9th Ave N PBL 9th Ave N Westlake Ave N Harrison St PBL 0.35 2017
(Phase 1)
43 One Center City - 7th Ave PBL 7th Ave Westlake Ave Pike St PBL 0.33 2017
44 Roy St PBL Roy St Dexter Ave N 9th Ave N PBL 0.12 2017
45 Dexter Ave N PBL Dexter Ave N Mercer St Roy St PBL 0.06 2017
46 One Center City - 4th Ave BL 4th Ave Spring St Pike St BL 0.28 2017
(Phase 1)*
2018
47 One Center City - 9th Ave N PBL 9th Ave N Harrison St Denny Way PBL 0.24 2017-2018
(Phase 2)
48 Center City - 4th Ave BL (Phase 2)* 4th Ave Pike St Vine St BL 0.69 2018
49 Chinatown / International District- S King St / 7th Ave (N-S 5th Ave S 20th Pl S NGW 1.25 2018
Judkins Park NGW connection to S Dearborn
St)
50 Central Area NGW Connection* TBD TBD TBD NGW 0.50 2017-2018
2019
51 One Center City - Pike and/or Pine Pike St and/or Pine St 1st Ave Broadway PBL 2.00 2019
PBL*
52 One Center City - Spring Street BL Spring St 4th Ave 9th Ave BL 0.3 2019
53 Central Ridge NGW 16th Ave E / 18th Ave E / E Prospect St S King St NGW 2.69 2018-2019
20th Pl S
*These projects were not included in the 2016-2020 Implementation Plan and are new to this year's plan.
**Target year is year of completion.
***Western Ave from University St to Virginia St (0.34 miles) was completed in 2017. It is listed under Quick Wins on p. 9.
SEATTLE BICYCLE MASTER PLAN IMPLEMENTATION PLAN 2017-2021 | 15CENTRAL SECTOR PROJECT LIST (CONTINUED)
Facility Facility Target
Project # Project Name On Street From Street To Street Type Mileage Year**
2019 (Continued)
54 Lowell-Meany Schools NGW E Roy St / 11th Ave E / 13th 11th Ave E 21st Ave E NGW 0.79 2019
Connection Ave E / E Republican St /
E Harrison St
55 Lake Washington Loop NGW - 26th Ave E / E Harrison St 37th Ave E Boyer Ave E NGW 1.20 2018-2019
Phase 1 (Southern segment)*
56 Madison RapidRide (G Line) E Union St from University TBD TBD TBD TBD 2019
Complementary Route* / Boylston to 27th or 29th
Ave. Full Complementary
Route TBD, will not be on
E Madison St
16 | SEATTLE DEPARTMENT OF TRANSPORTATION
57 One Center City - 4th or 4th / 5th 4th Ave / 5th Ave Vine St Main St PBL TBD 2019
PBL*
58 One Center City - 8th Ave PBL* 8th Ave Pike St Bell St PBL TBD 2019
2020
59 Melrose Promenade - PBL portion Melrose Ave / Minor Ave University St E Denny Way PBL 0.49 2020
60 Lake Washington Loop NGW - 26th Ave E Boyer Ave E E Shelby St NGW 1.00 2019-2020
Phase 2 (Northern leg)
61 Melrose Promenade - NGW Melrose Ave E E Denny Way E Roy St NGW 0.47 2020
portion
62 One Center City - Yesler Way PBL Yesler Way Alaskan Way E/s of I-5 PBL TBD 2020
63 One Center City - Alaskan Way Alaskan Way Virginia St Elliot Bay Trail PBL TBD 2020
PBL
64 One Center City - South End 2nd Ave Ext S / S Main St / S Washington St S Dearborn St PBL TBD 2020
Connection PBL* 5th Ave S / S King St / 6th
Ave S
65 One Center City - Broad Street Broad St Elliot Bay Trail 5th Ave PBL TBD 2020
PBL
66 One Center City - Bell and/or Bell St and/or Blanchard St 2nd Ave 8th Ave / 9th Ave PBL TBD 2020
Blanchard PBL*
67 One Center City - Vine Street* Vine St / Taylor Ave / Taylor 2nd Ave Thomas St TBD TBD 2020
Ave N
*These projects were not included in the 2016-2020 Implementation Plan and are new to this year's plan.
**Target year is year of completion.CENTRAL SECTOR PROJECT LIST (CONTINUED)
Facility Facility Target
Project # Project Name On Street From Street To Street Type Mileage Year**
2021
68 First Hill Streetcar: Broadway Broadway / 10th Ave E E Denny Way E Aloha St PBL 0.57 2021
Extension
69 Valley Street PBL Valley St 9th Ave N Fairview Ave N PBL 0.25 2021
70 Central Waterfront (Alaskan Way Alaskan Way S King St Virginia St PBL 0.90 2021
Viaduct Replacement)
71 NGW Connections (2018-2021)* Various Various Various NGW 1.33 2018-2021
72 Roosevelt RapidRide TBD TBD TBD TBD TBD 2021
Central
Facility 5-year Mileage
Type 2017 2018 2019 2020 2021 Totals Total
TRL 3.38 0 0 0 0 3.38 21.94
PBL 3.61 0.24 2 0.49 1.72 8.06
BL 0.28 0.69 0.3 0 0 1.27
NGW 0 1.75 4.68 1.47 1.33 9.23
Facility 0 0 0 0 0 0
TBD
*These projects were not included in the 2016-2020 Implementation Plan and are new to this year's plan.
**Target year is year of completion.
SEATTLE BICYCLE MASTER PLAN IMPLEMENTATION PLAN 2017-2021 | 17SOUTH SECTOR PROJECT MAP
S JACKSON
57 57 ST
70
Elliott Bay Lake Washington
49
64
53
94 76
INS TO SOUND TRL
M OUNTA
H
4TH AVE S
SW
AR
93
E
BO
AV
R
73B
1ST AVE S
KI
50
AV
AL
ES
W
M L KING JR W
86
SW
AY S
KI
6TH AVE S
AL
AD
15TH AVE S
L
M
TR W
X
IR
23RD AVE S
81 96
AL
ALASKAN WY VI SB
88
W
WEST SEATTLE BR EB
AY
WEST SEATTLE BR WB
BEAC
83 97
89 90
73A
18 | SEATTLE DEPARTMENT OF TRANSPORTATION
ON AV
W ES T M
M
79
CALIFORNIA AVE SW
CH S GENESEE ST
AR
ES
LK
IE
F
77
IN
BE
Duw
SE
SW ALASKA ST
GINA
AL
AC
GJ
D
78
ami
TH
H
sh
TR
UW
RW
L WA
L
DR
R
WI
AM
Wat
S LUCILE ST
SW
LS
Y SW
WA
ISH
erw
ON
BEAC
YS
Puget Sound 80
ay
S ORCAS ST
ES
AV
35TH AVE SW
E
DELRIDGE WAY SW
S
87
RIVER
ON E R
CH
S GRAHAM ST
ON AV
IE F
SW
TR L
I
AVE S
SE
FT
91
CORS
AI
EA
R
AL
SY L
AV
P
ST
VA
M
TH
85
OR
SW
N
W AR
MLK
1ST AV S BR SB
TR
TW
AY GI
L
S W
NA
L 75
E S AY S
W 82
ING JR
AY
S
16TH AVE SW
ER
SR509 SB
CH
SEWARD PA RK AVE
WAY S
FAUNTLEROY WAY
IEF
S
SW THISTLE ST 74
SE
S CLOVERDALE ST
A
9TH AVE SW
84
LTH
SR5
09
SW BARTON ST
TRL
92
RA
RE
NB
IN
I
N
SW ROXBURY ST TO
ER
N
AV
E
AV
E
S
Miles S
Legend
51ST AVE S
0 0.5 1
Proposed 2017-2021 Projects
S BANGOR ST
Final route pending selection
W
X Mt. Baker Light Rail Station
Existing Bike Facilities (Excluding Sharrows)
Study AreasSOUTH SECTOR PROJECT LIST
Facility Facility Target
Project # Project Name On Street From Street To Street Type Mileage Year**
2017
73A Rainier Valley NGW 30th Ave S / S Ferdinand St / S College St & 30th S Henderson St NGW 5.62 2017-2018
46th Ave S Ave S
74 Highland Park NGW Connection* SW Trenton St / 11th Ave SW 17th Ave SW 10th Ave SW NGW 0.52 2017
2018
73B Rainier Valley NGW & Trail 28th Ave S / S Atlantic St / Mountains to Sound S College St & TRL 0.63 2018-2019
Connection S College St Trail 30th Ave S
75 Swift Ave S / S Myrtle St / S Othello Swift Ave S / S Myrtle Pl / S Albro Pl ML King Jr Way S PBL 1.75 2018
St 2018 Paving S Othello St
76 S Dearborn St PBL S Dearborn St 6th Ave S Rainier Ave S PBL 0.69 2017-2018
77 S Columbian Way - Western S Columbian Way 15th Ave S ML King Jr Way S PBL 0.56 2018
Segment (PBL)*
78 S Columbian Way - Eastern S Columbian Way Beacon Ave S ML King Jr Way S PBL 0.55 2018
Segment (2018 Paving)
79 Fauntleroy Way SW Boulevard* Fauntleroy Way SW SW Alaska St 36th Ave SW PBL 0.29 2018
80 Wilson Ave S 2018 Paving Wilson Ave S S Dawson St Seward Park Ave S BL 0.81 2018
2019
81 SoDo Trail Extension SoDo Trail / E3 Busway S Forest St S Spokane St TRL 0.42 2018-2019
82 Chief Sealth Trail Connections* Various Various Various TRL 0.25 2019
83 SW Avalon Way 2019 Paving SW Avalon Way SW Spokane St SW Alaska St PBL 0.90 2019
84 S Henderson St / Seward Park Ave S Henderson St / Seward 50th Ave S Ithaca Pl S BL 0.66 2018-2019
S BL* Park Ave S / Rainier Ave S
85 West Seattle NGW 34th Ave SW SW Roxbury St S Edmunds St NGW 3.61 2018-2019
2020
86 S Lander Street Bridge* S Lander Street 1st Ave S 4th Ave S TRL 0.24 2020
87 Fauntleroy Way SW PBL Fauntleroy Way SW SW Morgan St SW Alaska St PBL 1.30 2020
88 S Spokane St 2020 Paving* S Spokane St 14th Ave S 19th Ave S BL 0.39 2020
89 15th Ave S 2020 Paving 15th Ave S S Nevada St S Bradford St BL 0.25 2020
90 Beacon Hill / Mt Baker NGW S Snoqualmie St / Cheasty 13th Ave S 34th Ave S NGW 2.02 2020
Blvd S / S Walden St
91 Delridge RapidRide (H Line) TBD TBD TBD TBD TBD 2020
*These projects were not included in the 2016-2020 Implementation Plan and are new to this year's plan.
SEATTLE BICYCLE MASTER PLAN IMPLEMENTATION PLAN 2017-2021 | 19
**Target year is year of completion.SOUTH SECTOR PROJECT LIST (CONTINUED)
Facility Facility Target
Project # Project Name On Street From Street To Street Type Mileage Year**
2021
92 SW Roxbury 2021 Paving* SW Roxbury St 35th Ave SW 16th Ave SW PBL 1.02 2021
93 Rainier Ave S Paving* Rainier Ave S S Dearborn St 23rd Ave S PBL 0.88 2020-2021
94 12th Ave S PBL 12th Ave S E Yesler Way S Charles St PBL 0.53 2020-2021
95 NGW Connections (2018-2021)* Various Various Various NGW 1.33 2018-2021
96 Accessible Mt Baker TBD TBD TBD TBD TBD 2021
97 Rainier RapidRide TBD TBD TBD TBD TBD 2021
Southern
Facility 5-year Mileage
20 | SEATTLE DEPARTMENT OF TRANSPORTATION
Type 2017 2018 2019 2020 2021 Totals Total
TRL 0 0 0.67 0.24 0 0.91 24.65
PBL 0 3.84 0.9 1.3 2.43 8.47
BL 0 0.81 0.66 0.64 0 2.11
NGW 6.2 0 3.61 2.02 1.33 13.16
Facility 0 0 0 0 0 0
TBD
*These projects were not included in the 2016-2020 Implementation Plan and are new to this year's plan.
**Target year is year of completion.
CITYWIDE 2017-2021 MILEAGE
Facility Type 2017 2018 2019 2020 2021 5-year Totals
TRL 3.38 2.05 1.05 1.02 0 7.50
PBL 3.99 9.11 6.4 3.39 6.34 29.23
BL 0.85 3.1 2.08 1.24 0 7.27
NGW 8.57 5.33 8.54 4.74 7.8 34.98
Facility TBD 0 1.56 0 0 0.46 2.02
This plan calls for 36.73 miles of trails/protected bike lanes and 34.98 miles of neighborhood greenways, which keeps us on track for
meeting Move Seattle 9-year goals.In addition, 6 neighborhood greenways will be
upgraded in 2017. Because they are existing
facilities and won’t add new mileage to the bike
network, they are listed separately below.
2017 NEIGHBORHOOD GREENWAY UPGRADES
Facility Length
Project Name On Street From Street To Street Type (miles)
17th Ave NE Neighborhood Spot Locations N/A N/A NGW N/A
Greenway Upgrade – Signs &
Markings
Central Area Neighborhood Spot Locations N/A N/A NGW N/A
Greenway Upgrade – Signs &
Speed Humps
Delridge East Neighborhood 26th Ave SW SW Andover St SW Graham St NGW N/A
Greenway Upgrade - Speed
Humps
Delridge West Neighborhood 16th Ave SW SW Kenyon St SW Webster St NGW N/A
Greenway Upgrade – Crossing
Improvements
Jackson Place Neighborhood S Dearborn St / Rainier Ave S S Norman St NGW N/A
Greenway Upgrade Hiawatcha Pl S
PhinneyWood Neighborhood Fremont Ave N N 77th St N 110th St NGW N/A
Greenway Upgrade - Safety &
Speed Humps
SEATTLE BICYCLE MASTER PLAN IMPLEMENTATION PLAN 2017-2021 | 216. COORDINATION PROJECTS UPDATE
Some of the projects that contribute to building an annual update through this report, while
out the all ages and abilities bicycle network additional information is available through the
involve multiple agencies and have multi-year individual project websites.
schedules. For these projects, we provide
Expected
Project Description Completion Date Bike Components Where to Learn More
SR-520 Bridge Replaces the SR-520 Montlake Phase: • 14-foot wide bicycle Email: SR520bridge@
Replacement and HOV floating bridge across 2022-2023 and pedestrian wsdot.wa.gov
Program Lake Washington and Portage Bay path across Lake Website: www.wsdot.
makes transit and Phase: 2026-2028 Washington (opening wa.gov/Projects/
roadway improvements Montlake Cut in 2017) and Portage SR520Bridge/
throughout the SR- Phase: 2027 Bay (Scheduled for
520 corridor from I-5 2028)
in Seattle to I-405 in • New bicycle/
Bellevue pedestrian crossings
over SR 520 and I-5
Accessible Mt. Baker Builds near-term 2021 - in • Potential protected Website: www.seattle.
access and safety conjunction with bike lanes on MLK Jr gov/transportation/
improvements at the Rainier RapidRide Way S, Rainier Ave S, accessibleMtBaker.
Mt. Baker Link light S McClellan St, and S htm
rail station, and builds Mt. Baker Blvd.
long-term multimodal • Potential
transportation neighborhood
enhancements greenways on S
Winthrop St, Cheasty
Blvd S and 25th Ave S
Burke-Gilman Trail Connects two existing 2018 1.4-mile multi-use trail Email: BGT_
Missing Link portions of the Burke- potentially on NW 45th MissingLink_Info@
Gilman Trail in Ballard St, Shilshole Ave NW, seattle.gov
to complete the regional and NW Market St. Website: www.seattle.
facility that otherwise gov/transportation/
runs continuously from BGT_Ballard.htm
Kenmore Park to Golden
Gardens
One Center City Builds near- and long- 2019-2035 Potential bike facilities Email: info@
term improvements on multiple north-south onecentercity.org
to the transportation and east-west streets in Website: http://
system and public realm the Center City (locations onecentercity.org/
in Seattle’s Center City to be determined)
neighborhoods
Waterfront Seattle Rebuild Seattle’s 2020+ A 2-way protected bike Email: info@
waterfront following the lane from S King St to waterfrontseattle.org
removal of the Alaskan Pine St Website: www.
Way Viaduct waterfrontseattle.org/
22 | SEATTLE DEPARTMENT OF TRANSPORTATIONExpected
Project Description Completion Date Bike Components Where to Learn More
Northgate Pedestrian Build a new pedestrian 2020 • A new pedestrian and Email:
and Bicycle Bridge and bicycle bridge bicycle bridge over I-5 NorthgateBridge@
over I-5 to improve • A potential shared-use seattle.gov
connections within the path on the west side Website: www.seattle.
Northgate community of 1st Ave NE between gov/transportation/
NE 92nd St and NE northgatepedbridge.
103rd St htm
• A potential shared-use
path on the east side
of 1st Ave NE between
NE 103rd St and NE
Northgate Way
RapidRide Expansion Build 7 new RapidRide 2019-2024 Potential improvements Email: RapidRide@
Program corridors throughout the to crossings, Seattle.gov
City neighborhood Website: www.seattle.
greenways, and bike gov/Transportation/
facilities RapidRideExpansion.
htm
SEATTLE BICYCLE MASTER PLAN IMPLEMENTATION PLAN 2017-2021 | 237. PROJECT DELIVERY:
TAKING PROJECTS FROM 1% DESIGN
TO 100% CONSTRUCTION
We rely on key tools and practices to develop PUBLIC ENGAGEMENT
and deliver our projects, including conducting a During the planning, design, and construction
Complete Streets review, applying the Race and phases of all our projects, we plan for inclusive
Social Justice Initiative equity toolkit, engaging public engagement and strive to balance varying
with community members, and evaluating needs presented by public comments that we
alternatives. The BMP identifies where bicycle receive at each step of our outreach processes.
facilities are needed and what facilities are
appropriate; our public engagement process SDOT has developed an effective public
focuses on soliciting community input to ensure engagement process built on gathering input
projects balance community interests. We describe from community members about their needs and
these tools here and combine them along with the concerns, presenting them with options that meet
guidance in the BMP to direct the Project Delivery project goals and objectives, and incorporating
Process laid out on the following page. their input along with our expertise and collected
data in selecting a design for a particular project.
COMPLETE STREETS POLICY
Bicycle facilities are an integral aspect of We also reach out to the public when we
Complete Streets. Established in 2012, the implement the strategies, actions, and programs
Complete Streets policy guides how we develop shown in Appendix 2, which include installing
projects to provide for all users of the roadway. bicycle parking, conducting education and
We use a checklist to help us review the needs of encouragement programs, and performing bike
other modes, relationships to land use, and the facility maintenance.
future vision for streets so that we can reflect
those needs in our project development. SDOT uses a wide variety of methods to reach
community members, including mailers,
RACE AND SOCIAL JUSTICE traditional open houses, drop-in events, online
INITIATIVE open houses and surveys, and taking information
The vision of the Seattle Race and Social Justice to regularly scheduled meetings and events of
Initiative is to eliminate racial inequity in the community-based organizations. We will continue
community. To do this requires ending individual working with the Seattle Bicycle Advisory Board
racism, institutional racism, and structural (SBAB) and the Department of Neighborhoods
racism. The Racial Equity Toolkit lays out a to strengthen our public engagement strategies
process and a set of questions to help evaluate and reach more members of the community in
and guide project and program development. This engaging ways.
toolkit was used as part of creating the BMP, and
is also used to evaluate individual projects.
24 | SEATTLE DEPARTMENT OF TRANSPORTATIONALTERNATIVES DEVELOPMENT AND
EVALUATION
The project development and delivery process
is outlined in the BMP and summarized in this
diagram:
Project selected through prioritization
1 process for implementation
Project development and design process:
- Data collection and technical analysis
- Initial public engagement
- Conceptual design alternatives
2 - More public engagement
Evaluate the project through the Race
and Social Justice Initiative toolkit
Preferred design selected
Assess maintenance needs
Further engage public and develop
Iterative Process
3 education materials to clearly explain
new designs
4 Pre-implementation marketing
5 Project implementation
Post-implementation
6 BIKE ROUTE MAP
encouragement programming to
publicize new facilities
7 Evaluate projects
8 Bicycle facility maintenance
Continue evaluation and
9 consideration for upgrades
The bicycle network recommended in the BMP envisioned in the plan. For example, the BMP may
was developed based on a robust methodology. recommend a protected bike lane on a particular
However, as projects move through the project street, but through our project development and
development process, our analysis, design, and outreach process, we may determine that an
community engagement may lead to a project alternate facility, such as a parallel neighborhood
being developed in a different way or location than greenway, would be preferable.
SEATTLE BICYCLE MASTER PLAN IMPLEMENTATION PLAN 2017-2021 | 258. FUNDING AND COSTS
FUNDING ASSUMPTIONS The funding assumptions include secured grants
The 2017-2021 Implementation Plan leverages as well as estimates for grants we will be seeking
the funding provided by the Levy to Move Seattle in the future. If we receive grant funding at a
with other local funds as well as existing and higher or lower amount, it will affect the number,
anticipated grant funding. Additionally, some type, extent, and features of the projects we can
of our larger capital projects, such as the construct. We will continue to partner with other
RapidRide projects, are required to deliver bicycle agencies and programs, and to seek additional
improvements where appropriate. This multi- grants and funding sources to meet the Move
layered funding approach allows us to maximize Seattle mileage goals.
the return on local public funding.
Funding assumptions for 2017-2021 BMP
The Levy to Move Seattle provides $65 million implementation are provided in the table on the
over nine years to build approximately 50 following page.
miles of protected bike lanes and 60 miles of
neighborhood greenways, and $7 million for
programs (including maintenance and bicycle
parking). On an annual basis, the levy provides
$8.0 million per year for BMP implementation,
which includes $7.2 million for facilities and
$0.8 million for programs. For 2017-2021, the
plan assumes that some of the money from 2021
would be allocated to 2017 and 2018, per the
City Council directive to accelerate bike facility
construction.
In 2017, in addition to the levy funds, we have $3.4
million in unspent funds from previous years, and
$1.3 million that was reallocated from Pronto
bikeshare.
26 | SEATTLE DEPARTMENT OF TRANSPORTATIONBIKE MASTER PLAN BUDGET
5-Year
Funding (Millions) 2017 2018 2019 2020 2021 Total
Local Carryforward1 4.4 M 0.0 M 0.0 M 0.0 M 2.2 M 4.4 M
Grant Carryforward1 5.9 M 5.9 M
Local Sources 2
10.2 M 13.2 M 9.2 M 9.2 M 7.2 M 49.0 M
Bike Share Transfer 1.3 M 1.3 M
Grants (Secured) 1.3 M 0.5 M 3.5 M 5.3 M
Grants (Assumed) 3
2.5 M 0.0 M 2.2 M 2.2 M 6.9 M
Total Funding 23.1 M 16.2 M 12.7 M 11.4 M 11.6 M 72.8 M
5-Year
Cost (Millions) 2017 2018 2019 2020 2021 Total
New Trails, Protected Bike Lanes, and 13.8 M 11.4 M 7.1 M 4.2 M 5.1 M 41.7 M
Bike Lanes
Neighborhood Greenways 6.1 M 2.7 M 4.3 M 2.4 M 3.9 M 19.3 M
Maintenance and Spot Improvements 1.8 M 1.0 M 1.0 M 1.0 M 1.0 M 5.8 M
Strategies and Actions 1.3 M 1.1 M 0.2 M 1.6 M 1.7 M 5.8 M
Total Cost 23.0 M 16.2 M 12.7 M 9.2 M 11.7 M 72.6 M
Running Budget Surplus/Shortfall 0.1 M 0.0 M 0.1 M 2.2 M 0.0 M 0.2 M
Any budget surplus carries forward to the next year.
1
2
Local sources include Vehicle Licensing Fees, Move Seattle Levy, Accelerated Move Seattle Levy, and Urban Trails and Bikeways
funding. Levy funding will vary year to year and project and mileage will be adjusted.
3
The budget assumes a placeholder amount for assumed grants based on what we typically receive, but acknowledges current
uncertainty in obtaining federal grants. If we receive grant funding at a higher or lower amount, this will affect the number, type,
extent, and features of the projects we can construct.
COST ASSUMPTIONS We are always looking for ways to deliver
To develop estimates for new projects, we use more with the available funds, and in 2017
data from recently completed projects and we will conduct a thorough review of internal
final estimates from projects about to begin and external costs, as well as research what
construction. Project costs vary greatly due to others have done to streamline and improve the
the wide range of designs (from paint and post to efficiency of project delivery.
fully raised and separated paths), site conditions
(working downtown or near steep slopes can For the 2017 projects in this plan, preliminary cost
increase costs), and whether the project can be estimates have been developed based on each
combined with other nearby projects. project’s individual characteristics. For the 2018-
2021 projects, we used a planning level per-mile
cost estimate of $750,000 for trails, protected
bike lanes, bike lanes, and undetermined facility
types, and $500,000 for neighborhood greenways.
SEATTLE BICYCLE MASTER PLAN IMPLEMENTATION PLAN 2017-2021 | 27CENTER CITY PROJECTS BL, 7th Ave PBL, 9th Ave N PBL, Spring Street Many of the projects in or near downtown BL, and two additional miles of PBL (which are are being developed in conjunction with the assigned to the Pike and/or Pine PBL at this time, One Center City project. For some of these but may change as the plan evolves). The One projects, the costs and funding sources are Center City projects with costs and funding to be still being developed, and will be added to the determined are: 4th and or 4th/5th PBL, 8th Ave implementation plan when they are available. The PBL, Alaskan Way PBL, Bell and/or Blanchard One Center City projects with costs and funding PBL, Broad St PBL, South End Connection PBL, included in this plan are: 2nd Ave PBL, 4th Ave Vine St (facility TBD), and Yesler Way PBL. 28 | SEATTLE DEPARTMENT OF TRANSPORTATION
APPENDIX 1: PERFORMANCE MEASURES

The 2014 Bicycle Master Plan includes                               annually or as the data is available to help track
performance measures to assess whether the                          interim progress. The table below includes
plan is meeting its goals. The measures are                         the BMP performance measures and progress
focused on assessing progress over the long-                        towards those targets based on the most recently
term, and data is collected and analyzed either                     available data.

                                         PERFORMANCE MEASURE TARGETS
        Goal        Performance Measure                 Performance Target                      Performance Result
    Ridership      Number of people biking Quadruple ridership                          2014-2015: 11.7% increase1
                   counted at locations    between 2014 and 2030                        2015-2016: 10.9% increase1
                   throughout Seattle
    Safety         Bicycle collision rate           Reduce bicycle collision            2014: 426 reported collisions
                                                    rate by half (50 percent)           2015: 469 reported collisions
                                                    between 2013 and 2030               2016: 407 reported collisions
                   Number of serious                Zero by 2030                        2013: 27 serious injuries;
                   injuries and fatalities                                              2 fatalites
                                                                                        2014: 29 serious injuries;
                                                                                        1 fatality2
                                                                                        2015: 24 serious injuries;
                                                                                        1 fatality2
                                                                                        2016: 26 serious injuries;
                                                                                        2 fatalities
    Connectivity Percentage of bicycle              100 percent of bicycle              2013: 22%
                 facility network                   system constructed by               2016: 28% (167/608 miles)
                 completed                          2035
    Equity         Areas lacking bicycle            Zero areas of City lacking          2012: 7 census tracts lacking
                   facilities                       bicycle facilities by 2030          bicycle facilities
                                                                                        2016: 7 census tracts lacking
                                                                                        bicycle facilities
    Livability     Percentage of                    100% of households in               2013: 34%
                   households within ¼              Seattle within ¼ mile of            2016: 49%
                   mile of an all ages and          an all ages and abilities
                   abilities bicycle facility       bicycle facility by 2035
1
 These percentages are based off of bike counts taken at 9 locations where reliable data was available for 2014, 2015, and 2016 for
at least six days of counts.

For comparison, national data (from 2015 and prior years) indicated a 12.2% increase in fatalities from 729 in 2014 to 818 in 2015.
2

At the same time, injuries declined 11.1% nationally, from 50,000 in 2014 to 45,000 in 2015. Source: USDOT NHTSA, March 2017.

                                                            SEATTLE BICYCLE MASTER PLAN IMPLEMENTATION PLAN 2017-2021 | 29
APPENDIX 2: STRATEGIES AND ACTIONS
The following strategies and actions are pulled
directly from the BMP. 2016 status is taken
directly from the 2016 implementation plan, and
2017 status provides a current update to each
strategy and activity.
BMP Strategy Action 2016 Status 2017 Status
4.1 – 4.6 Implement the See project lists for projects SDOT will work to meet targets. SDOT will continue
bicycle facilities to be studied, designed, and working to meet
implemented in 2017-2021. targets.
SDOT will continue to research
and incorporate best practices,
leverage other capital project
investments, and develop
educational tools.
4.7 Implement Bicycle facilities upgrade projects SDOT will work to meet targets. SDOT will continue
upgrades of existing will be identified through BMP working to meet
bicycle facilities project prioritization and through targets.
safety corridor projects. Refer to
strategy 7.3 and 7.13 for related
work.
4.8 Install bicycle SDOT will develop consistent SDOT has been recommending SDOT has been
detection at traffic bicycle detection standards by appropriate bicycle detection on implementing bicycle
signals in every new bicycle facility type, inventory a case-by-case basis, and may detection at traffic
bicycle facility, as existing detection start developing guidelines based signals on a case-
well as with all street on high priority bike facilities to on facility type and intersection by-case basis when
replacement projects determine upgrade needs, and geometry in 2016. Inventory will it develops a bicycle
develop a prioritized work plan for begin in 2016, if staffing allows for facility that crosses
implementation. this effort. a major street at a
signalized intersection.
4.10 Design all bicycle This is SDOT’s standard SDOT is currently updating the SDOT is currently
facilities to meet or practice. In addition, the update ROWIM, which include bicycle finishing the ROWIM,
exceed the latest of the Seattle Right-of-Way design guidelines. Director’s Rule which includes bicycle
federal, state and local Improvements Manual (ROWIM) expected by end of the year. design guidelines.
guidelines will include bicycle facility design
guidelines.
4.12 Integrate a SDOT has developed a right-of- The ROW allocation framework is Complete. The new
multimodal decision way (ROW) allocation framework, within the draft Comprehensive Comprehensive Plan
making process into a comprehensive methodology, to Plan Update for consideration of became effective on
the update of the determine the uses and functions adoption. November 28, 2016 and
Comprehensive Plan of corridors. includes ROW allocation
framework.
30 | SEATTLE DEPARTMENT OF TRANSPORTATIONBMP Strategy Action 2016 Status 2017 Status
5.1 Update the Seattle SDOT will work with DPD to review SDOT has provided comment Updates to the SMC
Municipal Code the existing language and identify to DPD/SDCI on land use code are currently under
(SMC) bicycle parking proposed changes. changes for bicycle parking. review process and will
requirements be submitted to City
Council at some point in
the future.
5.2 Develop a bicycle SDOT will develop a methodology Internal guidelines for private SDOT will be developing
parking to identify and prioritize high- bicycle rack installation in the an illustrated guide to
implementation demand locations for bicycle public Right-of-Way are being bicycle parking in order
program parking in 2015, and will complete developed and a CAM will be to provide clearer and
a Client Assistance Memo (CAM) developed later in 2016. more direct assistance
for installation of private bicycle to business owners and
racks in the public right-of-way. developers that wish to
install bike parking in
the public right-of-way.
5.4 Develop a process Abandoned bicycles that are SDOT will continue to donate SDOT continues to
for abandonded tagged and removed by SDOT abandoned bicycles to BikeWorks. remove abandoned
bicycle removal with personnel are donated to No timeline exists for a bicycles from public
repurposing options BikeWorks. partnership with SPD to create a bicycle racks after
policy to donate abandoned bikes. issuing a 72 hour notice.
5.5 Provide short- and SDOT will partner with other Secured bicycle parking is SDOT continues to
long-term secure agencies to coordinate the incorporated in the Northgate monitor bicycle parking
bicycle parking at development of long-term secure and Judkins Park station designs. needs at existing
high-capacity transit bicycle parking. SDOT will continue to monitor and future stations,
stations, transit hubs, needs at existing stations, future including those in ST3,
and heavily-used bus stations in ST3, and the Seattle Seattle’s RapidRide
stops RapidRide expansion program. expansion program,
and other high capacity
transit locations.
SEATTLE BICYCLE MASTER PLAN IMPLEMENTATION PLAN 2017-2021 | 31BMP Strategy Action 2016 Status 2017 Status
6.1 Develop a bicycle SDOT will continue to build upon 1. SDOT is collaborating with 1. SDOT reached
safety program existing safety educational and Seattle Public Schools and every 3rd, 4th,
encouragement programs, and Cascade Bicycle Club to and 5th grade
create new programs. Towards develop a new pedestrian and physical education
this effort SDOT will: bicycle safety curriculum that class at Seattle
1. Provide bicycle education for will be implemented in all Public Schools in
primary school children public elementary schools. partnership with
2. Assess feasibility and cost of The curriculum program will Cascade Bicycle
including middle school and be implemented in all 72 Club, and plans to
high school roadway safety public K-5 and K-8 schools in continue to do so for
education (as part of the September 2016. the next seven years.
School Road Safety plan). 2. Pending the success of the 2. SDOT will assess
3. Collaborate with partners elementary school program program expansion
to develop, strengthen, and and funding availability, SDOT to middle school and
distribute existing “Bike 101” will expand the education high school classes.
materials to assist a wide program to middle and high 3. SDOT will continue
range of current and new school students in 2019. to publish an annual
riders 3. In 2016, SDOT will continue printed bike map and
4. Engage with Seattle Public to publish an updated bike distribute education
Schools to continue Safe map; a magazine similar to and encouragement
Routes to School parternships the 2015 pilot BikeLife; and materials when
for traffic safety education and education and encouragement projects such as
encouragement of walking and materials when projects such the Westlake and
biking to school. as the Eastlake and Roosevelt Roosevelt Protected
Protected Bicycle Lanes are Bicycle Lanes are
complete. complete.
4. SDOT will continue to 4. SDOT will continue
participate in the School Traffic to participate in the
Safety Committee, engage School Traffic Safety
with advocacy groups and Committee, engage
the Seattle Public Schools to with advocacy groups
promote walking and biking to and the Seattle
school. Public Schools to
encourage walking
and biking to school.
SDOT will research and assess The Washington State
the feasibility of laws requiring Senate and House
that all driver training and driver’s passed SB 5402 in 2017,
license renewal processes cover and it is expected to be
bicycle safety, traffic laws, and signed by the Governor
the consequences of unsafe in 2017. This bill would
travel behavior, and SDOT will create a new statewide
work with the state legislature on bicycle safety advisory
implementation. council, whose work
plan could include
driver education.
32 | SEATTLE DEPARTMENT OF TRANSPORTATIONBMP Strategy Action 2016 Status 2017 Status
6.2 Improve wayfinding SDOT will update the printed On track. SDOT continues to
and trip-planning bicycle map annually. annually release a
opportunities for people printed bicycle map.
on bicycles SDOT also releases
bicycle-related data
to the public via data.
seattle.gov, and is
exploring more options
to enhance public data
availability.
6.4 Support economic SDOT will attend and support SDOT will continue to attend and SDOT will continue to
and community events with similar mission support events such as Summer attend and support
development through and focus that encourage Parkways, Bicycle Sundays, events such as Summer
bicycle related neighborhood-level active Kidical Mass, and the SR-520 Parkways, Bicycle
activities transportation. bicycle ride. Sundays, Kidical Mass,
and other bicycle
related activities.
SDOT will continue to work with In 2016 and 2017, 97 bike racks will SDOT has installed
CTR employers and TMP plans be installed at locations outside public bike racks at
to provide bicycle workshops, Center City adjacent to CTR all feasible CTR and
co-sponsor the second Annual employer locations or buildings TMP locations, and will
Employer Bike Summit, and with Transportation Management continue to conduct
promote the 2016 Bike Commute Program requirements. This bicycle commuter
Challenge. will program will result in public workshops and other
bike racks outside all CTR and programs.
TMP locations. Ten more bicycle
commuter workshops will be
conducted in 2016 and then again
in 2017 (by Commute Seattle).
7.1 and 7.2 Develop and SDOT has a well-developed SDOT will continue to conduct SDOT continues to make
strengthen procedures evaluation, design and public datadriven planning processes, data-driven decisions,
and processes for engagement process for collecting quantitative “before” collecting quantitative
bicycle project delivery neighborhood greenways. In 2016, data and administering perception "before and after" data
SDOT will continue to use and surveys as funding allows. for our projects. We
refine this process, and will adapt are also improving our
it for other projects types such as SDOT will continue to support Program & Project
protected bicycle lanes. In PARKing day type of temporary Management processes,
addition, SDOT will: installation of bicycle facilities. which includes things
• Allow temporary like improved cost
implementation of bicycle estimating tools,
facilities and streamlining our
delivery and contracting
methods. These
improvements are
expected to result in
quicker implementation
of bicycle projects and
reduced costs.
SEATTLE BICYCLE MASTER PLAN IMPLEMENTATION PLAN 2017-2021 | 33You can also read