Results for FY17
8 August 2017
←
→
Page content transcription
If your browser does not render page correctly, please read the page content below

Results for FY17 8 August 2017
Disclaimer and basis of preparation

This publication is prepared by the Transurban Group comprising Transurban Holdings Limited (ACN 098 143 429), Transurban Holding Trust (ARSN 098 807
419) and Transurban International Limited (ACN 121 746 825). The responsible entity of Transurban Holding Trust is Transurban Infrastructure Management
Limited (ACN 098 147 678) (AFSL 246 585). No representation or warranty is made as to the accuracy, completeness or correctness of the information
contained in this publication. To the maximum extent permitted by law, none of the Transurban Group, its Directors, employees or agents or any other person,
accept any liability for any loss arising from or in connection with this publication including, without limitation, any liability arising from fault or negligence, or
make any representations or warranties regarding, and take no responsibility for, any part of this publication and make no representation or warranty, express
or implied, as to the currency, accuracy, reliability, or completeness of information in this publication. The information in this publication does not take into
account individual investment and financial circumstances and is not intended in any way to influence a person dealing with a financial product, nor provide
financial advice. It does not constitute an offer to subscribe for securities in the Transurban Group. Any person intending to deal in Transurban Group securities
is recommended to obtain professional advice.

UNITED STATES OF AMERICA
These materials do not constitute an offer of securities for sale in the United States of America, and the securities referred to in these materials have not been
and will not be registered under the United States Securities Act of 1933, as amended, and may not be offered or sold in the United States absent registration
or an exemption from registration.
© Copyright Transurban Limited ABN 96 098 143 410. All rights reserved. No part of this publication may be reproduced, stored in a retrieval system, or
transmitted in any form or by any means, electronic, mechanical, photocopying, recording or otherwise, without the written permission of the Transurban
Group.

BASIS OF PREPARATION
This document includes the presentation of results on a statutory as well as non-statutory basis. The non-statutory basis includes Proportional Results and
Free Cash. Numbers in this presentation are prepared on a proportional basis unless specifically referred to as statutory or total. All financial results are
presented in AUD unless otherwise stated. Data used for calculating percentage movements has been rounded to thousands. Refer to the Supplementary
Information for an explanation of terms used throughout the presentation.

TRANSURBAN FY17 RESULTS | 8 AUGUST 2017                                                                                                                                   2

Highlights
• FY18 distribution guidance of 56.0 cps; growth of 8.7%
                                                                                                                             TOLL REVENUE
  over 51.5 cps in FY17                                                                                                      GROWTH                          EBITDA
• Networks delivered average traffic growth of                                      4.0%2                                                                    GROWTH1

• Continued focus on customer experience:
   – Technology upgrades improving access to information
     and providing additional account options
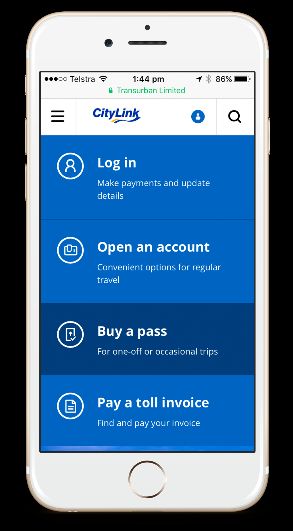
   – Enhanced digital platforms—websites and apps
                                                                                                                             10.6% 10.1%
   – Access to programs like the Hardship policy and First-                                                                       ADT                        FY18 DISTRIBUTION
                                                                                                                                  GROWTH2                    GUIDANCE
     time Forgiveness
• $9 billion3 development pipeline; all projects under
  construction are on time and on budget
• Continued to refinance existing term bank debt into long
  term capital markets debt
                                                                                                                                 4.0% 56.0¢
• CityLink CAV trials to commence in August 2017; new 95
  and 495 Express Lanes trials are to begin mid-2018
• Ongoing investment in network development, customer
  initiatives and technology platforms
1. EBITDA growth excludes significant items in FY16.
2. AirportlinkM7 was acquired on 1 April 2016 and has been included since this date for calculation purposes. Excluding AirportlinkM7, ADT increased 1.7%.
3. Projects committed or in exclusive negotiations. Estimated spend reflects 100% of total project cost, not Transurban’s share.

TRANSURBAN FY17 RESULTS | 8 AUGUST 2017                                                                                                                                          3
Strategy To be the partner of choice with governments providing effective and innovative urban road infrastructure and services utilising core capabilities Network Community Development Technology Operations Customer planning / engagement / delivery management forecasting TRANSURBAN FY17 RESULTS | 8 AUGUST 2017 4
FY17 network performance
                                                                                                                            TOLL REVENUE         ADT   TOLL REVENUE     EBITDA
     NETWORK              HIGHLIGHTS                                                                                        CONTRIBUTION      GROWTH        GROWTH     GROWTH

     Sydney              • Ongoing network growth from cars and large vehicles
                         • M2 traffic impacted by NCX construction works
                                                                                                                                     40.5%    3.4%         9.2%       10.2%
                         • Weekend and public holiday traffic growth of 4.7%

     Melbourne           • Disruption impacts from major CTW works continued
                         • Opened approximately 35% of new capacity associated with CTW
                         • CityLink HCV tolls moved to 3 times cars on 1 April 2017 as per
                           concession agreement
                                                                                                                                     31.9%   (1.0%)        4.1%       5.3%

     Brisbane1,2         • Traffic growth improving with large vehicle growth exceeding cars
                         • HCV multipliers will increase to 3 times cars on Clem7 and GBB
                           as of 1 July 2018 and on Legacy Way as of 1 July 20203                                                    17.9%   15.0%       22.9%        97.1%
                         • Legacy Way car, motorcycle and LCV tolls increasing by 7.8% on
                           1 July 2020

     Greater             • Ramp up continues with traffic and revenue growth
     Washington          • Traffic demand drove average dynamic toll price increases of 21% for
     Area4                 495 Express Lanes and 19% for 95 Express Lanes compared to pcp
                                                                                                                                     9.7%    12.8%       23.7%        39.2%
1.    Excluding Transurban Queensland integration and acquisition costs in FY16, EBITDA increased 22.9% (including AirportlinkM7).
2.    Excluding AirportlinkM7, ADT increased 2.3%, toll revenue increased 6.3% and EBITDA increased 4.9%.
3.    Subject to State Government approval.
4.    Toll revenue growth and EBITDA growth are calculated in USD.

TRANSURBAN FY17 RESULTS | 8 AUGUST 2017                                                                                                                                          5
$9 billion development pipeline1
FY18 FY19 FY20 FY21 FY22
COMMITTED
CITYLINK TULLA WIDENING Melbourne ($1.0 billion)
PROJECTS
UNDER CONSTRUCTION2
WEBB DOCK ACCESS4 Melbourne
95 EXPRESS LANES SOUTHERN EXTENSION GWA (US$25 million)
INNER CITY BYPASS Brisbane ($37.5 million)
MONASH FREEWAY UPGRADE4 Melbourne
LOGAN ENHANCEMENT PROJECT Brisbane ($320 million)
395 EXPRESS LANES GWA (US$475 million)
NORTHCONNEX Sydney ($1.3 billion)
EXCLUSIVE
NEGOTIATIONS2,3
WEST GATE TUNNEL PROJECT Melbourne ($3.5 - $4.0 billion)4
95 EXPRESS LANES FREDERICKSBURG EXTENSION PROJECT5 GWA
TRANSURBAN ESTIMATED ANNUAL
CAPITAL CONTRIBUTION2,5
$1.8B $1.5B $1.3B $0.8B $0.3B
1. Projects committed or in exclusive negotiations. Estimated spend reflects 100% of the total project cost, not Transurban’s share.
2. Estimated spend reflects Transurban’s proportion of the total project cost, net of government contribution.
3. Final funding requirement subject to confirmation of project scope and/or competitive procurement process and extent of government funding.
4. West Gate Tunnel Project (formerly Western Distributor Project) cost to Transurban of $3.5 – $4.0 billion (inclusive of Webb Dock Access and Monash Freeway Upgrade).
5. The 95 Express Lanes Fredericksburg Extension Project has not been included in Transurban’s estimated annual capital contribution as it is still in early negotiations. Project completion expected FY23.
TRANSURBAN FY17 RESULTS | 8 AUGUST 2017 6Funding growth opportunities
Positioned to fund growth opportunities
Potential project timing
• Committed projects funded from existing balance sheet Expected project
completion date
• Equity issuances may be required for West Gate
Tunnel Project and potential M&A (e.g. WestConnex) West Gate Tunnel Project
• Equity partnerships expected for bidding on
WestConnex to support capital requirements
WestConnex
Clear capital strategy in place
• Maintain strong investment grade credit metrics CTW ICB 395
• Raised $5.3 billion of equity since 2009 to support
major growth initiatives 951 LEP NCX 952
• Raised $4.6 billion of debt in FY17
FY18 FY19 FY20 FY21 FY22 FY23
Growing distributions and creating long term value
• Traffic, price, operational efficiencies and development Capital requirements supported by increases in cash flow from
completion of development projects and ongoing growth of existing
assets
1. 95 Express Lanes Southern Extension.
2. 95 Express Lanes Fredericksburg Extension.
TRANSURBAN FY17 RESULTS | 8 AUGUST 2017 7Investment discipline
Valuation discipline Applying discipline
• Alignment of interest as long-term owner-operator Discipline demonstrated in both project selection
and valuation approach when participating in bidding
• Through-the-cycle approach to assumptions processes
• Commitment to clearly defined investment hurdles
• Traffic forecasting and investment return
– I-66 Express Lanes—Transurban bid was
Internal capability informing decisions US$500 million—US$1.1 billion less than
winning bid on US$3.5 billion project1
• Sector specialist focused solely on road network operation and
development • Limited competitive advantage (did not bid)
• Strategic data and IP accumulated over 18 years – Chicago Skyway
• Track record of prudent forecasts—experienced, multi-disciplinary team – Indiana Toll Road
• Operations and maintenance assumptions based on extensive experience
• Incumbent with pre-emptive rights (did not bid)
Leverage capabilities on current opportunities – Dulles Greenway (50% stake)
• Existing operations • Outside strategic geographies (did not bid)
• Customer focus – M6 Toll (Birmingham)
• Community engagement
• Technology development and application
1. Source: VDOT, “Overview of the Procurement and Project Milestones”,
• Proven partner with governments November 2016; Secretary of Transportation,“Transform66: Outside the Beltway
P3 Procurement Update”, November 2016.
TRANSURBAN FY17 RESULTS | 8 AUGUST 2017 8Listening to our stakeholders
Transurban continues to address issues relevant to stakeholders
Key focus areas: Employees
Community
• Empowering customer choice with improved access
to information of travel options and costs
• Better demonstrating value of toll roads
• Assisting people in financial hardship with their
infringement arrangements
• Improved information to assist customers to Customers
manage accounts and payments Government
• Educating customers to minimise avoidable fees
• Continue to enhance Transurban’s approach to
engaging communities around assets and projects
Business partners Investors
9
TRANSURBAN FY17 RESULTS | 8 AUGUST 2017Customer experience
Delivering an improved customer experience
New retail brand—supporting growth
• Digital:
‒ Smartphone apps released for CityLink and
Transurban Linkt; go via expected mid 2018 • Initial roll-out in NSW
‒ Improved websites • Replaced Roam Express
to reduce confusion over
• Proactive customer engagement: multiple brands
‒ Account notifications
• Supported by improved customer experience:
‒ Communicating value of using
our roads through travel-time savings ‒ New tagless product for casual toll road users
‒ Reduced setup costs for tag accounts and
• Future ready: more flexible top-up options
‒ Consumer trial for mobile GPS tolling ‒ Reduced retail fees
app underway in NSW;
market release expected late 2017 • Positive customer response:
‒ GPS tolling trials underway with large ‒ Customer demand for tagless product
commercial customers, leveraging in-vehicle
‒ Uptake of website features and self-service
telematics units
channels highest of all brands
TRANSURBAN FY17 RESULTS | 8 AUGUST 2017 10Delivering value to customers
Customers save more than 310,0001 hours of travel-time each workday on average
by choosing to use our roads in Sydney, Melbourne and Brisbane
Sydney A parent working in northern
Sandgate
Brisbane is running late to pick up
160,000
Road
their child from a child care centre
hours/workday1 AirportlinkM7 near their home in Eight Mile Plains,
Port of
Brisbane in Brisbane’s south. The centre
Route Motorway
charges $1 for every minute they are
Melbourne chosen
late. They take the Gateway
84,000 Motorway, save late fees and are
home with their family earlier
hours/workday1 Gateway
Untolled Motorway Estimated Estimated Saving in
alternate time saving toll late fees
Brisbane
70,000 Pacific
Motorway
30
min $4.47 $30
hours/workday1
1. Source: Average workday time savings. TomTom data (May 2017).
TRANSURBAN FY17 RESULTS | 8 AUGUST 2017 11Delivering value to customers1
Usage levels vary among customers. More than 50% of consumer account
customers pay $10 or less per month
54% 68% 93% 0.3%
of our consumer of our consumer of our consumer of our consumer
account customers account customers account customers account customers
pay pay pay pay
$10 $20 $100 $500
or less per month or less per month or less per month or more per month
the majority are
commercial operators
1. Australian consumer account customers.
TRANSURBAN FY17 RESULTS | 8 AUGUST 2017 12Commitment to sustainability
Recognition of Transurban’s approach Sustainability highlights
• Dow Jones Sustainability Index (DJSI): • Launched second Reconciliation Action Plan—“Innovate RAP”
– Recognised in DJSI World Leadership Index – Investigate transport mobility challenges faced by Aboriginal
– DJSI Asia Pacific Leadership Index recognition and Torres Strait Islander communities
for the 11th year – Engage employees in cultural learning opportunities
– Awarded DJSI Industry Mover Sustainability – Mentoring relationships and supporting continuing education
Award 2017 (Transport Infrastructure sector)
– Upcoming third and fourth stages—“Stretch” and “Elevate”
• FTSE4Good Index member for the 13th year
• Partnership with Landcare Australia to continue investing in
• ACSI rated as “Leading” for sustainability reporting and developing our communities
for the ninth year
• 2017 innovation grants to assist in the development of new
• Awarded WGEA “Employer of Choice for Gender road safety and intelligent road initiatives
Equality” for the third year
– Deakin University—barrier overlay to reduce risks to
• Equileap Diversity Award—top 20 company motorcyclists
globally for gender equality—one of six reporting – Imagine IM—graphene-based smart sensors
zero pay gap1
– University of Melbourne—intelligent speed-sensing
• CTW and GUN projects have each received an pavement-integrated LEDs
“Excellent” rating from ISCA
1. Zero pay gap defined as ≤3%. Transurban’s objective is a zero pay gap.
TRANSURBAN FY17 RESULTS | 8 AUGUST 2017 13Safety initiatives
As a part of our commitment to road safety we have partnered with Neuroscience Research Australia
(NeuRA) to launch the Transurban Road Safety Centre
• NeuRA is one of the world’s leading centres for neuroscience
research
• Studies practical injury prevention strategies using facilities
and equipment that simulate road accidents
• Initial research will focus on improving the safety of older drivers,
an important focus with an ageing population
• Future programs will be developed to assess the safety of:
– Motorcyclists—22% of serious casualties
– Young adults travelling in the rear seat and their interaction
with seatbelts
• Our ongoing partnership with NeuRA is expected to lead to
improvements in safety standards for all motorists
• The serious injury rate per 100 million vehicle km travelled
on Transurban’s roads is estimated to be up to 80% below
comparable state averages on the broader network1
1. Based on historical government data.
TRANSURBAN FY17 RESULTS | 8 AUGUST 2017 14Financial results
Statutory results

                                      FY16 ($M)               FY17 ($M)                    KEY DRIVERS

           Toll revenue                     1,870                   2,083                  Toll revenue
                                                                                           • $128 million increase from existing assets driven by traffic growth and toll price escalation
                  EBITDA                    1,248                   1,526
                                                                                           • $85 million increase from full year ownership of AirportlinkM7
                Net profit                       22                    209
                                                                                           EBITDA
                  EBITDA                    1,379                   1,526                  • $126 million increase from reduction in transaction and integration costs related to the acquisition
Excluding significant items1                                                                 of AirportlinkM7 in FY16
                                                                                           • $88 million increase from existing assets
               Net profit                      148                     209
Excluding significant items1                                                               • $64 million increase from full year ownership of AirportlinkM7

   FY17 distribution              Final distribution of 26.5 cps, including                Net profit
                                  3.5 cps fully franked component. FY17
                                  distribution of 51.5 cps including 7.0 cps               • Increase in EBITDA offset by higher net finance costs to fund development projects and higher
                                  fully franked component.                                   amortisation expense from full year of AirportlinkM7 ownership

1. FY16 significant items include stamp duty, transaction and integration costs associated with the acquisition of AirportlinkM7, and integration costs associated with TQ. TQ integration costs have not been treated
   as significant items in FY17 as they are not material to the Transurban Group results.
TRANSURBAN FY17 RESULTS | 8 AUGUST 2017                                                                                                                                                                                  16
Proportional results
FY16 ($M) FY17 ($M) % CHANGE KEY DRIVERS
Toll revenue 1,946 2,153 10.6% Toll revenue
• $154 million increase from existing assets driven by traffic growth and
Other revenue 60 58 (3.3)% toll price escalation
• $53 million increase from full year ownership of AirportlinkM7
Total revenue 2,006 2,211 10.2%
Total costs1 (526) (582) 10.6% Total costs
Excluding significant items
EBITDA1 • $13 million increase from full year ownership of AirportlinkM7
Excluding significant items
1,480 1,629 10.1%
• $43 million increase from existing assets
EBITDA 1,398 1,629 16.5%
EBITDA margin2 73.8% 73.7% (0.1)%
1. FY16 significant items include stamp duty, transaction and integration costs associated with the acquisition of AirportlinkM7, and integration costs associated with TQ. TQ integration costs have not been
treated as significant items in FY17 as they are not material to the Transurban Group results.
2. Group EBITDA margin excluding $3 million of TQ transaction and integration costs in FY17 is 73.8%.
TRANSURBAN FY17 RESULTS | 8 AUGUST 2017 17EBITDA movement
+10.1%
1,629
+7.4%
40
(4)
1,589
113
1,480
FY16 EBITDA1 Exisiting Foreign exchange FY17 existing AirportlinkM7 FY17 EBITDA
business growth business EBITDA
1. Excluding significant items.
TRANSURBAN FY17 RESULTS | 8 AUGUST 2017 18Network EBITDA margins
EBITDA MARGINS1
FY15 FY16 FY17
• FY17 EBITDA margin growth across all regions
Sydney 79.6% 79.7% 80.5%
• Group EBITDA margin impacted by higher proportion
of lower margin businesses (GWA and Brisbane)
Melbourne 85.0% 85.5% 86.5% contributing to overall business
Brisbane2 69.6% 69.6% 69.7%
GWA 43.4% 49.5% 55.8%
Group3 74.7% 73.8% 73.7%
1. Group EBITDA margins are calculated using total revenue and network EBITDA margins are calculated using toll revenue.
2. Brisbane EBITDA margin excluding $3 million of TQ transaction and integration costs in FY17 is 70.4%.
3. Group EBITDA margin excluding $3 million of TQ transaction and integration costs in FY17 is 73.8%.
TRANSURBAN FY17 RESULTS | 8 AUGUST 2017 19Cost movement
Cost increase to support strategic growth project opportunities, customer and technology initiatives,
and underlying business growth
+10.6%
582
+8.2% 13
(3)
569
26
0.5
19 Strategic growth projects
526 Business development and
bidding costs for new projects;
ongoing investment in
customer initiatives; ongoing
investment in technology
platforms
1
FY16 total costs Operations Maintenance Strategic Foreign exchange FY17 existing AirportlinkM7 FY17 total costs
growth projects business costs
1. FY16 costs excluding significant items.
TRANSURBAN FY17 RESULTS | 8 AUGUST 2017 20Free cash flow movement
+31.7%
FCF coverage
(58)
1,220
5 FCF coverage for
(1) FY17 is 115.7%;
174
excluding NWRG
capital release
Net finance costs FCF coverage is
99.2%
$58 million decrease due to timing of interest
38
payments from recent debt refinancings 1,055
77
NWRG
59 $174 million increase due to distributions from
926 Distributions NWRG. Capital release proceeds as per NCX
Development Agreement
$29 million contribution from M5 primarily
due to 2H16 deferred dividend paid in
1H17; $48 million growth from TQ1, ED and
NWRG
FY16 free EBITDA 100% Distributions AirportlinkM72 NWRG capital Net finance costs Working capital Maintenance FY17 free FY17 distribution
cash flow owned entities non-100 % release 100% owned cash flow
(cash impact) owned entities (cash impact)
1. Excluding AirportlinkM7.
2. AirportlinkM7 free cash flow contribution forms part of the TQ distribution. The AiportlinkM7 distribution is shown separately here.
TRANSURBAN FY17 RESULTS | 8 AUGUST 2017 21Balance sheet positioned for macro environment
Funding activities FY17 DEBT CAPITAL MARKET ISSUANCES (TOTAL $3.1B)
• Raised $3.1 billion1,2 of debt in a range of capital Market Tenor
markets including:
NOK Notes 18 Years
– USD 144A
CHF Notes 15 Years
– AUD domestic bonds 12 Years
USD 144A
– NOK and CHF notes 11 Years
US Private
– US Private Placements Placement 10 Years
AUD Notes
• $0.4 billion2 of corporate bank debt and $1.1 billion2 of 7 Years
asset level bank debt was raised to fund development 0 250 500 750 1,000 1,250 0 250 500 750 1,000 1,250
A$ MILLION A$ MILLION
activities and refinance existing debt
GROUP DEBT1 JUN 16 JUN 17
• Group weighted average maturity increased to 9 years
Group debt3 A$12,484M A$13,639M
• Debt maturities of $1,170 million due in FY18 Weighted average maturity4 8.7 years 9.0 years
Weighted average cost of AUD debt5 5.2% 4.9%
– $300 million has been refinanced
Weighted average cost of USD debt5 4.3% 4.3%
– $705 million will be refinanced Gearing6 33.3% 35.3%
– $165 million repaid from existing facilities FFO/Debt7 8.0% 8.6%
1. CAD, CHF, EUR, NOK and USD converted at the hedged rate where cross currency swaps are in place. 5. Proportional drawn debt exclusive of issued letters of credit.
USD debt is converted at the spot exchange rate ($0.7426 at 30 June 2016 and $0.7692 at 30 June 2017) 6. Proportional debt to enterprise value, exclusive of issued letters of credit. Security price was $11.99 at 30 June 2016 and
where no cross currency swaps are in place. $11.85 at 30 June 2017 with 2,036 million securities on issue at 30 June 2016 and 2,052 million securities on issue at 30
2. Debt calculated on the full facility basis. June 2017.
3. Proportional drawn debt inclusive of issued letters of credit. 7. Based on S&P methodology. The impact of AirportlinkM7 has been annualised. June 2016 FFO/Debt inclusive of tax benefit was
4. Full value of drawn debt. 8.6% (AirportlinkM7 annualised).
TRANSURBAN FY17 RESULTS | 8 AUGUST 2017 22Market update
Sydney network

TRANSURBAN FY17 RESULTS | 8 AUGUST 2017   24
Sydney network

  NorthConnex update                      Operations                       Potential future projects

  • Project currently on time and         • Commissioned ED                • Opportunities identified by
    on budget                               integrated variable speed        NSW Government:
                                            management and lane
  • 19 road headers in operation                                              ̶   NSW State Budget for
                                            control signal system—
                                                                                  2017–2018 announced
  • Nine of 21 km of tunnelling             improving traffic operations
                                                                                  $40 million in planning
    completed                               and incident management
                                                                                  funding for the F6, M9
  • First spoil delivered to              • Completed M2 Motorscapes              Outer Orbital and M12
    Hornsby Quarry in May 2017              public art and five hectare           motorways
                                            regeneration project
  • Focus on M2 integration                                                   ̶   Preferred route for
    works to minimise impact              • Commenced rollout of digital          Western Harbour Tunnel
    on M2 customers                         advertising signs on the M2           and Beaches Link
                                            Motorway                              announced
  • Funding source—M7 large
    vehicle multipliers reached           • Completed phase 1 of M7           ̶   Expected sale of
    3 times cars in January 2017            re-sheet works—phases 2               WestConnex to
                                            and 3 to be completed over            commence late 2017
                                            the next two years

TRANSURBAN FY17 RESULTS | 8 AUGUST 2017                                                                     25
Comparison between markets
• Australia has a smaller proportion of tolled motorways compared to many international markets
• New South Wales has fewer tolled kilometres than many American states
INTERNATIONAL COMPARISONS1 TOTAL TOLLED KM ACROSS AUSTRALIAN
AND AMERICAN STATES2
100% Louisiana 56
Victoria 61
90% Minnesota 63
Delaware 75
80% New Hampshire 76
Queensland 81
70% 99
New South Wales
60% West Virginia 140
Colorado 151
50% Maine 178
Virginia 179
40% Maryland 206
Massachusetts 231
30% Indiana 252
California 294
20% Kansas 380
10% Ohio 388
Illinois 475
- New Jersey 553
New York 632
Oklahoma 937
Pennsylvania 960
Texas 1,021
Florida 1,225
1. Toll road length as a percentage of total national motorway network. Source: ASECAP, Evaluation and future of road toll concessions, 2014; Transurban analysis based on government data.
2. Source: US Department of Transportation, Federal Highway Administration, Highway Statistics, 2015; Bureau of Infrastructure, Transport and Regional Economics, Yearbook, 2016.
26
TRANSURBAN FY17 RESULTS | 8 AUGUST 2017WestConnex
• NSW Government announced proposed sale of at least 51% of WestConnex:
– Process to commence with EOI late 2017
– Targeting transaction close in mid 2018
• Stage 1: 1A – M4 widening opened July 2017; 1B – M4 East under
construction, opening 2019
• Stage 2: King Georges Road Interchange Upgrade complete; new M5 under
construction; Sydney Gateway in planning phase
• Stage 3: M4-M5 link—concept design released in May:
– Environmental Impact Statement to be exhibited in late 2017
• Tolls to increase on 1 January each year by the greater of 4% or CPI, until
2040; tolls will escalate at CPI after 20401
Completed M4 widening – Stage 1A of WestConnex
– A maximum capped toll for entire WestConnex of $8.60 will apply1
STAGE ASSET OPEN TO TRAFFIC1 MAX TOLLS (2017)1
Stage 1A M4 Widening 2017 $4.56
Stage 1B M4 East 2019 $3.95
Stage 2 New M5 (incl. KGRIU) 2020 $6.19
Stage 2 M5 East 2020 $6.18
Stage 3 M4-M5 Link 2023 $6.50
1. WestConnex “Tolls for WestConnex stages” webpage – June 2017. Figures represent tolls for cars.
TRANSURBAN FY17 RESULTS | 8 AUGUST 2017 27Melbourne network TRANSURBAN FY17 RESULTS | 8 AUGUST 2017 28
Melbourne network

     West Gate Tunnel Project1                                CityLink Tulla Widening             CityLink operations

     • Total project cost                                     • Total project cost                • CityLink CAV trials to
       approximately $5.5 billion2                              approximately $1.3 billion3         commence in August 2017
     • CPB Contractors John                                   • CityLink upgrade to be              ̶   Researching how vehicles
       Holland Joint Venture                                    completed early 2018                    with partial automation
       selected as preferred                                                                            features interact with
                                                              • Construction proceeding on
       contractor                                                                                       motorway infrastructure
                                                                time and on budget—80%
     • Commercial close expected                                complete                            ̶   Testing infrastructure,
       by late 2017                                               ̶   35% of new capacity               regulation and community
        ̶   IAC report submitted to                                   already opened4                   preparedness for
            Minister for Planning by 23                                                                 introduction of CAVs
                                                              • Over 80,000 trees planted
            October                                                                                 ̶   Exploring consumer
                                                                to date
     • MFU approximately 50%                                                                            attitudes, behaviours and
                                                              • New community grants                    concerns
       complete
                                                                program and Landcare
     • Webb Dock Access                                         partnership launched
       approximately 75% complete

1.   Formerly known as the Western Distributor Project.
2.   Total project cost, subject to ongoing negotiations, inclusive of government contribution.
3.   Total project cost including Transurban and government works.
4.   Transurban section of works.
TRANSURBAN FY17 RESULTS | 8 AUGUST 2017                                                                                             29
West Gate Tunnel Project
THIS IS AN ILLUSTRATION FOR INDICATIVE PURPOSES ONLY, DOES NOT REFLECT SCALE
TRANSURBAN FY17 RESULTS | 8 AUGUST 2017 30West Gate Tunnel Project
Benefits of West Gate Key enhancements driven
Freight benefits Expected timeline
Tunnel Project by community engagement
• 70 km of new traffic lanes • 26 months of engagement: • Direct freeway access to the 2017
Port
• More reliable, safer and ̶ 5,700+ face-to-face
faster trips engagements ̶ 12-13 minutes travel-time Tender design released
savings from Princes Preferred D&C contractor
• By 2031: ̶ 100+ community
Freeway to Appleton appointed
information sessions
̶ Up to 67,000 vehicles Dock
using tunnels ̶ Community and technical Exhibit EES
̶ Bypassing up to 17 sets
reference group meetings
̶ 9,300 trucks off local of traffic lights
roads • Enhancements driven by
• Alternative route for
community engagement: EES submissions closed
̶ Up to 20 minutes travel- dangerous goods vehicles
(We are here)
time savings per trip ̶ Tunnel entry and exit
• Strengthening the West Gate
within West Gate
• Reduced reliance on West Freeway
Freeway and further from
Gate Bridge—benefits whole
existing homes ̶ Provides a heavy vehicle
of network
route between Port of
̶ Stricter noise standards
• Delivering $11 billion in Melbourne and M80 via Planning approvals
economic benefits ̶ New cycling and walking West Gate Tunnel
connections and open Construction commences
• Projected to create 6,000 2018
spaces
jobs
TRANSURBAN FY17 RESULTS | 8 AUGUST 2017 31Brisbane network TRANSURBAN FY17 RESULTS | 8 AUGUST 2017 32
Brisbane network

  Logan Enhancement Project                Inner City Bypass                   Operations and upgrades

  • Total project cost $512 million        • Major construction started in     • GLIDe on schedule for
                                             July 2017                           implementation by the end of
  • Construction underway                                                        2017. Enables customer
                                           • Transurban to manage delivery
  • Logan and Gateway HCV tolls              and assume operations of the
                                                                                 initiatives including:
    increasing post LEP (completion          ICB post-upgrade                    ̶   Digital self service channels
    expected mid-2019)
                                           • Project to be funded via:           ̶   Mobile apps
  • Design refinements to improve
    accessibility and reduce                 ̶   HCV multipliers increasing      ̶   Notice of Demand
    environmental footprint:                     to 3 times cars on Clem7            aggregation1
                                                 and GBB on 1 July 2018
      ̶   Freight: Wembley Road                  and on Legacy Way on          • GUN more than 50%
          interchange improvements               1 July 20201                    completed
      ̶   Commuter: Mt Lindesay              ̶   Legacy Way car, motorcycle    • Tunnel network O&M contract
          Highway interchange safety             and LCV tolls increasing by     executed and on boarding of
          improvements                           7.8% on 1 July 2020             first asset, Legacy Way,
                                                                                 completed
  • TQ to donate up to $2 million          • Construction completion
    towards Queensland’s first               expected mid-2018
    roadside regeneration project

1. Subject to State Government approval.

TRANSURBAN FY17 RESULTS | 8 AUGUST 2017                                                                              33
Greater Washington Area network TRANSURBAN FY17 RESULTS | 8 AUGUST 2017 34
Greater Washington Area network

                                          Southern extensions
  Operations                              to 95 Express Lanes                 Shifting landscape

  • New CAV trials to begin on 95         • Anticipated early completion in   • White House commitment to
    and 495 Express Lanes mid-              late 2017 on three km southern      infrastructure investment:
    2018, testing:                          extension of 95 Express Lanes
                                                                                ̶   US$200 billion of government
       ̶   Cooperative adaptive           • Fredericksburg Extension                funding proposed
           cruise control                   Project:
                                                                                ̶   Potential incentives to
       ̶   Automated lane changing            ̶   14 km extension south to          encourage private investment
           and traffic merging                    the Fredericksburg area           of US$800 billion
       ̶   Speed harmonisation and            ̶   Advanced development        • Focus on leveraging private
           direct vehicle interaction             framework agreed in June      capital
                                                  2017
  • Mobile tolling pilot program                                              • Considering asset recycling
                                              ̶   Preliminary engineering       program
  • Delivered first phase of next                 underway
    generation cloud-based back                                               • Top 10 largest public toll road
    office system                             ̶   Draft environmental study     agencies in US valued at more
                                                  expected late 2017            than US$260 billion
  •   Launched start-up challenge on
      innovative transportation ideas                                         • Project pipeline expected to be
                                                                                slow to develop due to political
                                                                                barriers

TRANSURBAN FY17 RESULTS | 8 AUGUST 2017                                                                            35
395 Express Lanes
Project summary Project funding
• 13 km extension of 95 Express • Total project cost US$475 million
Lanes, converting two high
occupancy vehicle lanes to three • US$251 million PABs
Express Lanes • US$45 million VTIB loans
• I-395 is the fourth most congested • US$179 million equity contribution
corridor in Washington DC area
• 600 new jobs during construction
• Early works began February 2017
• Financial close reached in July
2017
• Tolling commencement expected
late 2019
TRANSURBAN FY17 RESULTS | 8 AUGUST 2017 36Outlook
Distribution Continued Transurban Further Balance sheet CAV trials on
guidance of 56.0 investment in continues to work development positioned to CityLink; new CAV
cps—represents technology and with all stakeholders opportunities in fund growth trials on 95 and
8.7% growth customer to improve each market opportunities 495 Express Lanes
year-on-year experience outcomes
TRANSURBAN FY17 RESULTS | 8 AUGUST 2017 37Supplementary information 1 Detailed financials 2 Treasury 3 Corporate overview 4 Glossary
Supplementary information

1 Detailed financials
Traffic and revenue performance

                              JUN 17 QUARTER1                                                FY171
                      PROPORTIONAL                                         PROPORTIONAL
                                                            ADT                                                 ADT
                      TOLL REVENUE                                         TOLL REVENUE
                                                       % CHANGE                                            % CHANGE
                          % CHANGE                                             % CHANGE
       Sydney                       9.3%                      2.9%                       9.2%                      3.4%
 Melbourne                        10.0%                     (2.1%)                       4.1%                    (1.0%)
     Brisbane                       4.4%                      3.0%                     22.9%2                    15.0%3
        GWA4                      29.8%                      12.6%                     23.7%                     12.8%

1.   Compared to pcp.
2.   Transurban reached financial close on AirportlinkM7 on 1 April 2016. Toll revenue data prior to Transurban ownership is not included in the calculation. Excluding AirportlinkM7, toll revenue increased 6.3%.
3.   AirportlinkM7 has been included since 1 April 2016 date for calculation purposes. Excluding AirportlinkM7, ADT increased 2.3%.
4.   Toll revenue growth is calculated in USD.
TRANSURBAN FY17 RESULTS | 8 AUGUST 2017                                                                                                                                                                               40
Traffic and revenue data 1
JUN 16 JUN 17
ASSET QUARTER QUARTER % CHANGE FY16 FY17 % CHANGE
Sydney
M2 Total Toll Revenue ($M) $64 $71 11.2% $255 $277 8.6%
Average Daily Trips (‘000) 126 130 2.9% 125 129 3.3%
LCT Total Toll Revenue ($M) $23 $24 4.5% $89 $93 4.7%
Average Daily Trips (‘000) 87 90 3.1% 86 89 3.5%
CCT Total Toll Revenue ($M) $15 $16 5.3% $60 $63 5.5%
Average Daily Trips (‘000) 37 38 1.5% 37 38 1.8%
ED Total Toll Revenue ($M) $32 $34 7.4% $127 $135 6.1%
Average Daily Trips (‘000) 56 56 1.6% 55 56 1.6%
M72 Total Toll Revenue ($M) $90 $103 14.3% $340 $397 16.8%
Average Daily Trips (‘000) 179 185 3.4% 177 183 3.6%
M5 Total Toll Revenue ($M) $65 $69 6.6% $251 $271 8.1%
Average Daily Trips (‘000) 148 152 3.0% 144 151 4.4%
Melbourne
CityLink Total Toll Revenue ($M) $166 $183 10.0% $660 $687 4.1%
Average Daily Transactions (‘000) 820 803 (2.1%) 825 816 (1.0%)
1. Assets at 100%.
2. Average tolled trip length was 12.8 km for the quarter on Westlink M7.
TRANSURBAN FY17 RESULTS | 8 AUGUST 2017 41Traffic and revenue data 1
JUN 16 JUN 17
ASSET QUARTER QUARTER % CHANGE FY16 FY17 % CHANGE
Brisbane
Gateway Motorway Total Toll Revenue ($M) $53 $55 3.6% $211 $219 3.7%
Average Daily Trips (‘000) 114 115 0.5% 114 115 1.0%
Logan Motorway Total Toll Revenue ($M) $44 $46 5.7% $172 $183 6.0%
Average Daily Trips (‘000) 160 166 3.6% 159 164 3.2%
AirportlinkM72 Total Toll Revenue ($M) $27 $29 5.7% $27 $112 311.1%
Average Daily Trips (‘000) 56 59 6.0% 54 58 6.1%
Clem7 Total Toll Revenue ($M) $13 $14 5.2% $51 $53 5.4%
Average Daily Trips (‘000) 27 28 3.6% 27 28 4.1%
Legacy Way Total Toll Revenue ($M) $8 $9 17.8% $27 $36 33.4%
Average Daily Trips (‘000) 18 19 6.6% 18 18 4.1%
Go Between Bridge Total Toll Revenue ($M) $3 $3 (3.9%) $14 $13 (3.5%)
Average Daily Trips (‘000) 12 11 (3.4%) 12 11 (4.0%)
Greater Washington Area
95 Express Lanes Total Toll Revenue ($USD M) $21 $25 18.6% $71 $84 17.1%
Average Daily Trips (‘000) 50 54 8.0% 45 49 9.4%
495 Express Lanes Total Toll Revenue ($USD M) $16 $23 44.6% $56 $73 32.1%
Average Daily Trips (‘000) 43 51 18.0% 40 46 16.6%
1. Assets at 100%.
2. Transurban reached financial close on AirportlinkM7 on 1 April 2016. Toll revenue data prior to Transurban ownership is not included. FY16 ADT includes numbers prior to Transurban ownership and is shown for
comparison purposes.
TRANSURBAN FY17 RESULTS | 8 AUGUST 2017 42Proportional toll revenue by asset
OWNERSHIP JUN 17 QUARTER ($M) FY17 ($M)
100% PROPORTIONAL 100% PROPORTIONAL
M2 100.0% 71 71 277 277
LCT 100.0% 24 24 93 93
CCT 100.0% 16 16 63 63
ED 75.1% 34 26 135 101
M7 50.0% 103 52 397 199
M5 50.0% 69 35 271 136
CityLink 100.0% 183 183 687 687
Gateway Motorway 62.5% 55 34 219 137
Logan Motorway 62.5% 46 29 183 114
AirportlinkM7 62.5% 29 18 112 70
Clem7 62.5% 14 9 53 33
Legacy Way 62.5% 9 6 36 23
Go Between Bridge 62.5% 3 2 13 8
95 Express Lanes ($USD) 100.0% 25 25 84 84
495 Express Lanes ($USD) 100.0% 23 23 73 73
TRANSURBAN FY17 RESULTS | 8 AUGUST 2017 43Statutory results
FY16 ($M) FY17 ($M) % CHANGE
Toll revenue 1,870 2,083 11.4%
Construction revenue 282 592 109.9%
Other revenue 58 57 (1.7%)
Total revenue 2,210 2,732 23.6%
Employee benefit expense (149) (168) 12.8%
Road operating costs (309) (335) 8.4%
Construction costs (282) (592) 109.9%
Transaction and integration costs (131) (5) (96.2%)
Corporate/other expenses (91) (106) 16.5%
Total costs (962) (1,206) 25.4%
EBITDA 1,248 1,526 22.3%
Depreciation and amortisation (584) (628) 7.5%
Finance income 46 63 37.0%
Finance costs (774) (812) 4.9%
Net finance costs (728) (749) 2.9%
Share of equity accounted investments 17 25 47.1%
(Loss) / Profit before tax (47) 174 n.m.
Tax benefit 69 35 (49.3%)
Net profit 22 209 850.0%
TRANSURBAN FY17 RESULTS | 8 AUGUST 2017 44Proportional results
PROPORTIONAL EARNINGS
FY16 ($M) FY17 ($M) % CHANGE
Toll revenue 1,946 2,153 10.6%
Other revenue 60 58 (3.3%)
Total revenue 2,006 2,211 10.2%
Total costs (526) (582) 10.6%
EBITDA (excluding significant items) 1,480 1,629 10.1%
Significant items (82) - 100.0%
EBITDA 1,398 1,629 16.5%
RECONCILIATION OF STATUTORY EBITDA TO PROPORTIONAL EBITDA
FY16 ($M) FY17 ($M) % CHANGE
Statutory EBITDA 1,248 1,526 22.3%
Less: EBITDA attributable to non-controlling interest – ED (24) (25) 4.2%
Less: EBITDA attributable to non-controlling interest – TQ (82) (161) 96.3%
Add: M7 proportional EBITDA 145 168 15.9%
Add: M5 proportional EBITDA 111 121 9.0%
Proportional EBITDA 1,398 1,629 16.5%
TRANSURBAN FY17 RESULTS | 8 AUGUST 2017 45FY17 proportional result by asset
NET FINANCE INCOME TAX
TOLL OTHER COST (EXP) /
REVENUE REVENUE EBITDA D&A EXPENSE NPBT BENEFIT NPAT
OWNERSHIP ASSET ($M) ($M) ($M) ($M) ($M) ($M) ($M) ($M)
100.0% M2 277 3 236 (74) (32) 130 12 142
100.0% LCT 93 - 58 (21) (30) 7 (8) (1)
100.0% CCT 63 - 39 (24) (12) 3 - 3
75.1% ED 101 1 76 (39) (31) 6 8 14
100.0% Roam Tolling and Tollaust 3 20 4 (1) - 3 (1) 2
50.0% M71 199 2 168 (41) (98) 29 2 31
50.0% M5 136 5 121 (48) (23) 50 (25) 25
Sydney 872 31 702 (248) (226) 228 (12) 216
100.0% CityLink 687 22 594 (137) (24) 433 (119) 314
Melbourne 687 22 594 (137) (24) 433 (119) 314
62.5% Gateway Motorway 137 - 106 (45) (5) 56 (7) 49
62.5% Logan Motorway 114 - 81 (45) (9) 27 (4) 23
62.5% AirportlinkM7 70 - 52 (31) (22) (1) 2 1
62.5% Clem7 33 1 18 (10) (11) (3) 1 (2)
62.5% Legacy Way 23 - 6 (8) (3) (5) 5 -
62.5% Go Between Bridge 8 - 6 (2) (1) 3 (2) 1
62.5% TQ Corp - 1 (1) - (153) (154) 20 (134)
Brisbane 385 2 268 (141) (204) (77) 15 (62)
100.0% 495 Express Lanes 98 - 58 (22) (63) (27) - (27)
100.0% 95 Express Lanes 111 - 65 (14) (28) 23 - 23
100.0% GWA Corp2 - - (7) (4) (73) (84) 41 (43)
Greater Washington Area 209 - 116 (40) (164) (88) 41 (47)
Corporate and other - 3 (51) (55) (119) (225) 76 (149)
Transurban Group 2,153 58 1,629 (621) (737) 271 1 272
1. Includes NWRG’s corporate entities’ results.
2. Includes DRIVe.
TRANSURBAN FY17 RESULTS | 8 AUGUST 2017 46FY16 proportional result by asset
NET FINANCE INCOME TAX
TOLL OTHER COST (EXP) /
REVENUE REVENUE EBITDA D&A EXPENSE NPBT BENEFIT NPAT
OWNERSHIP ASSET ($M) ($M) ($M) ($M) ($M) ($M) ($M) ($M)
100.0% M2 255 3 213 (74) (50) 89 17 106
100.0% LCT 89 - 55 (23) (24) 8 3 11
100.0% CCT 60 - 39 (24) (13) 2 (1) 1
75.1% ED 95 - 69 (39) (31) (1) 8 7
100.0% Roam Tolling and Tollaust 5 18 5 (4) - 1 1 2
50.0% M71 170 2 145 (41) (72) 32 (6) 26
50.0% M5 125 5 111 (48) (24) 39 (22) 17
Sydney 799 28 637 (253) (214) 170 - 170
100.0% CityLink 660 21 564 (138) (26) 400 (82) 318
Melbourne 660 21 564 (138) (26) 400 (82) 318
62.5% Gateway Motorway 131 1 98 (46) (5) 47 (9) 38
62.5% Logan Motorway 108 1 80 (46) (10) 24 (10) 14
62.5% AirportlinkM73 17 - 12 (8) (8) (4) - (4)
62.5% Clem7 32 - 17 (10) (12) (5) (4) (9)
62.5% Legacy Way 17 - (3) (6) (1) (10) (18) (28)
62.5% Go Between Bridge 8 - 6 (2) (1) 3 (5) (2)
62.5% TQ Corp - 5 (74) - (132) (206) 59 (147)
Brisbane 313 7 136 (118) (169) (151) 13 (138)
100.0% 495 Express Lanes 76 - 37 (23) (64) (50) - (50)
100.0% 95 Express Lanes 98 - 53 (14) (28) 11 - 11
100.0% GWA Corp2 - - (4) - (142) (146) 31 (115)
Greater Washington Area 174 - 86 (37) (234) (185) 31 (154)
Corporate and other - 4 (25) (40) (70) (135) 69 (66)
Transurban Group 1,946 60 1,398 (586) (713) 99 31 130
1. Includes NWRG’s corporate entities’ results.
2. Includes DRIVe.
3. Financial close on AirportlinkM7 was reached on 1 April 2016.
TRANSURBAN FY17 RESULTS | 8 AUGUST 2017 47FY17 net finance costs paid
NON-CASH ITEMS
CONCESSION
PAYMENTS &
STATUTORY MAINTENANCE NET PROPORTIONAL
NET DEBT PROVISION INTEREST INTEREST INTEREST NET INTEREST
INTEREST FEES UNWIND CAPITALISATION ACCRUALS1 PAID PAID
CONTROLLED ENTITIES OWNERSHIP ($M) ($M) ($M) ($M) ($M) ($M) ($M)
CityLink 100.0% (24) - 5 - 1 (18) (18)
M2 100.0% (32) 1 4 - (1) (28) (28)
LCT 100.0% (30) - 11 - 2 (17) (17)
CCT 100.0% (12) 1 1 - (1) (11) (11)
ED 75.1% (41) 1 8 - 1 (31) (23)
495 Express Lanes 100.0% (63) 1 1 45 (0) (16) (16)
95 Express Lanes 100.0% (28) - 1 12 (2) (17) (17)
Transurban Queensland – External expense 62.5% (262) 19 30 - (7) (220) (138)
Transurban Queensland – SLN interest expense 62.5% (65) - - - - (65) (41)
Corporate – M5 TLN 100.0% 7 - - - 2 9 9
Corporate – NorthConnex SLN interest income 100.0% 36 - - (36) - - -
Corporate – TQ SLN interest income 100.0% 41 - - - - 41 41
Corporate – Other 100.0% (276) 30 - - (6) (252) (252)
Total controlled entities at 100% (749) 53 61 21 (11) (625) (511)
EQUITY OWNED ENTITIES
NWRG – External Interest 50.0% (125) 6 21 - 12 (86) (43)
NWRG – NorthConnex SLN interest expense 50.0% (71) - - 71 - - -
M5 – External Interest 50.0% (31) 1 1 - - (29) (14)
M5 – TLN interest expense 50.0% (14) - - - (4) (18) (9)
Total equity accounted investments at 100% (241) 7 22 71 8 (133) (66)
Proportional net finance costs (737) 49 59 57 (5) (577) (577)
1. Interest accrual movements due to the frequency of cash interest payments.
TRANSURBAN FY17 RESULTS | 8 AUGUST 2017 48FY16 net finance costs paid
NON-CASH ITEMS
CONCESSION
PAYMENTS &
STATUTORY MAINTENANCE NET PROPORTIONAL
NET DEBT PROVISION INTEREST INTEREST INTEREST NET INTEREST
INTEREST FEES UNWIND CAPITALISATION ACCRUALS1 PAID PAID
CONTROLLED ENTITIES OWNERSHIP ($M) ($M) ($M) ($M) ($M) ($M) ($M)
CityLink 100.0% (26) - 7 - 1 (18) (18)
M2 100.0% (50) 1 15 - 1 (33) (33)
LCT 100.0% (24) 1 13 - - (10) (10)
CCT 100.0% (13) 1 1 - - (11) (11)
ED 75.1% (41) 1 8 - - (32) (24)
95 Express Lanes 100.0% (28) - - 12 8 (8) (8)
495 Express Lanes 100.0% (64) 2 1 44 - (17) (17)
Transurban Queensland – External expense 62.5% (205) 3 28 - 12 (162) (101)
Transurban Queensland – SLN interest expense 62.5% (65) - - - - (65) (41)
Corporate – M5 TLN 100.0% 6 - - - - 6 6
Corporate – NorthConnex SLN interest income 100.0% 16 - - (16) - - -
Corporate – TQ SLN interest income 100.0% 41 - - - - 41 41
Corporate – Other 100.0% (275) 30 - - 42 (203) (203)
Total controlled entities at 100% (728) 39 73 40 64 (512) (419)
EQUITY OWNED ENTITIES
NWRG – External Interest2 50.0% (113) 3 28 - - (82) (41)
NWRG – NorthConnex SLN interest expense 50.0% (32) - - 32 - - -
M5 – External Interest 50.0% (34) - - - 2 (32) (17)
M5 – TLN interest expense 50.0% (13) - - - - (13) (6)
Total equity accounted investments at 100% (192) 3 28 32 2 (127) (64)
Proportional net finance costs (713) 39 75 56 61 (482) (482)
1. Interest accrual movements due to the frequency of cash interest payments.
2. FY16 net interest paid re-stated in NWRG – External Interest.
TRANSURBAN FY17 RESULTS | 8 AUGUST 2017 49Maintenance provision 1
MAINTENANCE EXPENSE MAINTENANCE CASH
2
RECOGNISED SPEND
FY16 ($M) FY17 ($M) FY16 ($M) FY17 ($M)
CityLink (17) (14) (15) (11)
M2 (6) (2) (4) (4)
LCT (8) (8) (8) (6)
CCT (6) (8) (3) (4)
ED (8) (7) (8) (7)
M7 (8) (10) (3) (13)
M5 (4) (4) - (1)
Gateway Motorway (11) (9) (3) (7)
Logan Motorway (7) (11) (10) (27)
AirportlinkM7 (1) (8) - -
Clem7 (5) (8) - (1)
Legacy Way (8) (4) - -
Go Between Bridge (1) (1) - -
495 Express Lanes (8) (10) (1) (1)
95 Express Lanes (11) (13) - (1)
1. Assets at 100%.
2. Tag purchases put through free cash reconciliation not included above - $6 million in FY17 and $4 million in FY16.
TRANSURBAN FY17 RESULTS | 8 AUGUST 2017 50Free cash calculation
FREE CASH CALCULATION SOURCE OF INFORMATION/EXPLANATION
Cash flows from operating activities Statutory Transurban Holdings Limited operating cash flow (includes cash inflow from M5 TLNs).
(refer Group Statutory accounts)
Add back transaction and integration costs related Transaction and integration related cash payments incurred on the acquisition of AirportlinkM7 in pcp.
to acquisitions (non-100% owned entities)
Add back payments for maintenance of intangible For statutory purposes payments for maintenance are classified as operating activities. For the calculation of
assets free cash Transurban removes these payments and replaces them with increases or decreases to the
maintenance provision recognised in the Statement of Comprehensive Income (see slide 52). This provides a
smoother representation of maintenance spend and reflects the incurrence of damage through the facilities use.
Less cash flow from operating activities from 100% of the operating cash flows of ED and TQ are included in the statutory results, however the distribution
consolidated non-100% owned entities received by Transurban from these entities better reflects the cash available for distribution to Transurban
security holders. The cash flows from operating activities are therefore eliminated and, where applicable,
replaced with distributions received.
Less allowance for maintenance of intangible Expenditure for maintenance of intangible assets is provided for over the period of the facilities’ use. The annual
assets for 100% owned assets charge to recognise this provision reflects the yearly damage to the facility requiring maintenance. Also includes
allowance for expenditure on electronic tags within 100% owned tolling businesses.
Adjust for distributions and interest received
from non-100% owned entities
ED distribution Cash distribution received from ED by Transurban.
M5 distribution and TLN interest Cash distribution received from M5 by Transurban and interest received on Transurban's long term loan to M5
(represents a portion of Transurban's ownership interest).
TQ distribution and shareholder loan note (SLN) Cash distribution received from TQ by Transurban and interest received on Transurban’s long term loan to TQ
interest (represents a portion of Transurban’s ownership interest).
NWRG distribution Cash distributions received from the NWRG by Transurban.
Free cash
TRANSURBAN FY17 RESULTS | 8 AUGUST 2017 51Free cash flow
RECONCILIATION OF STATUTORY CASH FLOW FROM OPERATING ACTIVITIES TO FREE CASH
FY16 ($M) FY17 ($M) FREE CASH FLOW FY16 FY17 % CHANGE
Cash flows from operating activities 910 837 Free cash $926M $1,220M 31.7%
Add back transaction and integration costs related to
23 113 Weighted average securities
acquisitions (non-100% owned entities) 1,978M 2,048M 3.5%
eligible for distribution2
Add back payments for maintenance of intangible assets 52 69
Less cash flow from operating activities from consolidated Free cash per security 46.8cps 59.6cps 27.4%
(284) (312)
non-100% owned entities1
Less allowance for maintenance of intangible assets
(60) (61)
for 100% owned assets
Adjust for distributions and interest received from
non-100% owned entities
ED distribution 44 55
M5 distribution and TLN interest 39 68
TQ distribution and SLN interest 108 161
NWRG distribution 94 290
Free cash 926 1,220
1. Consolidated cash flows from non-100% owned entities includes ED and TQ.
2. Weighted average calculation based on entitlement to distribution.
TRANSURBAN FY17 RESULTS | 8 AUGUST 2017 52Reconciliation of proportional EBITDA
to free cash
FY17 ($M) Comments
Proportional EBITDA 1,629 Refer to slide 45 for further detail
Proportional net finance costs paid (cash) (577) Refer to slides 48 and 49 for further detail
Add back proportional maintenance expense (non-100% owned assets) 37 Refer to slide 50 for further detail
Less proportional maintenance cash spend (non-100% owned assets) (40) Refer to slide 50 for further detail
M7 - Non-100% owned assets distribution 174 NWRG capital release proceeds
M5 - Non-100% owned assets distribution timing (12) M5 dividend deferral
Working capital 9 Working capital movement
M5—tax paid (26) Tax paid by M5
TQ debt funding of Logan pavement rectification
Other 26 and swap terminations
Free Cash 1,220
TRANSURBAN FY17 RESULTS | 8 AUGUST 2017 53Supplementary information 2 Treasury
Funding structure at 30 June 2017
                                                                                                                                                Transurban3

                                                                                                                                                BBB+/Baa1/A-

                                                                                                     Non-
                                                                                                                                                                                          Corporate
                                                                                                   Recourse

                                              Sydney                                                                 Brisbane                                    GWA

                                                                                                                                                                                                      Working
                                                                                                                                                                                          AMTN        capital2
                                                        ED3                                                                       Airportlink          495 Express       95 Express       A$0.3B
     M2              LCT               CCT                                 M73               M53                TQ                                                                                    A$0.9B
                                                                                                                                      M7                  Lanes           Lanes3 4
                                                                                                                                                                                           EMTN
                                                       -/A3/A-            -/A3/A-            -/A2/-            BBB/-/-                                                   BBB-/-/BBB-       €1.6B

                           Term debt         A$0.3B              AMTN               AMTN                                 AMTN                                   PABs             PABs     Maple
          A$0.8B                                                 A$0.3B                               A$0.7B                              A$1.0B
                            A$0.2B                                                  A$1.0B                               A$0.7B                                US$0.2B          US$0.2B   C$0.3B

                                                                                                                      USPP
                                                                                                                     US$1.1B                                    TIFIA            TIFIA     NOK
                            A$0.2B                               A$0.2B             A$0.6B                                                                     US$0.8B          US$0.3B   NOK0.8B
                                                                                                                      A$0.3B
                                                                                                                                                                                           USPP
                                                                                                                     AUD PP                                                               US$0.8B
          Bank   debt1                                                                                               A$0.2B
                                                                                                                                                                                           A$0.1B
          Capital markets debt1
          Government debt1                                                                                            EMTN                                                                 144A
                                                                                                                     CHF0.4B                                                              US$1.1B

1.    Debt facilities including undrawn available facilities, in the base currency of debt before hedging.
2.    Corporate working capital facilities are bilateral facilities and can be drawn in AUD and/or USD.                  A$0.8B
3.    Ratings are presented as “S&P/Moody’s/Fitch”. Where debt is not rated by that particular agency,
      this is denoted as “-”.
4.    Ratings for S&P and Fitch were upgraded to BBB in July 2017.
TRANSURBAN FY17 RESULTS | 8 AUGUST 2017                                                                                                                                                                 55
Group debt at 30 June 2017
FACILITY FACILITY TOTAL FACILITY TOTAL DRAWN PROPORTIONAL STATUTORY
(US$M)1 ($M)1 ($M) ($M) DRAWN ($M) DRAWN ($M)
CORPORATE DEBT2
Working capital facilities3 - 900 900 33 33 33
USPP 162 940 1,150 1,150 1,150 1,114
AMTN - 300 300 300 300 300
EMTN (CAD, NOK and EUR Notes) 305 2,288 2,684 2,684 2,684 2,745
144A 500 802 1,452 1,452 1,452 1,430
TOTAL CORPORATE DEBT 967 5,230 6,486 5,619 5,619 5,622
Letters of credit4 - 296 296 359 359 -
NON-RECOURSE DEBT2
TQ - 3,894 3,894 3,126 1,954 3,114
AirportlinkM7 - 970 970 950 594 950
LCT - 460 460 460 460 460
CCT - 278 278 278 278 278
ED - 525 525 525 394 525
M2 - 755 755 755 755 755
M5 - 729 729 727 364 -
M7 - 1,629 1,629 1,629 814 -
495 Express Lanes5 1,008 - 1,310 1,310 1,310 1,155
95 Express Lanes5 567 - 738 738 738 639
TOTAL NON-RECOURSE DEBT 1,575 9,240 11,288 10,498 7,661 7,876
Other6 - - - - - 250
TOTAL GROUP DEBT 2,542 14,766 18,070 16,476 13,639 13,748
1. Shown in effective currency after hedging. 4. Issued in relation to corporate, CityLink, ED, M2, CCT, 95 Express Lanes and NCX. Drawn amount includes
2. CAD, CHF, EUR, NOK and USD debt converted at the hedged rate where cross currency swaps are in place. $72 million of letters of credit issued from working capital facilities.
USD debt is converted at the spot exchange rate ($0.7692 at 30 June 2017) where no cross currency swaps are 5. Statutory drawn debt lower than proportional drawn debt due to this debt being carried at fair value following the
in place. consolidation of the US assets in June 2014.
3. Working capital facilities are bilateral facilities and can be drawn in AUD and/or USD. 6. Consists of shareholder loans and net capitalised borrowing costs.
TRANSURBAN FY17 RESULTS | 8 AUGUST 2017 56Drawn debt
PROPORTIONAL BASIS
30 JUN 16 30 JUN 17 MOVEMENT
AUD1 ($M) ($M) ($M) EXPLANATION3
$733 million 144A issuance, $117 million NOK issuance, $133 million USPP matured, $55 million working
Corporate 3,668 4,330 662 capital repayment.
Net $74 million increase in TQ debt as a result of capital markets issuance, capex facility drawdowns,
working capital facility repayments and repayment of bank debt. CCT debt increased by $1 million as a
Non-recourse 5,159 5,613 454 result of December refinance. M7 debt increased by $179 million due to $518 million M7 AMTN issuance
and repayment of $339 million bank debt. $200 million LCT debt settlement occurred in July 2016.
Total 8,827 9,943 1,116
30 JUN 16 30 JUN 17 MOVEMENT
USD2 ($M) ($M) ($M) EXPLANATION3
Corporate 972 992 20 US$20 million additional working capital drawing.
Non- TIFIA capitalised interest of US$9 million for 95 Express Lanes and US$34 million for 495 Express Lanes.
1,534 1,575 41 US$1.5 million repayment of 95 Express Lanes TIFIA funding.
recourse
Total 2,506 2,567 61
1. AUD represents debt issued in AUD plus debt that has been issued in CAD, EUR, CHF, NOK and USD and has been swapped back into AUD. Issued letters of credit are not included.
2. USD represents debt issued in USD (including 144A bonds, 95 Express Lanes, 495 Express Lanes and tranche C of the 2006 USPP which was not swapped back to AUD) and debt issued in EUR that has
been swapped back in to USD. Issued letters of credit are not included.
3. Proportional values noted. Amounts will differ to consolidated accounts due to the spot translation used in financial accounts as opposed to the hedged FX rate. The consolidated accounts include external
shareholder loans and a fair value measurement on 95 and 495 Express Lanes. M5 and M7 are not included in the consolidated accounts.
TRANSURBAN FY17 RESULTS | 8 AUGUST 2017 57Key debt metrics
30 JUNE 2016 30 JUNE 2017
TRANSURBAN NON- TRANSURBAN NON-
GROUP CORPORATE RECOURSE GROUP CORPORATE RECOURSE
Weighted average maturity (years)1,2 8.7 yrs 5.8 yrs 10.2 yrs3 9.0 yrs 5.8 yrs 10.7 yrs4
Weighted average cost of AUD debt1,5 5.2% 5.7% 4.9% 4.9% 5.5% 4.5%
Weighted average cost of USD debt5 4.3% 4.2% 4.3% 4.3% 4.2% 4.3%
Hedged1,6 99.5% 98.8% 100.0% 99.4% 99.4% 99.4%
Gearing (proportional debt to
33.3% 35.3%
enterprise value)1,7
FFO/Debt8 8.0% 8.6%
Corporate senior interest cover ratio
4.3x 3.9x
(historical ratio for 12 months)
Corporate debt rating
BBB+/Baa1/A- BBB+/Baa1/A-
(S&P/Moody’s/Fitch)
1. CAD, CHF, EUR, NOK and USD debt converted at the hedged rate where cross currency swaps are in place. USD 6. Hedged percentage comprises fixed rate debt and floating debt that has been hedged and is a weighted average of
debt is converted at the spot exchange rate ($0.7426 at 30 June 2016 and $0.7692 at 30 June 2017) where no total proportional drawn debt, exclusive of issued letters of credit.
cross currency swaps are in place. 7. Proportional debt to enterprise value, exclusive of issued letters of credit. Security price was $11.99 at 30 June 2016
2. Full value of drawn debt. and $11.85 at 30 June 2017 with 2,036 million securities on issue at 30 June 2016 and 2,052 million securities on
3. The average weighted maturity of Australian non-recourse debt is 5.0 years at 30 June 2016. issue at 30 June 2017.
4. The average weighted maturity of Australian non-recourse debt is 6.3 years at 30 June 2017. 8. Based on S&P methodology. The impact of AirportlinkM7 has been annualised. June 2016 FFO/Debt inclusive of tax
5. Proportional drawn debt exclusive of issued letters of credit. benefit was 8.6% (AirportlinkM7 annualised).
TRANSURBAN FY17 RESULTS | 8 AUGUST 2017 58Extension of Group debt maturity profile
JUNE 2016 MATURITY PROFILE1,2,3
3,000
Existing debt
2,500 refinanced during
A$ MILLION
FY17
2,000
1,500
1,000
500
-
FY17 FY18 FY19 FY20 FY21 FY22 FY23 FY24 FY25 FY26 - 29 FY30 - 34 FY35+
JUNE 2017 MATURITY PROFILE1,2,3
3,000
New debt
2,500 raised during
A$ MILLION
FY17
2,000
1,500
1,000
500
-
FY17 FY18 FY19 FY20 FY21 FY22 FY23 FY24 FY25 FY26 - 29 FY30 - 34 FY35+
1. The full value of debt facilities is shown as this is the value of debt for refinancing purposes. This overstates Transurban’s ownership share of the debt.
2. Debt is shown in the financial year in which it matures.
3. Debt values are in AUD as at 30 June 2017. CAD, CHF, EUR, NOK and USD debt converted at the hedged rate where cross currency swaps are in place. USD debt is converted at the spot
exchange rate ($0.7426 at 30 June 2016 and $0.7692 at 30 June 2017) where no cross currency swaps are in place.
TRANSURBAN FY17 RESULTS | 8 AUGUST 2017 59You can also read


