The Effects of Physical Exercise on Cognition: How Heart Rate Variability Can Predict Cognitive Performances - Frontiers
←
→
Page content transcription
If your browser does not render page correctly, please read the page content below
ORIGINAL RESEARCH
                                                                                                                                              published: 31 August 2020
                                                                                                                                        doi: 10.3389/fnhum.2020.00312

                                            The Effects of Physical Exercise on
                                            Cognition: How Heart Rate Variability
                                            Can Predict Cognitive Performances
                                            Giovanna Sannino 1*, Ivanoe De Falco 1 , Giuseppe De Pietro 1 and Saverio Stranges 2,3,4
                                            1
                                             ICAR, National Research Council of Italy, Naples, Italy, 2 Department of Epidemiology and Biostatistics, Schulich School of
                                            Medicine and Dentistry, Western University, London, ON, Canada, 3 Department of Family Medicine, Schulich School of
                                            Medicine and Dentistry, Western University, London, ON, Canada, 4 Department of Population Health, Luxembourg Institute
                                            of Health, Strassen, Luxembourg

                                            Objectives: Investigate and identify the relationship between physical exercise and
                                            cognitive performance measured by using different cognitive tests taken from Cambridge
                                            Brain Science (CBS).
                                            Methods: Thirty subjects, divided into two groups (aerobic and effort), undergo twelve
                                            cognitive tests from CBS. A comparison between the pre- and post-exercise results in
                                            terms of cognitive performance differences is carried out. Regression analysis between
                                            Heart Rate Variability (HRV) features and CBS tests results is performed.
                                            Results: In most CBS tests, there is an improvement, or at least a confirmation, of
                            Edited by:      the subject’s cognitive ability, for both groups. Reasoning (80–100%), concentration
      Victor Hugo C. de Albuquerque,        (80–87%), and planning tests (93–100%) seem to undergo critical positive changes. The
          University of Fortaleza, Brazil
                                            regression analysis, performed by using a set of different algorithms, has demonstrated
                      Reviewed by:
                      Nizar Bouguila,
                                            that it is possible, by monitoring the HRV during the exercise, to predict to some extent
        Concordia University, Canada        the cognitive performance, i.e., the CBS tests results. The best performing regression
               M. Shamim Hossain,           algorithms are Simple Linear (Quade Test—aerobic group: 2.098, effort group: 3.350,
   King Saud University, Saudi Arabia
                   Antonino Galletta,       both groups: 2.747) and REPTree (Quade Test—aerobic group: 2.955, effort group:
          University of Messina, Italy      3.315, both groups: 3.121). The statistical analysis has proved that physical activity is
                 *Correspondence:           statistically useful for the subjects in improving their cognitive performance.
                   Giovanna Sannino
          giovanna.sannino@icar.cnr.it      Conclusions: This study has numerically appraised the improvement, the conservation,
                                            or the worsening on different aspects of cognition. The found mathematical relationship
                   Specialty section:
                                            between physical exercise and cognitive performance suggests that it is possible to
        This article was submitted to
          Brain-Computer Interfaces,        predict the beneficial effect of various exercises on executive and attentive control.
                a section of the journal
                                            Keywords: cognition, physical exercise, heart rate variability, prediction of cognitive performances, pilot study
    Frontiers in Human Neuroscience

            Received: 19 June 2020
            Accepted: 15 July 2020
          Published: 31 August 2020
                                            1. INTRODUCTION
                             Citation:      The importance of exercise to overall well-being is documented in the scientific literature. Regular
   Sannino G, De Falco I, De Pietro G       exercise is essential for sustaining a healthy body weight and can help in the maintenance of
 and Stranges S (2020) The Effects of
                                            normal blood lipid levels and blood pressure (Fletcher et al., 1992). The benefits of exercise
 Physical Exercise on Cognition: How
    Heart Rate Variability Can Predict
                                            extend beyond physiological changes; exercise is also advantageous to mental health, having been
             Cognitive Performances.        shown to improve self-esteem and self-confidence and to reduce symptoms of depression (Fletcher
       Front. Hum. Neurosci. 14:312.        et al., 1992). The helpfulness of exercise is so systematic and profound that it is recommended in
     doi: 10.3389/fnhum.2020.00312          the prevention and management of various medical conditions, including cardiovascular disease,

Frontiers in Human Neuroscience | www.frontiersin.org                              1                                               August 2020 | Volume 14 | Article 312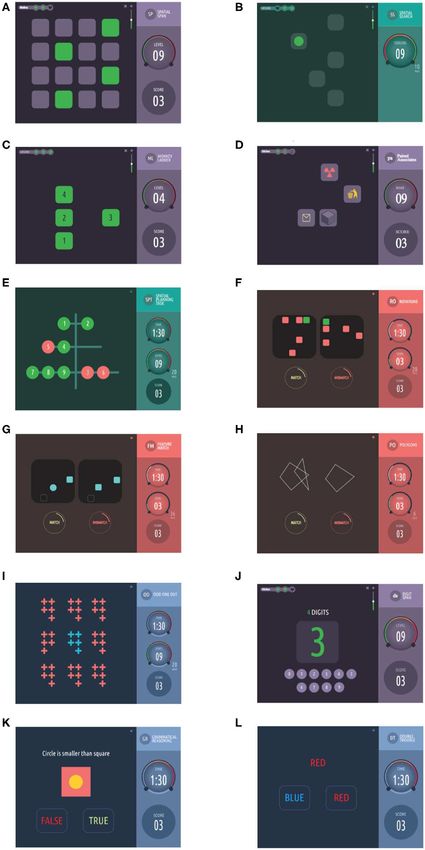
Sannino et al.                                                                                          The Effects of Physical Exercise on Cognition

metabolic syndrome, osteoporosis, a number of neoplastic                      Additionally, as detailed in section 3.2, we have analyzed
diseases, and various mental illnesses, such as anxiety (Fletcher         if a mathematical relationship exists between physical exercise
et al., 1992). However, an often-overlooked aspect of exercise is         and cognitive performance. This has been done by studying if
the effect it has on cognition and the brain.                             a regression model can be found that is able to predict the
    In fact, there is increasing evidence that exercise can               cognitive performance, i.e., the CBS test scores, by using the
have drastic effects on almost all aspects of brain health,               Heart Rate Variability (HRV) features monitored during the
including improved learning and memory, reduced symptoms                  physical exercise. To perform regression, several algorithms are
of depression, better outcomes associated with brain injury, and          considered, and the best six, in terms of three different regression
delayed onset and magnitude of cognitive decline associated with          quality indexes, are reported.
various neurodegenerative diseases (Cotman et al., 2007).                     We have chosen to use the HRV, a non-invasive parameter,
    Literature shows more and more papers aiming at linking               because this allows measuring the dynamic autonomic responses
physical activity to improvements in brain function and                   during exercise through the analysis of the ElectroCardiogram
cognition, as for example (Luft et al., 2009; Paterson and                (ECG) signal, i.e., the HRV, as demonstrated in important studies
Warburton, 2010; Ahlskog et al., 2011; Erickson et al., 2011;             in the scientific literature (Makivić et al., 2013; Ngandu et al.,
Luque-Casado et al., 2013; Blondell et al., 2014; Scherder et al.,        2015). These results indicate that it is possible to use the HRV
2014; Bherer, 2015; Prakash et al., 2015; Tsunoda et al., 2015;           parameters for the analysis of the stress experienced by the
Bauman et al., 2016; Tivadar, 2017). Research carried out on              body during the training phase, and for better understanding the
animals shows the positive effect of enriched environments,               physiological recovery following the training. As a matter of fact,
including access to exercise equipment (such as running wheels)           it is sensible to hypothesize that modifications in the Autonomic
on neuronal growth. The same effect is shown when neural                  Nervous System (ANS) patterns, represented by modifications in
systems involved in learning and memory are considered. This              the HRV, might act as helpful parameters for the management of
indicates that physically active behaviors have an effect both            both physical fatigue and exercise intensity.
on the cognitive function and on the related brain structures                 The purpose of finding a mathematical relationship between
(Vaynman and Gomez-Pinilla, 2006). Similar results have been              HRV and cognitive performance is to predict the beneficial effect
found when research is carried out on humans (Booth and Lees,             of various exercise programs (aerobics or muscle strength) on
2006), with recent research in neuroimaging techniques showing            executive and attentive control (work memory, distributed focus,
that exercise yields apparent modifications both in structure and         inhibition of response, interference on control).
in the function of the brain.                                                 This is a particularly relevant research activity aiming to
    However, none of the mentioned studies gives the possibility          demonstrate if a direct correlation between the trend of HRV and
to predict the cognitive performance of the subjects. This                cognitive performance exists. In fact, if demonstrated, it would
possibility is what we investigate in this paper, and represents          be possible to design prevention activities based on personalized
its novelty.                                                              exercise programs that, using HRV analysis, are optimized for the
    We present a study aiming to investigate the impact                   improvement of cognitive abilities.
on, and the mathematical relationship between, physical                       Finally, as mentioned in section 3.3, a statistical analysis
activity and cognitive performances. These latter are measured            is run to: (i) understand if the physical activity is statistically
by using a number of different cognitive tests taken from                 useful for the subjects in improving their performance at
Cambridge Brain Science, the CBS tests1 . The study,                      solving the 12 CBS tests; and (ii) to evaluate the quality of the
detailed in section 2, involves thirty subjects, divided into             regression models.
two groups, each with specific physical activity, and twelve
cognitive tests.
    As a result of this study, we have been able to create a brand-       2. METHODS
new data set linking physical activity and the results of the
cognitive tests over time. To the best of our knowledge, this is          2.1. Ethics Statement
the first data set of this kind, and no other freely available such       This study has been conducted in compliance with the World
data sets exist.                                                          Medical Association Declaration of Helsinki on Ethical Principles
    Working on this data set, we have conducted different kinds           for Medical Research Involving Human Subjects (World Medical
of analysis in section 3. In detail, as described in section 3.1,         Association, 2008).
we have first evaluated how the physical activity impacts on                 The protocol guidelines of the study have been written
cognitive activities such as reasoning, work memory, and verbal           in conformity with the SPIRIT 2013 Statement (Chan et al.,
skills. Or rather, we have numerically appraised, both before and         2013), and, before the start of the experimental session, the
after the physical training, the improvement, the conservation,           participants read and signed an informed consent statement.
or the worsening on different aspects of cognition, each of               Suitable information was given to them about their right to quit
them represented by a CBS test. This evaluation has been                  the experiment whenever they wanted, and each of the subjects
made in terms of cognitive performance by defining a suitable             was informed in a detailed way about the goal of this study when
numerical 1Score.                                                         the experimental session ended. Finally, all the data from all the
                                                                          participants were examined, filed, and described in a completely
1 www.cambridgebrainsciences.com                                          anonymous form.

Frontiers in Human Neuroscience | www.frontiersin.org                 2                                        August 2020 | Volume 14 | Article 312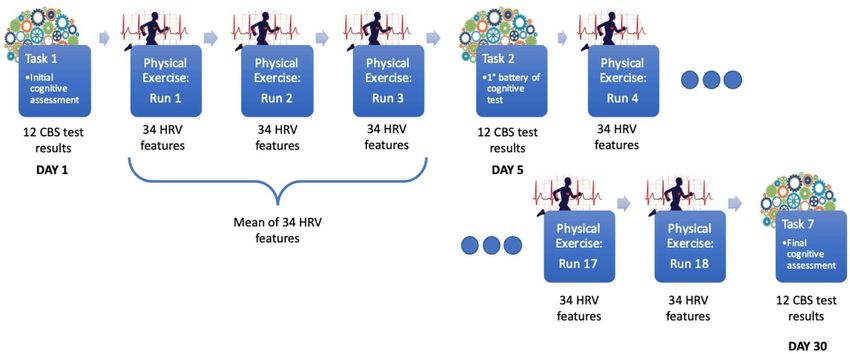
Sannino et al.                                                                                                 The Effects of Physical Exercise on Cognition

2.2. The Recruitment: Participants and                                           Between one task and another, the participant is invited to
Procedure for the Data Acquisition                                               perform a minimum of 3 h of physical exercise (even non-
We recruited 30 healthy participants (age range: 18–48 years old),               continuative), preferably 1 h per day for 3 days. The type
of which 18 males and 12 females.                                                of physical exercise to be performed will depend on the
   In order to be considered suitable for the trial process, the                 target group to which it will be assigned, which can be either
subjects had to comply with these criteria:                                      aerobic or effort. If assigned to the aerobic group, the subject
                                                                                 must perform a type of aerobic exercise, such as running
   • Adults aged over 18 years;                                                  or cycling. If, instead, the subject is assigned to the effort
                                                                                 group, she/he must perform a type of exercise that is short
   • Subjects with no level of physical fitness as defined in
                                                                                 but intense, such as lifting weights, bending, or lifting at the
     the normative values of the American College of Sports
                                                                                 bar. Of the 30 people recruited, 15 were chosen in a random
     Medicine (Sharp, 1993);
                                                                                 way and allocated to the effort group (Group 1), while the
   • Subjects being no professional athletes;                                    other 15 to the aerobic group (Group 2).
   • No people suffering from any pathological cardiovascular                  • The initial cognitive assessment is requested on site.
     conditions, neurological or psychiatric disorders or other
     severe diseases.                                                       Days 5, 10, 15, 20, and 25 :

The procedure of the study has been outlined in Figure 1.                      • The participant is asked to send the HR data acquired
   In the following, we report a brief summary of the phases of                  until now;
the protocol performed for data collection:
Day 1 :                                                                        • The results of each battery of 12 cognitive tests
                                                                                 in each day are collected through the CBS platform.
   • The participant is informed about the purposes of the
     study and how it will be conducted. Information material               Day 30 :
     is provided, and the participant is invited to sign the
                                                                               • The participant is asked to send the HR data acquired so far;
     informed consent.
                                                                               • The final cognitive assessment is requested on site;
   • The participant is apprised of the use of the wearable
     device that she/he should wear during physical activity for               • The participant will return the instrumentation received.
     the continuous acquisition of the Heart Rate (HR) data,
     the Zephyr BioHarness BH3 (Zephyr Technology, 2016).
                                                                            2.3. The Cognitive Measurements
     Together with the device, detailed instructions are given on
                                                                            The current study uses CBS tests3 to assess cognitive
     how to place the sensor and on how to use it.
                                                                            performance. CBS is a set of 12 on-line tests used to measure
   • The participant is informed about the 12 cognitive tests of            different aspects of cognitive function. This collection of tests
     the CBS that they will have to perform after each physical             assesses aspects of inhibition, selective attention, reasoning,
     exercise, and about the modality for the on-line compilation           verbal STM, spatial working memory, planning, and cognitive
     through the platform on CBS site2 .                                    flexibility. Together, these tests collectively and comprehensively
                                                                            assess three cognitive domains: STM, reasoning, and verbal
      Figure 2 shows the 12 cognitive tests used: the green ones            abilities, based on behavioral data (from over 44,000 individuals)
      are related to the Short Term Memory (STM) cognition,                 and neuroimaging studies that have demonstrated that each
      those relating to the reasoning abilities are shown in blue,          domain is supported by a separate brain network (Hampshire
      those relating to verbal skills in red, whereas the purple ones       et al., 2012). They have been validated in patients (Owen
      make reference to memory.                                             et al., 1990, 1991, 1993) and healthy populations (Owen et al.,
                                                                            1996a,b) and have been shown to be sensitive to subtle cognitive
   • The participant is informed about the scheduling of the                changes due to neurodegeneration (Owen et al., 1992, 1993)
     activities, which is set as follows:                                   or pharmacological intervention (Lange et al., 1992; Mehta
      Task 1 - Initial cognitive assessment: day 1;                         et al., 2000). In addition, the tests are designed to be engaging
      Task 2 - 1st battery of 12 cognitive tests: day 5;                    to maximize participant compliance. Completion of the battery
      Task 3 - 2nd battery of 12 cognitive tests: day 10;                   requires between 35 and 45 min, which is faster and more
      Task 4 - 3rd battery of 12 cognitive tests: day 15;                   convenient than many other pen-and-paper neuropsychological
      Task 5 - 4th battery of 12 cognitive tests: day 20;                   batteries. Taken together, the CBS battery is ideal to use in the
      Task 6 - 5th battery of 12 cognitive tests: day 25;                   current study because it is easy and fast to complete, can be used
      Task 7 - Final cognitive assessment: day 30.                          to assess even the most subtle changes in cognition, and the
                                                                            categorization of tests into latent cognitive domains will help
2 www.cambridgebrainsciences.com                                            3 www.cambridgebrainsciences.com

Frontiers in Human Neuroscience | www.frontiersin.org                   3                                             August 2020 | Volume 14 | Article 312
Sannino et al. The Effects of Physical Exercise on Cognition
FIGURE 1 | Schema of the protocol performed for the data collection phase.
to provide an objective definition of exactly which cognitive The RR- interval, also called the NN-interval, is determined
processes are influenced by physical activity. by the distance between two successive heartbeats in a normal
Below we give the summary of the CBS tests used in this study, rhythm of the ECG signal. As interference may take place
and the cognitive area they are related to. between artifacts in the RR interval time series and the analysis
of these signals, we decided to use the Kubios Artifacts removal
• Memory: Monkey Ladder, Spatial Span, Paired Associates, RR filter set to a maximum threshold of 5%.
Digit Span; After filtering, the analysis of the signals took place. In
detail, 34 characteristic parameters were extracted, summarized
• Reasoning: Odd One Out, Double Trouble, in Table 1.
Grammatical Reasoning; The features from 1 to 9 are related to the Time domain, the
features from 10 to 22 refer to the Frequency domain, while those
• Concentration: Spatial Rotation, Feature Match,
from 24 to 34 are related to the Non-Linear domain.
Interlocking Polygons;
These characteristics were extracted from each HR data
• Planning: Spatial Planning, Token Search. acquisition related to each run linked to a single exercise session
of each participant.
2.4. The HRV Measurements
The HRV measurements have been extracted from the HR 2.5. The Database
data monitored by using the Zephyr BioHarness BH3 Sensor The average values of the HRV parameters relative to the
(Zephyr Technology, 2016). This HR sensor can be used at runs between two successive batteries of 12 CBS tests have
the gym, on a run, while exercising at home, or during been correlated with the CBS tests results of the second of
physical therapy. It is small, wearable, and compatible with these batteries.
many Bluetooth devices, and very suitable for personal and In practice, referring to Figure 1, for each individual
clinical use. exercise session (Run), a vector of 34 HRV features has been
All HR data were processed using a Matlab-based software, extracted. The average of the HRV characteristics relative to
named Kubios (Tarvainen et al., 2014), designed at the University the runs between two successive batteries of 12 CBS tests is
of Kuopio, Finland. This is a state-of-the-art tool for the then computed.
extraction and the analysis of the HRV characteristics from the To better understand the construction mechanism of each
HR data. Through Kubios, a set of parameters was extracted in database item, let us suppose that the subject performed three
the Time domain, in the Frequency domain, and in the Non- exercise runs between day 1, in which she/he underwent the
Linear domain. initial cognitive assessment, and day 5, when she/he engages in
Before extracting the HRV parameters, each record is cleaned the first battery of CBS tests. From each HR signal monitored in
from power line interferences, muscle and movement artifacts, each of the three exercise runs, 34 HRV features are extracted. So,
through the use of a cubic spline interpolation procedure for each HRV feature, we have three values, one for each exercise
(Daskalov and Christov, 1997; Mateo and Laguna, 2000). run. We have computed the average of these three values. The
Frontiers in Human Neuroscience | www.frontiersin.org 4 August 2020 | Volume 14 | Article 312Sannino et al. The Effects of Physical Exercise on Cognition FIGURE 2 | The 12 tests included in the CBS battery: the green ones are related to the Short Term Memory (STM) cognition, those relating to the reasoning abilities are shown in blue, those relating to verbal skills in red, whereas the purple ones make reference to memory. (A) Spatial span test. (B) Token search test. (C) Monkey ladder test. (D) Paired associates test. (E) Spatial planning test. (F) Spatial rotations test. (G) Feature match test. (H) Interlocking polygons test. (I) Odd one out test. (J) Digit span test. (K) Grammatical reasoning test. (L) Double trouble test. All the images in this figure are taken from: https://www.cambridgebrainsciences.com. Frontiers in Human Neuroscience | www.frontiersin.org 5 August 2020 | Volume 14 | Article 312
Sannino et al.                                                                                                                The Effects of Physical Exercise on Cognition

TABLE 1 | HRV features: the features from 1 to 9 are related to the Time domain, the features from 10 to 22 refer to the Frequency domain, while those from 24 to 34 are
related to the non-linear domain.

                       Measure                           Unit                           Description
1                      MeanRR                            ms                             The mean of RR intervals
2                      STDRR                             ms                             Standard deviation of RR (NN) intervals
3                      MeanHR                            1/min                          The mean of HRs values
4                      STDHR                             1/min                          Standard deviation of HRs values
5                      RMSSD                             ms                             Square root of the mean squared differences between successive RR intervals
6                      NN50                              count                          Number of successive RR interval pairs that differ more than 50m
7                      pNN50                             %                              NN50 divided by the total number of RR intervals
8                      RRtri                                                            The integral of the RR interval histogram divided by the height of the histogram
9                      TINN                              Ms                             Baseline width of the RR interval histogram
10                     PeakVLF                           Hz                             Peak frequencies of the very-low-frequency band
11                     PeakLF                            Hz                             Peak frequency of the Low Frequency (LF) band (0.04–0.15 Hz)
12                     PeakHF                            Hz                             Peak frequency of the High Frequency (HF) band (0.15–0.4 Hz)
13                     VLF                               ms2                            Absolute power of the very-low-frequency band (0.0033–0.04 Hz)
14                     LF                                ms2                            Absolute powers of LF band, calculated with AR
15                     HF                                ms2                            Absolute powers of HF band, calculated with AR
16                     Relative VLF                      %                              Relative power of the very-low-frequency band
17                     Relative LF                       %                              Relative power of the low-frequency band
18                     Relative HF                       %                              Relative power of the high-frequency band
19                     Norm. Power                       nu                             Relative power of the low-frequency band in normal units
                       LF
20                     Norm. Power                       nu                             Relative power of the high-frequency band in normal units
                       HF
21                     Total Power                       ms2                            Sum of the energy in the VLF, LF, and HF bands
22                     LF/HF                             %                              Ratio between LF and HF band powers
23                     SD1                               ms                             St. dev. of the Poincarè plot perpendicular to the line of identity
24                     SD2                               ms                             St. dev. of the Poincarè plot along to the line of identity
25                     ApEn                                                             Approximate entropy
26                     SampEn                                                           Sample entropy
27                     D2                                                               Correlation Dimension
28                     DFA1                                                             Short-term fluctuation slope in Detrended Fluctuation Analysis
29                     DFA2                                                             Long-term fluctuation slope in Detrended Fluctuation Analysis
30                     RPLmean                           beats                          Recurrent Plot (RP) mean line length
31                     RPLmax                            beats                          RP maximum line length
32                     RPREC                             %                              RP Recurrence Rate
33                     RPDET                             %                              RP Determinism
34                     RPShan                                                           RP Shannon Entropy

vector containing the averages of all the HRV features is then put                          −−−−→       12
                                                                                          • f (CBS)          : is the vector containing the CBS test results;
in correlation with the scores of the CBS tests made on Day 5.                                          1
   Following this procedure, for each subject, we have obtained a
                                                                                       As a result of all the pre-processing phases and of the procedure
number of six items. Each of these latter is constituted as below:
                                                                                       faced, the data set used in this study consists of 180 items (6 items
                              −−−−→ 34 −−−−→ 12

             item = id; avg f (HRV)        ; f (CBS)            (1)                    for 30 subjects), 90 of which related to group 1 (effort group), and
                                               1                 1                     90 to group 2 (aerobic group).
where:
                                                                                       3. RESULTS
     • id: is a value from 1 to 30 that unequivocally and
       anonymously identifies each participant;                                        3.1. Impact of Physical Exercise on
             −−−−→ 34                                                                  Cognitive Performance

     • avg f (HRV)      : is a vector containing the average values
                        1                                                              We have performed an analysis to determine whether the
       of the 34 HRV features computed over the runs performed                         different exercise regimes (aerobic vs. effort exercise) had
       within two successive batteries of 12 CBS tests;                                differential effects on cognition, and how they reflected in the

Frontiers in Human Neuroscience | www.frontiersin.org                              6                                                  August 2020 | Volume 14 | Article 312
Sannino et al. The Effects of Physical Exercise on Cognition
change in performance over time. To this aim, for each subject, Vector Machine (SVM) (Zeng et al., 2008; Bouguila and
for the generic i-th CBS test (among the 12) we have defined: Amayri, 2009), the Multi-Layer Perceptron (MLP) Artificial
Neural Network (Rumelhart et al., 1988), the Instance-
12
CBSi (day = 30) − CBSi (day = 1) Based K-nearest neighbors (IBk) (Aha et al., 1991), the
1Scorei % = ∗ 100.0 Reduced Error Pruning Tree (REPTree) (Breslow and
max(CBS)i − min(CBS)i i=1
(2) Aha, 1997), the Simple Linear and the Additive regression
where (Stone, 1985).
We have run all the regression models over the data set by
• max(CBS)i : is the maximum among the values obtained by performing five-fold cross-validation. This protects us from the
all the subjects over the i-th CBS test; overfitting problem by dividing the data set into five folds and
• min(CBS)i : is the minimum among the values obtained by estimating regression quality on each fold.
all the subjects over the i-th CBS test. It is important to underline here that we chose not to carry
out any parameter tuning phase that could assist us in finding
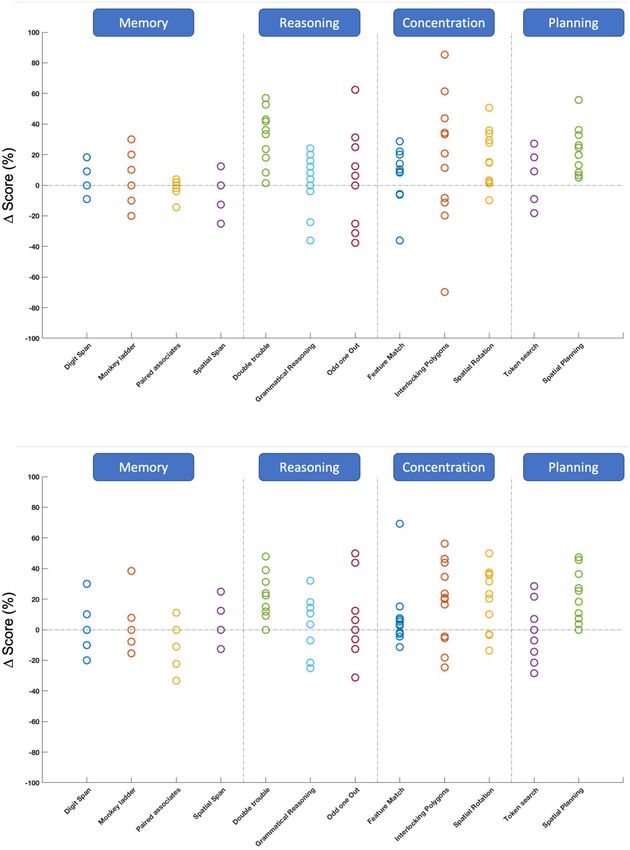
As shown in Figure 3, we can see that in some cases there the most appropriate values for the parameters of the different
has been an improvement in cognitive performance, whereas in regression algorithms. Also, we chose not to rely on Principal
others this is not the case. This improvement is different between Component Analysis, rather we have made use for the regression
the two groups, effort and aerobic. of all the 34 HRV features extracted from the signals.
To better understand how many subjects have achieved an Considering that the two types of physical activity impact
improvement in cognition from the physical exercise, we report differently on the same characteristics of HRV, the analysis
in Table 2 these numerical results expressed in percentage. has been separately performed for each group. Therefore,
The most significant percentages are reported in bold. As we 12 regression models were identified, each one to predict a
can see, tests related to the reasoning, in particular Double single CBS test result for the effort group (Group 1), and
Trouble and Grammatical Reasoning, have obtained a significant other 12 regression models were identified for the aerobic
improvement. In fact, for the Double Trouble all the subjects group (Group 2).
of group 1 (100%) have achieved better performance at the To evaluate the regression models used in this study, we
end of the study (day = 30) with respect to the assessment have chosen three quality indicators, the Pearson correlation
made at the beginning of the study (day = 1). Meanwhile, coefficient (ρ), the Mean Absolute Error (MAE), and the Root
for the Grammatical Reasoning, the number of cases in which Mean Square Error (RMSE).
an improvement has been registered is greater in Group 2 Correlation is a bivariate analysis measuring the strength of
(aerobic), with respect to Group 1 (effort). Good improvements association between two variables as well as the direction of this
have also been registered for the concentration, especially in relationship. Given a pair of random variables y and ŷ, where yi is
the Spatial Rotation test, in which, for both groups, we have the actual output and ŷi is the model’s prediction, ρ is defined as:
an improvement in at least 80% of the subjects. Finally, also
for the planning there is a significant improvement in almost cov(y, ŷ)
ρy,ŷ = (3)
all subjects of both groups, in detail in 100% of the subjects σy σŷ
for Group 1 (effort) and in 93% of the subjects for Group
2 (aerobic). No important consequences have been registered where:
for the tests related to the memory in both groups. This
• cov: is the covariance between y and ŷ;
means that physical exercise does not impact so much on
memory performance. • σy : is the standard deviation of y;
• σŷ : is the standard deviation of ŷ
3.2. The Regression Analysis to Predict the
Cognitive Performance As concerns the strength of the relationship, the value of ρ ranges
From a hardware viewpoint, all the experiments reported in this within −1 and +1, and the higher the value, the better the
paper have been effected on an iMac with High Sierra (Mac OsX model. When the value of ρ lies around ±1, a perfect degree of
10.13.2) operating system, a 3.6-GHz Intel Core i7 processor, 8GB association, be it direct or inverse, is said to exist between the
DDR4 at 2,400 MHz, and a 1 TB hard disk. two variables.
We have performed our experiments in the Waikato In MAE, the error is computed as the average of the absolute
Environment for Knowledge Analysis (WEKA), version 3.8.1 differences between the target values and the corresponding
(Garner, 1995). In it, we have taken advantage of a wide predictions. Mathematically, it is calculated using the formula:
set of regression models coming from artificial intelligence, n
some already contained in the basic WEKA version, and
X
MAE = (1/n) |yi − ŷi | (4)
some others freely downloadable from its repository. We i=1
have executed a good number of such models, and we have
chosen to report here the best-performing algorithms, i.e., It is a linear score, so all the individual differences are assigned
the ones which have achieved the best numerical results in equal weights. As an example, the difference between 30 and 20 is
our experiments. These have resulted in being the Support considered as twice that between 30 and 25.
Frontiers in Human Neuroscience | www.frontiersin.org 7 August 2020 | Volume 14 | Article 312Sannino et al. The Effects of Physical Exercise on Cognition FIGURE 3 | Upper pane: 1Scores of each subject belonging to the Group 1 (Effort group) calculated for the 12 CBS tests. Lower pane: 1Scores of each subject belonging to the Group 2 (Aerobic group) calculated for the 12 CBS tests. Frontiers in Human Neuroscience | www.frontiersin.org 8 August 2020 | Volume 14 | Article 312
Sannino et al.                                                                                                        The Effects of Physical Exercise on Cognition

TABLE 2 | Percentages of subjects who have achieved an improvement, a conservation, or a worsening on the CBS tests results.

                                                            Group 1                                                                 Group 2
                                          1>0                1=0                     10                      1=0                     1
Sannino et al. The Effects of Physical Exercise on Cognition
TABLE 3 | Numerical results, obtained over train and test sets, related to ρ.
Group 1
SVM MLP REPTree IBk Simple linear Additive
Train Test Train Test Train Test Train Test Train Test Train Test
Digit span 0.822 −0.368 0.957 0.025 0.805 0.323 0.979 0.121 0.445 0.370 1.000 −0.251
Monkey ladder 0.772 0.672 1.000 0.593 0.917 0.449 0.956 0.632 0.445 0.730 0.998 0.225
Paired associates 0.756 0.514 0.937 −0.205 0.000 0.000 0.953 −0.267 0.533 0.169 0.961 −0.119
Spatial span 0.627 −0.115 0.955 −0.127 0.955 −0.127 1.000 −0.292 0.307 −0.249 1.000 0.135
Double trouble 0.810 0.275 1.000 0.239 0.000 0.000 0.986 −0.533 0.403 0.760 1.000 0.774
Grammatical reasoning 0.734 0.632 1.000 0.517 0.509 0.290 1.000 0.223 0.520 0.856 0.975 0.292
Odd one out 0.869 0.346 1.000 −0.123 0.000 0.000 0.966 0.127 0.459 0.538 1.000 0.174
Feature match 0.800 0.304 1.000 0.007 0.503 0.517 1.000 0.701 0.466 0.535 0.994 0.493
Interlocking polygons 0.885 0.003 0.969 −0.085 0.738 −0.419 1.000 −0.276 0.501 0.042 1.000 0.102
Spatial planning 0.627 −0.115 0.955 −0.127 0.000 0.000 1.000 −0.292 0.307 −0.249 1.000 0.135
Token search 0.686 −0.098 1.000 0.131 0.000 0.000 1.000 −0.042 0.486 0.166 0.961 0.092
Spatial rotations 0.759 −0.080 0.984 0.045 0.000 0.000 0.975 0.222 0.410 −0.717 1.000 −0.749
Group 2
Train Test Train Test Train Test Train Test Train Test Train Test
Digit span 0.743 −0.114 0.969 −0.118 0.000 0.000 1.000 −0.123 0.540 0.225 1.000 −0.151
Monkey ladder 0.736 0.263 0.996 0.299 0.000 0.000 1.000 0.404 0.372 0.063 0.932 −0.325
Paired associates 0.286 0.070 0.971 0.511 0.000 0.000 0.969 0.597 0.230 0.493 1.000 0.392
Spatial span 0.746 0.047 1.000 0.256 0.576 0.092 1.000 −0.121 0.473 0.144 0.915 0.009
Double trouble 0.749 0.151 0.974 0.460 0.000 0.000 1.000 0.727 0.532 0.126 0.966 0.095
Grammatical reasoning 0.651 −0.111 0.990 0.276 0.850 0.147 0.992 0.188 0.390 0.090 0.991 −0.170
Odd one out 0.791 −0.373 0.949 −0.197 0.000 0.000 0.987 −0.279 0.490 −0.302 0.971 0.010
Feature match 0.601 0.607 1.000 0.204 0.000 0.000 0.979 0.296 0.314 0.179 0.982 −0.258
Interlocking polygons 0.704 0.093 1.000 0.044 0.648 0.054 1.000 0.343 0.378 −0.137 0.938 0.103
Spatial planning 0.746 0.047 1.000 −0.256 0.576 0.092 1.000 −0.121 0.473 0.144 0.915 0.009
Token search 0.736 0.397 1.000 −0.425 0.000 0.000 0.985 0.145 0.298 −0.131 0.961 0.354
Spatial rotations 0.780 0.024 0.987 −0.110 0.485 −0.382 1.000 −0.076 0.390 −0.345 0.954 −0.079
The values in bold are the best values achieved over each CBS test for both train and test sets.
of non-parametrical statistical analysis is needed. By following computed through the statistics of the test considered: low values
(Demsar, 2006; Derrac et al., 2011), we have used Quade test, that strongly suggest the existence of significant differences among the
takes account for the fact that not all the problems are equally algorithms considered.
difficult, or that the results obtained by the algorithms over them As concerns Table 8, instead, the row at its bottom reports
show larger differences, as it is the case here for the 12 cognitive for each post-hoc procedure the threshold value Th. This
tests. We have considered all the three quality indicators and all is important because the procedure under account rejects
the subjects involved in this trial, and we have performed both those equivalence hypotheses characterized by an adjusted p-
the Quade statistical test and the related post-hoc procedures. The value lower than or equal to Th. Moreover, p represents
results over Group 1 (effort), shown in Tables 7, 8, reveal that the unadjusted p-value for the algorithm under account, as
Simple Linear is statistically better than the other five algorithms, contrasted to the adjusted p-values resulting from the various
followed by REPTree. post-hoc procedures used. Also, the variable z is the test statistic
In the last row of Table 7, the value of the test statistic is also for this comparison, and its definition can be found in Derrac
shown. This is a parameter specific to the particular statistical test et al. (2011).
executed. For the Quade test used in this paper, the test statistic Over Group 2 (aerobic), instead, the results reported in
is distributed according to an F-distribution with two degrees of Tables 9, 10 reveal that SVM turns out to be statistically better,
freedom given by (number of algorithms - 1), and by (number of REPTree being the runner up.
problems - 1) * (number of algorithms - 1), respectively. In this Given that we have obtained different conclusions when
case, we have six algorithms and 12 problems (the 12 cognitive working with the two groups separately, the question arises about
tests), so their values are equal to 5 and 175. which the best algorithm is when all the subjects in the two
In the same row of the table, the corresponding p-value is groups are considered at the same time. Based on the results
shown. It represents the smallest level of significance that results of the Quade statistical test shown in Tables 11, 12, the best-
in the rejection of the null hypothesis. This latter is a statement performing algorithm is, in this case, Simple Linear, REPTree
of no difference among the tested algorithms. Such a p-value is being the runner-up.
Frontiers in Human Neuroscience | www.frontiersin.org 10 August 2020 | Volume 14 | Article 312Sannino et al. The Effects of Physical Exercise on Cognition
TABLE 4 | Numerical results, obtained over train and test sets, related to MAE.
Group 1
SVM MLP REPTree IBk Simple linear Additive
Train Test Train Test Train Test Train Test Train Test Train Test
Digit span 0.482 1.763 0.158 1.865 0.828 1.310 0.000 1.564 1.228 1.257 0.162 1.553
Monkey ladder 0.355 0.407 0.005 0.645 0.260 0.576 0.000 0.446 0.611 0.346 0.019 0.938
Paired associates 0.387 0.595 0.243 0.932 0.716 0.669 0.000 1.199 0.635 0.784 0.071 1.053
Spatial span 0.511 0.772 0.016 0.842 0.016 0.842 0.000 1.002 0.770 0.766 0.102 1.120
Double trouble 6.212 14.371 3.939 18.727 14.379 9.334 0.000 14.583 14.013 7.378 2.250 7.845
Grammatical reasoning 2.062 4.065 0.065 5.734 3.055 5.630 0.000 6.340 4.227 3.446 0.471 6.346
Odd one out 1.159 3.163 0.031 5.037 3.158 2.802 0.000 3.961 2.530 2.603 0.447 3.299
Feature match 12.623 40.143 0.851 61.627 21.039 32.286 0.000 37.289 22.212 41.637 3.716 40.893
Interlocking polygons 5.118 83.118 0.714 41.409 12.719 26.773 0.000 30.596 16.250 26.687 3.146 18.189
Spatial planning 0.511 0.772 0.016 0.842 0.808 0.633 0.000 1.002 0.770 0.766 0.102 1.120
Token search 0.601 1.879 0.007 1.899 1.193 1.550 0.000 1.682 1.041 1.767 0.196 1.952
Spatial rotations 13.929 54.789 10.577 86.243 27.419 30.149 0.000 40.039 25.341 37.351 3.796 48.654
Group 2
Train Test Train Test Train Test Train Test Train Test Train Test
Digit span 1.634 1.546 1.215 3.919 2.740 1.214 0.000 3.628 3.773 4.629 0.422 1.374
Monkey ladder 0.603 1.050 0.391 1.516 1.195 0.825 0.000 0.716 1.152 0.851 0.362 1.389
Paired associates 2.644 1.225 0.969 4.178 4.027 2.416 0.000 5.004 4.581 2.130 1.791 3.874
Spatial span 0.357 2.593 0.028 3.046 0.652 2.478 0.000 2.466 0.751 2.372 0.240 2.466
Double trouble 8.474 13.615 2.016 12.041 15.649 10.008 0.000 8.619 17.038 16.447 3.580 16.928
Grammatical reasoning 2.238 6.686 0.729 6.252 1.611 5.685 0.000 6.072 3.520 5.613 1.087 7.155
Odd one out 1.061 3.401 0.217 4.667 2.308 2.692 0.000 3.867 1.882 3.502 0.831 3.003
Feature match 19.040 35.524 8.971 48.518 30.590 43.423 0.000 49.285 27.443 41.263 11.028 47.818
Interlocking polygons 11.691 25.903 2.695 34.370 17.917 20.002 0.000 26.527 22.335 20.916 7.757 23.353
Spatial planning 0.357 2.593 0.028 3.046 0.652 2.478 0.000 2.466 0.751 2.372 0.240 2.466
Token search 0.956 2.015 0.046 3.653 2.043 2.002 0.000 2.167 1.859 2.156 0.587 1.927
Spatial rotations 11.381 39.601 5.561 57.657 21.031 42.366 0.000 46.959 22.505 39.065 6.985 45.483
The values in bold are the best values achieved over each CBS test for both train and test sets.
Actually, we have performed a much wider statistical analysis • RMSE for Group 2: all the three statistical tests conclude
than reported here. In fact, for each indicator, and for each that the best-performing algorithm is REPTree.
group, we have also considered three different statistical tests, i.e.,
Friedman, Aligned Friedman, and Quade (Derrac et al., 2011).
Unfortunately, the paper would become too lengthy and would 4. DISCUSSION
contain too many tables if we showed all of them here. In the
following, we report a short summary of the results obtained in The importance of exercise to our overall well-being is well-
this way: documented in the scientific literature. It is recommended
in the prevention and management of various medical
• Pearson for Group 1: for all the three statistical tests the conditions, including cardiovascular disease, metabolic
best-performing algorithm turns out to be the SimpleLinear; syndrome, osteoporosis, and so on. Additionally, the benefits
of exercise extend beyond physiological changes. Exercise
• Pearson for Group 2: all the three statistical tests conclude also benefits mental health, having been shown to improve
that the best-performing algorithm is IBk; self-esteem and self-confidence and to reduce symptoms
of depression.
• MAE for Group 1: there are two algorithms that are However, an often-overlooked aspect of exercise is the effect it
statistically better, namely REPTree and SimpleLinear; has on cognition and the brain. Additionally, as far as reported in
the literature, none of the published studies gives the possibility
• MAE for Group 2: all the three statistical tests conclude that to predict the cognitive performance of the subjects. This
the best-performing algorithm is REPTree; possibility is what we investigate in this paper, and represents
its novelty.
• RMSE for Group 1: SimpleLinear is statistically better for all We have investigated the impact of physical activity on the
the three statistical tests; cognitive performances measured by using a number of different
Frontiers in Human Neuroscience | www.frontiersin.org 11 August 2020 | Volume 14 | Article 312Sannino et al. The Effects of Physical Exercise on Cognition
TABLE 5 | Numerical results, obtained over train and test sets, related to RMSE.
Group 1
SVM MLP REPTree IBk Simple linear Additive
Train Test Train Test Train Test Train Test Train Test Train Test
Digit span 0.941 2.338 0.261 2.606 0.958 1.735 0.000 1.931 1.470 1.607 0.181 2.286
Monkey ladder 0.654 0.495 0.006 0.832 0.382 0.761 0.000 0.707 0.806 0.451 0.032 1.104
Paired associates 0.593 0.715 0.368 1.098 0.865 0.813 0.000 1.255 0.697 0.870 0.092 1.288
Spatial span 0.832 0.990 0.021 1.034 0.021 1.034 0.000 1.207 0.978 0.866 0.128 1.276
Double trouble 12.012 20.763 4.733 22.474 17.863 13.182 0.000 19.834 17.862 8.246 2.857 10.060
Grammatical reasoning 4.225 5.078 0.087 7.165 5.477 6.707 0.000 7.281 5.372 4.099 0.675 6.662
Odd one out 2.054 3.988 0.036 8.136 3.789 3.291 0.000 4.758 3.491 3.094 0.647 4.446
Feature match 19.885 50.603 1.106 77.792 26.870 44.509 0.000 43.991 27.603 49.953 4.563 45.344
Interlocking polygons 9.910 117.538 1.020 51.443 16.021 32.376 0.000 34.413 19.685 33.091 3.855 23.408
Spatial planning 0.832 0.990 0.021 1.034 1.021 0.725 0.000 1.207 0.978 0.866 0.128 1.276
Token search 0.981 2.509 0.008 2.549 1.373 1.990 0.000 2.614 1.170 2.141 0.271 2.660
Spatial rotations 24.112 62.291 13.223 143.750 33.254 39.048 0.000 44.948 30.968 43.005 5.050 61.226
Group 2
Train Test Train Test Train Test Train Test Train Test Train Test
Digit span 6.552 1.972 1.621 8.720 8.089 1.584 0.000 10.258 6.301 5.747 0.487 1.575
Monkey ladder 1.052 1.328 0.442 1.694 1.554 1.083 0.000 1.084 1.382 1.176 0.442 1.949
Paired associates 12.204 1.619 1.130 7.344 11.864 2.637 0.000 15.536 11.452 2.898 3.533 11.200
Spatial span 0.762 6.741 0.036 7.459 0.859 6.701 0.000 7.351 0.884 6.536 0.293 6.729
Double trouble 18.144 17.186 2.429 16.340 26.201 14.090 0.000 10.211 23.233 18.370 4.566 20.857
Grammatical reasoning 3.602 7.882 0.908 7.210 2.463 7.783 0.000 7.636 4.337 6.471 1.537 9.261
Odd one out 1.729 4.983 0.271 6.335 2.874 3.788 0.000 5.226 2.647 4.998 0.998 3.955
Feature match 32.704 61.152 9.573 73.175 42.161 74.114 0.000 69.340 36.938 74.673 13.444 77.258
Interlocking polygons 22.678 29.579 4.139 44.320 24.852 27.111 0.000 34.783 31.378 24.697 11.072 30.006
Spatial planning 0.762 6.741 0.036 7.459 0.859 6.701 0.000 7.351 0.884 6.536 0.293 6.729
Token search 1.656 2.477 0.056 4.343 2.287 2.465 0.000 3.119 2.154 2.709 0.761 2.721
Spatial rotations 19.415 49.498 6.757 68.515 27.172 56.026 0.000 59.338 27.218 53.906 8.882 52.809
The values in bold are the best values achieved over each CBS test for both train and test sets.
TABLE 6 | Statistics of the Wilcoxon test for Group 1 (left), Group 2 (middle), and the two groups joined (right).
Group 1 Group 2 Group 1 & 2
w% wc % w% wc % w% wc %
Digit span 9 2 R 27 10 R 63.5 35 R
Monkey ladder 21.5 8 R 17.5 5 R 73.5 41 R
Paired association 17 10 R 3 3 NR 34 41 NR
Spatial span 20 8 R 20 10 R 87 53 R
Double trouble 0 17 NR 0 13 NR 0 83 NR
Gram. reasoning 24.5 13 R 24 17 R 94.5 83 R
Odd one out 34 13 R 25 10 R 104.5 67 R
Features match 15 17 NR 20 17 R 67.5 91 NR
Interlocking polygons 18.5 17 R 15 17 NR 63.5 91 NR
Spatial rotation 9 17 NR 7 17 NR 32 91 NR
Token search 36.5 17 R 22.5 8 R 111.5 67 R
Spatial planning 0 17 NR 0 13 NR 0 83 NR
cognitive tests taken from CBS. To do this, we have chosen to HRV. In particular, we were interested in knowing whether HRV
use the HRV, because the dynamic autonomic responses during and variations in HRV parameters are associated with changes in
exercise can be measured by analyzing the ECG signal, i.e., the the cognitive domain, that is, how the physical activity, measured
Frontiers in Human Neuroscience | www.frontiersin.org 12 August 2020 | Volume 14 | Article 312Sannino et al. The Effects of Physical Exercise on Cognition
TABLE 7 | The results of the Quade test for the three indicators for the subjects in Group 1.
Simple linear REPTree Additive SVM IBk MLP
Score 2.098 2.955 3.353 3.800 4.048 4.746
Statistic: 11.598 p-value: 0.000
TABLE 8 | Post-hoc procedure for Quade test over Group 1 subjects.
Algorithm p z Bonf. Holm Holl. Rom Finner Li
MLP 0.001 3.312 0.001 0.010 0.010 0.011 0.010 0.038
IBk 0.015 2.439 0.015 0.013 0.013 0.013 0.020 0.038
SVM 0.033 2.129 0.033 0.017 0.017 0.017 0.030 0.038
Additive 0.116 1.570 0.116 0.025 0.025 0.025 0.040 0.038
REPTree 0.284 1.072 0.284 0.050 0.050 0.050 0.050 0.050
Th 0.010 0.013 0.013 0.011 0.030 0.038
TABLE 9 | The results of the Quade test for the three indicators for the subjects in Group 2.
SVM REPTree Simple linear IBk MLP Additive
Score 2.809 3.315 3.350 3.435 3.995 4.096
Statistic: 4.533 p-value: 0.001
TABLE 10 | Post-hoc procedure for Quade test over Group 2 subjects.
Algorithm p z Bonf. Holm Holl. Rom Finner Li
Additive 0.108 1.609 0.108 0.010 0.010 0.011 0.010 0.025
MLP 0.138 1.483 0.138 0.013 0.013 0.013 0.020 0.025
IBk 0.434 0.782 0.434 0.017 0.017 0.017 0.030 0.025
Simp.Lin. 0.499 0.676 0.499 0.025 0.025 0.025 0.040 0.025
REPTree 0.527 0.632 0.527 0.050 0.050 0.050 0.050 0.050
Th 0.010 0.010 0.010 0.0 0.010 0.025
TABLE 11 | The results of the Quade test for the three indicators for all the subjects.
Simple linear REPTree SVM Additive IBk MLP
Score 2.747 3.121 3.325 3.696 3.722 4.388
Statistic: 11.034 p-value: 0.000
TABLE 12 | Post-hoc procedure for Quade test over all the subjects in Groups 1 and 2.
Algorithm p z Bonf. Holm Holl. Rom Finner Li
MLP 0.004 2.892 0.004 0.010 0.010 0.011 0.010 0.026
IBk 0.086 1.717 0.086 0.013 0.013 0.013 0.020 0.026
Additive 0.094 1.673 0.094 0.017 0.017 0.017 0.030 0.026
SVM 0.308 1.019 0.308 0.025 0.025 0.025 0.040 0.026
REPTree 0.510 0.659 0.510 0.050 0.050 0.050 0.050 0.050
Th 0.010 0.013 0.013 0.011 0.020 0.026
by the variation in HRV, impacts on cognitive activities such as CBS tests there is an improvement, or at least a confirmation,
reasoning, work memory, and verbal skills. of the subject’s cognitive ability, both for effort workout (group
We have performed the first analysis to determine whether 1) and for aerobic one (group 2). In particular, reasoning,
the different exercise regimes (aerobic vs. effort exercise) had concentration, and planning tests seem to undergo important
different effects on cognition. It has demonstrated that in most positive changes due to physical exercise.
Frontiers in Human Neuroscience | www.frontiersin.org 13 August 2020 | Volume 14 | Article 312Sannino et al. The Effects of Physical Exercise on Cognition
Secondly, a prediction analysis has been made in order to Additionally, the design of the study allowed us to examine
understand if, by monitoring the HRV during the exercise, it the associations between cognition improvements and physical
is possible to predict the cognitive performance, i.e., the CBS activity, but it did not allow us to establish the temporality of
tests results. The regression analysis has demonstrated that this the observed relationships. As a consequence, we do not know
is possible to some extent, in terms of ρ, MAE, and RMSE. The if the effects of physical activity on cognition are short-term or
results show that the best regression algorithm able to predict last longer.
the cognitive performance by using the HRV is Simple Linear, Finally, unfortunately, there is no guarantee about the
or, subordinately, REPTre. Going into details, the best regression applicability of our results, based on a sample of young and
quality, in terms of ρ, MAE and RMSE, has been reached by a middle-aged adults, to older individuals. However, the results
simple algorithm. presented here are to be considered preliminary and could
Summarizing, this study had numerous strengths, including be used as a starting point for a new and more numerous
the use of a large cognitive test battery, which allowed us to pilot study. In fact, we plan to create a wider data set
examine the effects of exercise on a range of cognitive functions. by enrolling more subjects representative of the population,
We compared two distinct exercise regimes, one of which focused and to make it available to the scientific community. This
on resistance exercise. The effects of long-term resistance exercise would allow us to create a freely available database on this
regimes have not been studied in healthy adults, and thus these specific problem.
results are novel.
Additionally, as mentioned previously, no other studies
have investigated the possibility of predicting cognitive abilities
DATA AVAILABILITY STATEMENT
through a simple mathematical relationship expressed by The datasets used and/or analysed during the current study are
Simple Linear. Our study suggests the possibility of using available from the corresponding author on reasonable request.
this model in a real-time mobile application that, monitoring
HRV during exercise, could predict cognitive performance.
If needed, this application could also suggest the subject ETHICS STATEMENT
to modify the physical training in order to improve the
predicted cognitive performance. This app could be useful within The studies involving human participants were reviewed and
cognitive rehabilitation, where only cognitive digital games approved by CNR Ethics Committee. The patients/participants
are currently employed. In this way, to these latter an app- provided their written informed consent to participate in
monitored personalized physical activity could be associated with this study.
maximizing cognitive improvements. Moreover, this app could
also be applied to support active aging, so as to contribute to AUTHOR CONTRIBUTIONS
avoiding, or at least to slowing down, the onset of pathologies
as, e.g., dementia, cognitive impairment, cognitive decline, and All authors contributed to the conception and the design
so on. of this study. Material preparation and data collection were
Despite these strengths, this study had limitations that should performed by GS. Instead, the analysis was carried out by
be addressed in the future. Among them, one is that no additional GS and ID. The first draft of the manuscript was written
information, as for example the participant’s diet, which is by GS and ID. All authors commented on the previous
recognized in the literature as impacting mental health (Loughrey versions of this manuscript and read and approved the
et al., 2017), was taken into consideration. final manuscript.
REFERENCES and meta-analysis of longitudinal studies. BMC Public Health 14, 1–12.
doi: 10.1186/1471-2458-14-510
Aha, D. W., Kibler, D., and Albert, M. K. (1991). Instance-based learning Booth, F. W., and Lees, S. J. (2006). Physically active subjects
algorithms. Mach. Learn. 6, 37–66. doi: 10.1007/BF00153759 should be the control group. Med. Sci. Sports Exerc. 38, 405–406.
Ahlskog, J. E., Geda, Y. E., Graff-Radford, N. R., and Petersen, R. C. (2011). doi: 10.1249/01.mss.0000205117.11882.65
“Physical exercise as a preventive or disease-modifying treatment of dementia Bouguila, N., and Amayri, O. (2009). A discrete mixture-based kernel for SVMs:
and brain aging,” in Mayo Clinic Proceedings (Rochester, Minnesota: Elsevier), application to spam and image categorization. Inf. Process. Manage. 45,
876–884. doi: 10.4065/mcp.2011.0252 631–642. doi: 10.1016/j.ipm.2009.05.005
Bauman, A., Merom, D., Bull, F. C., Buchner, D. M., and Fiatarone Singh, M. Breslow, L. A., and Aha, D. W. (1997). Simplifying decision trees: a
A. (2016). Updating the evidence for physical activity: summative reviews survey. Knowledge Eng. Rev. 12, 1–40. doi: 10.1017/S026988899700
of the epidemiological evidence, prevalence, and interventions to promote 0015
“active aging.” Gerontologist 56(Suppl_2):S268–S280. doi: 10.1093/geront/ Chan, A.-W., Tetzlaff, J. M., Gøtzsche, P. C., Altman, D. G., Mann, H., Berlin, J. A.,
gnw031 et al. (2013). Spirit 2013 explanation and elaboration: guidance for protocols of
Bherer, L. (2015). Cognitive plasticity in older adults: effects of cognitive training clinical trials. Brit. Med. J. 346, 1–42. doi: 10.1136/bmj.e7586
and physical exercise. Ann. N. Y. Acad. Sci. 1337, 1–6. doi: 10.1111/nyas.12682 Cotman, C. W., Berchtold, N. C., and Christie, L.-A. (2007). Exercise builds brain
Blondell, S. J., Hammersley-Mather, R., and Veerman, J. L. (2014). Does health: key roles of growth factor cascades and inflammation. Trends Neurosci.
physical activity prevent cognitive decline and dementia?: A systematic review 30, 464–472. doi: 10.1016/j.tins.2007.06.011
Frontiers in Human Neuroscience | www.frontiersin.org 14 August 2020 | Volume 14 | Article 312Sannino et al. The Effects of Physical Exercise on Cognition Daskalov, I., and Christov, I. (1997). Improvement of resolution in measurement humans. Eur. J. Neurosci. 8, 353–364. doi: 10.1111/j.1460-9568.1996.tb of electrocardiogram rr intervals by interpolation. Med. Eng. Phys. 19, 375–379. 01219.x doi: 10.1016/S1350-4533(96)00067-7 Owen, A. M., Evans, A. C., and Petrides, M. (1996b). Evidence for a two- Demsar, J. (2006). Statistical comparisons of classifiers over multiple data sets. J. stage model of spatial working memory processing within the lateral frontal Mach. Learn. Res. 7, 1–30. cortex: a positron emission tomography study. Cereb. Cortex 6, 31–38. Derrac, J., Garcia, S., Molina, D., and Herrera, F. (2011). A practical tutorial doi: 10.1093/cercor/6.1.31 on the use of nonparametric statistical tests as a methodology for comparing Owen, A. M., Roberts, A. C., Polkey, C. E., Sahakian, B. J., and Robbins, evolutionary and swarm intelligence algorithms. Swarm Evol. Comput. 1, 3–18. T. W. (1991). Extra-dimensional versus intra-dimensional set shifting doi: 10.1016/j.swevo.2011.02.002 performance following frontal lobe excisions, temporal lobe excisions Erickson, K. I., Voss, M. W., Prakash, R. S., Basak, C., Szabo, A., Chaddock, L., et al. or amygdalo-hippocampectomy in man. Neuropsychologia 29, 993–1006. (2011). Exercise training increases size of hippocampus and improves memory. doi: 10.1016/0028-3932(91)90063-E Proc. Natl. Acad. Sci. U.S.A. 108, 3017–3022. doi: 10.1073/pnas.1015950108 Paterson, D. H., and Warburton, D. E. (2010). Physical activity and Fletcher, G. F., Blair, S. N., Blumenthal, J., Caspersen, C., Chaitman, B., Epstein, functional limitations in older adults: a systematic review related to S., et al. (1992). Statement on exercise: benefits and recommendations Canada’s physical activity guidelines. Int. J. Behav. Nutr. Phys. Act. 7:38. for physical activity programs for all Americans-a statement for health doi: 10.1186/1479-5868-7-38 professionals by the committee on exercise and cardiac rehabilitation of the Prakash, R. S., Voss, M. W., Erickson, K. I., and Kramer, A. F. (2015). council on clinical cardiology, American Heart Association. Circulation 86:340. Physical activity and cognitive vitality. Annu. Rev. Psychol. 66, 769–797. doi: 10.1161/01.CIR.86.1.340 doi: 10.1146/annurev-psych-010814-015249 Garner, S. R. (1995). “WEKA: the Waikato environment for knowledge analysis,” in Rumelhart, D. E., Hinton, G. E., Williams, R. J. (1988). Learning representations Proceedings of the New Zealand Computer Science Research Students Conference, by back-propagating errors. Cogn. Model. 5, 533–536. 57–64. Scherder, E., Scherder, R., Verburgh, L., Königs, M., Blom, M., Kramer, A. F., et al. Hampshire, A., Highfield, R. R., Parkin, B. L., and Owen, A. M. (2014). Executive functions of sedentary elderly may benefit from walking: a (2012). Fractionating human intelligence. Neuron 76, 1225–1237. systematic review and meta-analysis. Am. J. Geriatr. Psychiatry 22, 782–791. doi: 10.1016/j.neuron.2012.06.022 doi: 10.1016/j.jagp.2012.12.026 Lange, K. W., Robbins, T., Marsden, C., James, M., Owen, A., and Paul, G. Sharp, N. C. (1993). Guidelines for exercise testing and prescription. Brit. J. Sports (1992). L-dopa withdrawal in Parkinson’s disease selectively impairs cognitive Med. 27:138. doi: 10.1136/bjsm.27.2.138-a performance in tests sensitive to frontal lobe dysfunction. Psychopharmacology Stone, C. J. (1985). Additive regression and other nonparametric models. Ann. Stat. 107, 394–404. doi: 10.1007/BF02245167 13, 689–705. doi: 10.1214/aos/1176349548 Loughrey, D. G., Lavecchia, S., Brennan, S., Lawlor, B. A., and Kelly, M. E. (2017). Tarvainen, M. P., Niskanen, J.-P., Lipponen, J. A., Ranta-Aho, P. O., The impact of the mediterranean diet on the cognitive functioning of healthy and Karjalainen, P. A. (2014). Kubios HRV-heart rate variability older adults: a systematic review and meta-analysis. Adv. Nutr. 8, 571–586. analysis software. Comput. Methods Programs Biomed. 113, 210–220. doi: 10.3945/an.117.015495 doi: 10.1016/j.cmpb.2013.07.024 Luft, C. D. B., Takase, E., and Darby, D. (2009). Heart rate variability and Tivadar, B. K. (2017). Physical activity improves cognition: possible cognitive function: effects of physical effort. Biol. Psychol. 82, 186–191. explanations. Biogerontology 18, 477–483. doi: 10.1007/s10522-017- doi: 10.1016/j.biopsycho.2009.07.007 9708-6 Luque-Casado, A., Zabala, M., Morales, E., Mateo-March, M., and Sanabria, D. Tsunoda, K., Chiba, A., Chigira, H., Ura, T., and Mizunq, O. (2015). “Estimating (2013). Cognitive performance and heart rate variability: the influence of fitness changes in a cognitive performance using heart rate variability,” in 15th level. PLoS ONE 8:e56935. doi: 10.1371/journal.pone.0056935 IEEE International Conference on Bioinformatics and Bioengineering (BIBE) Makivić, B., Nikić Djordjević, M., and Willis, M. S. (2013). Heart rate variability (Belgrade: IEEE), 1–6. doi: 10.1109/BIBE.2015.7367712 (HRV) as a tool for diagnostic and monitoring performance in sport and Vaynman, S., and Gomez-Pinilla, F. (2006). Revenge of the “sit”: how lifestyle physical activities. J. Exerc. Physiol. 16, 103–131. impacts neuronal and cognitive health through molecular systems that Mateo, J., and Laguna, P. (2000). Improved heart rate variability signal analysis interface energy metabolism with neuronal plasticity. J. Neurosci. Res. 84, from the beat occurrence times according to the IPFM model. IEEE Trans. 699–715. doi: 10.1002/jnr.20979 Biomed. Eng. 47, 985–996. doi: 10.1109/10.855925 World Medical Association (2008). Declaration of Helsinki. Ethical Principles for Mehta, M. A., Owen, A. M., Sahakian, B. J., Mavaddat, N., Pickard, J. D., Medical Research Involving Human Subjects. Available online at: https://www. and Robbins, T. W. (2000). Methylphenidate enhances working memory by wma.net/policies-post/wma-declaration-of-helsinki-ethical-principles-for- modulating discrete frontal and parietal lobe regions in the human brain. J. medical-research-involving-human-subjects/ Neurosci. 20, RC65. doi: 10.1523/JNEUROSCI.20-06-j0004.2000 Zeng, Z.-Q., Yu, H.-B., Xu, H.-R., Xie, Y.-Q., and Gao, J. (2008). “Fast training Ngandu, T., Lehtisalo, J., Solomon, A., Levälahti, E., Ahtiluoto, S., Antikainen, R., support vector machines using parallel sequential minimal optimization,” in et al. (2015). A 2 year multidomain intervention of diet, exercise, cognitive 3rd International Conference on Intelligent System and Knowledge Engineering training, and vascular risk monitoring versus control to prevent cognitive (Xiamen: IEEE), 997–1001. decline in at-risk elderly people (finger): a randomised controlled trial. Lancet Zephyr Technology (2016). New Zephyr BioPatch Monitoring Device for Human 385, 2255–2263. doi: 10.1016/S0140-6736(15)60461-5 Performance. Owen, A., James, M., Leigh, P., Summers, B., Marsden, C., Quinn, N. P., et al. (1992). Fronto-striatal cognitive deficits at different stages of Parkinson’s Conflict of Interest: The authors declare that the research was conducted in the disease. Brain 115, 1727–1751. doi: 10.1093/brain/115.6.1727 absence of any commercial or financial relationships that could be construed as a Owen, A. M., Beksinska, M., James, M., Leigh, P., Summers, B., Marsden, C., et al. potential conflict of interest. (1993). Visuospatial memory deficits at different stages of Parkinson’s disease. Neuropsychologia 31, 627. doi: 10.1016/0028-3932(93)90135-M Copyright © 2020 Sannino, De Falco, De Pietro and Stranges. This is an open-access Owen, A. M., Downes, J. J., Sahakian, B. J., Polkey, C. E., and Robbins, T. article distributed under the terms of the Creative Commons Attribution License (CC W. (1990). Planning and spatial working memory following frontal lobe BY). The use, distribution or reproduction in other forums is permitted, provided lesions in man. Neuropsychologia 28, 1021–1034. doi: 10.1016/0028-3932(90) the original author(s) and the copyright owner(s) are credited and that the original 90137-D publication in this journal is cited, in accordance with accepted academic practice. Owen, A. M., Doyon, J., Petrides, M., and Evans, A. C. (1996a). Planning No use, distribution or reproduction is permitted which does not comply with these and spatial working memory: a positron emission tomography study in terms. Frontiers in Human Neuroscience | www.frontiersin.org 15 August 2020 | Volume 14 | Article 312
You can also read