ASX: QAN US OTC: QABSY - Qantas Airways Limited FY21 Results Presentation 26 August 2021

Page created by Jeremy Burke
 
CONTINUE READING
ASX: QAN US OTC: QABSY - Qantas Airways Limited FY21 Results Presentation 26 August 2021
Qantas Airways Limited
FY21 Results Presentation
26 August 2021
ASX: QAN
US OTC: QABSY
ASX: QAN US OTC: QABSY - Qantas Airways Limited FY21 Results Presentation 26 August 2021
FY21 overview
Protecting the Balance Sheet and commencing the recovery
  •   FY21 Underlying EBITDA1 of $410m, Underlying Loss Before Tax (ULBT)2 of ($1.8)b, Statutory Loss Before Tax of ($2.4)b, despite losing $12b of
      Total Revenue3
  •   Domestic airlines generated $233m of Underlying EBITDA in 2H21 despite >$500m of lockdown impacts4
  •   Positive Statutory Net Free Cash Flow5 for 2H21 driven by domestic recovery, significant Qantas Loyalty cash flow contribution and
      record Freight performance1
Financial resilience
  •   Maintained strong liquidity settings; total liquidity $3.8b6
  •   Debt reduction commenced in 2H21, with Net Debt7 declining from $6.4b in 3Q21 to $5.9b at June 2021
  •   Outflows of deferred payables8, refunds and redundancies totalling $2.8b completed in FY21
  •   Disciplined capital expenditure9 of $693m for FY21
Recovery Plan ahead of target
  •   Delivered $650m in structural cost benefits in FY21, ahead of $600m target; on track for $850m by FY22, and at least $1b by FY23
  •   Enhanced competitive position with ~70% domestic capacity share, leading premium service and low cost carriers, leading Loyalty program
      and significant structural changes to the cost base; record customer Net Promoter Score (NPS) in FY2110

                                                               Balance Sheet repair commenced despite challenging operating environment
          1. Underlying earnings before interest, tax, depreciation, amortisation and impairments (Underlying EBITDA). 2. Underlying LBT is a non-statutory measure and is the primary reporting measure used by the Chief Operating Decision-Making bodies, being the Chief Executive Officer, Group
          Management Committee and the Board of Directors, for the purpose of assessing the performance of the Qantas Group. All items in the FY21 Results Presentation are reported on an Underlying basis, unless otherwise stated. For a reconciliation from Statutory LBT to Underlying LBT, please see
                                                                                                                                                                                                                                                                                                              | 2
          slide 5 of the Supplementary Presentation. 3. Compared to FY19 as a proxy for Pre-COVID performance. 4. Represents Underlying EBITDA impact. 5. Cash from operating activities less net cash used in investing activities. 6. Includes committed undrawn facilities of $1.6b. 7. Net Debt under the
          Group’s Financial Framework includes net on Balance Sheet debt and capitalised aircraft lease liabilities. For a detailed calculation of the Net Debt target range, please see slide 11 in the Supplementary Presentation. 8. Management identified deferred payables at 30 June 2020 through the
          Group’s cash management program. 9. Equal to net investing cash flows included in the Consolidated Cash Flow Statement and the impact to Invested Capital from the disposals/acquisitions of leased aircraft. 10. Record NPS achieved in Jetstar, Qantas Loyalty and QantasLink in FY21.
Recovery Plan ahead of schedule, Balance Sheet repair commenced

                                                                                                          Restructuring and                                                                                              Domestic ramp up and
        Preserving liquidity - 2H20
                                                                                                        Domestic restart - FY21                                                                                       International restart – FY22
•       Acted swiftly to safely hibernate the                                   •         Delivered $650m of cost benefits in FY21, ahead                                                       •          Recovery Plan activities to deliver cost savings of
        business, cut costs and preserve                                                  of target                                                                                                        $850m with >90% initiatives completed or underway
        liquidity
                                                                                •         Maintained cash focus and agile network                                                               •          Highly leveraged to recovery in travel demand as
    –    Boosted liquidity; maintained no                                                 management in addressing highly dynamic                                                                          vaccine roll out progresses with pace
         financial covenants on debt and                                                  environment
         investment grade credit rating                                                                                                                                                                –         Well-positioned to meet expected sharp increase
         (Baa2)                                                                 •         Generated positive Statutory Net Free Cash Flow                                                                        in domestic travel as lockdowns end
                                                                                          in 2H21, allowing Balance Sheet repair to
    –    Disciplined capital allocation1;                                                 commence, accelerating in 4Q21                                                                               –         Ability to respond with a range of fleet types and
         deferred aircraft deliveries                                                                                                                                                                            agile network
                                                                                •         Materially completed cash outflows for deferred
    –    Renegotiated supplier contracts,                                                 payables, refunds and redundancies                                                                    •          Planning for disciplined restart of regular long-haul
         grounded the majority of the fleet,                                                                                                                                                               international passenger services
         stood down ~25,000 employees                                           •         Qantas Loyalty returned to growth2 and achieved
                                                                                          record customer NPS                                                                                          –         Maintaining fleet readiness through IFAM3 and
    –    Improved travel credit conditions                                                                                                                                                                       repatriation flights
         for customers; introduced ‘Fly Well’                                   •         Enhanced customer confidence through ‘Fly Well’
                                                                                          and ‘Fly Flexible’ programs                                                                                  –         Giving customers confidence to fly, as ‘trusted
•       Cut cash costs by ~75% in response                                                                                                                                                                       travel advisor’ through ‘Fly Well’ and investment in
        to 82% fall in Group Total Revenue in                                   •         Conducted international repatriation flights and                                                                       digital health passport
        4Q20                                                                              maintained vital freight routes
                                                                                                                                                                                                •          Continued focus on Balance Sheet repair in FY22
•       Changed Loyalty program to drive                                        •         Maintained strong liquidity and retained Baa2
                                                                                          investment grade credit rating                                                                        •          Continued Qantas Loyalty growth and Freight strength
        member engagement, including tier
        extension                                                                                                                                                                               •          Expect return of entire workforce by end of FY22
               1. Cancelled up to $150m off-market share buy back and interim dividend totalling $201m. Reduced capital expenditure by ~$400m. 2. 2H21 Underlying earnings before interest and tax (EBIT) compared to 2H20 and 1H21. 3. International Freight Assistance Mechanism. See supplementary   | 3
               slide 15 for more information.
Agile management of domestic network addressing highly dynamic demand environment

1
                                   • Highly refined level of coordination between commercial planning
    Transformed                      and operations
                                                                                                                                                                                                          Group Domestic Capacity Profile
     scheduling                    • Rigorous daily capacity optimisation between Network and                                                                                                   (Monthly domestic capacity as a percentage of FY192)
      process                        Revenue Management across Qantas and Jetstar brands                                                                                          100%
                                                                                                                                                                                                                                                                                   92%
                                                                                                                                                                                                                                                                             88%
                                   • Decision making pushed down throughout organisation                                                                                                                                                                               77%                75%
                                                                                                                                                                                   80%
2                                                                                                                                                                                                                                                   63%
                                   • Flights published and selling within two hours of border                                                                                                                                                                    54%
                                                                                                                                                                                   60%                                                                     52%
     Optimising                      announcements to maximise revenue and win share
       cash                        • 95% cash positive flying in FY21, despite sudden border closures,                                                                                                                                      33%
                                                                                                                                                                                   40%
     generation                      due to superior cost and risk management                                                                                                                                                           26%
                                                                                                                                                                                                                                  22%
                                   • 46 new domestic routes announced including 31 launched in                                                                FY211                20%
                                                                                                                                                                                                                      19% 19%
                                                                                                                                                                                                   11%         12%
                                                                                                                                                                                                          8%
3
                                                                                                                                                                                     0%
                                   • Fleet gauge options allows matching of capacity to demand                                                                                        Mar-20              Jun-20             Sep-20            Dec-20             Mar-21            Jun-21
    Flexible fleet                 • New Alliance Aviation E190 deal for lower demand frequency                                                                                                            ≥1 AU city in lockdown              Monthly ASKs as a % of FY19 Capacity
    deployment                       markets complementing existing Dash-8 and 717 fleet
                                   • 737, 787 and A330 aircraft on higher demand frequencies

                                                       Agile network management provides flexibility to adjust to demand and border changes

             1. Announced 39 new routes for Qantas Domestic and 7 new routes for Jetstar Domestic in FY21. Of those, 27 routes were launched by Qantas Domestic and 4 routes were launched by Jetstar Domestic in FY21, with remaining routes to be launched from FY22. 2. 4Q20 capacity includes the
                                                                                                                                                                                                                                                                                                        | 4
             minimum viable network flying which has been historically reported as charter.
Recovery Plan benefits exceeded the FY21 target, with $650m of structural cost benefits delivered

        Ways of Working ~65%1                                                                          Digitalisation/Supplier ~35%1                                Clear pathway to the $1b target by end of FY23
  Improved workforce flexibility and                                                       Efficiencies across the business
  productivity
                                                                                           •       Streamlined and restructured                                       $1b Target Breakdown by Segment
  •   Efficiencies through head office                                                             technology services                                                               Loyalty & Other
                                                                                                                                                                                                                        On track for
      and management restructuring                                                                                                                                   Jetstar Group                                       $850m by
                                                                                           •       Restructured sales and distribution                                                                                     FY22
      including consolidating teams                                                                                                                                                  9% 2%
                                                                                                   model                                                                                                     Qantas
  •   Variabilised costs and created                                                                                                                                                                         Domestic
      operational team efficiencies                                                        •       Consolidation of property leases
                                                                                                                                                                                                       48%
      across the Qantas Group                                                              •       Freight terminals optimisation                             Qantas                                                       >90% of
                                                                                                                                                                              41%                                        initiatives
      including cabin crew,                                                                                                                                   International
      engineering, ground handling                                                         •       Supplier savings across various                            & Freight                                                 complete or
                                                                                                   categories of spend (e.g. lounge                                                                                       initiated2
  •   ~9,400 exits in FY21 against the                                                             management, marketing and
      target of at least 8,500                                                                     sponsorship, utilities, engineering
                                                                                                   supply chain)
                                                                                                                                                                     Parallel focus targeting additional transformation
                                                                                                                                                                                 to offset ongoing inflation

             Dual focus on cost restructuring and inflation ensures $1b restructuring program will translate to sustainable earnings uplift

          1. Percentage of $650m FY21 restructuring cost benefits. 2. Initiatives to achieve $1b in restructuring cost benefits by FY23 as at 30 June 2021.
                                                                                                                                                                                                                                       | 5
Recovery Plan scorecard
                                                                                                                                      TARGET

                               KEY AREA OF FOCUS                                                                    METRICS                                                            TIMEFRAME                                                               AS AT 30 JUNE 2021

                                                                         Restructuring cost benefits of $0.6b in FY21, $0.8b by FY22, $1.0b by FY23                                        FY23                          Achieved $650m of cost benefits in FY21; Targeting $850m by FY22

                                  Cost savings                                                  Increased target to at least 8,500 exits                                                   FY21                                                        ~9,400 exits completed
                                                                                                                                                                                                                                                                                                                            
                                                                                 Group Unit Cost (ex-fuel and depreciation) 10% less than FY20                                             FY23                                                       Restructuring in progress

                                                                                                     Gross debt reduction1 of $1.75b                                                       FY23                                                Debt reduction commenced in 4Q21
                         Deleverage the Balance Sheet
                                                                                                                                                                                                                            Debt reduction commenced in 4Q21; Restructuring in progress
                                                                                                      Net Debt2 / EBITDA
ESG overview and proposition

Environmental                                                                                     Social                                                           Governance

 Our Planet                                                                                         Our People                                                     Our Governance
 •   Despite the impacts of COVID-19, the Group is                                                  •        Operating cash positive flying across the Group       •   New Group Management Committee role – Chief
     strongly committed to building business resilience to                                                   airlines to bring people back to work sooner              Sustainability Officer – and sustainability team to
     manage the significant physical and transitional                                                                                                                  accelerate and deepen our commitment to net zero
                                                                                                    •        Successfully advocated for industry support for our
     risks of a changing climate                                                                                                                                       emissions by 2050 along with the implementation of
                                                                                                             people who were impacted by ongoing stand downs
                                                                                                                                                                       our wider ESG strategy
 •   The Group’s Sustainability commitments have three
                                                                                                    •        Partnering with government and >300 organisations
     focus areas:                                                                                                                                                  •   Enhanced safety governance framework, with
                                                                                                             to provide support and secondary employment
                                                                                                                                                                       continued focus on safety of customers and
      11.   Primarily, reach net zero emissions by 2050                                                      opportunities for our people
                                                                                                                                                                       employees as our first priority
            through investment in Sustainable Aviation
                                                                                                    •        Protecting our people through ‘Fly Well’ and ‘Work
            Fuel, new aircraft technology and participation                                                                                                        •   Monitoring global developments in laws, regulations
                                                                                                             Well’ programs including taking a leading stance on
            in carbon markets                                                                                                                                          and business practices to ensure an effective
                                                                                                             vaccinations and strengthening focus on employee
                                                                                                                                                                       governance framework is in place to protect, create
     22.    Reduce waste and single use plastic through                                                      mental health and wellbeing
                                                                                                                                                                       and enhance stakeholder value
            its waste reduction program
                                                                                                    Our Community
                                                                                                                                                                   •   Proven resilience during COVID-19, reflecting a
     33.    Institutionalise ESG by enhancing Board and
                                                                                                    •        Operating repatriation flights to bring Australians       sound, adaptive risk management framework
            Executive accountability through TCFD1
                                                                                                             home and providing critical freight services
            disclosures and developing an interim                                                                                                                  •   Leveraging insights of external stakeholders to
            emissions reduction target                                                              •        Prioritised ethical business activities and human         identify key environmental and social risks, trends
                                                                                                             rights through: supplier due diligence; supporting        and priorities, such as Global Compact Network
 •   Aligning to the Climate Action 100+ sustainability
                                                                                                             indigenous and small businesses; signatory to the         Australia (GCNA) membership
     principles
                                                                                                             UNGPs2; and our modern slavery statement

                                                          Continued commitment to acting responsibly, respecting our social licence to operate

              1. Task-force on Climate Related Financial Disclosures. 2. United Nations Guiding Principles on business and human rights.
                                                                                                                                                                                                                             | 7
FY21 Environmental progress

ESG Focus Area                                   Progress as at 30 June 2021

                1
                                                   •       First airline group to commit to capping net emissions1 and one of the first to commit to net zero emissions by 2050
                                                   •       Aiming for 1.5 per cent average annual fuel efficiency improvements through fleet renewal and increased operational efficiency

                      Reach net                    •       Matched customer contributions through Fly Carbon Neutral Program and offered 10 Qantas Points per dollar spent
                         zero                            –       One of the highest uptakes of customer offsetting globally, with all contributions directly funding accredited environmental projects
                     emissions by                        –       21 per cent of contributions invested to support indigenous-led environmental regeneration projects
                        2050                       •       Committed to invest $50m towards Sustainable Aviation Fuels (SAF) industry development in Australia
Environmental

                                                         –       Strategic partnership with bp Australia announced in January 2021 to develop production of SAF by 2025
                                                         –       Collaborating with government and industry to design policies that support commercialisation of SAF in Australia

                2      Reduce
                                                    •        FY21 waste reduction targets impacted by operational constraints of COVID-19, including the introduction of ‘Fly Well’ onboard offering
                      waste and
                      single use                    •        Developing a revised waste reduction strategy that continues to drive elimination of single use plastics and year-on-year reductions in waste diverted
                                                             to landfill
                       plastics
                3
                                                    •        Enhance ESG governance and accountability at Board, Group Management Committee and Senior Management levels
                    Institutionalise                •        Aim to develop updated climate risk scenario analysis as part of Taskforce for Climate-related Disclosure (TCFD) commitments in FY22
                          ESG                       •        Assess and publish an emissions reduction pathway to meet 2050 net zero target and develop an interim target in FY22, including formalisation of an
                                                             internal carbon price, to be applied by FY23

                                                             Progress towards sustainability commitments in FY21, with renewed targets to be set in FY22

                         1. Announced 11 November 2019 and includes Qantas, Jetstar, QantasLink and Qantas Freight. Originally capped at 2020 level, however baseline revised from 2020 to 2019 to better represent Pre-COVID operating conditions.
                                                                                                                                                                                                                                                      | 8
Financial performance
FY21 key Group financial metrics

Profit metrics                                                             Balance Sheet metrics                                                                                                                                               Other statistics (v FY19)

  $410m                                                                        ($386)m                                                                             $3.8b                                                                            (81%)
  Underlying EBITDA                                                            Statutory operating cash flow                                                       Total liquidity                                                                  ASKs4

                                                                               ($861)m 1H21 / $475m 2H21
  ($1,525)m                                                                                                                                                        $5.9b                                                                            (85%)
  Underlying EBIT1 loss                                                                                                                                            Net Debt                                                                         RPKs5
                                                                               $693m
  ($1,826)m                                                                    Net capital expenditure                                                             $6,248m/$5,516m                                                                  (67%)
  Underlying loss before tax2                                                                                                                                      FY21 average Invested                                                            Group Total Revenue6
                                                                               $2,221m                                                                             Capital/Invested Capital as
  ($2,351)m                                                                    Cash and cash equivalents                                                           at 30 June 20213                                                                 (62%)
  Statutory loss before tax                                                                                                                                                                                                                         Group Operating
                                                                                                                                                                                                                                                    Expenses7

          1. Earnings before interest and tax (EBIT). 2. Underlying LBT is a non-statutory measure and is the primary reporting measure used by the Chief Operating Decision-Making bodies, being the Chief Executive Officer, Group Management Committee and the Board of Directors, for the purpose of
          assessing the performance of the Qantas Group. All items in the FY21 Results Presentation are reported on an Underlying basis unless otherwise stated. Refer to slide 5 of the Supplementary Presentation for a reconciliation of Underlying to Statutory LBT. 3. Refer to slide 9 of the
          Supplementary Presentation for the invested capital calculations. 4. Available Seat Kilometres. Total number of seats available for passengers, multiplied by the number of kilometres flown. Compared to FY19 as a proxy for Pre-COVID performance. 5. Revenue Passenger Kilometres. Total    | 10
          number of passengers carried, multiplied by the number of kilometres flown. Compared to FY19 as a proxy for Pre-COVID performance. 6. Group Total Revenue compared to FY19 used as a proxy for Pre-COVID performance. 7. Group gross expenditure excluding depreciation and amortisation,
          impairment/(reversal of impairment) of assets and related costs, share of net loss/(profit) of investments accounted for under the equity method and discount rate changes impact on provisions compared to FY19 as a proxy for Pre-COVID performance.
FY21 Profit Bridge compared to FY19
                              Group Total Revenue                                    Activity-based, rightsizing and
                                 decline $12.0b                                       restructuring benefits $8.9b

    1,326

                                                Manpower cost benefit            $   483 m
                                                Other cost benefits              $   167 m                                                 14          (13)                96              (152)
                                                Restructuring benefits           $   650 m                             1,216                                                                             (1,826)

                                                                                                      2,468
                   (11,930)

                                                                                                                          Selling & Marketing            $    696 m
                                                                                        2,240                             Computer & comms               $    168 m
                                                                                                                          Capacity hire                  $    173 m
                                                                                                                          Other items                    $    179 m
                                                                                                                          Other Expense Reduction        $   1,216 m
                                                                         3,011

                                     345              (447)
     FY19         Net Passenger   Net Freight    Other Revenue            Fuel         Manpower        Aircraft   Other Expenses    Depreciation &   Impairment        Discount rate    Share of losses    FY21
 Underlying PBT     Revenue        Revenue                                                            Operating                      Amortisation     of Assets         changes on     from Associates Underlying LBT
                                                                                                       Variable                                                          provisions

                                                                                                                                                                                                                    | 11
Items not included in Underlying LBT

$M                                                                                                                                      FY21 Comments
                                                                                                                                                     Redundancies incurred as part of the Recovery Plan not previously
Recovery Plan restructuring costs                                                                                                         319
                                                                                                                                                     provided for in FY20
                                                                                                                                                     Including A380 fleet impairment due to fall in AUD market values and
Impairment of assets and related costs                                                                                                    257
                                                                                                                                                     retirement of 2 hulls as well as the impairment to the Jetstar Asia fleet
Net gain on disposal of assets                                                                                                            (18) Including gain on sale of share of JUHI2 assets
Net de-designation of fuel and foreign exchange hedges                                                                                   (33)
Total items not included in Underlying LBT1                                                                                               525

          1. Items which are identified by Management and reported to the Chief Operating Decision-Making bodies as not representing the underlying performance of the business are not included in Underlying LBT. The determination of these items is made after consideration of their nature and
                                                                                                                                                                                                                                                                                                           | 12
          materiality and is applied consistently from period to period. Items not included in Underlying LBT primarily result from revenues and expenses relating to business activities in other reporting periods, transformational/restructuring initiatives, transactions involving investments and
          impairments of assets and other transactions outside the ordinary course of business. 2. Joint User Hydrant Installation.
2H21 Movement in cash position

                                                                Financing Cash Outflows                                                                                    Statutory Net Free Cash Flow
                                                                       ($652)m 1                                                                                                      $267m

                                                                                                                                                                                               (837)
     2,606                               115
                                                                                                                                                         1,312
                                      Term loan
                                                                             (557)
                                                                                                                                                                                              Includes                 (208)
                                                                                                                                                                                          redundancy and                                  2,221
                                                                                                                                                                                        restructuring costs,
                                                                                                                                                                                                                   Includes aircraft
                                                                      Amortising secured                                                                                                    refunds and
                                                                       debt repayment                              (210)                                                                deferred payables2
                                                                                                                                                                                                                      capitalised
                                                                                                                                                                                                                     maintenance
                                                                      ($227)m and Bond
                                                                                                               Includes lease                         Cash flows
                                                                         repayment
                                                                                                                   liability                        generated from
                                                                          ($330)m
                                                                                                                repayments                          operations and
                                                                                                                                                    working capital
                                                                                                                                                   benefits, excludes
                                                                                                                                                       one-offs

                                                                                                                                                         Statutory Operating Cash flow
                                                                                                                                                                    $475m
   31 Dec 20             Unsecured Debt Raised                     Debt Repayments                   Other Financing Costs                      Underlying                                  One-offs           Investing Cash Flow      30 Jun 21
  Cash Balance                                                                                                                              Operating Cash Flow                                                                        Cash Balance

                                                     Statutory net free cash flow positive for 2H21; Balance Sheet repair has commenced

          1. Includes the impact of FX, $3m reported in the Cash Flow Statement for 2H21. 2. Management identified deferred payables at 30 June 2020 through the Group’s cash management program.
                                                                                                                                                                                                                                                      | 13
Net Debt and liquidity position
                                                                                  As at 30                   As at 30                                                    •       Net Debt increased by ($1.2)b for the 12 months to June 2021
$M                                                                                                                                        VLY $M4
                                                                                  June 21                    June 20                                                             primarily driven by:
Current interest-bearing liabilities on                                                                                                                                        — Underlying operating cash flow of $2.4b
                                                                                            969                        868                       (101)
balance sheet
Non-current interest-bearing liabilities on                                                                                                                                    — One-off outflows including redundancies of ($2.8)b
                                                                                         5,861                     5,825                          (36)
balance sheet                                                                                                                                                                  — Capex of ($0.7)b
Cash at end of period                                                                 (2,221)                    (3,520)                    (1,299)
                                                                                                                                                                         •       Significant borrowing activity for the period included:
Net on Balance Sheet debt1                                                             4,609                        3,173                  (1,436)
                                                                                                                                                                               — FY21 new borrowings of $0.9b made up of $0.7b unsecured
Capitalised aircraft lease liabilities2                                                  1,281                       1,561                        280                            and $0.2b secured borrowings

Net Debt3                                                                              5,890                       4,734                    (1,156)                            — Repayment of ($0.4)b secured amortising debt
                                                                                                                                                                               — Repayment of ($0.4)b bond which matured in June 2021
                                                                                  As at 30                   As at 30
$M                                                                                                                                        VLY $M4                        •       Increased committed undrawn facilities of $1.6b
                                                                                  June 21                    June 20
Cash and cash equivalents at end of                                                                                                                                      •       The Group also maintains an unencumbered asset base of >$2.5b
                                                                                        2,221                      3,520                    (1,299)
period                                                                                                                                                                           including aircraft5, land, spare engines and other assets
Undrawn facilities                                                                       1,575                      1,000                          575
Total liquidity                                                                         3,796                      4,520                       (724)

            1. Net on Balance Sheet debt includes interest-bearing liabilities and the fair value of hedges related to debt reduced by cash and cash equivalents. 2. Capitalised aircraft lease liabilities are measured at fair value at the lease commencement date and remeasured over lease term on a     | 14
            principal and interest basis akin to a finance lease. Residual value of capitalised aircraft lease liability denominated in foreign currency is translated at the long-term exchange rate. 3. Net Debt under the Group’s Financial Framework includes net on Balance Sheet debt and capitalised
            aircraft lease liabilities. 4. Unfavourable variance shown as negative amounts. 5. Aircraft valuations based on the average of Aircraft Value Analysis Company Limited (AVAC) and AVITAS market values as at 30 June 2021.
Segment Results
Qantas Domestic
•    Strong leisure-led recovery delivering a positive Underlying EBITDA                                                                                                                                                                                                              Pre-COVID
                                                                                                                                                                                                                                                 FY21                  FY20
                                                                                                                                                                                                                                                                                           FY19
    — Strong demand recovery in 4Q21 with capacity at 86% of Pre-COVID levels1 by May
      2021; seat factor recovery to 64%2                                                                                                                                     Revenue                                           $M               2,745                 4,672                      6,098
    — Variabilisation of cost base underpinning ability to respond to border closures                                                                                        Underlying EBITDA                                 $M                   159                   907                    1,503
    — Yield premium growth3; average fares maintained4
                                                                                                                                                                             Underlying EBIT                                   $M               (590)                      173                    778
    — Corporate and SME recovery ahead of expectations, 34 new accounts won in FY215
                                                                                                                                                                             Operating Margin8                                   %
Qantas International (including Freight)
•   Record Freight profit1 supported by surging domestic e-commerce trends and strong                                                                                                          Pre-COVID
    international yields                                                                                                                                                      FY21     FY20
                                                                                                                                                                                                    FY19
    — Freight providing a significant natural hedge to international passenger business,                                                             Revenue             $M   1,598    6,077       7,420
      materially covering international airline cash holding costs
                                                                                                                                                     Underlying EBITDA   $M     117     846        1,045
    — Support of Australian exports via International Freight Assistance Mechanism (IFAM)
    — Ongoing fleet renewal program with 3 x A321 converted freighters by December 2021                                                              Underlying EBIT     $M   (575)      56         323

    — Australian freight market leadership underpinned by long-term customer contracts                                                               Operating Margin    %      $400m by FY233
•    Well-positioned for restart of international operations and to take advantage of international travel bubbles when they emerge
    — Existing joint business agreements (JBAs) maintained (American, Emirates, China Eastern); proposed JBA with Japan Airlines under regulatory consideration

                                                                                Well-positioned for efficient restart of international operations

            1. Underlying EBITDA. 2. FY19 Available seat kilometres as a proxy for Pre-COVID performance. 3. Cumulative recovery program benefits.
                                                                                                                                                                                                      | 17
Jetstar Group
•    Achieved Underlying EBITDA profit1 driven by 2H21 domestic leisure strength, cost                                                                                                                                                                                                   Pre-COVID
                                                                                                                                                                                                                                                    FY21                  FY20
     variabilisation and $70m in recovery program benefits delivered                                                                                                                                                                                                                          FY19
    — $145m AU Domestic Underlying EBITDA with $102m in second half as capacity                                                                                                Revenue6                                          $M                1,140                 3,006                       3,961
      increased to 77% of Pre-COVID levels2, EBIT profitable in 4Q21
                                                                                                                                                                               Underlying EBITDA7
    — ($143)m Underlying EBITDA loss from AU International, NZ and Jetstar Asia due to                                                                                         excluding Share of Associates                     $M                         2                485                        830
                                                                                                                                                                               (Losses)/Profits
      ongoing lack of international flying and associated fixed costs
                                                                                                                                                                               Underlying EBIT                                   $M                (550)                     (26)                       400
•    ($131)m loss attributable to share of Jetstar Japan statutory loss due to multiple
     states of emergency and higher fixed costs with fully leased fleet                                                                                                        Operating Margin                                     %
Qantas Loyalty
•    Group cash contribution >$1b of gross receipts1 in FY21                                                                                                                                                                                                                                Pre-COVID
                                                                                                                                                                                                                                                      FY21                  FY20
                                                                                                                                                                                                                                                                                                 FY19
•    Diversified portfolio strategy delivering second half earnings growth2
                                                                                                                                                                                Revenue8                                           $M                   984                 1,224                      1,654
    — Spend on Qantas Points Earning Credit Cards returned to Pre-COVID                                                                  levels3       in 4Q21;
      Maintaining ~35% share of credit card spend                                                                                                                               Cash Contribution1                                 $M               1,006                    1,231                         977
    — Early indicators of renewed credit card demand
                                                                                                                                                                                Underlying EBIT9                                   $M                   272                     341                        376
    — 500k+ members earning Qantas Points with bp Australia since                                                              partnership launch4
                                                                                                                                                                                Operating Margin10                                    %                27.6                    27.9                       22.7
    — Record points redeemed in the Qantas Rewards Store and Qantas Wine; continued
      growth in Qantas Insurance5
                                                                                                                                                                                QFF Members11                                         M                13.6                    13.4                       12.9
    — Travel related products continue to remain sensitive to border announcements; record
      domestic flight redemptions in March 2021 indicate strong underlying demand
•    Growth in members and continued strength in member engagement; supported by program generosity, FY21 NPS at record levels
    — Increased availability of Classic flight rewards by up to 50% to the most popular destinations across Australia6
    — Greater flexibility provided to members using flight rewards by waiving change and cancellation fees
    — Status accelerator offer for Gold members of other loyalty programs – 20k members registering for the offer, new ways to earn on the ground
    — Relaunched Qantas Points Club7 increasing travel and lifestyle benefits – making earning points on the ground more rewarding
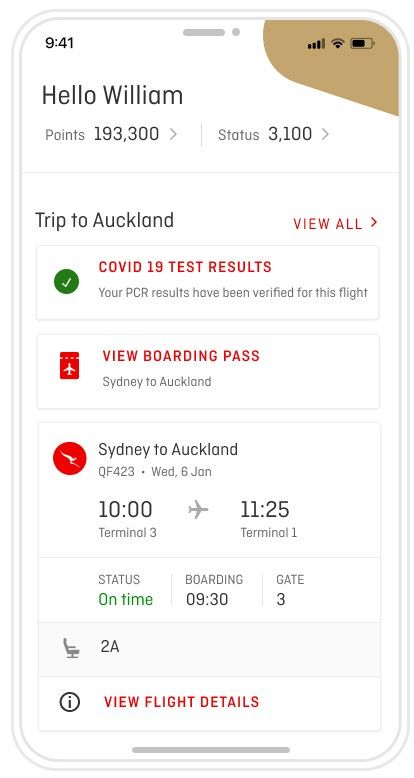
•    Continued investment in leading digital experiences and new businesses; integration of Qantas Loyalty within existing Qantas App from May 2021
                                                                          Strong cash generation underpinned by record member engagement

            1. Sales to all external parties. 2. 2H21 Underlying EBIT compared to 2H20 and 1H21. 3. Compared to corresponding FY19 period as a proxy for Pre-COVID performance. 4. Partnership launched in April 2020. 5. Health, Life, Motor and Home customers in force as at 30 June 2021 compared to 30 | 19
            June 2020. 6. As announced 14 July 2020. 7. Qantas Points Club relaunched May 2021. 8. Includes revenue from points sales to external partners, commissions received, revenue generated through Qantas Wine, Qantas Store, Qantas Shopping and points issued and redeemed on Qantas
            Group and partner airlines. 9. During FY21, Qantas Loyalty reviewed the criteria applied in assessing the capitalisation of intangible assets. Due to the mix of projects undertaken during FY21, an increased proportion of spend has been expensed. This policy will apply for future periods and has
            not impacted the Net Free Cash Flow result of Qantas Loyalty. 10. Operating Margin calculated as Underlying segment EBIT divided by total segment revenue. 11. Members at 30 June for corresponding period.
Financial Framework
Financial Framework will continue to guide our capital decisions

                                      1                                                                                                         2                                                                                                        3
     Maintaining an optimal capital structure                                                                                     ROIC2 > WACC3                                                                             Disciplined allocation of capital
                                                                                                                                through the cycle
        Minimise cost of capital by targeting                                                                                                                                                                           Grow invested capital with disciplined
        a Net Debt range of $4.5b to $5.6b1                                                                                    Deliver ROIC >              10%4                                                           investment, return surplus capital

    Maintained strong liquidity and minimal                                                                     Investing to create competitive                                                                         Prioritising debt reduction,
               refinancing risk.                                                                                  advantages and drive value                                                                       minimising capex and no shareholder
     Recovery plan to optimise Net Debt                                                                                                                                                                                         distributions

                                                                                                            Maintainable EPS5 growth over the cycle

                                                                                                  Total shareholder returns in the top quartile6

        1. Refer to slide 11 of the Supplementary Presentation for calculation of target Net Debt range. 2. Return on Invested Capital (ROIC). Refer to slide 10 of the Supplementary Presentation for the calculation of ROIC. 3. Weighted Average Cost of Capital (WACC), calculated on a pre-tax basis. 4.
                                                                                                                                                                                                                                                                                                                | 21
        Target of 10% ROIC allows ROIC to be greater than pre-tax WACC. 5. Earnings Per Share. 6. Target Total Shareholder Returns within the top quartile of the ASX100 and global listed airline peer group as stated in the 2020 Annual Report, with reference to the 2020-2022 LTIP.
Maintaining an optimal capital structure

                                                                                                                                                                      Capital structure and liquidity
                     Debt maturity profile as at 30 June 2021                                                 ($M)1
                                                                                                                                                                      •       Net Debt2 at $5.9b, prioritising debt reduction
                                                                                                                                                                      •       Total liquidity of $3.8b including $2.2b cash3 and committed
                                                                                                                                                                              undrawn facilities of $1.6b maturing in FY23 and FY24
    300                          250                                                                                                                                  •       Unencumbered asset base >$2.5b4, including 41% of the Group
                                                                                                                                                                              fleet5, land, spare engines and other assets
                                                                                                                                                   500
                                                                                                                                                                      Debt structure

    685         669              684
                                                 440
                                                                 350
                                                                                                  500
                                                                                                                  450              425                                •       Balance Sheet repair commenced in 2H21
                                                                                  300
                                                                                                                                                   375                      — Net Debt at $6.4b in February 2021, reduced to $5.9b at
                                                 183              187             167             155              144             144                                        June 2021
    FY22       FY23             FY24            FY25            FY26             FY27            FY28             FY29            FY30            FY31                      — Maturing secured debt facilities in FY22 to FY24 will
                                                                                                                                                                              unencumber mid-life aircraft
           Secured amortising debt                                                            Corporate Secured Debt Program                                                — AUD $300m bond maturing in May 2022
           Bonds                                                                              Syndicated Loan Facility - Drawn
                                                                                                                                                                      •       No financial covenants
                                                                                                    • Maintained Investment Grade credit rating from Moody’s (Baa2)
                                           Maintained strong liquidity and minimal refinancing risk; Recovery Plan prioritising debt reduction

           1. Cash debt maturity profile excluding leases. 2. Net Debt includes on Balance Sheet debt and capitalised aircraft lease liabilities under the Group’s Financial Framework. Capitalised aircraft lease liabilities are measured at fair value at the lease commencement date and remeasured over       | 22
           lease term on a principal and interest basis akin to a finance lease. Residual value of capitalised aircraft operating lease liability denominated in foreign currency is translated at the long-term exchange rate. 3. Includes cash and cash equivalents as at 30 June 2021. 4. Aircraft valuations
           based on the average of Aircraft Value Analysis Company Limited (AVAC) and AVITAS market values as at 30 June 2021. 5. Based on number of aircraft as at 30 June 2021. The Group Fleet totalled 311.
Historical operating cash flow trend

                                     Statutory EBITDA ($M)1                                                                                        •       Positive statutory EBITDA of $0.15b for FY21
                                                        Pre-COVID                                                                                        – Includes impact of $0.3b redundancies

      3,108                  3,334                       3,431                                                                                     •       FY21 Statutory operating cash flow of ($386)m;
                                                                                    1,064                                                                – FY21 underlying operating cash flow of $2.4b
                                                                                                                  149
      FY17                    FY18                       FY19                        FY20                        FY21                                    – Significant one-off cash outflows2 materially complete
                                                                                                                                                   •       Recovery to at least Pre-COVID operating cash flow
                                                                                                                                                           generation to be enabled by
                           Statutory Operating cash flow ($M)
                                                                                                                                                         – Growth of domestic operations
                                                       Pre-COVID

      2,704                  3,413                       3,164                                                                                           – Restart of international flying contributing to significant
                                                                                    1,083                                                                  Revenue Received In Advance (RRIA) rebuild
                                                                                                                                                         – Recovery Plan cost saving benefits
                                                                                                                (386)
      FY17                    FY18                       FY19                        FY20                        FY21                                    – Cash flow benefits due to tax losses

                                Recovery to historically strong operating cash flow generation enabling accelerated Balance Sheet repair

        1. For comparability, FY17 and FY18 Statutory EBITDA also excludes non-cancellable aircraft operating lease rentals (as these financial years are prior to AASB 16). 2. One-off cash outflows include redundancy and restructuring costs, refunds and deferred payables. Management identified   | 23
        deferred payables at 30 June 2020 through the Group’s cash management program.
Robust fuel and FX risk management

FY21 actual fuel cost and hedge accounting impacts                                                                       Fuel cost ($B)

•   FY21 fuel cost of $0.8b, down $3.0b from FY19 through 74% reduction in                                                    -3.0
    consumption and lower AUD jet fuel price; 2H21 fuel cost of $526m
•   Hedge accounting impact of $33m gain in FY21 relating to revaluation of ineffective
    hedges de-designated in FY20, excluded from Underlying LBT                                                     3.8

                                                                                                                                          0.8
Looking ahead
                                                                                                                 FY19                   FY21
•   1H22 fuel cost is expected to be higher than 1H21, in line with higher forecast fuel
    consumption
                                                                                                           Indicative fuel consumption FY21
•   1H22 fuel price risk is fully hedged                                                                     Freight

    — Majority of hedging in outright options                                                                          25%                      Qantas
                                                                                                                                                Domestic
    — Outright options in place to cover fuel price risk arising from additional 1H22 flying                                            47%
      under an accelerated recovery scenario
    — Hedging protects against short-term spikes in fuel prices whilst minimising risk of                              25%
      ineffective hedge losses should a change in the operating environment occur                      Jetstar Group          3%
                                                                                                                               Qantas International

                                    Hedging activity remains consistent with long term approach to risk management

                                                                                                                                                           | 24
Disciplined capital allocation
                                                                                                                                                                            Capital expenditure                                      Shareholder Capital Movements ($B)
                                                                                                                                                                                    ($B)
Disciplined capital expenditure
                                                                                                                                                                                     -0.4                                                                                     +2.8
•   Net capital expenditure1 of $693m in FY21, including capitalised
    maintenance on operational fleet and delivery of the first of three                                                                                                                                     -0.9

    A321-200P2F freighters
•   FY22 capital expenditure2 expected to be $800m                                                                                                                          2.0                                                                                     4.3
                                                                                                                                                                                                  1.6

                                                                                                                                                                                                                        0.7                                                               1.4

                                                                                                                                                                         FY20F                 FY20                   FY21                                     6 Year     Equity
                                                                                                                                                                                               Actual                Actual                                 Shareholder Raise & SPP
                                                                                                                                                                                                                                                            Distributions
                                                                                                                                                                                                                        Shares on Issue (M)
Shareholder capital movements
                                                                                                                                                                                                                                    -14%
•   Additional $72m            equity3 raised
                                 through retail Share Purchase Plan
    (SPP) adding 22.6m new ordinary shares to supplement institutional
    placement completed in FY20                                                                                                                               2,196 2,062
                                                                                                                                                                          1,919 1,832 1,808 1,745 1,684                                                                          1,863 1,886 1,886
                                                                                                                                                                                                        1,626                                             1,571       1,491

                                                                                                                                                               30   31   30   31   30   31   30   31   30   31   30   31   30
                                                                                                                                                              Jun Dec Jun Dec Jun Dec Jun Dec Jun Dec Jun Dec Jun
                                                                                                                                                              2015 2015 2016 2016 2017 2017 2018 2018 2019 2019 2020 2020 2021

                                                                         Conservative capital allocation as focus turns to Balance Sheet repair

           1. Equal to net investing cash flows included in the Consolidated Cash Flow Statement and the impact to Invested Capital from the disposals/acquisitions of leased aircraft. 2. Net capital expenditure excluding any potential proceeds from the sale of land. 3. Retail Share Purchase Plan   | 25
           completed on 10 August 2020.
Fleet strategic priorities

Qantas Group fleet strategy

                                                            Recovery phase
      Right aircraft
                                                            •        Deferred delivery of 787-9s and A321neos to meet the Group's requirement
       Right route                                          •        A380s remain in storage
                                                            •        Reallocated 6 x A320s to QantasLink fleet to service intra Western Australia resources market
                                                            •        A330s and 787-9s redeployed supporting IFAM1, repatriation services and domestic flying
                                                            •        Delivery of first A321 converted freighter, with additional two by December 2021
   Maintain flexibility
                                                            •        Successfully completed conversion of 11 lease extensions into ‘power by the hour’ rentals increasing cost
                                                                     variability through the recovery phase
                                                            •        Reallocation of Jetstar international aircraft2 to optimise domestic capacity in FY22
                                                            •        Up to 18 x E190s on capacity hire arrangement with Alliance Aviation
       Maintain
    competitiveness                                         •        Low fleet utilisation through COVID-19 has deferred timing of maintenance and fleet replacement requirements3

                                                  Maintaining flexibility of operational fleet to optimise capitalised maintenance expenditure

          1. International Freight Assistance Mechanism. See supplementary slide 15 for more information. 2. Includes aircraft from Jetstar’s Australian international operations as well as Jetstar Asia and Jetstar Japan. 3. See supplementary slide 17 for more information.   | 26
Looking ahead
Vaccine supply and uptake suggests 80% threshold to be reached by December 2021

                                                                                                                                                                                           •       Sufficient vaccine dosages available by early October to
                                                      Potential Australia Vaccination Timing1                                                                                                      achieve 80% of eligible Australians vaccinated; supply
                                                                                                                                                                                                   ramping up from September 2021
                   100%
                                                                                                                                                                                           •       Based on current rate of uptake and global benchmarks,
                   90%                                                                                                                                                                             Australia should hit national thresholds2 for reopening in
                                                                                                                                                                                                   December 2021:
                   80%
                                                                                                                                                                                                        — Phase B threshold of 70% vaccination of eligible
                   70%
                                                                                                                                                                                                          population – eased restrictions on vaccinated
Total Population

                                                                                                                                                                   80% Eligible
                   60%                                                                                                                                                                                    residents, lockdowns less likely but possible
                                                                                                                                                                   70% Eligible
                   50%                                                                                                                                                                                  — Phase C threshold of 80% vaccination of eligible
                                                                                                                                                                                                          population – highly targeted domestic lockdowns
                   40%                                                                                                                                                                                    only and trigger for gradual opening of international
                   30%
                                                                                                                                                                                                          borders to approved countries. Proportionate
                                                                                                                                                                                                          quarantine and reduced requirements for inbound
                   20%                                                                                                                                                                                    vaccinated travellers
                    10%                                                                                                                                                                                 — Thresholds can be achieved earlier if uptake
                     Aug-2021               Sep-2021                   Oct-2021                    Nov-2021                  Dec-2021                                                                     accelerates to Canadian profile

                                  Supply               Australia's Current Take-up Rate                      Canada Profile                 UK Profile                                     •       As evidenced globally, vaccination rates can also be
                                                                                                                                                                                                   influenced further by incentive levers

                                1. International profiles source: https://ourworldindata.org/covid-vaccinations. Australian current take-up rate source: https://covidlive.com.au/vaccinations. Supply is based on Doherty Institute modelling and Australian Federal Government announcements. All data as at 22   | 28
                                August 2021. 2. Thresholds specified in the National Plan to transition Australia’s National COVID-19 Response. Announced by the Australian Government on 2 July 2021.
Uptake supports all domestic borders open by 1 December, gradual opening of international from mid December

                                            Potential State Vaccination Timings 1
                                                                                                                                                                                  •   National COVID-19 plan requires all states to
Australia                                                                                                                                                                             hit vaccination targets for restrictions to lift

     ACT                                                                                                                                                                          •   Based on current rates of vaccine uptake by
                                                                                                                                                                                      state, the expectation is that all states hit
     TAS
                                                                                                                                                                                        — Phase B - 70% of eligible population
    NSW                                                                                                                                                                                   vaccinated by mid November 2021
                                                                                                                                                                                        — Phase C – 80% of eligible population
     VIC
                                                                                                                                                                                          vaccinated by early December 2021
     WA                                                                                                                                                                           •   This supports key network planning
                                                                                                                                                                                      assumptions
      SA
                                                                                                                                                                                        — All domestic borders to be open no later
      NT                                                                                                                                                                                  than 1 December 2021

    QLD                                                                                                                                                                                 — Gradual reopening of international in
                                                                                                                                                                                          mid December 2021
                                       Sep-21                             Oct-21                            Nov-21                            Dec-21                     Jan-22
Domestic market

FY22 Outlook                                                                                                                                            Competitive Positioning

•   Recent state lockdowns and associated border closures are expected to                                                                               •       Expecting to maintain ~70% domestic capacity share
    have a significant impact on 1H22 capacity                                                                                                          •       Extended competitive position for both domestic airlines
•   Recovery delayed by five months, domestic lockdowns and border                                                                                      •       Qantas Domestic
    restrictions expected to ease once 70% of eligible Australians are
    vaccinated                                                                                                                                                –       Increased frequency, 39 new routes3 and plans to grow to ~100%
                                                                                                                                                                      capacity in 2H222
•   Domestic demand was very strong in 4Q21 across both leisure and
    business travel segments; demand is expected to rebound as border                                                                                         –       Increasing Corporate and SME share
    restrictions ease and capacity is restored                                                                                                                –       Strong NPS and superior product offering
•   Strength from resources sector expected to continue throughout 1H22                                                                                       –       Extended margin advantage through cost transformation and
•   Domestic travel intention in next 12 months has rebounded strongly at                                                                                             revenue premium
    96% of customers surveyed1                                                                                                                          •       Jetstar Domestic
•   Revised Group domestic capacity assumptions:                                                                                                              –       Increased frequency, 7 new routes3 and plans to grow to ~120%
    –    QLD border to open from mid September 2021, VIC and NSW borders                                                                                              capacity in 2H222
         to open from 1 December 2021                                                                                                                         –       Only true low cost carrier in the Australian market with significant
        Capacity                            1Q22                     2Q22                     2H22                     FY22                                           cost advantage
        % Pre-COVID2                          38%                      53%                     110%                       77%                                 –       Price leadership and record NPS
•   Group has agility and fleet flexibility to respond to dynamic domestic
    border fluctuations and will scale capacity as quickly as possible to
    optimise cash
              1. Qantas customers intend to fly domestically in the next 12 months. Based on Qantas Group research as at August 2021. 2. ASKs compared to FY19 as a proxy of Pre-COVID flying. 3. New routes announced since 30 June 2020.   | 30
International markets

FY22 Outlook                                                                                                                                               Competitive Positioning

•   International border closure and quarantine restrictions expected to ease                                                                              •       Australia’s only long-haul premium and low cost international airline with
    once 80% of eligible Australians are vaccinated                                                                                                                extensive transformation improving relative cost position
•   International repatriation and Freight assistance program operating on                                                                                 •       10 x reconfigured A380s to return to service
    behalf of the Australian Government to continue, representing ~15% of                                                                                        –        Five will return earlier than planned, commencing July 2022 to Los
    Pre-COVID block hours for Qantas International in 1H22                                                                                                                Angeles, and London by end of 1H23
•   Limited cash burn until network restart of $3m per week for 1H221                                                                                            –        Flexibility to return remaining aircraft by January 2024
•   Planning for resumption of international flying from mid December                                                                                      •       Resuming Trans-Pacific operations from East Coast
    –     Initial destinations include Los Angeles, Honolulu, London, Singapore,                                                                                 –        789s to Los Angeles, San Francisco and Dallas; A330s on Brisbane to
          Tokyo, Vancouver and Fiji                                                                                                                                       Los Angeles and San Francisco
    –     Other destinations delayed to April 2022 include South Africa, South                                                                                   –        A380 return creates flexibility for Trans-Pacific capacity to grow
          America and parts of South East Asia                                                                                                                            above Pre-COVID levels
•   Trans-Tasman bubble expected to resume from mid December                                                                                               •       More redemption seats available for frequent flyers
•   International travel intention at its strongest level in 12                                            months2                                         •       Emirates, China Eastern and American Airlines Joint Businesses4 ready
•   Flying to be focused on cash generation and getting our people back to                                                                                         to restart once international travel resumes; proposed JBA with Japan
    work as soon as possible                                                                                                                                       Airlines under regulatory consideration
•   Revised Group International capacity assumptions:                                                                                                      •       Low fares model together with high density, high utilisation 787-8 enable
                                                                                                                                                                   Jetstar to capitalise on pent-up leisure demand post-COVID
        Capacity                             3Q22                     4Q22                      2H22
        % Pre-COVID3                30% - 40%                 50% - 70%                40% - 55%
                                                                                                                                                           •       Project Sunrise remains a key part of the Qantas International strategy.
                                                                                                                                                                   Selected A350-1000 as preferred aircraft with non-stop flights expected
                                                                                                                                                                   to be even more popular post-pandemic                                    | 31

               1. Net cash burn for Jetstar International and Qantas International including Qantas Freight. 2. Internal research of Qantas Customers. Overseas travel excluding New Zealand. As at 4 August 2021. 3. ASKs compared to FY19 as a proxy of Pre-COVID flying. 4. Emirates and China
               Eastern anti-trust immunity until March 2023, American Airlines anti-trust immunity until November 2025.
Freight and Loyalty

Freight                                                                                                                                                 Loyalty

•   International belly space expected to be negligible through 1H22                                                                                    •       Continuing to deliver strong cash flow contribution
    and into 2H22 until international capacity stabilises                                                                                               •       Travel related products continue to remain sensitive to border
•   Strong international freight demand to continue, with peak levels                                                                                           announcements
    expected in the lead up to Christmas                                                                                                                •       Rebound in earnings expected as travel demand recovers and
•   Continuing to support International Freight Assistance Mechanism                                                                                            redemption opportunities increase
•   Domestic demand expected to remain strong due to >30% growth                                                                                                – Up to 50% more Classic Reward seat availability on domestic,
    in e-commerce1 and growing customer base                                                                                                                      Trans-Tasman and international routes2
•   Two additional A321 freighters in 1H22 to service long term                                                                                         •       Demand for Qantas points remains strong; record NPS in FY21;
    customers contracts                                                                                                                                         plans to continue to grow member engagement
•   Freight profitability expected to have structurally lifted from pre-                                                                                        – More opportunities to earn points and status on the ground
    pandemic with increased domestic volumes and lower unit cost                                                                                        •       Extending relationships with coalition partners
                                                                                                                                                              –       Multi-year renewals signed with three of the major banks
                                                                                                                                                              –       Ongoing investment in digital, program experiences and new
                                                                                                                                                                      businesses
                                                                                                                                                        •       Loyalty remains committed to achieving $500-600m Underlying
                                                                                                                                                                EBIT by FY24

            1. Online shopping growth in Australia for the 12 months to 30 June 2021. Source: Australia Post ‘Inside Australian Online Shopping’ report, July 2021. 2. Up to 50% more flown Classic redemption segments as a proportion of the total flown segments on Qantas marketed and operated
                                                                                                                                                                                                                                                                                                      | 32
            flights versus the equivalent measure over 2019 on selected routes in Australia from 14 July 2020 until 31 December 2022, all Trans-Tasman routes from 18 April 2021 until 31 December 2022, and all other international routes from when two-way unrestricted travel commences for
            each route until 31 December 2022.
Investing in customer, brand and digital

Giving customers confidence to book

•   Record high or near high Net Promotor Scores across all brands and most trusted airline in the region1
•   Domestic Dual Brand strategy powerful with each airlines’ continued strength in targeted customer segments
    — Business and premium leisure: Qantas as the only full-service offering including three-tier lounges,
      complimentary food and drink, fast, free Wi-Fi and leading Loyalty program
    — Price sensitive business and leisure: Jetstar price leadership maintained despite strong competition
•   Well-positioned for a safe restart of international travel
    — The most trusted airline to keep Australians COVID-safe and healthy for international travel1 as ‘trusted advisor’
    — Investing in a digital health passport for easy proof of vaccination or negative COVID test, for seamless travel
•   Ongoing digitalisation enhancing customer experience across and beyond the travel journey including improvements to the
    Qantas App
•   Maintaining confidence to book and fly, as well as retaining customer loyalty
    — ‘Fly Flexible’ extended to the end of February 2022, Jetstar flexible ‘FareCredit’ continues
    — Qantas Frequent Flyer member status-retention support extended and up to 50% more Classic flight redemptions available2

            1. Qantas is the most trusted airline to keep Australians safe, healthy and successfully manage risks associated with COVID and international travel. Survey conducted August 2021. 2. Up to 50% more flown Classic redemption segments as a proportion of the total flown segments
                                                                                                                                                                                                                                                                                                  | 33
            on Qantas marketed and operated flights versus the equivalent measure over 2019 on selected routes in Australia from 14 July 2020 until 31 December 2022, all Trans-Tasman routes from 18 April 2021 until 31 December 2022, and all other international routes from when two-
            way unrestricted travel commences for each route until 31 December 2022.
Outlook

FY22 outlook

The Group’s existing undrawn liquidity facilities, proactive approach to securing funding and the ongoing strong contributions from Qantas Freight, Qantas Loyalty
and cash positive flying ensures it has sufficient liquidity for a range of recovery scenarios.
Through our improved network planning processes and multi-gauge fleet, we have the agility and flexibility to scale capacity and shift aircraft to capture changing
demand patterns. Our clear brand positioning, with leadership in both the premium and price sensitive markets and growing share in Corporate, SME and Leisure
markets, will ensure we capitalise on domestic demand.
We are on the path to recovery and the latest data on vaccine effectiveness, increased supply and pace of roll out globally and across Australia gives cause for
optimism. This along with our restructuring progress and the strong momentum we saw in 4Q21 when borders were open, gives confidence that we are in the final
stages of recovery and the overall Recovery Plan remains on track.
•    Key assumptions:
    — Domestic and Tasman border closures impact on 1H22 Underlying EBITDA estimated at $1.4b after mitigations
      o   QLD border expected to open from mid September 2021, VIC and NSW borders expected to open from December 2021, Trans-Tasman bubble expected to
          resume mid December 2021
    — Airline not in the same level of hibernation as 1H21
    — Continuing to manage the business to a positive Underlying operating cash flow including a focus on cash positive flying
    — Capital expenditure in FY22 is expected in to be $800m1, ~55% weighted to first half
    — Underlying depreciation and amortisation expected to be ~$125m lower than FY21
    — Restructuring Program expected to achieve $850m ongoing structural cost benefits, $200m incremental benefits in FY22
    — Net Debt expected to be within target range by the end of FY222

            1. Net capital expenditure excluding any potential proceeds from the sale of land. 2. Net Debt under the Group’s Financial Framework includes net on balance sheet debt and capitalised aircraft lease liabilities.   | 34
Well-positioned for recovery
                  Group Domestic1 airlines are well-positioned to benefit from the                                                                                                                           Operating Segment Underlying EBITDA
                  recovery in domestic travel and changing competitive environment;
                  capacity share ~70%; significant unit cost reduction post                                                                                                   $4.0b
                  restructuring; FY21 Group Domestic Underlying EBITDA of $304m                                                                                               $3.6b

                  Australia’s most valued Loyalty business generating strong cash                                                                                             $3.2b                        Group
                                                                                                                                                                                                       International
                  contribution and has a clear pathway to sustained earnings growth2                                                                                          $2.8b

                  Freight has benefited from the consumer shift to e-commerce and is                                                                                          $2.4b
                                                                                                                                                                                                                                               Group
                  also a natural hedge to the international passenger business                                                                                                $2.0b                                                        International

                  Group International3 businesses maintained operational readiness for                                                                                        $1.6b                        Group
                                                                                                                                                                                                          Domestic
                  low cost restart and gradual ramp up                                                                                                                        $1.2b                                                            Group
                                                                                                                                                                                                                                              Domestic

                  Strong liquidity position and strengthening operating cash flow                                                                                             $0.8b
                                                                                                                                                                                                                                                                                   Group
    $             allowed Balance Sheet repair to begin                                                                                                                       $0.4b                                                                                               Domestic
                                                                                                                                                                                                          Loyalty                              Loyalty                              Loyalty
                  Three-Year Recovery Plan to improve operational cash flows and                                                                                              $0.0b
                                                                                                                                                                                                                                                                                     Group
                  deliver $1b in ongoing annual savings from FY23. Assessing further                                                                                        -$0.4b                                                                                               International
                  opportunities to improve revenue and margins                                                                                                                                             FY19                                FY20                                 FY21

                                  The Group’s integrated portfolio of mutually reinforcing businesses are well-positioned for the recovery

        1. Group Domestic includes Qantas Domestic and Jetstar Domestic. 2. Measured on underlying EBIT. 3. Group International includes Qantas International (including Qantas Freight), Jetstar International Australian operations, Jetstar New Zealand, Jetstar Asia (Singapore) and the     | 35
        contribution from Jetstar Japan.
Looking forward, we remain committed to the FY24 targets

                    Qantas                                              Jetstar                        Qantas                    Jetstar
                                                                                                    International                                      Qantas Loyalty
                   Domestic                                            Domestic                                               International
                                                                                                   Relative competitive                              Stable earnings growth
        Relative margin advantage                          Relative margin advantage                                         Lowest cost position
                                                                                                        advantage

       Targeting EBIT margin1 ~18%                           Targeting EBIT margin ~22%           Targeting ROIC >10%         Targeting ROIC >15%   Targeting $500-600m EBIT

                                                                          People: Continued improvement in employee engagement

                                                                        Customer: Maintain Net Promoter Score premium to competitor

                                                                                          Top quartile shareholder returns

        1. Underlying segment EBIT divided by total segment revenue.                                                                                                           | 36
Disclaimer and ASIC Guidance

This Presentation has been prepared by Qantas Airways Limited (ABN 16 009 661 901) (Qantas).

Summary information
This Presentation contains summary information about Qantas and its subsidiaries (Qantas Group) and their activities current as at 26 August 2021, unless otherwise stated. The information in this Presentation does not purport to be complete. It should be read in
conjunction with the Qantas Group’s other periodic and continuous disclosure announcements lodged with the Australian Securities Exchange, which are available at www.asx.com.au.

Not financial product advice
This Presentation is for information purposes only and is not financial product or investment advice or a recommendation to acquire Qantas shares and has been prepared without taking into account the objectives, financial situation or needs of individuals. Before making
an investment decision prospective investors should consider the appropriateness of the information having regard to their own objectives, financial situation and needs and seek legal and taxation advice appropriate to their jurisdiction. Qantas is not licensed to provide
financial product advice in respect of Qantas shares. Cooling off rights do not apply to the acquisition of Qantas shares.

Not tax advice
Tax implications for individual shareholders will depend on the circumstances of the particular shareholder. All shareholders should therefore seek their own professional advice in relation to their tax position. Neither Qantas nor any of its officers, employees or advisers
assumes any liability or responsibility for advising shareholders about the tax consequences of the return of capital and/or share consolidation.

Financial data
All dollar values are in Australian dollars (A$) and financial data is presented within the twelve months ended 30 June 2021 unless otherwise stated.

Future performance
Forward looking statements, opinions and estimates provided in this Presentation are based on assumptions and contingencies which are subject to change without notice, as are statements about market and industry trends, which are based on interpretations of current
market conditions. Forward looking statements including projections, guidance on future earnings and estimates are provided as a general guide only and should not be relied upon as an indication or guarantee of future performance.

An investment in Qantas shares is subject to investment and other known and unknown risks, some of which are beyond the control of the Qantas Group, including possible delays in repayment and loss of income and principal invested. Qantas does not guarantee any
particular rate of return or the performance of the Qantas Group nor does it guarantee the repayment of capital from Qantas or any particular tax treatment. Persons should have regard to the risks outlined in this Presentation.

No representation or warranty, express or implied, is made as to the fairness, accuracy, completeness or correctness of the information, opinions and conclusions contained in this Presentation. To the maximum extent permitted by law, none of Qantas, its directors,
employees or agents, nor any other person accepts any liability, including, without limitation, any liability arising out of fault or negligence, for any loss arising from the use of the information contained in this Presentation. In particular, no representation or warranty,
express or implied is given as to the accuracy, completeness or correctness, likelihood of achievement or reasonableness of any forecasts, prospects or returns contained in this Presentation nor is any obligation assumed to update such information. Such forecasts,
prospects or returns are by their nature subject to significant uncertainties and contingencies. Before making an investment decision, you should consider, with or without the assistance of a financial adviser, whether an investment is appropriate in light of your particular
investment needs, objectives and financial circumstances.

Past performance
Past performance information given in this Presentation is given for illustrative purposes only and should not be relied upon as (and is not) an indication of future performance.

Not an offer
This Presentation is not, and should not be considered, an offer or an invitation to acquire Qantas shares or any other financial products.

ASIC GUIDANCE
In December 2011 ASIC issued Regulatory Guide 230. To comply with this Guide, Qantas is required to make a clear statement about whether information disclosed in documents other than the financial report has been audited or reviewed in accordance with Australian
Auditing Standards. In line with previous years, this Presentation is unaudited. Notwithstanding this, the Presentation contains disclosures which are extracted or derived from the Annual Financial Report for the full year ended 30 June 2021 which is being audited by the
Group’s independent Auditor and is expected to be made available in September 2021.

                                                                                                                                                                                                                                                                                       | 37
You can also read