Obese Older Type 2 Diabetes Mellitus Patients with Muscle Insulin Resistance Benefit from an Enriched Protein Drink during Combined Lifestyle ...
←
→
Page content transcription
If your browser does not render page correctly, please read the page content below
nutrients
Article
Obese Older Type 2 Diabetes Mellitus Patients with
Muscle Insulin Resistance Benefit from an Enriched
Protein Drink during Combined Lifestyle
Intervention: The PROBE Study
Wilrike J. Pasman 1, *,† , Robert G. Memelink 2,† , Johan de Vogel-Van den Bosch 3 ,
Mark P. V. Begieneman 1 , Willem J. van den Brink 1 , Peter J. M. Weijs 2,4
and Suzan Wopereis 1
 1   Netherlands Organisation for Applied Scientific Research (TNO), 3704 HE Zeist, The Netherlands;
     mpvbegieneman@protonmail.com (M.P.V.B.); willem.vandenbrink@tno.nl (W.J.v.d.B.);
     suzan.wopereis@tno.nl (S.W.)
 2   Department of Nutrition and Dietetics, Faculty of Sports and Nutrition, Center of Expertise Urban Vitality,
     Amsterdam University of Applied Sciences, 1067 SM Amsterdam, The Netherlands;
     r.g.memelink@hva.nl (R.G.M.); p.j.m.weijs@hva.nl (P.J.M.W.)
 3   Danone Nutricia Research, 3584 CT Utrecht, The Netherlands; johan.devogel@nutricia.com
 4   Department of Nutrition and Dietetics, Amsterdam University Medical Centres, Vrije Universiteit,
     1081 HV Amsterdam, The Netherlands
 *   Correspondence: wilrike.pasman@tno.nl
 †   These authors contributed equally to this work.

 Received: 28 August 2020; Accepted: 24 September 2020; Published: 29 September 2020

 Abstract: (1) Background: Recent research showed that subtypes of patients with type 2 diabetes
 may differ in response to lifestyle interventions based on their organ-specific insulin resistance
 (IR). (2) Methods: 123 Subjects with type 2 diabetes were randomized into 13-week lifestyle
 intervention, receiving either an enriched protein drink (protein+) or an isocaloric control drink
 (control). Before and after the intervention, anthropometrical and physiological data was collected.
 An oral glucose tolerance test was used to calculate indices representing organ insulin resistance
 (muscle, liver, and adipose tissue) and β-cell functioning. In 82 study-compliant subjects (per-protocol),
 we retrospectively examined the intervention effect in patients with muscle IR (MIR, n = 42) and
 without MIR (no-MIR, n = 40). (3) Results: Only in patients from the MIR subgroup that received
 protein+ drink, fasting plasma glucose and insulin, whole body, liver and adipose IR, and appendicular
 skeletal muscle mass improved versus control. Lifestyle intervention improved body weight and fat
 mass in both subgroups. Furthermore, for the MIR subgroup decreased systolic blood pressure and
 increased VO2 peak and for the no-MIR subgroup, a decreased 2-h glucose concentration was found.
 (4) Conclusions: Enriched protein drink during combined lifestyle intervention seems to be especially
 effective on increasing muscle mass and improving insulin resistance in obese older, type 2 diabetes
 patients with muscle IR.

 Keywords: combined lifestyle intervention; diabetic subtypes; muscle insulin resistance; oral glucose
 tolerance test (OGTT); weight loss

1. Introduction
     A key therapeutic goal in the treatment of obese type 2 diabetes (mellitus) patients is weight loss.
Several studies using energy restriction and weight loss interventions showed beneficial effects on
the metabolic state, including reduced HbA1c and lipoprotein levels, reduced hepatic and pancreatic

Nutrients 2020, 12, 2979; doi:10.3390/nu12102979                                 www.mdpi.com/journal/nutrients
Nutrients 2020, 12, 2979                                                                             2 of 16

fat content, improved β-cell function (BCF) and hepatic insulin sensitivity, and even remission of
type 2 diabetes [1–4]. However, a disadvantageous effect of weight loss interventions is the loss of
muscle mass that can account for about 30% of total weight loss [5]. Indeed, in a 1-year controlled,
randomized trial that evaluated the effects of diet and exercise on weight loss in obese older adults,
39% and 22% of the weight loss found after 6 months originated from lean mass in the diet group and
diet-exercise group [6] respectively. In addition, aging itself is also known to be associated with muscle
mass loss [7]. This is especially problematic in the obese older diabetic population, as these individuals
not only suffer from decreased glycemic control but also are at risk of losing skeletal muscle mass [8].
This loss of muscle mass is most undesirable, because skeletal muscle primarily accounts for about 80%
of insulin-mediated glucose uptake [9]. Skeletal muscle is also an important metabolic organ, oxidizing
sugars and fats to produce ATP to enable muscle activity. A vicious circle may arise if the weight
loss-induced muscle mass loss, in addition to the age-induced muscle mass loss, further worsens
glucose uptake and glycemic control [10]. This stresses the importance of weight loss interventions
that preserve muscle mass for obese, older type 2 diabetes patients.
      Both resistance exercise and high-protein intake have been shown to help maintain and protect
muscle mass during weight loss [11–13]. Additionally, resistance exercise training also increases muscle
insulin sensitivity in older type 2 diabetes adults [10]. In the recent PROBE study, improved muscle
mass and glycemic control in obese, older type 2 diabetes patients was achieved using a whey protein
drink enriched with leucine and vitamin D during a combined lifestyle intervention consisting of
resistance exercise and energy restriction [14].
      However, dietary interventions often lack consistent effects that may be related to differences
in genotype, lifestyle habits, and environmental factors. Due to this individual variability, people
may react differently to metabolic stressors and interventions, so-called ‘metabolic or phenotypic
flexibility’ [15]. Also, several different organs and processes are involved in metabolic homeostasis and
can contribute to disruptions in these processes [16]. The degree of β-cell function and insulin resistance
(IR) of the primary involved organs (liver and skeletal muscle) in type 2 diabetes, may therefore greatly
affect the individual metabolic flexibility. Recently, it has been shown that based on insulin resistance
of muscle, liver, or a combination thereof, type 2 diabetes subtypes could be identified that differed in
their long-term health response after two different dietary interventions [17]. Thus, identifying the
individual diabetic phenotype may be important in determining the effectiveness of interventions.
Diabetic subtypes can be discriminated using formulas with fasting plasma glucose and insulin in
combination with plasma values of a 5-points-2 h oral glucose tolerance test (OGTT). These calculations
describe different phenotypes based on the level of beta cell activity, whole body insulin sensitivity,
and muscle or liver insulin resistance [18–20].
      To study whether obese, older type 2 diabetes subtypes have a different response to a
lifestyle intervention with or without a protein drink, as a secondary objective of the main study,
we retrospectively analyzed diabetes subgroup effects from patients participating in the PROBE
study. Appendicular muscle mass was found to be increased during the lifestyle intervention when a
protein drink was used [14], we therefore focused on muscle mass and insulin resistance of muscle.
We hypothesized that especially patients with muscle insulin resistance have impaired muscle function
and may benefit from muscle stimulating interventions like exercise training and protein intake. Muscle
insulin resistance could be an important variable to identify subgroups that may benefit more or
less from the lifestyle and protein drink intervention, therefore the data were compared for diabetic
patients with muscle insulin resistance (MIR) and without MIR (no-MIR) subgroups based on the
muscle insulin sensitivity index (MISI) [18]. With this index, the change in blood glucose is shown
over time relative to insulin, meaning that insulin sensitive people will have a relatively high uptake
of glucose by the muscle over time with a certain concentration of insulin. Muscle of patients that
are insulin resistant will respond less well to insulin and, as a consequence, remove less glucose from
the blood over time, resulting in a low MISI value. This subgrouping of patients may provide further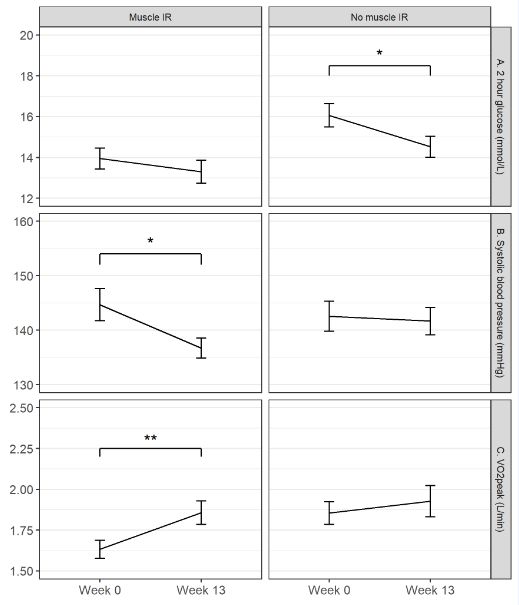
Nutrients 2020, 12, 2979                                                                           3 of 16

insight and suggestions for mechanisms of importance for glycemic control and may be used to treat
type 2 diabetes patients more efficiently.

2. Materials and Methods

2.1. Subjects
     This study was conducted as described elsewhere [14]. In short, 123 subjects were recruited
and eligible for study participation if they were aged 55 years or older, had type 2 diabetes (defined
by use of medication for type 2 diabetes) or pre-diabetes (defined as a blood hemoglobin A1c
level (HbA1c) ≥ 43 mmol/mL (6.1%)) and had either a body mass index (BMI) of >30.0 kg/m2 or a
BMI > 27.0 kg/m2 in combination with a waist circumference of >88 cm for women and >102 cm for
men. Exclusion criteria included cardiac infarcts and/or cardiac surgery within three months prior
to baseline; any malignant disease in the last five years or renal, hepatic or gastrointestinal diseases;
specific medication or diets and alcohol or drug abuse. The study was approved by the Medical
Ethics Committee (NL46790.056.14) Assen June 2014, The Netherlands, in accordance with the Helsinki
Declaration of 1975 as revised in Brazil, 2013. The study has been registered at www.trialregister.nl,
NTR4497. Written informed consent was obtained from all subjects. The study was conducted from
September 2014 till January 2017.

2.2. Study Design
     The study was a randomized, controlled, double blind 13-wk trial [14]. Subjects were randomized
into either the test group or control group and followed a hypocaloric diet of 600 kcal below estimated
energy needs (based on measured resting energy expenditure and estimated physical activity level
using an accelerometer). Subjects received six individual dietary counseling sessions with a dietitian
and six group sessions on alternating weeks together under supervision of a dietitian to facilitate a
600 kcal energy deficit with their food intake. The exercise program, consisted of three 1-h group
training sessions per week together at a fitness center, and included resistance exercise and high
intensity interval training (HIIT). The training sessions were supervised by a sports instructor. During
the combined lifestyle intervention, the test group received a study drink 10 times a week: one serving
daily with breakfast and one extra after each training session. Data of subjects was obtained at baseline
and after 13 weeks of intervention.

2.3. Study Products
     In the study, drinks were provided by Danone Nutricia Research, Utrecht, The Netherlands.
The test drink was a whey protein drink enriched with leucine and vitamin D, containing 21 g
leucine-enriched whey protein (3 g total leucine), 9 g carbohydrates, 3 g fat, 800 IU cholecalciferol
(vitamin D3), and a mixture of vitamins, minerals, and fibers, referred to as protein+ (FortiFit® ).
The control product contained 25 g carbohydrates and 6 g fat. Both products were similar in taste
and appearance, isocaloric (150 kcal per serving), and were dissolved in 150 mL water just before
consumption. The supplement was consumed daily and after each training session, so a total of ten
consumptions per week. On average the protein intake for the protein+ users therefore increased with
28 g a day, or 112 kCal, representing about 6% of the daily energy intake. A detailed description of the
study products is provided in Appendix A.

2.4. Clinical Chemistry and Glycemic Control
      To standardize the OGTTs subjects were instructed before the OGTTs: not to participate in any
vigorous exercise 48 h; to refrain from alcohol for 24 h; have a standardized dinner the evening; not to
eat, drink and smoke for 12 h; drinking some water was allowed till two hours before the OGTT. Upon
overnight fasting an OGTT was performed at baseline and after 13 weeks of intervention. Venous
blood samples were taken prior to intake (t = 0), and at 30, 60, 90 and 120 min after intake of a 300 mL
Nutrients 2020, 12, 2979 4 of 16
75 g glucose solution (Added Pharma). Plasma heparin samples were used for measurements of
glucose (mmol/L) and insulin (pmol/L). Plasma samples taken prior to OGTT were also assessed for
HbAc1 (mmol/mol) and plasma lipids (FFA, triglycerides, High-Density Lipoprotein, Low-Density
Lipoprotein, and total cholesterol) and serum calcidiol (nmol/L) was assessed according to standard
procedures in the laboratory of the Vrije Universiteit Medical Centre, Amsterdam, The Netherlands.
Leucine analysis was based on the AccQTag method of Waters measured with HP-LC from a fasting
dry blood spot sample at TNO, Zeist, The Netherlands.
2.5. Subtyping of Type 2 Diabetes
To define if a subject had muscle IR as the diabetic subtype, the muscle insulin sensitivity index
(MISI) [18] was calculated from the OGTT. Additionally, the Matsuda index [19], hepatic insulin
resistance index (HIRI) [18], disposition index (DI) [20], and the adipose tissue insulin resistance
index (Adipo-IR) [21] were also calculated as measures for respectively systemic insulin sensitivity,
hepatic insulin resistance, β-cell function (BCF), and adipose tissue insulin resistance (Table 1).
Units used for calculations of the indices were in mg/dL for glucose and U/L for insulin. Using the
data of DiOGenes [22], CORDIOPREV [23], and PhenFlex [24,25] studies, cut-off values for MISI were
determined. These values were calculated and validated by using data of more than 1000 subjects with
different health status: healthy subjects, subjects with prediabetes, and patients with undiagnosed and
clinically diagnosed type 2 diabetes. The cut-off used for MISI was −1; subjects with values ≤ −1 had no
MIR, subjects with values > −1 had MIR. In the present analysis, we calculated the MISI of all subjects
at baseline and categorized them based on their MISI value in the MIR or no-MIR group, respectively.
Table 1. Indices used to define the diabetic phenotype of a subject.
Index Formula Indicator of
√
Matsuda Index [19] 10000/ (fG × fI)(mG x mI) Systemic insulin sensitivity
Disposition Index (DI) [20] [AUC30min insulin /AUC30min glucose ] × Matsuda β-cell function
Hepatic Insulin Resistance Index (HIRI) [18] fG × fI Hepatic insulin resistance
Muscle Insulin Sensitivity Index (MISI) [18] (∆G/∆t)/mI Muscle insulin resistance
Adipose Tissue Insulin Resistance Index (Adipo-IR) [21] Fasting FFA × fI Adipose tissue insulin resistance
Abbreviations used: fG = fasting plasma glucose; fI = fasting plasma insulin; mG = mean plasma glucose; mI = mean
plasma insulin; AUC = area under the curve; ∆G = delta glucose; ∆t = delta time; FFA = free fatty acids. Units used:
for glucose mg/dL; for insulin U/L; for FFA mmol/L.
2.6. Physical Measurements
Body weight was measured using a weighing scale (Life Measurement, Inc., Concord, CA, USA),
body height using a wall mounted stadiometer (De Grood DGI 250D; De Grood metaaltechniek,
Nijmegen, The Netherlands), and waist circumference using measuring tape. Body weight and height
were used to calculate the body mass index (BMI). Appendicular skeletal muscle mass (ASMM)
(kg), fat mass (kg), and visceral adipose tissue (VAT; cm2 ) were measured by dual-energy X-ray
absorptiometry (DXA; Discovery A, Hologic), using a whole body scan.
Three exercise tests were conducted to measure physical performance. The 10-RM leg press strength
(kg) was measured using a leg press machine (Technogym Selection; Technogym, The Netherlands)
Knee extension power (Watt) was measured using a leg extension machine (Technogym Selection;
Technogym (Humac 360; CSMi) Technogym, The Netherlands) [26]. VO2 peak (L/min) was measured
using a steep ramp test performed on a cycle ergometer (Quark RMR/CPET; Cosmed, Rome, Italy) [27].
2.7. Statistics
The number of subjects in the randomized clinical trial (RCT) was based on the study of
Verreijen et al. [13] evaluating the effect of the same test drink during intentional weight loss in older
adults with obesity. A sample size of 44 per arm provided 80% power to detect an absolute difference of
0.92 kg leg muscle mass with a standard deviations (SD) of 1.51 kg and p < 0.05 (2-sided). Assuming aNutrients 2020, 12, 2979 5 of 16
dropout rate of 25%, 118 subjects were needed for the study. Since subjects were enrolled in 5 different
clusters, we aimed to enroll approximately 24 subjects per cluster. Finally, 123 subjects were enrolled
in the study [14].
The data from the PROBE study were analyzed retrospectively, comparing the effect of test versus
control in the MIR subgroup and no-MIR subgroup separately. To ensure high quality data, of the
123 subjects only those subjects were selected who consumed at least 7 out of 10 weekly study drinks
(test or control), attended at least 2 out of 3 weekly training sessions (94 subjects), and completed the
OGTT at start and end of the study (82 subjects) (per protocol analysis).
Observations having a residual >3 times the root mean square error of the model were removed
as statistical outlier. Before statistical analysis, variables visually showing increased residual variation
with higher fitted values were transformed by taking their natural logarithm, while the MISI was
logarithmically transformed after substituting the ‘0’ values by −0.1 and multiplying all values by −1
for proper statistical evaluation (due to non-linear distribution of the data log-transformation was
needed).
Mixed linear models were used to analyze each dependent outcome variable with ‘treatment’
(test vs. control) and ‘time’ (0 vs. 13 weeks) and their interaction as fixed independent effects,
and ‘subject’ as random independent factor. This was performed for the MIR and the no-MIR subgroup
separately, since baseline characteristics of the two subgroups were different for their diabetic status
(Table 2) not allowing for a direct comparison between subgroups. No other subgroups were examined
because the numbers of patients was unbalanced and too low. Interaction effects of time x treatment
with p < 0.05 were further evaluated in a post hoc analysis to investigate whether a ‘time’ effect occurred
in the test, the control group, or both. A post-hoc (two-sided student t-test after Bonferroni multiple
comparison correction) effect with p < 0.05 was considered significant. Mean and SD were calculated
for all outcomes. Statistical analyses were performed using R version 3.6.0 (www.r-project.org).
Table 2. Descriptive characteristics of the subjects.
MIR + no-MIR
Test Control Test Control
Number 20 22 20 20
Gender (male/female) 12/8 11/11 14/6 16/4
Age (years) (mean ± SD ++ ) 67.3 ± 5.4 67.1 ± 5.7 68.3 ± 5.6 63.6 ± 5.9
T2D @ duration (months);
56 (40–100) 32 (15–51) 100 (59–162) 110 (69–132)
median (IQR # )
Diabetes status (T2DM/pre-diabetes) * 13/7 18/4 19/1 19/1
Use of Metformin (yes/no) 11/9 16/6 19/1 19/1
Use of SU derivatives (yes/no) 7/13 6/16 5/15 9/11
+ MIR: Muscle-Insulin Resistance; ++ SD: Standard Deviation; @ T2D: type 2 diabetes; # IQR: interquartile range of
q1–q3. * Based upon diabetes medication at screening.
2.8. Data and Resource Availability
The data sets generated during and/or analysed during the current study are available from the
corresponding author upon reasonable request.
3. Results
3.1. Study Population
Eighty-two out of 123 subjects, who were compliant with respect to the PROBE study protocol
and had complete OGTT data at baseline (week 0) and at the end of the intervention (week 13),
were used for the retrospective type 2 diabetes subgroup analysis. The descriptive characteristics
as presented in Table 2 were similar for the 82 subjects included as for the 41 excluded subjects of
this retrospective analysis (data not shown). The subgroups MIR and no-MIR had similar baseline
characteristics (see Table 2).Nutrients 2020, 12, 2979 6 of 16
Based on the MISI, 42 subjects were found to have muscle IR (MIR) against 40 subjects that did not
(no-MIR). Table 2 shows some descriptive characteristics of the MIR and no-MIR subgroups, specified
by protein+ and control group. The protein+ and control groups were comparable in terms of baseline
characteristics within MIR as well as in no-MIR (NS). Although equal numbers of participants were
found for MIR (n = 42) and no-MIR (n = 40), some main characteristics were different between the two
subgroups. The MIR group has more males (75 vs. 55%), more prediabetics (26 vs. 5%) and related to
that a lower diabetes duration (average median of 45 months vs. average median of 100 months) as
compared to the no-MIR subgroup.
3.2. Protein+ Drink Effect within the Muscle Insulin Resistance Subgroup
Table 3 presents the intervention effect of the MIR subgroup. A significantly greater change over
time was seen for the protein+ drink than for the control drink on Calcidiol (p < 0.001), fasting plasma
glucose (FPG) (p = 0.020), fasting plasma insulin (FPI) (p = 0.029), Matsuda index (p = 0.002), HIRI
(p = 0.019), Adipo-IR (p = 0.043), and ASMM (p = 0.043). Post-hoc analysis revealed that these effects
were all explained by a significant improvement in the protein+ group alone: Calcidiol (+17.5 nmol/L,
p < 0.001), FPG (−0.7 mmol/L, p = 0.002), FPI (−21.2 pmol/L, p = 0.031), HIRI (−700, p = 0.004) and
Adipo-IR (−23.8, p = 0.011) all decreased, while Matsuda index (+0.47, p < 0.001) and ASMM (+0.54 kg,
p = 0.041) increased after 13 weeks of intervention.
Table 3. Clinical characteristics in test and control group for subjects in muscle insulin resistance
(MIR) subgroup.
Test Control Interaction Effect
Time Effect
(n = 20) (n = 22) (Time × Treatment)
Week 0 Week 13 Week 0 Week 13 p-value p-value
Weight (kg) 98.8 (14.8) 96.7 (14.4) 98.3 (16.2) 95.7 (16.2)Nutrients 2020, 12, 2979 7 of 16
and 10-RM leg press (control: +63.1, p < 0.001; test: +36.9, p < 0.001) were increased after 13 weeks
of intervention.
Table 4. Clinical characteristics in test and control group for subjects in no-MIR subgroup.
Test Control Interaction Effect
Time Effect
(n = 20) (n = 20) (Time × Treatment)
Week 0 Week 13 Week 0 Week 13 p-value p-value
Weight (kg) 98.6 (15.5) 96.3 (14.4) 97.6 (12.4) 94.6 (12.0)Nutrients 2020, 12, x FOR PEER REVIEW 9 of 18
In Figure 1 the changes of the glycemic and physiological parameters are presented for the test
and the control
Nutrients 2020, group of the MIR and the no-MIR group. In Figure 2 the changes in the IR indices
12, 2979 8 of 16
and 10-RM are shown for the test and control group for the MIR and the no-MIR group.
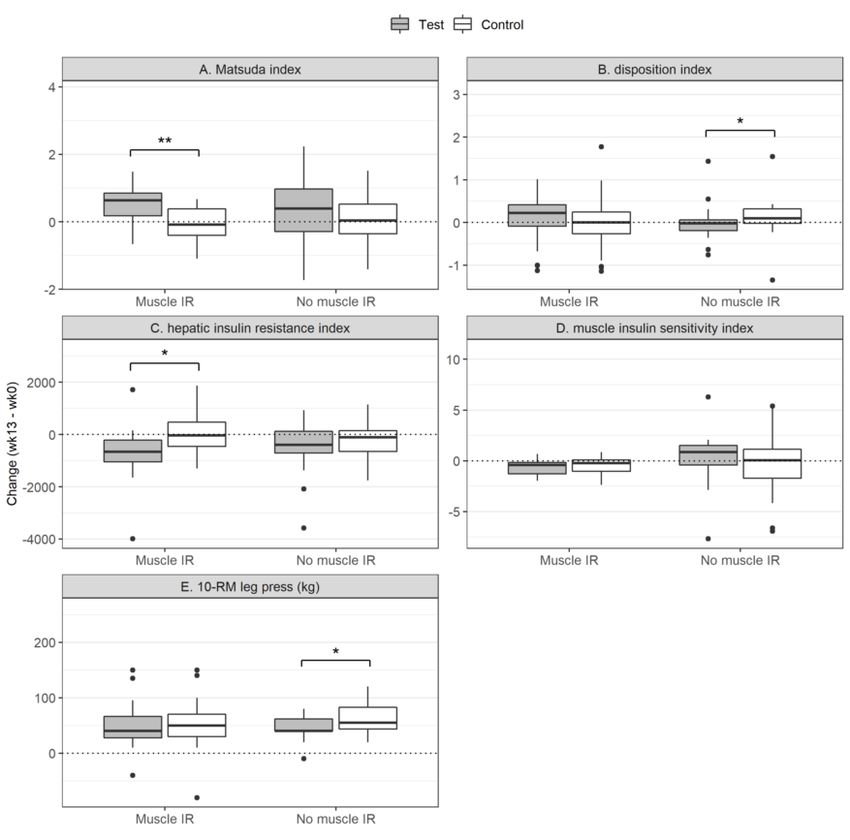
Figure 1.1. The
Thechanges
changes in in glycemic
glycemic and and physiological
physiological variables
variables due to due to the intervention.
the intervention. HbA1c:
HbA1c: glycated
glycated
hemoglobin hemoglobin A1c; IR:resistance;
A1c; IR: insulin insulin resistance;
MIR: muscleMIR:insulin
muscleresistance.
insulin resistance. The changes
The changes in the
in the fasting
plasma glucoseglucose
fasting plasma (A), fasting plasmaplasma
(A), fasting insulininsulin
(B), HbA1c (C) and
(B), HbA1c inand
(C) appendicular skeletal
in appendicular muscle
skeletal mass
muscle
(D)
massare presented
(D) for thefor
are presented MIR
thegroup (left) and
MIR group the
(left) no-MIR
and group group
the no-MIR (right) (right)
in eachinplot.
eachThe filled
plot. Theboxed
filled
(grey)
boxed represent the group
(grey) represent thesupplemented with thewith
group supplemented protein
thedrink;
proteinthedrink;
non-filled boxed (white)
the non-filled boxed represent
(white)
the group the
represent provided
group with the control
provided drink.
with the Statistics
control drink.was done within
Statistics the within
was done MIR andtheno-MIR
MIR and group and
no-MIR
not between the groups. The groups are shown in the same plot for comparison.
group and not between the groups. The groups are shown in the same plot for comparison. The box The box plots show
quartile
plots show1-quartile
quartile3 1-quartile
of the data3 with
of thethe linewith
data representing the median.the
the line representing < 0.05. * p < 0.05.
* p median.
So besides similar effects of lifestyle on both subgroups, the systolic Blood Pressure (BP), HbA1c,
10-RM leg press and VO2 peak were specific lifestyle effects found for the MIR subgroup. In the no-MIR
group, the HbA1c and 10-RM leg press lifestyle effectiveness could not be determined due to the
interaction effect with the protein+ drink. A specific lifestyle effect only seen in the no-MIR subgroup
was the 2hr plasma glucose level, which was reduced. The lifestyle specific effects for the MIR and
no-MIR subgroups on 2-h glucose, systolic blood pressure and VO2 peak are shown in Figure 3.Nutrients 2020, 12, 2979 9 of 16
Nutrients 2020, 12, x FOR PEER REVIEW 10 of 18
Figure 2. Insulin resistance indices and the 10-Repetition Max (10-RM) test. The changes in the Matsuda
Figure 2. Insulin resistance indices and the 10-Repetition Max (10-RM) test. The changes in the
index (A), the Disposition Index (B), the Hepatic Insulin Resistance Index (C), the Muscle Insulin
Matsuda index (A), the Disposition Index (B), the Hepatic Insulin Resistance Index (C), the Muscle
Sensitivity Index (D) and the 10-RM leg press (E) are presented for the MIR group (left) and the no-MIR
Insulin Sensitivity Index (D) and the 10-RM leg press (E) are presented for the MIR group (left) and
group (right) in each plot. The filled boxed (grey) represent the group supplemented with the protein
the no-MIR
drink; group (right)
the non-filled in each
boxed plot.represent
(white) The filledthe
boxed
group(grey) represent
provided withthe group
the supplemented
control with
drink. Statistics
the protein drink; the non-filled boxed (white) represent the group provided
was done within the MIR and no-MIR group and not between the groups. The groups are shown with the control drink.
Statistics
in the same wasplot
doneforwithin the MIRThe
comparison. andbox
no-MIR
plots group and not 1-quartile
show quartile between the 3 ofgroups.
the data The groups
with are
the line
shown in the same plot for comparison. The
representing the median. * p < 0.05; ** p < 0.01. box plots show quartile 1-quartile 3 of the data with the
line representing the median. * p < 0.05; ** p < 0.01.
We were also interested to evaluate the effect of the lifestyle intervention itself within the two
subgroups. The effect of diet and exercise for both subgroups is presented in Tables 3 and 4 as ‘Time
effect’. In the MIR subgroup (Table 3), a significant time effect was found for body weight (−2.7 kg, p
< 0.001), waist circumference (−3.0 cm, p < 0.001), BMI (−0.9 kg/m2, p < 0.001), systolic blood pressure
(−8 mmHg, p = 0.05), HbA1c (−3.0 mmol/mol, p = 0.04), fat mass (−2.8 kg, p < 0.001), VAT (−22 cm2, p <
0.01), 10-RM leg press (+50 kg, p < 0.001), knee extension power (+20 Watt, p = 0.01), and VO2peak
(+0.19 L/min, p < 0.001). All these parameters improved after 13 weeks of combined lifestyle
intervention within the MIR subgroup, independent of the study drink (Table 3). Plasma cholesterol
and triglyceride concentrations, Disposition Index (DI) and MISI did not change over time.
In the no-MIR subgroup, presented in Table 4, a significant time effect was found for body
weight (−2.7 kg, p < 0.001), waist circumference (−3.6 cm, p < 0.001), BMI (−0.9 kg/m2, p < 0.001),10-RM leg press and VO2peak were specific lifestyle effects found for the MIR subgroup. In the no-
MIR group, the HbA1c and 10-RM leg press lifestyle effectiveness could not be determined due to
the interaction effect with the protein+ drink. A specific lifestyle effect only seen in the no-MIR
subgroup was the 2hr plasma glucose level, which was reduced. The lifestyle specific effects for the
MIR and no-MIR subgroups on 2-h glucose, systolic blood pressure and VO2peak are shown in Figure
Nutrients 2020, 12, 2979 10 of 16
3.
Figure 3. The lifestyle specific effects for the MIR and no-MIR group. The lines represent the changes
Figure 3. The lifestyle specific effects for the MIR and no-MIR group. The lines represent the changes
in the 2 h glucose level (A), Systolic Blood Pressure (B) and VO peak (C) due to the intervention from
in the 2 h glucose level (A), Systolic Blood Pressure (B) and VO22peak (C) due to the intervention from
baseline to week 13 in the MIR (left side) and the no-MIR (right side) of the figure. The 2-h glucose level
baseline to week 13 in the MIR (left side) and the no-MIR (right side) of the figure. The 2-h glucose
decreased significantly only in the no-MIR group; systolic blood pressure decreased only significantly
level decreased significantly only in the no-MIR group; systolic blood pressure decreased only
in the MIR subgroup; and VO2 peak increased only significantly in the MIR group. These changes were
independent of treatment and due to time (lifestyle intervention effect). * p < 0.05; ** p < 0.01.
4. Discussion
The present study indicates that obese, older type 2 diabetes patients with muscle IR who use
the protein drink enriched with leucine and vitamin D during a combined lifestyle intervention,
show benefits on appendicular skeletal muscle mass, fasting plasma glucose, fasting plasma insulin,
systemic insulin sensitivity and adipose tissue insulin resistance.
Earlier publications showed specific effects of interventions on type 2 diabetes subgroups [17,28].
We hypothesized that especially subjects with muscle insulin resistance may benefit from additional
whey protein intake as provided by the protein drink, since exercise specifically improves insulin
sensitivity of the muscle [29,30] and the protein+ drink may increase the muscle glucose uptake capacity
via muscle mass increase. Also of vitamin D beneficial effects for muscle growth and function haveNutrients 2020, 12, 2979 11 of 16
been reported [31]. The enriched protein supplement clearly resulted in increased Calcidiol levels,
as a marker of vitamin D, after 13 weeks of intake in both subgroups. The role of vitamin D on
insulin resistance has been reported, but recent reviews stressed that the relation is still not clear [32]
and that there is no evidence that vitamin D supplementation has a beneficial effect on peripheral
insulin sensitivity in people with or at risk of insulin resistance [33], as is stressed by our results as
well. Mechanisms to elucidate these test product-driven beneficial effects specifically in the MIR
subgroup, may therefore be related to the protein+ intake. The increased appendicular muscle mass of
the MIR subgroup that consumed the protein+ drink suggests that the anabolic process is stimulated
in this subgroup. Insulin not only stimulates glucose uptake in muscle, it is also an anabolic hormone,
stimulating uptake of amino acids for muscle growth [34–37]. The MIR subgroup supplemented with
the protein+ drink (whey protein) is becoming more insulin sensitive (tendency p = 0.08, see Table 3).
The availability of the proper amino acids, as well as the increased training stimuli and the tendency
for improved insulin sensitivity, are all factors favoring muscle growth [35]. The muscle IR of the
no-MIR group did not improve at all and was already in the healthy range what may explain that no
significant muscle growth was seen in the no-MIR group using protein+ drink.
Hepatic insulin sensitivity also improved significantly upon consumption of the protein+ drink
in the MIR subgroup, suggesting that the relative increase in dietary protein and maybe the relative
decrease in carbohydrate intake, also plays a role in hepatic insulin sensitivity. The lower relative
carbohydrate content of subjects’ diets in the protein+ group as compared to control (daily about
20 g of carbohydrates less in the protein+ group) may have contributed to the reduction in fasting
plasma glucose and insulin, adipose tissue insulin resistance, and the increase in systemic insulin
sensitivity [38,39]. While we observed these beneficial effects of the protein+ drink compared to the
control drink in the MIR subgroup, we did not observe them in the no-MIR subgroup, suggesting
that these protein+ drink effects may be MIR subgroup-specific. Whether the results found are a
consequence of increased protein or decreased carbohydrate intake needs further investigation.
In all groups the HbA1c level decreased during the intervention and a clear decline in the HbA1C
level in the no-MIR subgroup on the protein+ and the control product was observed, whereas the
decline in the no-MIR subgroup on control product was more pronounced and significantly different
from the protein+ group. Also, the Disposition Index was significantly different between protein+ and
control of the no-MIR group, where Disposition Index changed in the beneficial direction for control.
Taken together, the clear beneficial effects of the protein+ drink in the MIR group were not observed in
the no-MIR group. We cannot explain these findings and, therefore, this subgroup analysis needs to be
confirmed and conducted in future research focusing on efficacy of protein supplementation in obese
older type 2 diabetes subjects.
In the present study, beneficial effects of the combined lifestyle intervention itself were seen in
both the MIR and the no-MIR subgroup, with clinically relevant improvements in body weight, waist
circumference, BMI, fat mass, visceral fat, hyperglycemia and knee extension power. Such effects are
commonly reported for combined lifestyle interventions [40,41], with the exercise component being
important to sustain health improvements obtained [42]. Remarkably, systolic blood pressure (SBP)
improved (from 144 to 137 mm Hg, p = 0.02) due to the combined lifestyle intervention in the MIR
subgroup only, independent of treatment. It is known that exercise training reduces SBP [43], probably
due to improved endothelial function [44]. Our observation that this was only present in the MIR and
not in the no-MIR subgroup suggests that MIR subgroup-specific effects of the lifestyle intervention
occurred, as was also observed for the effects on VO2 peak. A possible underlying explanation could
be improved vasodilation and improved muscle perfusion in MIR subgroup only [45,46]. Due to the
combined lifestyle intervention muscle blood flow may increase and result in the increased VO2 peak.
An increased blood flow by improved vasodilation could also explain the health benefits observed in
the MIR subgroup when supplemented with a protein+ drink, like the increased appendicular skeletal
muscle mass.Nutrients 2020, 12, 2979 12 of 16
The muscle insulin resistance we focused on in the present study is suggested to be related to
mitochondrial dysfunction [47,48]. It is known that exercise can improve mitochondrial oxidative
capacity and has the potential to improve insulin sensitivity of the muscle [49]. In the MIR subgroup
the combined lifestyle intervention had the tendency to improve muscle insulin sensitivity independent
of the study drink (p = 0.08). It is suggested that disturbed muscle fat oxidative capacity is important
for the development of muscle insulin resistance. This impaired oxidative capacity of the mitochondria
in the muscle results in accumulation of intermediates of lipolysis, which could, in turn, interfere
with insulin signaling and lead to inhibition of insulin-mediated glucose uptake [28,50]. Multiple
physiological aspects of fat metabolism in muscle like ectopic fat storage, skeletal muscle fatty acid
handling, and lipotoxicity may play a role in muscle insulin resistance. Scientific evidence is available,
showing that disturbed fat metabolism in muscle is related to insulin resistance [50–55]. Whether this
is the cause or consequence of diabetes development is still under debate.
In the present retrospective subgroup analysis we had a balanced distribution of MIR and no-MIR
subjects, with protein+ and control (20–22 subjects), enabling us to perform the statistical subgroup
analyses. The subgroups appeared to be less balanced when examining possible confounding variables
like type 2 diabetes status (pre-diabetic or type 2 diabetes) and duration of type 2 diabetes (see Table 2).
It was hypothesized that the MIR subgroup would be representative of type 2 diabetes patients with
the most severe diabetes status. However, more pre-diabetics were present in the MIR (11 subjects)
versus the no-MIR group (2 subjects). This could also partially explain the shorter duration of diabetes
in the MIR subgroup (around 45 months for the MIR group and around 100 months in no-MIR group).
This may have confounded the MIR versus no-MIR subtype intervention effects, which may relate
to the progression of the disease rather than to the subtype itself. Patients with a shorter duration of
type 2 diabetes may be more responsive to the combined lifestyle intervention and protein+ drink,
which has been observed for type 2 diabetes remission with lifestyle [56]. In our study, the more severe
type 2 diabetes patients were more often characterized as no-MIR. At this stage, it is unclear how type
2 diabetes disease progression is related to muscle insulin resistance and this requires further research.
The diabetes subgroups shown in the present study, were based upon the calculation of the muscle
insulin sensitivity index. The use of organ-specific IR indices for subgroup analysis has been done by
others as well [52–54,57]. They stress, like we do, that this in-depth phenotyping of subjects provides
more insight into disturbed underlying disease mechanisms. It is furthermore suggested that the use of
organ-specific IR indices may be interesting and useful in personalization of type 2 diabetes treatment,
and treatment effect evaluation [52–54].
In our study, the following strengths and limitations are present. A strength of the present
study is the use of data of a well-performed randomized-controlled, double-blind trial, the PROBE
study [14]. The number of subjects present in our subgroups was nicely balanced and enabled the
within-group comparison. Limitations of the study can also be identified. The small group sizes
and relatively large standard deviations for some parameters may have limited the ability to obtain
statistical significance. Multiple testing correction was not applied because of the exploratory nature of
this work. The subgroup analysis performed was done retrospectively, thus could not be sufficiently
powered and balanced by rules of controlled trials and a risk of type II errors with the statistical
analysis is present. Follow-up studies are needed to confirm the promising effect of the enriched
protein supplement in combination with lifestyle intervention for subgroups of type 2 diabetic patients.
5. Conclusions
The results of our retrospective study indicate that especially obese, older type 2 diabetes patients
with muscle IR may benefit from the use of a vitamin D and leucine enriched whey protein drink
during combined lifestyle intervention, by showing improved systemic insulin sensitivity, adipose
tissue insulin resistance, and appendicular muscle mass. The combined lifestyle intervention itself
was also more effective in the MIR subgroup. Awaiting confirmation by future controlled trials,Nutrients 2020, 12, 2979 13 of 16
this study indicates subgroup-specific lifestyle intervention responses and reiterates the potential for a
personalized lifestyle and diet approach to support patients with type 2 diabetes.
Author Contributions: W.J.P., R.G.M., J.d.V.-V.d.B., P.J.M.W. and S.W. contributed to the conception and design of
the study. R.G.M. was responsible for data collection. W.J.v.d.B. was responsible for data analysis. W.J.P., R.G.M.
and S.W. were responsible for interpretation of the data. W.J.P. is the guarantor of this work and, as such, had full
access to all the data in the study and takes responsibility for the integrity of the data and the accuracy of the data
analysis. M.P.V.B. and W.J.P. drafted the manuscript. W.J.P., R.G.M., J.d.V.-V.d.B., P.J.M.W. and S.W. contributed to
reviewing and editing the manuscript. W.J.P., R.G.M. and S.W. gave approval of the final version of the manuscript
and take responsibility for the integrity of the data and the accuracy of the data analysis. All authors have read
and agreed to the published version of the manuscript.
Funding: This study was supported by a grant from Topsector Agri & Food, The Netherlands. RGM received a
PhD grant from the Dutch Research Council (NWO). Danone Nutricia Research provided study products and
financial support for conducting the study.
Acknowledgments: We would like to thank the interns Mike Vosskühler and Maarten Costerus for their analysis
of the OGTT response data.
Conflicts of Interest: J.d.V.-v.d.B. is an employee of Danone Nutricia Research. All other authors declare that
there are no relationships that might bias, or be perceived to bias, their work.
Appendix A
Table A1. Composition of the Study Products, per Serving of 150 mL.
Test Product
Component Control Product
Protein+
Energy (kcal) 150 150
Protein (g)
Total (g) 20.7 -
Leucine, total a (g) 2.8 -
EAA, total a (g) 10.6 -
Carbohydrates
Total (g) 9.4 24.5
Sugars b (g) 4.2 15.6
Fat
Total (g) 3.0 5.8
Saturated (g) 0.8 3.2
Mono-unsaturated (g) 1.7 2.1
Poly-unsaturated (g) 0.6 0.6
Fiber (g) 1.25 -
Vitamin D3 c (µg) 20 -
Calcium c (mg) 500 0.7
EAA, essential amino acids (Leu, Ile, Val, Phe, Met, His, Trp, Thr, and Lys); BCAA: branched-chain amino acids
(Leu, Ile, and Val). a Provided by protein and free BCAA. b Consisting of lactose and fructose. c The test product
also contained the following micronutrients: phosphorus (250 mg), magnesium (37 mg), iron (2.4 mg), zinc (2.2 mg),
copper (270 mg), manganese (0.50 mg), fluoride (0.15 mg), molybdenum (15 µg), selenium (15 µg), chromium (7.5 µg),
iodine (20 µg), vitamin A (152 µg retinol equivalents), vitamin E (7.5 mg α-tocopherol equivalents), vitamin K
(12 µg), vitamin B-1 (0.23 mg), vitamin B-2 (0.25 mg), niacin (8.8 mg niacin equivalents), pantothenic acid (0.81 mg),
vitamin B-6 (750 µg), folic acid (200 µg), vitamin B-12 (3.0 µg), biotin (6.1 µg), vitamin C (32 mg), carotenoids (300 µg),
and choline (55 mg). Protein+, an enriched protein drink.
References
1. Lim, E.L.; Hollingsworth, K.G.; Aribisala, B.S.; Chen, M.J.; Mathers, J.C.; Taylor, R. Reversal of Type 2 Diabetes:
Normalisation of Beta Cell Function in Association with Decreased Pancreas and Liver Triacylglycerol.
Diabetologia 2011, 54, 2506–2514. [CrossRef]
2. Steven, S.; Hollingsworth, K.G.; Small, P.K.; Woodcock, S.A.; Pucci, A.; Aribisala, B.; Al-Mrabeh, A.; Daly, A.K.;
Batterham, R.L.; Taylor, R. Weight Loss Decreases Excess Pancreatic Triacylglycerol Specifically in Type 2
Diabetes. Diabetes Care 2016, 39, 158–165. [CrossRef]Nutrients 2020, 12, 2979 14 of 16
3. Steven, S.; Hollingsworth, K.G.; Al-Mrabeh, A.; Avery, L.; Aribisala, B.; Caslake, M.; Taylor, R.
Very Low-Calorie Diet and 6 Months of Weight Stability in Type 2 Diabetes: Pathophysiological Changes in
Responders and Nonresponders. Diabetes Care 2016, 39, 808–815. [CrossRef]
4. Lean, M.E.; Leslie, W.S.; Barnes, A.C.; Brosnahan, N.; Thom, G.; McCombie, L.; Peters, C.; Zhyzhneuskaya, S.;
Al-Mrabeh, A.; Hollingsworth, K.G.; et al. Primary Care-Led Weight Management for Remission of Type 2
Diabetes (DiRECT): An Open-Label, Cluster-Randomised Trial. Lancet 2018, 391, 541–551. [CrossRef]
5. Wycherley, T.P.; Buckley, J.D.; Noakes, M.; Clifton, P.M.; Brinkworth, G.D. Comparison of the Effects of
Weight Loss from a High-Protein versus Standard-Protein Energy-Restricted Diet on Strength and Aerobic
Capacity in Overweight and Obese Men. Eur. J. Nutr. 2013, 52, 317–325. [CrossRef]
6. Villareal, D.T.; Chode, S.; Parimi, N.; Sinacore, D.R.; Hilton, T.; Armamento-Villareal, R.; Napoli, N.; Qualls, C.;
Shah, K. Weight Loss, Exercise, or Both and Physical Function in Obese Older Adults. N. Engl. J. Med. 2011,
364, 1218–1229. [CrossRef] [PubMed]
7. Rosenberg, I.H. Sarcopenia: Origins and Clinical Relevance. J. Nutr. 1997, 127, 990S–991S. [CrossRef]
8. Seok, W.P.; Goodpaster, B.H.; Jung, S.L.; Kuller, L.H.; Boudreau, R.; De Rekeneire, N.; Harris, T.B.;
Kritchevsky, S.; Tylavsky, F.A.; Nevitt, M.; et al. Excessive Loss of Skeletal Muscle Mass in Older Adults with
Type 2 Diabetes. Diabetes Care 2009, 32, 1993–1997. [CrossRef]
9. Thiebaud, D.; Jacot, E.; DeFronzo, R.A.; Maeder, E.; Jequier, E.; Felber, J.-P.P. The Effect of Graded Doses of
Insulin on Total Glucose Uptake, Glucose Oxidation, and Glucose Storage in Man. Diabetes 1982, 31, 957–963.
[CrossRef]
10. Willey, K.A.; Fiatarone Singh, M.A. Battling Insulin Resistance in Elderly Obese People with Type 2 Diabetes:
Bring on the Heavy Weights. Diabetes Care 2003, 26, 1580–1588. [CrossRef]
11. Trouwborst, I.; Verreijen, A.; Memelink, R.; Massanet, P.; Boirie, Y.; Weijs, P.; Tieland, M. Exercise and
Nutrition Strategies to Counteract Sarcopenic Obesity. Nutrients 2018, 10, 605. [CrossRef] [PubMed]
12. Frimel, T.N.; Sinacore, D.R.; Villareal, D.T. Exercise Attenuates the Weight-Loss-Induced Reduction in Muscle
Mass in Frail Obese Older Adults. Med. Sci. Sports Exerc. 2008, 40, 1213–1219. [CrossRef] [PubMed]
13. Verreijen, A.M.; Verlaan, S.; Engberink, M.F.; Swinkels, S.; de Vogel-van den Bosch, J.; Weijs, P.J.M. A High
Whey Protein-, Leucine-, and Vitamin D-Enriched Supplement Preserves Muscle Mass during Intentional
Weight Loss in Obese Older Adults: A Double-Blind Randomized Controlled Trial. Am. J. Clin. Nutr. 2015,
101, 279–286. [CrossRef]
14. Memelink, R.; Pasman, W.; Bongers, A.; Tump, A.; van Ginkel, A.; Tromp, W.; Wopereis, S.; Verlaan, S.; de
Vogel-van den Bosch, J.; Weijs, P. Effect of a Whey Protein Drink Enriched with Leucine and Vitamin D on
Lean Mass and Glycemic Control during a Lifestyle Intervention in Obese Older Adults with (Pre-)Diabetes
Type 2: A Double-Blind RCT. Clin. Nutr. 2018, 37, S216–S217. [CrossRef]
15. Van Ommen, B.; van der Greef, J.; Ordovas, J.M.; Daniel, H. Phenotypic Flexibility as Key Factor in the
Human Nutrition and Health Relationship. Genes Nutr. 2014, 9, 1–9. [CrossRef]
16. DeFronzo, R.A. Insulin Resistance, Lipotoxicity, Type 2 Diabetes and Atherosclerosis: The Missing Links.
The Claude Bernard Lecture 2009. Diabetologia 2010, 53, 1270–1287. [CrossRef]
17. Blanco-Rojo, R.; Alcala-Diaz, J.F.; Wopereis, S.; Perez-Martinez, P.; Quintana-Navarro, G.M.; Marin, C.;
Ordovas, J.M.; van Ommen, B.; Perez-Jimenez, F.; Delgado-Lista, J.; et al. The Insulin Resistance Phenotype
(Muscle or Liver) Interacts with the Type of Diet to Determine Changes in Disposition Index after 2 Years of
Intervention: The CORDIOPREV-DIAB Randomised Clinical Trial. Diabetologia 2016, 59, 67–76. [CrossRef]
18. Abdul-Ghani, M.A.; Matsuda, M.; Balas, B.; DeFronzo, R.A. Muscle and Liver Insulin Resistance Indexes
Derived from the Oral Glucose Tolerance Test. Diabetes Care 2007, 30, 89–94. [CrossRef]
19. Matsuda, M.; Defronzo, R.A. Insulin Sensitivity Indices Obtained From Comparison with the Euglycemic
Insulin Clamp. Diabetes Care 1999, 22, 1462–1470.
20. Kahn, S.E.; Prigeon, R.L.; Mcculloch, D.K.; Boyko, E.J.; Bergman, R.N.; Schwartz, M.W.; Neifing, J.L.;
Ward, W.K.; Beard, J.C.; Palmer, J.P.; et al. Quantification of the Relationship Between Insulin Sensitivity and
P-Cell Function in Human Subjects Evidence for a Hyperbolic Function with a Regulated Feedback Loop
Control System Such That for Any Difference in S, a Proportionate Reciprocal Difference. Diabetes 1993, 42,
1663–1672.
21. Ter Horst, K.W.; Van Galen, K.A.; Gilijamse, P.W.; Hartstra, A.V.; De Groot, P.F.; Van Der Valk, F.M.;
Ackermans, M.T.; Nieuwdorp, M.; Romijn, J.A.; Serlie, M.J. Methods for Quantifying Adipose Tissue Insulin
Resistance in Overweight/Obese Humans. Int. J. Obes. 2017, 41, 1288–1294. [CrossRef] [PubMed]Nutrients 2020, 12, 2979 15 of 16
22. Larsen, T.M.; Dalskov, S.; Van Baak, M.; Jebb, S.; Kafatos, A.; Pfeiffer, A.; Martinez, J.A.;
Handjieva-Darlenska, T.; Kunešová, M.; Holst, C.; et al. The Diet, Obesity and Genes (Diogenes) Dietary
Study in Eight European Countries—A Comprehensive Design for Long-Term Intervention. Obes. Rev. 2010,
11, 76–91. [CrossRef]
23. Delgado-Lista, J.; Perez-Martinez, P.; Garcia-Rios, A.; Alcala-Diaz, J.F.; Perez-Caballero, A.I.;
Gomez-Delgado, F.; Fuentes, F.; Quintana-Navarro, G.; Lopez-Segura, F.; Ortiz-Morales, A.M.; et al.
CORonary Diet Intervention with Olive Oil and Cardiovascular PREVention Study (the CORDIOPREV
Study): Rationale, Methods, and Baseline Characteristics A Clinical Trial Comparing the Efficacy of a
Mediterranean Diet Rich in Olive Oil versus a Low-Fat Diet. Am. Heart J. 2016, 177, 42–50. [CrossRef]
24. Wopereis, S.; Stroeve, J.H.M.; Stafleu, A.; Bakker, G.C.M.; Burggraaf, J.; van Erk, M.J.; Pellis, L.; Boessen, R.;
Kardinaal, A.A.F.; van Ommen, B. Multi-Parameter Comparison of a Standardized Mixed Meal Tolerance
Test in Healthy and Type 2 Diabetic Subjects: The PhenFlex Challenge. Genes Nutr. 2017, 12, 1–14. [CrossRef]
25. Van Den Broek, T.J.; Bakker, G.C.M.M.; Rubingh, C.M.; Bijlsma, S.; Stroeve, J.H.M.M.; Van Ommen, B.;
Van Erk, M.J.; Wopereis, S. Ranges of Phenotypic Flexibility in Healthy Subjects. Genes Nutr. 2017, 12, 1–14.
[CrossRef]
26. Neeter, C.; Gustavsson, A.; Thomeé, P.; Augustsson, J.; Thomeé, R.; Karlsson, J. Development of a Strength
Test Battery for Evaluating Leg Muscle Power after Anterior Cruciate Ligament Injury and Reconstruction.
Knee Surg. Sports Traumatol. Arthrosc. 2006, 14, 571–580. [CrossRef]
27. Praet, S.F.E.; Van Loon, L.J.C. Optimizing the Therapeutic Benefits of Exercise in Type 2 Diabetes.
J. Appl. Physiol. 2007, 103, 1113–1120. [CrossRef]
28. Blaak, E.E. Metabolic Fluxes in Skeletal Muscle in Relation to Obesity and Insulin Resistance. Best Pract. Res.
Clin. Endocrinol. Metab. 2005, 19, 391–403. [CrossRef]
29. Goodpaster, B.H.; Sparks, L.M. Metabolic Flexibility in Health and Disease. Cell Metab. 2017, 25, 1027–1036.
[CrossRef]
30. Cartee, G.D.; Hepple, R.T.; Bamman, M.M.; Zierath, J.R. Exercise Promotes Healthy Aging of Skeletal Muscle.
Cell Metab. 2016, 23, 1034–1047. [CrossRef] [PubMed]
31. Garcia, M.; Seelaender, M.; Sotiropoulos, A.; Coletti, D.; Lancha, A.H. Vitamin D, Muscle Recovery, Sarcopenia,
Cachexia, and Muscle Atrophy. Nutrition 2019, 60, 66–69. [CrossRef] [PubMed]
32. Sacerdote, A.; Dave, P.; Lokshin, V.; Bahtiyar, G. Type 2 Diabetes Mellitus, Insulin Resistance, and Vitamin D.
Curr. Diabetes Rep. 2019. [CrossRef] [PubMed]
33. Pramono, A.; Jocken, J.W.E.; Blaak, E.E.; van Baak, M.A. The Effect of Vitamin D Supplementation on Insulin
Sensitivity: A Systematic Review and Meta-Analysis. Diabetes Care 2020, 43, 1659–1669. [CrossRef]
34. Rhoads, R.P.; Baumgard, L.H.; El-Kadi, S.W.; Zhao, L.D. Roles for Insulin-Supported Skeletal Muscle Growth.
J. Anim. Sci. 2016, 94, 1791–1802. [CrossRef]
35. Stokes, T.; Hector, A.J.; Morton, R.W.; McGlory, C.; Phillips, S.M. Recent Perspectives Regarding the Role of
Dietary Protein for the Promotion of Muscle Hypertrophy with Resistance Exercise Training. Nutrients 2018,
10, 180. [CrossRef]
36. Abdulla, H.; Smith, K.; Atherton, P.J.; Idris, I. Role of Insulin in the Regulation of Human Skeletal Muscle
Protein Synthesis and Breakdown: A Systematic Review and Meta-Analysis. Diabetologia 2016, 59, 44–55.
[CrossRef]
37. James, H.A.; O’Neill, B.T.; Nair, K.S. Insulin Regulation of Proteostasis and Clinical Implications. Cell Metab.
2017, 26, 310–323. [CrossRef]
38. Krebs, J.; Hall, R.; Parry Strong, A. Importance of Low Carbohydrate Diets in Diabetes Management.
Nutr. Diet. Suppl. 2016, 8, 9. [CrossRef]
39. Van Zuuren, E.J.; Fedorowicz, Z.; Kuijpers, T.; Pijl, H. Effects of Low-Carbohydrate-Compared with
Low-Fat-Diet Interventions on Metabolic Control in People with Type 2 Diabetes: A Systematic Review
Including GRADE Assessments. Am. J. Clin. Nutr. 2018, 108, 300–331. [CrossRef]
40. Salas-Salvadó, J.; Díaz-López, A.; Ruiz-Canela, M.; Basora, J.; Fitó, M.; Corella, D.; Serra-Majem, L.;
Wärnberg, J.; Romaguera, D.; Estruch, R.; et al. Effect of a Lifestyle Intervention Program with
Energy-Restricted Mediterranean Diet and Exercise on Weight Loss and Cardiovascular Risk Factors:
One-Year Results of the PREDIMED-Plus Trial. Diabetes Care 2019, 42, 777–788. [CrossRef]Nutrients 2020, 12, 2979 16 of 16
41. Pot, G.K.; Ce Battjes-Fries, M.; Patijn, O.N.; Pijl, H.; Witkamp, R.F.; De Visser, M.; Van Der Zijl, N.;
De Vries, M.; Voshol, P.J.; Bolk, L. Nutrition and Lifestyle Intervention in Type 2 Diabetes: Pilot Study in the
Netherlands Showing Improved Glucose Control and Reduction in Glucose Lowering Medication. BMJ Nutr.
Prev. Health 2019. [CrossRef]
42. Bouchonville, M.; Armamento-Villareal, R.; Shah, K.; Napoli, N.; Sinacore, D.R.; Qualls, C.; Villareal, D.T.
Weight Loss, Exercise or Both and Cardiometabolic Risk Factors in Obese Older Adults: Results of a
Randomized Controlled Trial. Int. J. Obes. 2014, 38, 423–431. [CrossRef] [PubMed]
43. Cornelissen, V.A.; Smart, N.A. Exercise Training for Blood Pressure: A Systematic Review and Meta-Analysis.
Journal of the American Heart Association. J. Am. Heart Assoc. 2013. [CrossRef]
44. Vona, M.; Codeluppi, G.M.; Iannino, T.; Ferrari, E.; Bogousslavsky, J.; Von Segesser, L.K. Effects of Different
Types of Exercise Training Followed by Detraining on Endothelium-Dependent Dilation in Patients with
Recent Myocardial Infarction. Circulation 2009, 119, 1601–1608. [CrossRef] [PubMed]
45. Pinckard, K.; Baskin, K.K.; Stanford, K.I. Effects of Exercise to Improve Cardiovascular Health.
Front. Cardiovasc. Med. 2019, 6, 69. [CrossRef]
46. Keske, M.A.; Dwyer, R.M.; Russell, R.D.; Blackwood, S.J.; Brown, A.A.; Hu, D.; Premilovac, D.; Richards, S.M.;
Rattigan, S. Regulation of Microvascular Flow and Metabolism: An Overview. Clin. Exp. Pharm. Physiol.
2017, 44, 143–149. [CrossRef]
47. Di Meo, S.; Iossa, S.; Venditti, P. Skeletal Muscle Insulin Resistance: Role of Mitochondria and Other ROS
Sources. J. Endocrinol. 2017, 233, R15–R42. [CrossRef]
48. Montgomery, M.K.; Turner, N. Mitochondrial Dysfunction and Insulin Resistance: An Update. Endocr. Connect.
2015, 4. [CrossRef]
49. Broskey, N.T.; Greggio, C.; Boss, A.; Boutant, M.; Dwyer, A.; Schlueter, L.; Hans, D.; Gremion, G.; Kreis, R.;
Boesch, C.; et al. Skeletal Muscle Mitochondria in the Elderly: Effects of Physical Fitness and Exercise
Training. J. Clin. Endocrinol. Metab. 2014, 99, 1852–1861. [CrossRef]
50. Abdul-Ghani, M.A.; Defronzo, R.A. Pathogenesis of Insulin Resistance in Skeletal Muscle.
J. Biomed. Biotechnol. 2010, 2010, 476279. [CrossRef]
51. van der Kolk, B.W.; Goossens, G.H.; Jocken, J.W.; Blaak, E.E. Altered Skeletal Muscle Fatty Acid Handling Is
Associated with the Degree of Insulin Resistance in Overweight and Obese Humans. Diabetologia 2016, 59,
2686–2696. [CrossRef] [PubMed]
52. van der Kolk, B.W.; Vogelzangs, N.; Jocken, J.W.E.; Valsesia, A.; Hankemeier, T.; Astrup, A.; Saris, W.H.M.;
Arts, I.C.W.; van Greevenbroek, M.M.J.; Blaak, E.E. Plasma Lipid Profiling of Tissue-Specific Insulin Resistance
in Human Obesity. Int. J. Obes. 2019, 43, 989–998. [CrossRef] [PubMed]
53. Trouwborst, I.; Bowser, S.M.; Goossens, G.H.; Blaak, E.E. Ectopic Fat Accumulation in Distinct Insulin
Resistant Phenotypes; Targets for Personalized Nutritional Interventions. Front. Nutr. 2018, 5, 77. [CrossRef]
[PubMed]
54. Blaak, E.E. Characterisation of Fatty Acid Metabolism in Different Insulin-Resistant Phenotypes by Means of
Stable Isotopes. Proc. Nutr. Soc. 2017, 76, 419–424. [CrossRef]
55. Meex, R.C.R.; Blaak, E.E.; van Loon, L.J.C. Lipotoxicity Plays a Key Role in the Development of Both Insulin
Resistance and Muscle Atrophy in Patients with Type 2 Diabetes. Obes. Rev. 2019, 20, 1205–1217. [CrossRef]
56. Taylor, R.; Al-Mrabeh, A.; Zhyzhneuskaya, S.; Peters, C.; Barnes, A.C.; Aribisala, B.S.; Hollingsworth, K.G.;
Mathers, J.C.; Sattar, N.; Lean, M.E.J. Erratum: Remission of Human Type 2 Diabetes Requires Decrease in
Liver and Pancreas Fat Content but Is Dependent upon Capacity for β Cell Recovery. Cell Metab. 2018, 28,
667. [CrossRef]
57. Blaak, E.E. Current metabolic perspective on malnutrition in obesity: Towards more subgroup-based
nutritional approaches? Proc. Nutr. Soc. 2020, 1–7. [CrossRef]
© 2020 by the authors. Licensee MDPI, Basel, Switzerland. This article is an open access
article distributed under the terms and conditions of the Creative Commons Attribution
(CC BY) license (http://creativecommons.org/licenses/by/4.0/).You can also read