2018 FULL-YEAR RESULTS - URW
←
→
Page content transcription
If your browser does not render page correctly, please read the page content below
2018 FULL-YEAR RESULTS
2018 FULL-YEAR RESULTS

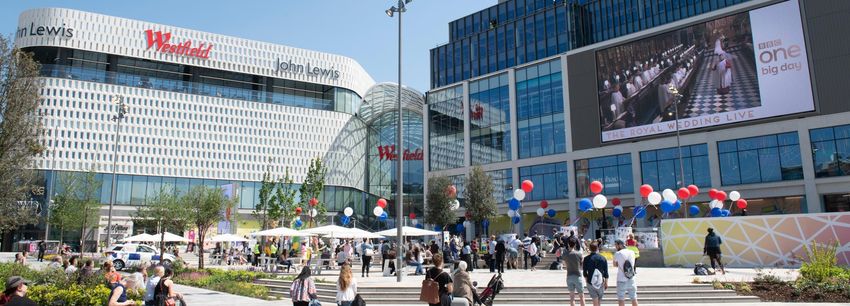
A historic year             +7.2% AREPS growth         Delivery of Westfield London
                                                       (phase 2)

               +4.0% Lfl growth
          in Continental Europe                                          Strong trading
                                                                         of deliveries

    Successful leasing
         and rotation                                                          €1.5 Bn invested
                                                                               in capital expenditures

      Synergies above                                                          €2.0 Bn
                target                                                         of disposals

          Initial 5-year business
                                                                  CSR strategy rewarded
                     plan (US/UK)

                          Westfield integration   Attractive financing

                                                                                          2018 FULL-YEAR RESULTS   2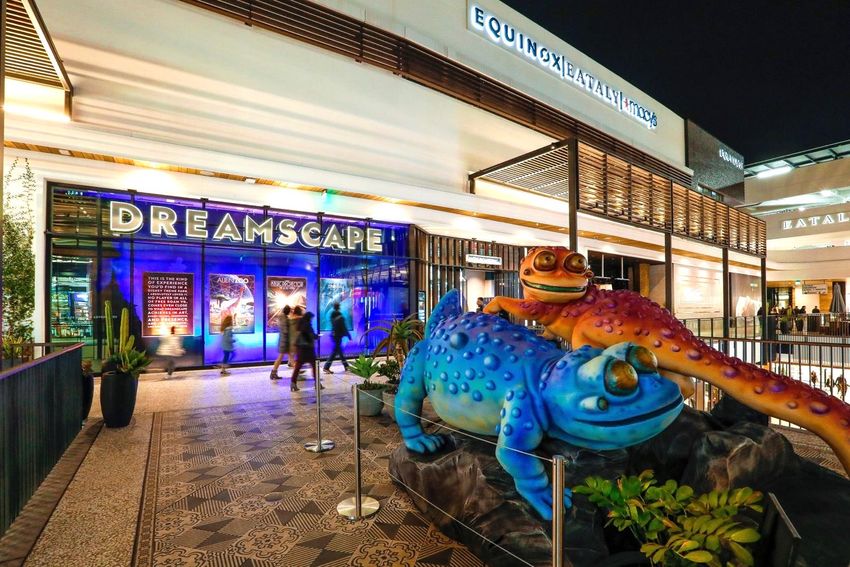
On June 7, 2018, Unibail-Rodamco (“UR”) announced it had completed the acquisition of Westfield Corporation (“WFD”), to create Unibail-Rodamco-Westfield
(“URW” or “the Group”), the premier global developer and operator of flagship shopping destinations. URW combines two of the strongest and most respected names
in the real estate industry to build on their legacies. The acquisition of WFD is a natural extension of UR’s strategy of concentration, differentiation
and innovation.
The world’s premier developer and operator of Flagship shopping
destinations
As at December 31, 2018                                     Europe             United States                          URW
GMV (€ Bn)(1)                                                49.4                     15.8                            65.2
Countries(2)                                                 12                          1                           13
Shopping Centres                                             64                       29                             93
Flagships(3)                                                 41                       15                             56
   - % of retail GMV                                         89                         83                           87
   - Average footfall (Mn)                                   17                         13                           16

           Portfolio by segment(1)                                                    Portfolio by region(1)

                C&E 5% Services 2%                                                  Austria 4% The Netherlands 3%
      Offices 6%                                                               Nordics 6%
                                                                                                              France Retail 25%
                                                                             Spain 6%

                                                                         Germany 6%
                    €65.2 Bn                                                                 €65.2 Bn
                                                                     Central Europe 8%                          France Offices 4%
                                     Shopping Centres 87%

                                                                                                              France C&E 5%
                                                                           UK & Italy 9%
                                                                                                     US 24%
                                                                                                                    2018 FULL-YEAR RESULTS   3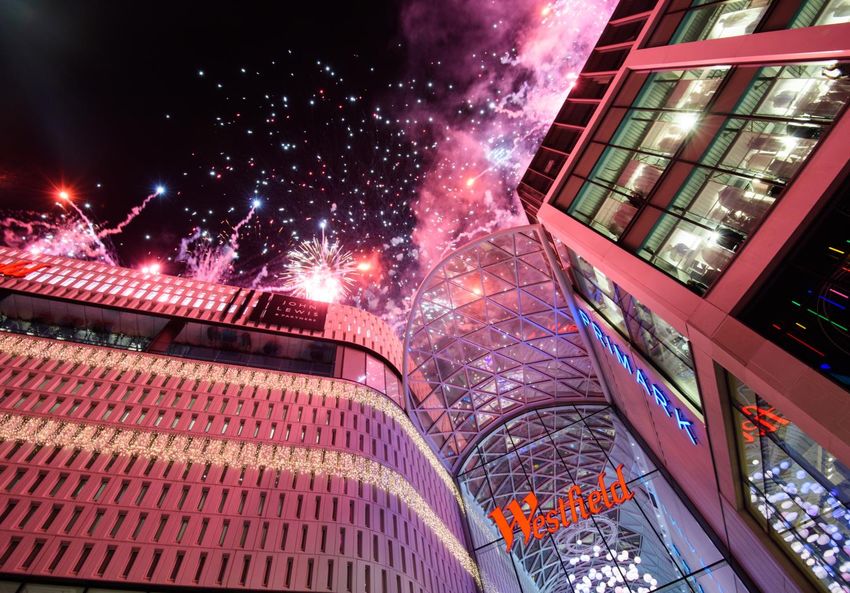
As at December 31, 2018, URW owned and operated 93 shopping centres in 13 countries, of which 56 are Flagships in the most dynamic cities in Europe
and in the United States. In 2018, URW’s assets attracted circa 1.2 billion visits. The Group’s total proportionate portfolio, including its services business, is valued
at €65.2 Bn (€62.7 Bn(4) on an IFRS basis).

(1)   The proportionate GMV for the assets fully consolidated, the ownership at share of the GMV of assets accounted for using the equity method and the equity values for the assets not controlled (Zlote Tarasy, Ring Center and Gropius Passagen)
(2)   Standing assets only, excluding assets under development as at December 31, 2018
(3)   Assets of a certain size and / or with footfall in excess of 10 million per year, substantial growth potential for the Group based on their appeal to both retailers and visitors, iconic architecture or design and a strong footprint in their area
(4)   In terms of consolidated GMV as at December 31, 2018, including values of shares in assets accounted for using the equity method and services. URW’s US and UK service businesses, Airports and Development, Design & Construction business
      were valued by PWC as at May 31, 2018 and included in the consolidated Gross Market Value (GMV) as at December 31, 2018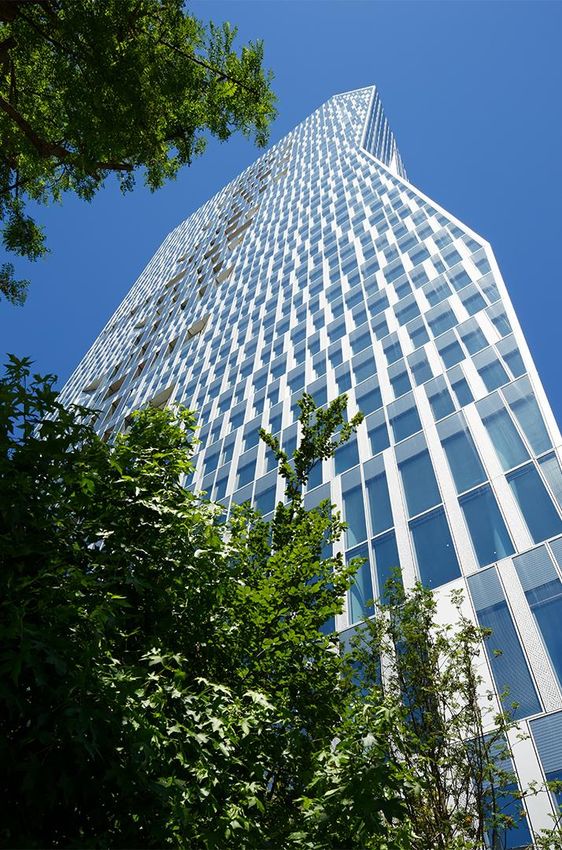
FINANCIAL RESULTS
2018 Full Year Results
€ Mn                                     FY-2018(1)       FY-2017     Growth   Lfl Growth(2)
Shopping Centres                          1,916            1,400      +36.9%      +4.0%
Offices                                     143              141       +1.3%      +4.5%
Convention & Exhibition                     102               96       +6.2%      +4.0%
Net Rental Income                         2,161            1,637      +32.0%     +4.0%

Recurring Net Result (Group share)        1,610            1,202      +33.9%
Recurring EPS(3)                          13.15            12.05       +9.1%
Adjusted Recurring EPS(4)                12.92             12.05      +7.2%
Per share data (€)                   Dec. 31, 2018    Dec. 31, 2017   Growth

EPRA NAV(5)                            221.80            211.00       +5.1%

Going Concern NAV(6)                    233.90           219.20       +6.7%
EPRA NNNAV(7)                           210.80           200.50       +5.1%

                                                                                 2018 FULL-YEAR RESULTS   5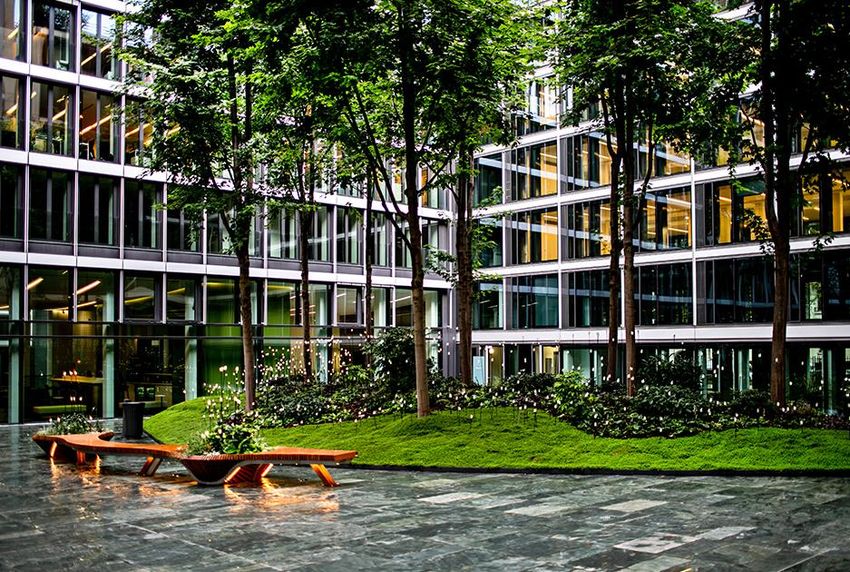
Going Concern NAV stood at €233.90 per share as at December 31, 2018, an increase of +€14.70 (+6.7%) compared to December 31, 2017. This
was the sum of:
      an increase of +€23.18 per share;
      the impact of the payment of the 2018 dividend of -€10.80; and
      the positive impact of the +€2.32 mark-to-market of the fixed-rate debt and derivatives.

(1)   URW results include the contribution of former WFD as from June 1, 2018
(2)   Net Rental Income (NRI) like-for-like growth excluding acquisitions, divestments, transfers to and from pipeline (extensions, brownfields or redevelopment of an asset when operations are stopped to enable works), all other changes resulting
      in any change to the square meters and currency exchange rate differences in the periods analysed. UR scope only. The Convention & Exhibition business is restated for the impact of the triennial INTERMAT exhibition and the closure
      of Pullman Montparnasse
(3)   Average number of shares used for Recurring EPS computation: 122,412,784 for 2018 and 99,752,597 for 2017
(4)   Under IFRS, the Hybrid Securities are accounted for as shareholders’ equity. The Adjusted Recurring Earnings are calculated based on the Recurring net result for the period attributable to the holders of the Stapled Shares minus the coupon
      on the Hybrid Securities (from June 1, 2018)
(5)   The EPRA NAV per share as at December 31, 2018 includes €12.90 of Westfield and UR Germany goodwill not related to fee business or activities not recognized as intangibles
(6)   The Going Concern NAV corresponds to the amount of equity needed to replicate the Group’s portfolio with its current financial structure – on the basis of 138,445,448 fully diluted number of shares as at December 31, 2018 including
      outstanding ORAs, ORNANEs and stock options in the money as at December 31, 2018 (vs. 99,910,659 as at December 31, 2017)
(7)   EPRA NNNAV (triple net asset value): corresponds to the Going concern NAV per share less the estimated transfer taxes and capital gain taxes
      Figures may not add up due to rounding
OPERATIONAL HIGHLIGHTS
Strong retail NRI growth
Net Rental Income (€ Mn)   FY-2018(1)   FY-2017   Growth   Lfl Growth(2)
France                        651         618      +5.3%     +4.5%
Central Europe               212          174     +21.7%     +5.5%
Spain                        155          161      -3.6%     +2.8%
Nordics                      141          146      -2.9%     +4.9%
Austria                      108          103      +4.3%     +4.9%
Germany                      140          136      +2.7%     +2.7%
The Netherlands                59          62      -4.4%     -3.5%
Total Continental Europe   1,466        1,400      +4.7%    +4.0%
United States                351            -          -

United Kingdom                 99           -          -

Total                      1,916        1,400     +36.9%

                                                              2018 FULL-YEAR RESULTS   7
The UR total net change in NRI amounted to +€65.9 Mn due to:
+€39.5 Mn from the delivery of shopping centres or new units, predominantly in Central Europe (Wroclavia, Centrum Chodov and Arkadia), France (mainly the Carré Sénart
and Parly 2 extensions and new units in Les Quatre Temps) and Spain (Glòries) in H2-2017;
+€9.7 Mn from the acquisition of additional units, mainly in Central Europe, Spain and France;
-€3.1 Mn due to assets moved to the pipeline, mainly in France, The Netherlands and Austria;
-€6.6 Mn due to a negative currency translation effect from SEK;
-€23.3 Mn due to disposals of assets, mainly in Spain (Barnasud in 2017 and El Faro, Bahia Sur, Los Arcos and Vallsur in July 2018), France (the Channel Outlet Stores and L’Usine
Roubaix in 2017) and the Nordics (Eurostop Arlanda, Arninge Centrum and Eurostop Örebro in 2017); +€49.7 Mn of like-for-like growth. This +4.0% like-for-like NRI growth
exceeded indexation by +260 bps.
(1) URW results include the contribution of former WFD assets as from June 1, 2018
(2) Net Rental Income (NRI) like-for-like growth excluding acquisitions, divestments, transfers to and from pipeline (extensions, brownfields or redevelopment of an asset when operations are stopped to enable works), all other changes resulting
in any change to the square meters and currency exchange rate differences in the periods analyzed
Figures may not add up due to rounding(1)
Consistent Lfl NRI growth above indexation (Continental Europe)
+5.0%
+4.7%
Average +4.3%
Lfl growth +3.8% +3.9% +4.0%
4.0% +3.4%
2.6%
3.5%
2.6%
3.6%
3.0%
3.6%
3.1%
2.1%
1.4% 1.5%
0.8% 0.7%
0.3% 0.3%
2013 2014 2015 2016 2017 2018 2018
(2)
Flagships
Lfl growth excluding indexation Indexation
2018 FULL-YEAR RESULTS 8The +4.0% like-for-like NRI growth (+5.0% for Flagships) reflects a doubling of indexation (+1.4%) vs. 2017, as well as the growth of +1.3% in renewals and relettings and
“Other”. “Other” in France was +2.2%, as a result of reversal of provisions for doubtful debtors. The increase in “Other” in Central Europe resulted from higher Sales
Based Rents (SBR) and Specialty leasing income, in Austria from lower non-rechargeable expenses, and in Germany from indemnities. In The Netherlands, the -6.8% in
“Other” is due to the booking of provisions for doubtful debtors.
(1) Net Rental Income (NRI) like-for-like growth excluding acquisitions, divestments, transfers to and from pipeline (extensions, brownfields or redevelopment of an asset when operations are stopped to enable works), all other changes resulting
in any change to the square meters and currency exchange rate differences in the periods analyzed
(2) The UR Flagship assets are: Les Quatre Temps, Aéroville, Parly 2, Vélizy 2, Carré Sénart, Rosny 2, Le Forum des Halles, Carrousel du Louvre, CNIT, Confluence, La Part-Dieu, Villeneuve 2, Euralille, Polygone Riviera, La Vaguada, Parquesur,
Bonaire, Splau, La Maquinista, Glòries, Donau Zentrum, Shopping City Süd, Centrum Cerny Most, Centrum Chodov, Wroclavia, Galeria Mokotow, Zlote Tarasy, Arkadia, Aupark, Jumbo, Fisketorvet, Mall of Scandinavia, Täby Centrum, Stadshart
Amstelveen, Leidsenhage, Ruhr Park, Gropius Passagen, CentrO and Pasing ArcadenDynamic changes in tenant mix…
1st in Sweden 1st in Austria 1st in mall 1st in mall 1st in France
1st in Germany in France in France
1st in France 1st in France 1st in mall 1st in Austria 1st in mall
1st in Germany 1st in Spain in the Netherlands in Sweden
Parly 2, Mercedes-Benz
2018 FULL-YEAR RESULTS 9With a strategy based on differentiation and exclusive retail destinations, UR’s leasing teams signed 173 leases(1) in standing assets with International Premium Retailers (IPRs(2)) (vs. 179), whose share in UR’s rotation reached 16.4%. (1) Excluding pipeline (2) IPR: retailer with strong and international brand recognition and a differentiating store design and product approach, which UR believes will increase the appeal of the shopping centres
2.3%    2.4%

 … drives tenant sales growth…
                                                                                                Nordics
                                                                                                             8.2%

                                                                                             1.4%                   2.7%
                  Continental Europe
                                                                                     -0.1%
                        +3.8%
     +3.0%                                                                           Germany           Central Europe
                                                                                                      1.7%
                                          +1.0%                       3.4%

Shopping Centres(1)     Flagships(2)   National Sales
                                                                                             -2.0%
                                         Indices(3)                          -0.4%
                                                                       France                  Austria

                                                        3.9%
                                                               1.8%

                                                          Spain

                                                                                                                           2018 FULL-YEAR RESULTS   10
Through November 30, 2018, UR’s tenant sales increased by +3.0% and by +3.8% for Flagship centres, outperforming the aggregate national sales index by +205 bps
and +283 bps, respectively. Excluding assets in a disposal process, UR’s tenant sales grew by +3.1%.
In France, tenant sales increased by +3.4%, outperforming the IFLS index by +380 bps and the CNCC index by +520 bps. The main contributors to sales growth were recent
deliveries: Carré Sénart (+38.4%) and Forum des Halles (+13.0%). These were partially offset by So Ouest (-4.6%), due to closing of M&S in June 2017 and new tenants
in the restructured unit opening only in Q4-2018;
In Central Europe, tenant sales increased by +8.2%, primarily due to Centrum Chodov (+43.3%) and Aupark (+4.1%). Sales of UR’s assets in Warsaw (Arkadia and Galeria Mokotow)
remained stable despite the introduction of the partial Sunday trading ban in Poland in March 2018;
Spanish tenant sales grew by +3.9% compared to the national sales index at +1.8%. Strong sales increase was recorded in La Vaguada (+9.4%) and Parquesur (+1.5%),
while La Maquinista and Splau remained stable;
In the Nordics, although the performance of fashion and department stores in the region was weak, tenant sales increased by +2.3%, due to an outstanding performance
of Mall of Scandinavia (+6.4%);
In Austria, tenant sales (-2.0%) continued to be impacted by the bankruptcy of a major electronics retailer in December 2017 and a new tenant in that unit opening
only in August 2018;
In Germany, tenant sales remained broadly flat throughout the portfolio.
In terms of sectors, sport (+9.7%), food (+9.6%), dining (+5.7%) and health & beauty (+4.9%) posted the highest sales increases, illustrating the importance of UR’s
approach to offering visitors a differentiated experience whilst providing a strong convenience offer at the same time and expanding these growth sectors
in its shopping centres. Sales of fashion apparel, the sector with the most GLA within UR’s shopping centres, remained stable.
Through December 31, 2018, tenant sales in UR’s shopping centres increased by +2.7%, compared to the same period in 2017, in part as a result of lower growth
in France in December (+0.7%) due to the “yellow vest” protests.
(1) The UR Flagship assets are: Les Quatre Temps, Aéroville, Parly 2, Vélizy 2, Carré Sénart, Rosny 2, Le Forum des Halles, Carrousel du Louvre, CNIT, Confluence, La Part-Dieu, Villeneuve 2, Euralille, Polygone Riviera, La Vaguada, Parquesur,
Bonaire, Splau, La Maquinista, Glòries, Donau Zentrum, Shopping City Süd, Centrum Cerny Most, Centrum Chodov, Wroclavia, Galeria Mokotow, Zlote Tarasy, Arkadia, Aupark, Jumbo, Fisketorvet, Mall of Scandinavia, Täby Centrum, Stadshart
Amstelveen, Leidsenhage, Ruhr Park, Gropius Passagen, CentrO and Pasing Arcaden
(2) Tenant sales data do not include Jumbo and Zlote Tarasy as they are not managed by UR. Tenant sales performance in UR’s shopping centres (except The Netherlands) in operation, including extensions of existing assets, but excluding
deliveries of new brownfield projects, newly acquired assets and assets under heavy refurbishment. For 2018 reporting period, shopping centres excluded due to delivery or ongoing works were Galerie Gaité, Les Boutiques du Palais,
La Part-Dieu, Wroclavia, CH Ursynow and Gropius Passagen. Primark sales are based on estimates
(3) Based on latest national indices available (year-on-year evolution) as at November 2018: France: Institut Français du Libre Service (IFLS)-excluding food; Spain: Instituto Nacional de Estadistica; Central Europe: Cesky statisticky urad
(Czech Republic), Polska Rada Centrow Handlowych (Poland) (as at October 2018), Eurostat (Slovakia); Austria: Eurostat; the Nordics: HUI Research (Sweden), Danmarks Statistik (Denmark); Germany: Destatis-Genesis, excluding online only
operators and fuel sales (Federal Statistical Office). Including online only sales for France, Spain, Austria, the Czech Republic and Slovakia and excluding online only sales for Germany, the Nordics and Poland… and MGR uplift (1)
Leases signed(2): 1,319 Rotation rate(3): 11.5%
19.6%
18.2%
Average 17.4%
MGR uplift 15.3% 14.7%
14.4%
16%
11.7%
(4)
2013 2014 2015 2016 2017 2018 2018
Flagships (5)
2018 FULL-YEAR RESULTS 11UR signed 1,319 leases on standing assets for €198.6 Mn of MGR, a slight decline vs. 2017 (1,431(6)), as some negotiations with retailers take more time, although
the leasing pace accelerated in Q4. The average MGR uplift on renewals and relettings was +11.7% (+13.6%(7)), in line with UR’s target for the period. This uplift was
primarily due to a strong reversion in Spain and France, partially offset by the limited uplifts in the Nordics, The Netherlands and Germany. The MGR uplift in Flagship
assets was +14.4% (+16.8%). Excluding assets in a disposal process, the MGR uplift was +12.3%.
The rotation rate amounted to 11.5%, above the Group’s target of 10.0%.
(1) Minimum Guaranteed Rent uplift (MGR uplift): difference between new MGR and indexed old MGR. Indicator calculated on renewals and relettings only
(2) Deals signed only on standing assets
(3) Rotation rate: (number of relettings and number of assignments and renewals with new concepts) / number of stores. Short term leases are excluded
(4) Group: On a proportionate basis (10.3% in H1-2018)
(5) Flagships: On a proportionate basis (13.8% in H1-2018). The UR Flagship assets are: Les Quatre Temps, Aéroville, Parly 2, Vélizy 2, Carré Sénart, Rosny 2, Le Forum des Halles, Carrousel du Louvre, CNIT, Confluence, La Part-Dieu, Villeneuve 2,
Euralille, Polygone Riviera, La Vaguada, Parquesur, Bonaire, Splau, La Maquinista, Glòries, Donau Zentrum, Shopping City Süd, Centrum Cerny Most, Centrum Chodov, Wroclavia, Galeria Mokotow, Zlote Tarasy, Arkadia, Aupark, Jumbo,
Fisketorvet, Mall of Scandinavia, Täby Centrum, Stadshart Amstelveen, Leidsenhage, Ruhr Park, Gropius Passagen, CentrO and Pasing Arcaden
(6) On a proportionate basis. The number of leases signed on standing assets based on the IFRS perimeter was 1,350 in 2017
(7) On a proportionate basis. The MGR uplift based on the IFRS perimeter was +14.7% in 2017Operating metrics WFD US and UK
Speciality
Occupancy (%)(1) Sales psf Growth (%)(2) Rental Spreads (%)(3) NOI Growth (%)(4) Comp NOI Growth (%)(5)
United Kingdom 95.2 -2.9 +19.8 +8.6 +3.4
United States 95.6 +10.9 +7.5 +3.1 -1.6
Flagships 96.2 +12.0 +11.5 +6.7 -0.3
Regionals 94.8 +4.4 -1.6% -7.5 -4.7
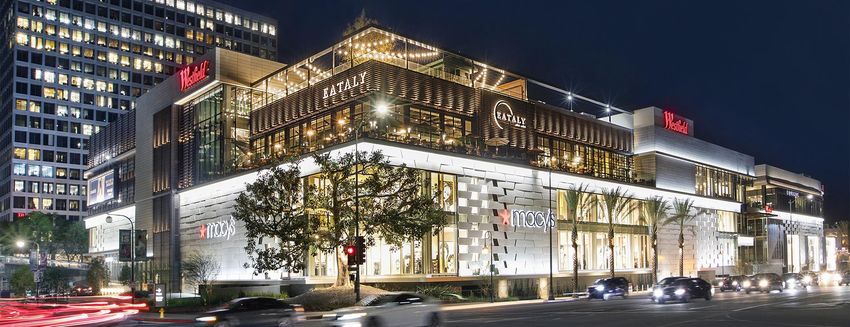
Westfield Century City Westfield World Trade Center Westfield London
2018 FULL-YEAR RESULTS 12United Kingdom:
Overall tenant sales in the UK centres were up by +2.8%, particularly reflecting growth of +8.6% at Westfield London driven by the opening of the Phase 2 extension. Strong growth
in sport (+6.8%) and dining (+4.5%) was partly offset by a decline in bags, footwear and accessories (-6.3%). For the period to November 2018, tenant sales were +2.7%, 547 bps above
the market(6). For specialty tenants, sales psf decreased by -2.9% to £946 psf in 2018, largely driven by the impact of the larger stores in and tenant relocations to Westfield London
Phase 2;
NRI increased by +8.6% following the conclusion of the first rent review cycle at Westfield Stratford City and the delivery of Westfield London Phase 2. Lfl NRI growth in the UK
was +3.4%;
Occupancy stood at 95.2% (vs. 97.7% as at June 30, 2018), primarily driven by tenant relocations in Westfield London Phase 1 to the Phase 2 extension and some non-renewals;
The average MGR uplift was +19.8%.
United States:
Total tenant sales in 2018 increased by +5.7%, of which +9.3% for the Flagships and -1.6% for the Regionals. Specialty tenant sales increased by +9.9% and, on a per square foot (psf)
basis, by +10.9% to $748 psf. Flagships increased by +12.0% to $926 psf, and Regionals by +4.4% to $486 psf. Luxury sales were strong, up by +15.2% psf. The average rental spreads
were +7.5%, of which +11.5% for Flagships and -1.6% for Regionals. In addition, the Group continued to diversify the tenant mix, with 72% of the new deals in non-fashion categories;
Net Operating Income (NOI) increased by +3.1% to $581.7 Mn, primarily due to the deliveries of the Westfield Century City and Westfield UTC extensions and renovations,
which collectively account for 12% of the NOI. Comparable NOI, excluding termination income and exceptional items, declined by -1.6%, of which -0.3% in the Flagships, compared
to -3.0% and -2.6%, respectively, for the period to June 30, 2018. Westfield Century City, Westfield UTC and Westfield Valley Fair are excluded from the comparable NOI;
Occupancy of the US portfolio ended the year at 95.6%, stable compared to the prior year, but 130 bps above the occupancy as at June 30, 2018. As at December 31, 2018, occupancy
of the Flagship and Regional portfolios was 96.2% and 94.8%, respectively, compared to 95.5% and 92.7% as at June 30, 2018, an increase of +70 bps and +210 bps, respectively;
(1) For the UK portfolio: based on leased space on a square foot basis, excluding development space. Financial vacancy (reflecting the base rent of vacant space as a percentage of the ERV) in the UK was 8.2% as at December 31, 2018. For the US
portfolio: based on leased space on a square foot basis, excluding development space, and including temporary leasing
(2) Calculated for specialty tenants, being stores withLeasing with high profile retailers in the UK and in the US
1st in the US 1st in mall in the US 1st in the UK 1st in the UK 1st on the West Coast
1st in the UK 1st in the US 1st in the US 1st in Westfield
Century City, Honey Birdette
2018 FULL-YEAR RESULTS 13The Group signed high profile retailers, including many firsts to the US market and/or firsts to URW’s portfolio, including: Hotel Chocolat’s first store in the US (Westfield Garden State Plaza); Warby Parker’s first store in a shopping centre in the New York metropolitan area (Westfield Garden State Plaza); Innisfree, #1 Korean cosmetics brand (Westfield World Trade Center and Westfield Garden State Plaza); Riley Rose (Westfield Culver City, Westfield Garden State Plaza, Westfield Southcenter, and Westfield Topanga); Rituals (Westfield Garden State Plaza, Westfield San Francisco Centre, Westfield Valley Fair and Westfield UTC); Del Frisco Double Eagle Restaurants (Westfield Century City and Westfield Valley Fair); Tesla (Westfield Roseville, Westfield Fashion Square); Gloveworx’s (a boxing studio) first New York City location (Westfield World Trade Center); Dreamscape’s first store (Westfield Century City); Honey Birdette, an Australian lingerie retailer, first store in the US (Westfield Century City); Volcom (Westfield Century City); Hermès (Westfield UTC). The signings with Rituals are the first results of the cross-fertilization of European and US retailers by the Group’s International Leasing team. Chinese brands Urban Revivo and Xiaomi opened their first store outside of Asia and first store in London, respectively, both in Westfield London. Another notable signing in Westfield London was Natura Bissé, a Spanish luxury skincare retailer, which opened its first luxury spa in The Village.
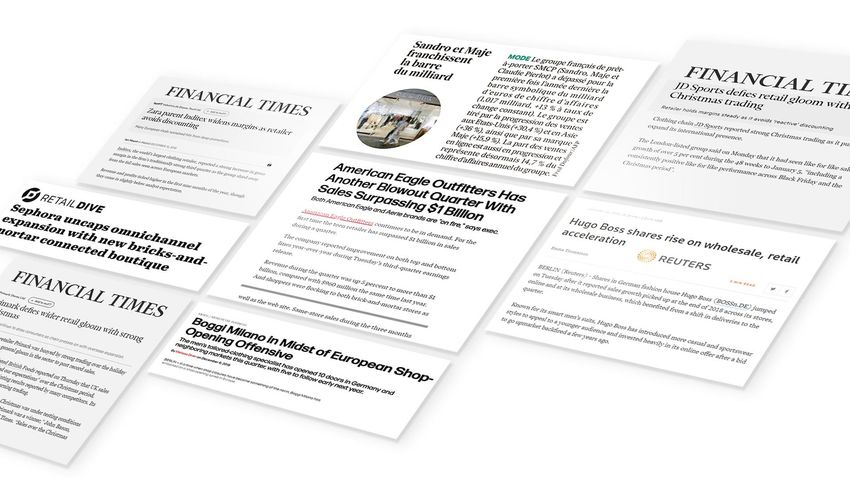
Great retail is thriving!

                            2018 FULL-YEAR RESULTS   14
Entertainment
Westfield London, Exhibition
Westfield Valley Fair, Icon X Theatre Westfield Century City, Dreamscape
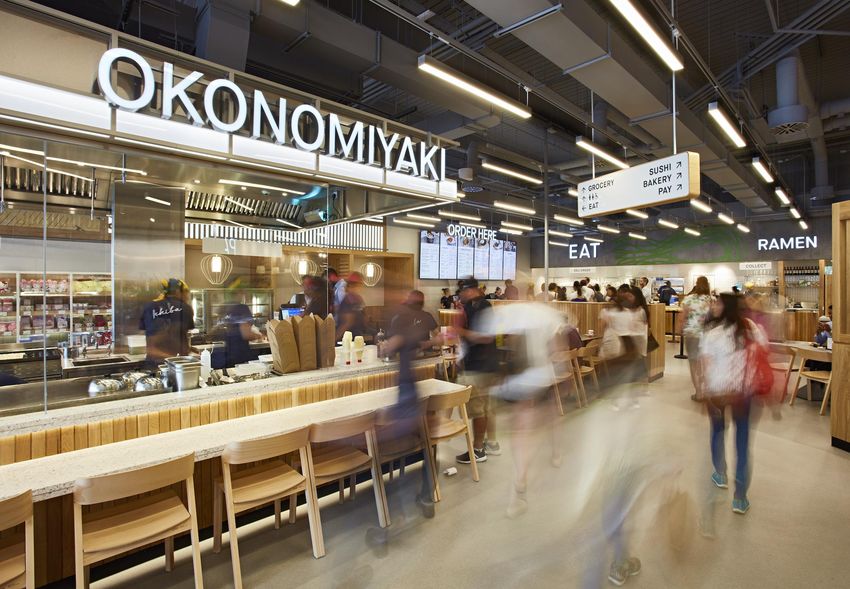
2018 FULL-YEAR RESULTS 15Food & Dining
Westfield UTC, Din Tai Fung
Westfield Century City, Del Frisco’s Westfield London, Ichiba
2018 FULL-YEAR RESULTS 16URW the preferred partner for DNVBs(1)
DNVBs in the US DNVBs in Europe
+63% +46%
65
35
40 24
Westfield UTC, Warby Parker Les Quatre Temps, Jimmy Fairly
2017 2018 2017 2018
2018 FULL-YEAR RESULTS 17Continental Europe
Furthermore, UR continued to curate Digital Native Vertical Brands: Daniel Wellington opened four stores in UR’s assets in 2018 and NYX Professional Make Up operated 21 stores
in UR’s portfolio as at December 31, 2018. Finally, the Group enhanced the cross-fertilization of retailer relationships between the US and Continental Europe in 2018
by accelerating the development of US retailers such as Victoria’s Secret, Abercrombie & Fitch, and Polo Ralph Lauren.
United States
URW has already opened 58 stores for 22 Digitally Native Vertical Brands (DNVBs) in the US, with a further 7 stores opening soon. These stores include Amazon kiosks
and Amazon Books (10 locations), NYX (8), Peloton (6), UNTUCKit (4), Bonobos (3) and Warby Parker (3). In 2018, DVNBs signed 25 leases with URW. As online players explore
new growth opportunities, going offline is the logical path to follow. Not only does it enable such companies to better display and demonstrate their products, it also grows
brand awareness and offers a way to engage more effectively with a massive crowd of prospects and actual customers. As they do online, DNVBs are seeking high footfall
locations that help them increase their brand awareness while generating a significant level of sales and, more importantly, help them operate in a physical environment.
Pursuant to URW’s focus on innovation, Westfield Valley Fair, located in the heart of the world’s innovation and tech hub, will offer an “Emerging DNVBs” precinct. The Group
will provide white-boxed and ready to operate units with a list of a la carte services ranging from utilities to POS systems and staff, enabling those up and coming offline brands
to focus on what matters most to them. In addition, the Group’s shopping centre management teams will be supporting them from start to finish by providing insights
on the trade area and customer base, advice on store operations and marketing packages to get off with a great start.
(1) DNVBs are excluding pop-ups e.g. Kylie CosmeticsStrengthening the connection with our customers (1)
Unique events Loyalty Program Engaging the visitor
CRM Solution
7 Mn Partner
+65% # of shopping centres equipped
95%
63 (+70% YoY)
4 Mn
E-mail campaign opening rate
22.8% (+280 bps vs. retail average)
Les Quatre Temps, Mickey 90th anniversary
Coming
from digital E-mail campaign click rate
+13,500 additional loyalty channels 3.6% (+110 bps vs. retail average)
members FY-2017 FY-2018
2018 FULL-YEAR RESULTS 18UR’s loyalty programme reached seven million members, with three million new customers signed up in 2018. 95% of the new members came through websites
and apps. In 2018, UR’s digital channels attracted 74 million interactions with:
53 million web sessions (stable);
21 million app sessions (8.9 million).
UR also reached a new milestone of its “engaging the visitor” strategy, with the goal to better target visitors by providing them with a personalized content based
on their interests and shops visited. 63 shopping centres have now been equipped with the Salesforce CRM solution (37 as at December 31, 2017) to facilitate email
campaigns, achieving an opening rate of 22.8% (vs. the retail benchmark of 20%) and a click rate of 3.6% (vs. 2.5%).
UR’s efforts have been focused on pursuing the customer engagement strategy through experiential events, stronger loyalty card enrollment and an active CRM
strategy.
UR partnered with Disney to celebrate the 90th Mickey Mouse anniversary across 18 assets in eight countries. Activations included an interactive exhibition
and a Hidden Mickey Treasure Hunt, which attracted more than 58,000 participants and more than 13,500 new loyalty program members.
(1) Scope: Continental EuropeUnique events drive shopper preference
Arkadia, Birthday CentrO, Christmas Fair
Westfield World Trade Center, Nicky Minaj Concert Westfield London, 10th anniversary
2018 FULL-YEAR RESULTS 19Paris office market – increasing take-up
Paris region supply and take-up(1) Prime rent per district(2)
(in Mn sqm) (€/sqm/year excl. VAT)
3.9 4.0 3.9
3.6 3.6 3.6 3.5 3.4
850
2.9 810 810
800 800 800
1.3 1.5 1.2
1.4 1.0 1.3
1.1 1.3
1.0 550 550 550
530 530 530
1.1 1.2 1.2 1.1 1.2 1.3
1.0
0.9 0.9
2010 2011 2012 2013 2014 2015 2016 2017 2018 2013 2014 2015 2016 2017 2018
H1 Take-up H2 Take-up Immediate supply Paris CBD La Défense
2018 FULL-YEAR RESULTS 20After a very strong performance in 2017, the take-up at the end of 2018 in the Paris region was down by -5% to 2.5 million sqm, in line with the 10-year average. The Inner Paris sector remains the most dynamic sector with 41.5% of the total take-up at 1,038,000 sqm, including 458,500 sqm in the Paris Central Business District (CBD), down slightly compared to last year but +15% above the 10-year average. The La Défense market saw a take-up of 135,000 sqm (-24%), due to a lack of major transactions. For the first time since 2008, the immediate supply in the Paris Region stood below 3 million sqm at 2.9 million sqm, of which only 23% was new or refurbished as new and only 6% in La Défense. The vacancy rate(3) in the Paris region decreased further to 5.5% (6.5%). Differences remain significant between sub-markets, with Paris CBD and La Défense well below the average at 1.5% and 4.6%, respectively. (1) Source: Immostat (2) Source: CBRE Research (3) Source: BNP Paribas Real Estate
Offices: strong Like-for-like NRI growth
Net Rental Income
(€ Mn)              2018   2017   Growth   Lfl Growth(1)

France              118    124     -4.8%      +3.7%

Nordics              11     12    -11.1%      +7.3%

Others                6      5    +16.1%      +9.6%

US                    8

Total               143    141    +1.3%      +4.5%

                                                                     2018 FULL-YEAR RESULTS   21
                                                           Majunga
Consolidated NRI amounted to €134.3 Mn, a -4.6% decrease due primarily to the impact of disposals in 2017 and 2018, partially offset by good leasing activity.
The decrease of -€6.5 Mn breaks down as follows:
-€9.5 Mn mainly due to the impact of disposals in 2017 (So Ouest Plaza in October and the Arlanda hotel in the Nordics in August) and 2018 (Capital 8 in November
and Tour Ariane in December);
-€0.7 Mn due to currency effects in Sweden;
-€0.4 Mn due to assets moved to pipeline in France;
+€0.4 Mn mainly due to the delivery of the Wroclavia offices in Q4-2017;
The like-for-like NRI growth was +€3.7 Mn (+4.5%) mainly due to good leasing performance and the reversal of provisions for doubtful debtors and litigation.
(1) Net Rental Income (NRI) like-for-like growth excluding acquisitions, divestments, transfers to and from pipeline (extensions, brownfields or redevelopment of an asset when operations are stopped to enable works), all other changes resulting
in any change to the square meters and currency exchange rate differences in the periods analyzedFavorable investment market in Paris
6.25% 6.25%
Acquisition
5.75% 2001
4.75%
5.75%
4.00% Disposal
2018
3.75%
Capital 8
3.00%
Acquisition
1999
2001 2003 2005 2007 2009 2011 2013 2015 2017 Disposal
2018
Prime Office Yield Paris CBD Prime Office Yield La Défense
Tour Ariane
2018 FULL-YEAR RESULTS 22On November 8, 2018, URW announced the completion of the disposal of the Capital 8 office building, located in the central business district of Paris, to Invesco Real Estate, a global real estate investment manager. The NDP(1) of the transaction was €789 Mn. On December 18, 2018, the Group disposed of the Tour Ariane office building, located in the heart of La Défense business district (Paris region), to Singapore’s sovereign wealth fund GIC. The NDP (1) of the transaction was €465 Mn. (1) Net Disposal Price (NDP): Total Acquisition Cost incurred by the acquirer minus all transfer taxes and transaction costs
Convention & Exhibition
                                                                                Growth                                           Growth
€ Mn                                  FY 2018                       FY 2017   2018/2017(1)               FY 2016               2018/2016(1)
Net Rental Income                        102                             96      +4.0%                       103                      -2.3%
Property Services & Other Income(2)        65                            50     +29.9%                         62                    +5.1%
Recurring Net Operating Income           167                            146     +13.3%                      165                    +0.6%
Depreciation                              -13                           -12      +7.9%                       -11                   +15.7%

Recurring Result                         154                            134     +13.8%                       154                      -0.6%

Eurosatory, Paris Nord Villepinte     INTERMAT, Paris Nord Villepinte                    Vivatech 2018, Porte de Versailles

                                                                                                                              2018 FULL-YEAR RESULTS   23
The Convention & Exhibition business has a seasonal results pattern, with annual, biennial and triennial shows, and an uneven distribution of shows during the year.
2018 was characterized by the following shows:
Annual shows:
• The 55th edition of the International Agriculture show (“SIA”) attracted 672,600 visitors, +9% vs. 2017;
• The 3rd edition of Vivatech attracted over 100,000 visitors (+47% vs. 2017) of more than 125 nationalities.
Biennial shows:
• The 26th edition of Eurosatory, the Land and Airland Defence and Security Exhibition, attracted 57,000 visitors. With 1,802 exhibitors (+15% compared to 2016), it maintained
its position as the leading international exhibition in its field;
• SIAL, the European leader in the food sector, was a success in October in Paris Nord Villepinte with 310,000 visitors (+100% vs. the 2016 edition);
• In spite of a shorter duration of the show (from 16 to 11 days), the 120th edition of the Mondial Paris Motor Show at Paris Expo Porte de Versailles attracted more than one million
visitors and remains the most visited automobile event in the world.
Triennial show:
• One of the world’s leading shows, the International Exhibition for Equipment and Techniques for Construction and Materials Industries (“INTERMAT”) attracted
more than 173,000 visitors, including 30% from outside France from 160 countries.
(1) Restated growth from INTERMAT & Pullman. Without the restatement the 2017 growth is +6.2%, +29.9%, +14.3%, +7.9% and +14.9% and the 2016 growth is -1.1%, +5.1%, +1.2%, +15.7% and +0.1%
(2) On site property servicesConvention & Exhibition
Growth in Congress sector Development projects at Porte de Versailles
2017 Opening of Paris Convention Centre 2019 New Hall 6 and hotels
EASL 2018, Paris Convention Centre New Hall 6 Construction New Hall 6
# of congresses
90 Congress revenue
# of congresses in +24.6% vs. 2016
Paris Convention Centre
23 Novotel Mama Shelter
2018 FULL-YEAR RESULTS 24The second phase (2017-2019) of renovation works on the Porte de Versailles site continued, with the construction of the new Pavilion 6 and two new hotels (Novotel & Mama Shelter) scheduled to open in H2-2019.
Better Places 2030 : 2018 achievements
                                 (1)

 PILLAR 1                          PILLAR 2                             PILLAR 3                    PILLAR 4
 Better buildings                  Better connectivity                  Better communities          Better collective power
  100% of development projects         100% of standing assets           UR for Jobs:                CSR objectives extended to
  conducted Life Cycle                 equipped with EV charging          • 30 shopping centres      all employees
  Assessment analysis                  spaces(4)                          • 551 jobs and training
  in design phase                                                           placements               Stronger partnerships with
                                       36 shopping centres engaged
  Low carbon cement pilot              in Mobility Action Plans                                      NGOs:
                                                                         Solidarity days:
                                                                                                      • Joblinge (Germany)
  All regions supplied                 Car-pooling and EV car-sharing    • 17 in partnership
  with Green Electricity(2)            pilots with start-ups                with NGOs                 • UNICEF (France)
                                                                         • 1,210 employees            • Childhood (Sweden)
  92% assets BREEAM In-Use
  certified(3)                                                              volunteered
  33.5% of managed GLA                                                                               Innovative CSR solutions:
  covered by LED partnerships                                                                         • Food waste
  with tenants(3)                                                                                     • Urban farming
                                                                                                      • Circular economy

                                                                                                                    2018 FULL-YEAR RESULTS   25
(1) The data communicated in this slide are under review by auditors. All items refer to Continental Europe (2) In the common areas of owned & managed shopping centers (3) For owned and managed assets (4) For the owned and managed shopping centres for which the Group fully owns and manages the car parks
URW’s CSR strategy recognized
ESG indices       Member since          Benchmarks   Ranking/Rating

                                                                (1)
                         2013                             1st

                                                                (2)
                                                          1st
                         2005

                                                           A
                         2017
                  “Top 10 Performers”
                                                               (3)
                                                          B-

                         2011                                     (4)
                                                         Gold

                         2007                             AAA

                                                                2018 FULL-YEAR RESULTS   26
In delivering Better Places 2030, UR also develops a favorable ecosystem through open partnerships with NGOs, cities, corporates, SMEs and start-ups. In 2018,
the Group built strong partnerships with Joblinge in Germany, UNICEF in France and Childhood in Sweden. The Group also leveraged URW Link, its open-innovation
platform, to identify innovative CSR solutions such as food waste (Too Good To Go), urban farming and the circular economy.
The Group’s ambitious CSR agenda was once again recognized by equity and debt investors as a value creation driver for its stakeholders. URW was reconfirmed
in the main ESG indices, ratings and awards for 2018:
Indices:
• Euronext Vigeo indices: World 120, Eurozone 120, Europe 120 and France 20;
• FTSE4Good Index series;
• Ethibel Sustainability Index (ESI) Excellence Europe and Excellence Global;
• ECPI indices;
• CAC 40® Governance index – “Top 10 performers”.
Ratings:
• Sustainalytics: 1st place in the real estate industry ranking;
• GRESB (Global Real Estate Sustainability Benchmark – the only sustainability benchmark dedicated to the real estate sector): 1st accross the entire listed Global retail real estate
companies, 1st among listed European real estate companies in the 2018 GRESB Survey, and rated ‘Green Star’ for the 8th consecutive year, with a rating of 5 stars (highest
performance level);
• MSCI ESG ratings assessment: Rating of AAA (on a scale of AAA-CCC) for the 5th year in a row;
• Vigeo Eiris rating: 1st among the Financial Services - Real Estate sector (according to the last rating performed in 2017).
Awards:
• In addition to complying with the new GRI (Global Reporting Initiative) sustainability reporting standards, the Group’s reporting complies with the EPRA Best Practice Recommendations
for Sustainability Reporting and received its 7th consecutive EPRA Sustainability Gold Award;
• UR for Jobs received the EPRA award for most Outstanding Contribution to Society 2018 for its Community & Tenants Engagement.
(1) Out of all listed retail companies worldwide
(2) Out of 316 real estate companies - June 2018
(3) B- (highest rating category among real estate companies). Applies to Unibail-Rodamco-Westfield
(4) Since the 2011 Annual ReportDEVELOPMENT
A flexible pipeline

   €13 Bn(1)
                                           + €0.4 Bn            €11.9 Bn
                                                                  Secured
                                                                 exclusivity
                   - €1.5 Bn                                      €1.4 Bn

                                                                                                    €9.2 Bn
                                                                                                      Secured
                                                                                 - €2.7 Bn           exclusivity
                                                                                                      €1.2 Bn

                                                                 Controlled
                                                                  €7.6 Bn

                                                                                                      Controlled
                                                                                                       €6.5 Bn

                                                                 Committed
                                                                  €2.9 Bn
                                                                                                     Committed
                                                                                                      €1.5 Bn

    FY-2017    Deliveries & changes   New projects and others    FY-2018       Invested to date   To be invested

                                                                                                  2018 FULL-YEAR RESULTS   28
The Group’s development portfolio, with the addition of the WFD projects in the UK, the US and Italy was estimated to be €13.0 Bn at year-end 2017. The Group’s
pipeline stood at €11.9 Bn(2) as at December 31, 2018, principally due to the following:
The decision to dispose 75% of the Cherry Park residential project(3) to institutional parties (-€0.6 Bn);
The reassessment of WFD projects under UR’s methodology, the use of value at completion instead of costs at today’s value, cost variances on projects, certain disposals
and the removal of a project (-€0.5 Bn);
The completion and delivery of Westfield London Phase 2 in H1, and the Westfield Garden State Plaza and Villeneuve 2 renovations in H2 (-€0.4 Bn);
The addition of the Metropole Zličín, Villeneuve 2 and Centrum Cerny Most extensions, the Rosny 2 leisure extension and certain other projects (+€0.4 Bn).
(1) The Group’s development portfolio, with the addition of the WFD projects in the UK, the US and Italy was estimated to be €13.0 Bn at year-end 2017
(2) This includes the Group’s share of projects fully consolidated and projects accounted under equity method, excluding Viparis projects
(3) URW has decided to seek partners for this project and keep 25% of the project2019 Office deliveries
January 2019 Delivery H2-2019 January 2019 Delivery H2-2019
GLA Expected Cost(1) Office GLA Expected Cost(1)
47,000 sqm €210 Mn 49,000 sqm €340 Mn
2018 FULL-YEAR RESULTS 2912 projects representing a URW Expected Cost of ca. €1,560 Mn are to be delivered in 2019:
Seven extension and renovation retail projects: the Carré Sénart and Vélizy 2 leisure extensions, the Westfield Topanga and Westfield Valencia renovations, and the Gropius
Passagen, Parly 2 Cinema and Westfield Valley Fair projects;
Two office redevelopment and extension projects: the Gaîté Montparnasse hotel and Shift;
Two brownfield office projects: Versailles Chantiers and Trinity; and
One brownfield residential project: Westfield UTC Residential.
The average pre-letting(2) of the retail and office deliveries stands at 88%(3) and 64%, respectively.
(1) URW Expected Cost equals 100% Expected Cost multiplied by URW percentage of ownership of the project, plus specific own costs, if any. 100% Expected Cost is expressed in value at completion. It equals the sum of: (i) all capital
expenditures from the start of the project to the completion date and includes: land costs, construction costs, study costs, design costs, technical fees, tenant fitting-out costs paid for by the Group, letting fees and related costs, eviction
costs and vacancy costs for renovations or redevelopments of standing assets; and (ii) tenants’ lease incentives and opening marketing expenses. It excludes: (i) capitalized financial interests; (ii) overheads costs; (iii) early or lost Net Rental
Income; and (iv) IFRS adjustments
(2) Pre-letting: GLA signed, all agreed to be signed and financials agreed
(3) Excluding renovation projectsUpdate on retail deliveries
GLA GLA
+47,000 sqm 88,000 sqm
Expected Cost(1) Expected Cost(1)
€990 Mn Aerial view of renovation project €570 Mn Aerial view of extension project
URW ownership URW ownership
50% 100%
Delivery: Delivery:
H2-2019 H1-2020
Pre-Letting(2) Pre-Letting(2)
± 80% View of the Plaza renovation project ± 50% Fresh! Foodhall inaugurated in November 2018
2018 FULL-YEAR RESULTS 30The Group successfully completed important phases of the Committed projects:
The renovation of the Westfield Valley Fair shopping centre, one of three phases of the current development project, was completed in October (a second phase being delivered
in January 2019 with the ICON Cinema opening);
The inauguration of food market Fresh!, the first destination of the future Mall of The Netherlands, took place in November. The new 2,500 sqm market hall includes 24 shops
and ten kiosks with a wide and high quality offer of the best local products, complemented with a programme of culinary events and food entertainment;
(1) URW Expected Cost equals 100% Expected Cost multiplied by URW percentage of ownership of the project, plus specific own costs, if any. 100% Expected Cost is expressed in value at completion. It equals the sum of: (i) all capital
expenditures from the start of the project to the completion date and includes: land costs, construction costs, study costs, design costs, technical fees, tenant fitting-out costs paid for by the Group, letting fees and related costs, eviction
costs and vacancy costs for renovations or redevelopments of standing assets; and (ii) tenants’ lease incentives and opening marketing expenses. It excludes: (i) capitalized financial interests; (ii) overheads costs; (iii) early or lost Net Rental
Income; and (iv) IFRS adjustments
(2) Pre-letting: GLA signed, all agreed to be signed and financials agreed
(3) Excluding renovation projectsReinventing city districts
Leveraging on key strengths
to develop mixed use projects
Exceptional, highly connected retail
locations
Unique know-how across retail, offices, Palisade at Westfield UTC Gaité Montparnasse
residential, hotels and event spaces
Agile approach for every location
Flexible funding models
• JVs: Westfield UTC and Westfield Stratford City/
Cherry Park
• Divestment of resi building rights: Westfield
Hamburg and Solna
Westfield Hamburg
2018 FULL-YEAR RESULTS 31As part of the annual portfolio review, the Group has made the strategic decision to significantly increase the densification efforts on its retail portfolio by adding office, residential, hotel and other “mixed-use” elements to its major Flagships locations, where relevant. The Group believes it has numerous opportunities to add significant value while at the same time increasing the footfall to its destination shopping centres. URW will provide more details on this strategy during its Investor Days in June 2019.
Reinventing city districts

     Westfield Stratford City         Westfield Rosny 2                  Solna

Cherry Park Apartments          Dining        Offices      Resi Building Rights
1,224                           8,000 sqm     12,000 sqm   30,000 sqm

                                                                                  2018 FULL-YEAR RESULTS   32
WESTFIELD INTEGRATION
Integration update: H2-2018 Achievements

Implementation of organizational model

Operating Management function in US & UK

Digital, Commercial Partnerships &
International Leasing roadmaps and teams

First joint management convention

Initial 5-Year Business Plan

Review of development projects             ongoing

Capital allocation                         ongoing

IT systems integration                     ongoing

                                                     2018 FULL-YEAR RESULTS   34
To manage the integration process, URW has set up an Integration Management Office (IMO), led by the Group Chief Resources Officer and the Group Chief Financial Officer with the support of McKinsey & Company. The integration is managed through dedicated workstreams, involving representatives from both organizations. Before the closing of the transaction, the IMO focused on two main objectives: (i) defining the fundamentals of the future organization of the Group, including governance principles and key decision-making processes, and (ii) ensuring business continuity upon completion of the transaction. Following the completion of the transaction, the IMO deployed dedicated efforts to lead the integration of the US and the UK businesses, aiming at defining a new operating model based on the strengths of both UR and WFD, and enabling the synergies and expected benefits of the transaction. Since the closing on June 7, 2018, the integration process has made significant progress. Beyond the new governance and new management structure in place since Day 1, the Group has focused on the following priorities: Delivering on Synergies; Optimizing organization and processes; Achieve cultural integration; Capital.
Synergies
                                                                           €115 Mn

       €100 Mn
                                                                             €40 Mn
      €40 Mn
        €40 Mn                €75 Mn
                                            Closure of Sydney HQ
                                            Implementation of UR                                     Target
                                            travel policies                                     revenue synergies

                                            Spin-off of One Market
      €60 Mn                                                                 €75 Mn
        €60 Mn

                                            Departure of WFD
                                            Senior Management Team

    Target synergies   Realized annualized cost                      Revised target synergies
      as of Dec.17            synergies                                    as of Dec.18

                                                                                                        2018 FULL-YEAR RESULTS   35
Cost synergies Following the realization of the cost synergies achieved as at June 30, 2018, the ramp-down of the Sydney office operations is almost complete, with most of the tasks now transferred to the US and the UK and to the Paris corporate office, or outsourced. The net expected run-rate cost synergies amount to €75 Mn. Revenue synergies To capture the expected revenue synergies, the Group has created: A Commercial Partnerships team in Europe to leverage Westfield’s extensive commercial network, create package deals combining store openings with special centre events and marketing plans, increase advertising revenues and build a pan- European strategy and deals leveraging URW’s unrivalled European shopping centre platform. To attain these objectives a mixed London-Paris based team has been set-up under the leadership of a long-time Westfield professional. The aim is to realize a compound annual growth rate of +10% in this category of revenues over the next five years; A new Group-wide International Leasing structure to reap the benefits of being global. A dedicated cross continental structure is now focused on coordinating the negotiations at Group level with its largest partners, while developing new high-potential brands in the US and Europe, including a focus on food and beverage; A new Group Digital team leading the deployment of the loyalty system in the US and the UK, as these countries already have customer database capabilities, while convergence across platforms of the digital ecosystem will ensure savings on the license and maintenance costs; The roll-out of the Westfield brand in Continental European Flagship assets will start in 2019, with the first ten centres to be simultaneously rebranded in September 2019 (in France, the Czech Republic, Poland and the Nordics), and eight additional centres in 2020. Each rebranding will be accompanied by a specific event and communication plan.
Roll-out of Westfield brand across Continental Europe

Les 4 Temps                        Mall of Scandinavia

Vélizy 2                           Chodov

Euralille                          Carré Sénart

                                                         2018 FULL-YEAR RESULTS   36
The roll-out of the Westfield brand in Continental European Flagship assets will start in 2019, with the first ten centres to be simultaneously rebranded in September 2019 (in France, the Czech Republic, Poland and the Nordics), and eight additional centres in 2020. Each rebranding will be accompanied by a specific event and communication plan.
FINANCING & CAPITAL ALLOCATION
Long-term capital raised at attractive rates

          Hybrid                              Euro Senior bonds                     144A USD Bonds

  April   €2.0 Bn         2.4%(1)      May         €3.0 Bn        1.3%(1)   September   $1.0 Bn             4.4%(1)

   €1,250 Mn        Perp NC 5.5-year
                    2.125%
                                             €800 Mn          3-year
                                                              0.125%
                                                                                  $500 Mn               10-year
                                                                                                        4.125%

   €750 Mn          Perp NC 8-year
                    2.875%
                                             €800 Mn          7.3-year
                                                              1.125%
                                                                                  $500 Mn               30-year
                                                                                                        4.625%

                                             €900 Mn          12.7-year
                                                              1.875%

                                         €500 Mn              20-year
                                                              2.250%

                                                                                                  2018 FULL-YEAR RESULTS   38
This year was further characterized by the completion of the WFD acquisition on June 7, 2018. UR took advantage of attractive market windows to raise €7,883 Mn
of new senior debt and €2 Bn of hybrid securities. Following these issuances, the bridge loan of €6.1 Bn put in place in January 2018 to finance the acquisition of WFD
was cancelled, without having been drawn.
Four public EMTN bonds were issued in May 2018 for a total amount of €3,000 Mn with a weighted average maturity, coupon and spread over mid-swaps of ca. 10 years, 1.27%
and 50bps, respectively;
The first USD bonds for the Group were issued in September 2018 in two tranches:
• $500 Mn (eq. €437 Mn) with a 4.125% coupon and a 10-year maturity;
• $500 Mn (eq. €437 Mn) with a 4.625% coupon and a 30-year maturity.
Three private placements were issued under URW’s EMTN programme for a total amount of €640 Mn:
• A €500 Mn Floating Rate Note (FRN) with a 2-year maturity and a margin of 10 bps over 3-month Euribor13;
• A €40 Mn indexed bond swapped back to floating, equivalent to 75 bps over 3-month Euribor with a 15-year maturity;
• A €100 Mn private placement with a 15-year maturity and a margin of 80 bps over mid swap.
URW also issued €2,000 Mn of deeply subordinated, perpetual hybrid securities on April 2018, at an average margin of 184 bps over mid swaps in two tranches:
• €1,250 Mn with a 2.125% coupon and callable after 5.5 years;
• €750 Mn with a 2.875% coupon and callable after 8 years.
(1) Weighted average couponLow cost of debt and record average maturity
Average Cost of Debt Average Maturity
(years)
3.9% 7.5
3.6% 7.2
7.0
3.4%
6.5
2.9%
5.9
2.6%
5.4
2.2% 4.9
4.5
4.3
1.6% 1.6%
1.4%
2010 2011 2012 2013 2014 2015 2016 2017 2018 2010 2011 2012 2013 2014 2015 2016 2017 2018
2018 FULL-YEAR RESULTS 39URW’s average cost of debt (including seven months of WFD financial expenses) for the period was 1.6% (1.4% in 2017). This average cost of debt results from:
Low coupon levels the Group achieved during the last years on its fixed rate debt;
The level of margins on existing borrowings;
The Group’s active balance sheet management through tender offer transactions;
The hedging instruments in place;
The cost of carry of the undrawn credit lines;
The cost of debt to finance the Transaction;
Cost of debt of WFD since its acquisition (3.4%), which is higher than URW’s due to:
• WFD’s “BBB+” rating before the completion of the acquisition;
• Higher rates in the US and the UK.
The average cost of debt of UR on a standalone basis for the period would have been 1.2% (1.4% in 2017).
The average maturity of the Group’s debt as at December 31, 2018, taking into account the unused credit lines, increased to 7.5 years (7.2 years
as at December 2017) as a result of the inclusion of WFD’s debt and issuances completed in 2018.Disposals well ahead of schedule…
ZT Lumen & Skylight Los Arcos Bahia Sur
Tour Ariane Capital 8 Vallsur El Faro
NDP(1) Premium(2) NIY(3)
€2.0 Bn 8.9% 4.6%
2018 FULL-YEAR RESULTS 40In 2018, the Group disposed of a number of non-core assets. On July 2, 2018, URW disposed of the Örebro hotel. On July 31, URW disposed of four shopping centres in Spain (El Faro, Bahia Sur, Los Arcos and Vallsur) for a Net Disposal Price (NDP)(1) of €449 Mn, representing a Buyer’s Net Initial Yield (NIY)(2) of 5.6%. On August 23, URW disposed of Horton Plaza in San Diego and generated a NDP of €81 Mn. The Total Acquisition Cost (TAC)(3) represented a discount of approximately -5% to the value at which UR had underwritten the asset. On November 8, 2018, URW announced the completion of the disposal of the Capital 8 office building, located in the central business district of Paris, to Invesco Real Estate, a global real estate investment manager. The NDP of the transaction was €789 Mn. On December 18, 2018, the Group disposed of the Tour Ariane office building, located in the heart of La Défense business district (Paris region), to Singapore’s sovereign wealth fund GIC. The NDP of the transaction was €465 Mn(4). On December 20, 2018, the Group completed the disposal of the Skylight and Lumen office buildings, located in the central business district of Warsaw, to Globalworth Poland. The TAC of the transaction was €190 Mn. Since June 30, 2018, the Group has now disposed of 10 assets, representing a total NDP of €2.0 Bn, at a blended NIY of 4.6% and with a weighted average premium of +8.9% to the June 30, 2018 book value. These disposals are part of the €3.0 Bn of disposals identified in UR’s annual business plan exercise for the period 2018-2020 and announced previously. They were made at a pace well ahead of its original expectations. (1) Net Disposal Price (NDP): Total Acquisition Cost incurred by the acquirer minus all transfer taxes and transaction costs (2) Buyer’s Net Initial Yield (NIY): annualized contracted rent (including indexation) and other incomes for the next 12 months, net of operating expenses, divided by the TAC (3) Total Acquisition Cost (TAC): the total amount a buyer shall pay to acquire an asset or a company. TAC equals the price agreed between the seller and the buyer plus all transfer taxes and transaction costs (4) Before impact of rent incentives
… have achieved a meaningful LTV reduction

                                                -1.9%

            38.0%           38.9%              37,0%                 37.0%

          June 30, 2018   June 30, 2018   Net disposal impact   December 31, 2018(2)
                            restated(1)

                                                                                  2018 FULL-YEAR RESULTS   41
The Loan-to-Value (LTV) ratio was 37.0% (38.9%(3) as at June 30, 2018; 39.8% on a pro-forma basis and 33.2% for UR on a stand-alone basis,
both as at December 31, 2017).
The LTV as at December 31, 2018 of 37.0% (vs. 38.9% as of June 30, 2018) includes the reduction of debt through H2 disposals (ca. €2.0 Bn), the increase in asset
valuation from June to December 2018, partly offset by the exclusion of goodwill not justified by fee business.
(1) Excluding €2,039 Mn of goodwill as per the Group’s European leverage covenants
(2) IFRS net financial debt as shown on the Group’s IFRS balance sheet, after impact of derivative instruments on debt raised in foreign currencies / total assets, including transfer taxes. 38.4% excluding transfer taxes. Proportionate LTV ratio
of 38.9% as at December 31, 2018
(3) Same calculation methodologyHealthy credit ratios. Lowering LTV target
LTV(1) ICR(2)
60%(3)
6.1
41% 41% 5.9
40%(4)
4.6 4.6
30% 37%
37% 4.0
33% 3.8 3.5
30% (4)
2.5 3.5
25% 2.0(3)
Typical convenant level
Target range
2018 FULL-YEAR RESULTS 42As at December 31, 2018, the LTV ratio amounted to 37.0% (39.8% on a pro-forma basis and 33.2% for UR on a stand-alone basis, both as at December 31, 2017).
The LTV as at December 31, 2018 of 37.0% (vs. 38.9%(5) as of June 30, 2018) includes the reduction of debt through H2 disposals (ca. €2.0 Bn), the increase in asset
valuation from June to December 2018, partly offset by the exclusion of goodwill not justified by fee business.
The Group plans to dispose of an additional €4 Bn of Continental European assets during the next couple of years. Completion of these disposals will take the total
disposals since January 1, 2018 to €6.0 Bn, double the amount the Group announced as part of the announcement of the Transaction in December 2017.
The Group has set itself the strategic objective of deleveraging and has set a new LTV ratio target trough the cycle of between 30-40%, down from between 35-45%
previously.
The Interest Coverage Ratio (ICR) stood at 6.1x for 2018 (>5x in 2017 on a pro-forma basis and 6.7x for UR on a stand-alone basis) as a result of strong rental growth,
a controlled cost of debt and the WFD acquisition.
(1) Net financial debt / total assets, including transfer taxes, excluding €2,039 Mn of goodwill as per the Group’s European leverage covenants
(2) Interest Cover Ratio (ICR): Recurring EBITDA / Recurring Net Financial Expenses (including capitalised interest); Recurring EBITDA is calculated as total recurring operating results and other income less general expenses, excluding depreciation
and amortization
(3) Typical European loan to value and ICR bank covenants
(4) New Loan-to-Value ratio objective of between 30 and 40%
(5) Same calculation methodologyYou can also read