Dowry: Household Responses to Expected Marriage Payments
←
→
Page content transcription
If your browser does not render page correctly, please read the page content below
Dowry:
           Household Responses to Expected Marriage Payments∗

                      S Anukriti†           Sungoh Kwon‡              Nishith Prakash§

                                         This draft: October 2017
                                        First draft: October 2016

                                                  Abstract

      Dowry is a ubiquitous feature of South Asian marriage markets. However, empirical research
      on dowry has been limited by the lack of data. We utilize retrospective information on gifts
      exchanged at the time of marriage for 39,544 marriages during 1960-2008 (a) to describe dowry
      trends and (b) to examine the impact of dowry expectations on households’ financial and child-
      bearing decisions in contemporary rural India. Average real net dowry has been remarkably
      stable over time; although there is considerable heterogeneity across castes, religions, and states.
      We also test if credit-constrained parents respond to the “lumpy” nature of dowry payments at
      the time of marriage by saving in advance. We find that, relative to parents of firstborn-boys,
      parents of firstborn-girls increase per capita household saving and fathers work more after the
      child’s birth if expected future dowry payment is higher.

JEL Codes: J12, J16, D10
Keywords: Dowry, Marriage, India, Savings, Education, Fertility, Sex Ratio, Employment

   ∗
     We thank Achyuta Adhvaryu, Prashant Bharadwaj, Sonia Bhalotra, Lucas Coffman, Mausumi Das, Anusar
Farooqui, Andrew Foster, Delia Furtado, Parikshit Ghosh, Rachel Heath, Rob Jensen, Adriana Kugler, Hyun Lee,
Arthur Lewbel, Annemie Maertens, Subha Mani, J.V. Meenakshi, Mushfiq Mobarak, Krishna Pendakur, Laura
Schechter, Chris Udry, Shing-Yi Wang, David Weil, and seminar and conference participants at the AEA-Econometric
Society Joint Meetings, Boston College, Delhi School of Economics, Fordham University, Georgetown University,
IFPRI, Indian Statistical Institute, NEUDC, New Frontiers in Development Economics Conference, SEA Meetings,
University of British Columbia, and University of Connecticut for their helpful comments and suggestions.
   †
     Department of Economics, Boston College and IZA. anukriti@bc.edu.
   ‡
     Department of Economics, University of Connecticut. sungoh.kwon@uconn.edu.
   §
     Department of Economics and Human Rights Institute, University of Connecticut, IZA, HiCN, and CReAM.
nishith.prakash@uconn.edu.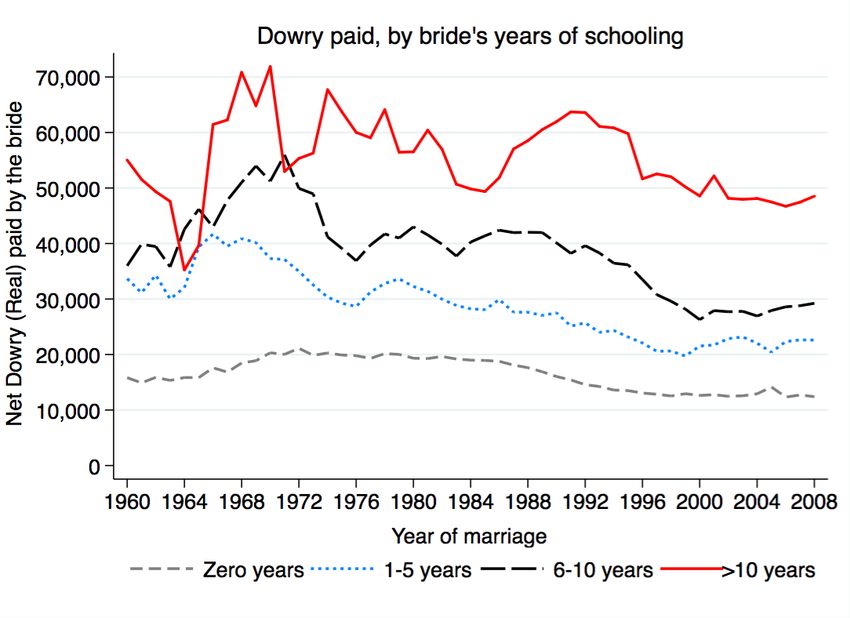
1        Introduction
Marriage matters a great deal for individuals’ well-being everywhere, but especially in countries,
such as India, where it is nearly universal. Historically, marriage has been an arranged, economic
agreement between the bride, the groom, and their families, and it continues to be so in many
contemporary societies.1 A key feature of these marriages is bride-to-groom (dowry) or groom-
to-bride (bride price) payments at the time of marriage. These marriage payments are widely
prevalent in several developing countries and can be large enough to affect the welfare of households
and a society’s distribution of wealth. Like any custom or cultural norm, in the very long-run,
societies have witnessed complete disappearance of marriage payments (e.g., in Europe) as well as
transformations from one type to another (e.g., in Bangladesh). Nevertheless, in most contexts,
the expected direction of marriage payments is quite stable over an individual’s lifetime, even if the
exact amount is unknown prior to and is negotiable at the time of marriage. We seek to answer the
following question in this paper: how do families and individuals respond to these expected future
marriage payments?
        We focus on dowry payments in contemporary India. Despite being illegal since 1961, dowry is
almost universal in India, often amounting to several years of household income. According to the
2006 Rural Economic Demographic Survey (REDS), dowry was paid in X percent of rural Indian
marriages. Moreover, dowry is paid in a lump-sum manner at the time of the wedding.2 According
to Becker (1981), the “lumpy” nature of dowry could be due to the couple’s inability to divide
marital output during the course of a marriage due to the presence of public goods, or cultural
norms that dictate a fixed sharing rule. If the wife’s economic contribution to the marital surplus
is lower than that of the husband’s, a positive dowry will need to be given by the bride’s family to
the groom’s family.
        Another reason why dowries are paid as a lump-sum amount at the time of marriage could be
the custom of virilocality or patrilocality which dictates that, upon marriage, a daughter leaves
her natal home to move in with her husband’s family, while a son continues to live with his parents.
According to Botticini and Siow (2003), parents may make a large dowry transfer to the daughter
at the time of marriage (and a small bequest) to mitigate a free-riding problem between male and
female siblings. Due to virilocality, sons have a comparative advantage in working with parents’
assets, such as a family farm. If parents divide their wealth equally between a coresident son and
a non-coresident daughter at the time of inheritance or bequest, it weakens the incentive for the
son to put in effort into the family assets in the meantime. The family structure in rural India is
still highly virilocal. Daughters almost never live their parents after marriage, and Y percent of the
parents live with their sons who are primarily responsible for working on the family assets.3 Thus,

    1
     In the 2012 Human Development Survey of India, only 5 percent of ever-married women aged 25-49 reported
that they had a self-arranged or “love” marriage.
   2
     The groom’s family often receives further transfers from the bride’s family after marriage (Bloch and Rao (2002))
but these tend to be substantially smaller in magnitude.
   3
     In fact, the equalization of inheritance rights has only resulted in higher dowries and strategic gifting of family

                                                           1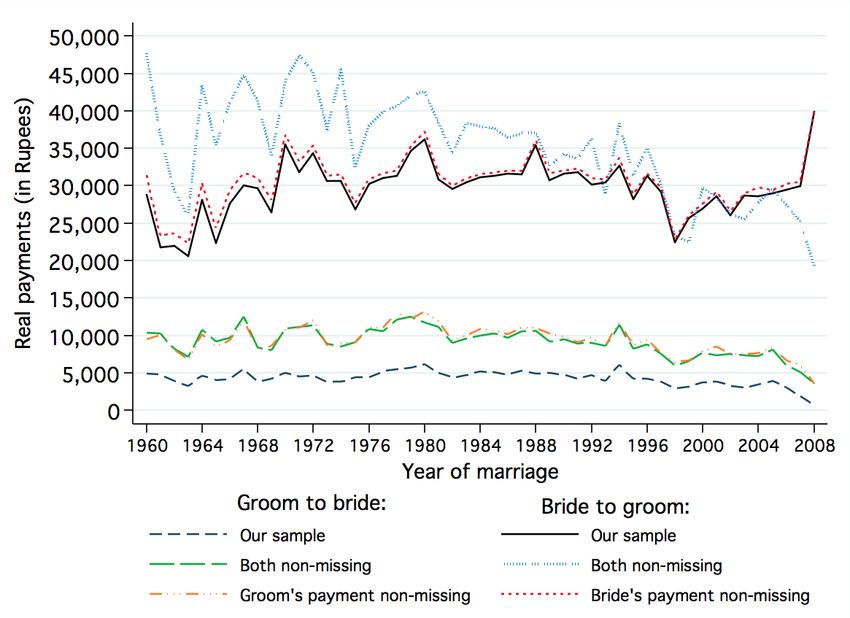
lumpy dowries at the time of marriage continue to be the norm.
    Faced with a lumpy expense, one way parents of daughters could fund dowries is through
borrowing around the time of marriage. However, individuals in a low-income country such as
India face substantial credit constraints. Moreover, the illegal nature of dowry prevents formal
sector lending for the purpose of dowry. An alternative way to raise the required liquidity is
through savings. Therefore, in this paper, we test if parents of a daughter save more than parents
of a son after the child’s birth in order to meet the higher future dowry expenditure for the former.
We also examine if parents of a daughter adjust their labor supply after her birth to finance the
higher savings. We expect dowry-induced savings to be higher among families with daughters that
are less income constrained.
    There are two major challenges to estimating the causal effect of expected dowry payments on
the outcomes of interest after the birth of a child. First is the likely endogeneity of the dowry
variable. We assume that parents form expectations about dowry amounts by observing dowries
paid by brides or received by grooms in their marriage market. Thus, for a child born in a given
year, we define expected dowry as the average net dowry paid by brides or received by grooms from
the same caste and state as the child and who married during the year of the child’s birth or the
prior four years. While our dowry variable is pre-determined, it is not exogenous if it is correlated
with unobservables that also affect the outcome variables. We address this concern by utilizing
the fact that dowry affects parents of boys and girls in the same marriage market in the opposite
manner—the former expect to receive and the latter expect to pay dowry.
    The second issue arises because boy families and girl families are likely to be different along
other dimensions that are correlated with the outcomes. This is especially true as selective abortion
of girls is widespread in contemporary India. To address this concern, we distinguish between
households that differ by firstborn sex. Despite access to prenatal sex-determination technology,
the sex ratio at first parity has remained unbiased in India and is frequently used as an exogenous
shock in related literature (Das Gupta and Bhat (1997), Visaria (2005), Bhalotra and Cochrane
(2010), Anukriti et al. (2016)). While parents of a firstborn girl (FG) may be more likely to have
a subsequent birth and to sex-select due to a desire for at least one son (or to compensate for
the negative dowry-income shock due to a FG), they should still have more girls on average than
firstborn boy (FB) households.4 Therefore, the first child’s gender can be reasonably considered
an imperfectly anticipated permanent income shock at the time of birth.5 Thus, we estimate
the causal impact of dowry expectations by interacting randomly determined firstborn sex with
pre-determined expected dowry payments.
    We implement this empirical strategy by using the 2006 Rural Economic and Demographic
Survey (REDS) of India. This dataset contains several questions that are not commonly asked

property to sons (Roy (2015)).
   4
     This would not be the case if FB parents abort subsequent male fetuses in order to have a daughter. However,
there is no empirical evidence to support this claim.
   5
     The income shock will however be anticipated at the time of child’s marriage.

                                                       2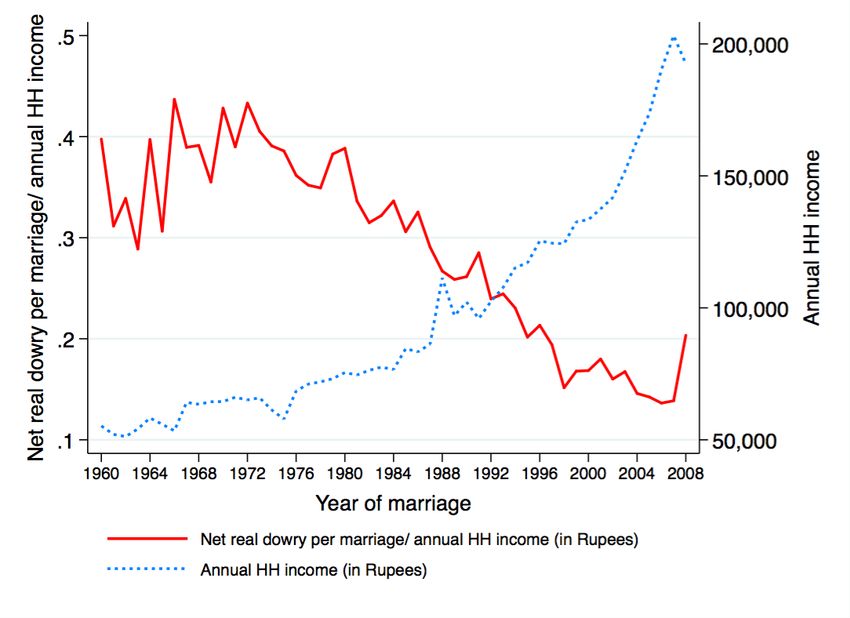
in most Indian household surveys. First, unlike other Indian datasets that record total marriage
expenditure by families similar to the respondent’s family (such as the India Human development
Survey (IHDS)), REDS reports actual payments by brides and grooms in the surveyed households.
Using retrospective information on gifts given and received at the time of marriage, we compute
the net real payment by the bride (“dowry”) for 39,544 marriages that took place during 1960-2008.
Second, REDS collects rich information on various forms of savings at the household level, such as,
savings in financial institutions, in jewelry, in livestock, and in durable goods.
       Our main findings are as follows. F irst, as expected dowry increases, FG families significantly
increase per capita savings overall and relative to FB families. Second, the increased savings in
FG families take the form of formal savings in financial institutions and they do not invest more
in jewelry or precious metals that are traditionally considered an integral part of dowry in India.
T hird, FG fathers work more days in a year relative to FB fathers as expected dowry burden goes
up. However, dowry does not seem to be a significant explanatory factor for differential fertility and
sex-selection in FG and FB families. On the whole, we find that the custom of dowry significantly
alters the financial decisions of a household, and parents respond in a manner that suggests that
they are credit constrained.
       Our results contribute to several literatures. While dowries have received considerable attention
in the economics literature, a lot of it is theoretical (e.g., Botticini and Siow (2003), Anderson
(2007b), Anderson and Bidner (2015)). While dowry trends in India have been the subject of a
lively debate (Anderson (2003), Anderson (2007a)), the empirical arguments have relied upon a
small sample collected by the International Crops Research Institute for the Semi-Arid Tropics
(ICRISAT) that is not nationally representative and is outdated (Rao (1993), Edlund (2006),
Arunachalam and Naidu (2015)).6 Other recent papers that study dowry in India using alternate
data (e.g., Maertens and Chari (2012), Chakraborty (2015), Roy (2015), Bhalotra et al. (2016)) do
not analyze dowry trends. As such, our first contribution is that we describe the evolution of and
the heterogeneity in dowry by caste, religion, and state in contemporary India.
       Second, we contribute to the growing body of work on the effects of marriage payments.7 We are
unaware of any study that estimates the causal impact of dowry on household savings, labor supply,
and expenditure on children. While Deolalikar and Rose (1998) and Rose (2000) have examined,
using ICRISAT data, the association between female birth, savings, and parents’ time allocation
in India, they do not use dowry data and thus do not explicitly show that dowry is the underlying
mechanism for their findings. Moreover, their analyses are less relevant for post-1980 India where
sex-selection has made child gender endogenous. Our analyses of fertility and sex-selection are
related to Alfano (2015) and Bhalotra et al. (2016), but our results differ.
       We also make a modest contribution to the large literature on income and consumption smooth-

   6
   More details are in Section 3.
   7
   See Ashraf et al. (2016) for brideprice and Bloch and Rao (2002), Alfano (2015), and Bhalotra et al. (2016) for
dowry.

                                                        3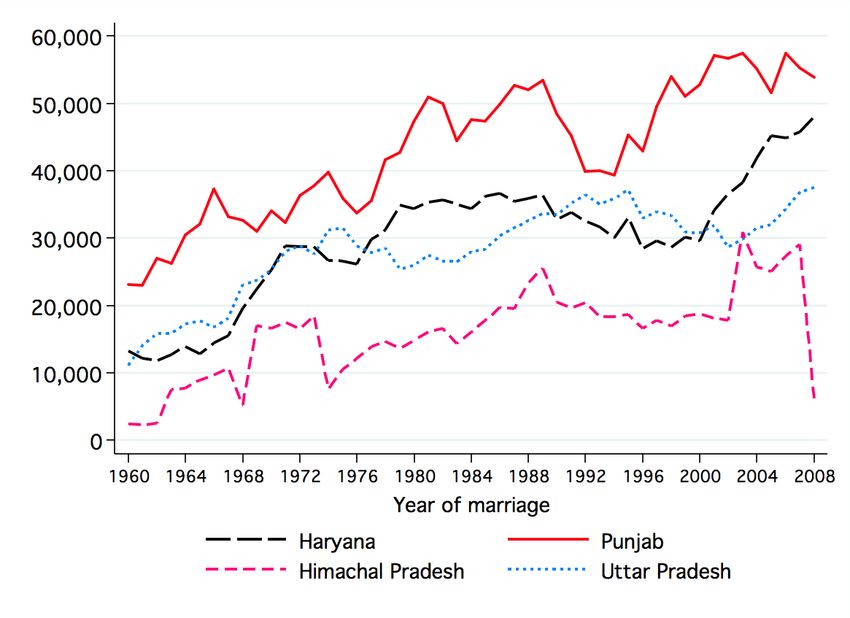
ing (Morduch (1995)). Our finding that households use savings and adjust labor supply to smooth
negative income shocks is consistent with classical life-cycle and permanent income models (Franco
and Brumberg (1954), Friedman (1957), Campbell (1987)). The lack of smoothing in response to
positive income shocks is also consistent with the empirical literature on liquidity or credit con-
straints (Jappelli and Pistaferri (2010)). Lastly, our work is tangentially related to the research on
the impact of sex ratios on savings (Wei and Zhang (2011), Horioka and Terada-Hagiwara (2016)).

2        Data
We use the most recent 2006 round of REDS, which is a nationally representative survey of rural
Indian households first carried out in 1968. In addition to detailed information on savings, labor
supply, and other economic and demographic variables, REDS includes retrospective questions
on marriage histories of household members.8 Unlike other datasets, e.g., the Indian Human
Development Survey (IHDS), that record total marriage expenditure by families similar to the
respondent’s family as reported in the year of survey, REDS collects data on actual payments by
brides and grooms in the surveyed households. Specifically, it reports the value of gifts received or
given at the time of marriage in addition to the year of marriage and demographic information of
spouses (e.g., caste, age, and years of schooling).
        Our primary outcomes of interest are different measures of saving, father’s days worked, and
expenditure on children’s education. Using the detailed information available in REDS, we con-
struct the following measures of household saving in per capita terms: total savings, formal savings,
savings in jewelry, savings in livestock, and savings in durable goods.9 The saving variables are
constructed based on the value of each item purchased (deposits) and sold (withdrawals) during
the year before the survey, i.e., we only have information on savings at one point in time. The em-
ployment history in REDS 2006, however, provides the number of days worked each year between
1982 and the year of survey, which we use to construct a panel data set of fathers’ labor supply.
        Columns (1) and (2) of Table 1 provides some summary statistics that describe the socioeco-
nomic characteristics of our sample. An average household expects to pay or receive Rs. 26,300
as dowry. Educational attainment is low—the years of schooling for an average father and mother
are, respectively, 7 and 4. OBCs are the largest caste group in the sample (46 percent), followed
by other “upper” castes (28 percent), SCs (17 percent), and STs (9 percent). In terms of religion,
Hindus are the majority (88 percent). The mean number of children at the time of survey is 2.09.
The year of birth for the firstborn child ranges from 1992 to 2008. We restrict the child age to less
than 15 before constructing birth order. We restrict our sample to nuclear households since savings
data in REDS are available only at the household level.
        Recall bias. Like most survey data, one may be concerned about the recall bias in the reported
dowry variable, especially when the year of marriage is too far back in time. To examine the extent

    8
     The 2006 REDS collected marriage histories of a household head’s sons, daughters, brothers, sisters, and non
co-resident parents.
   9
     A detailed description of variable definitions is available in Section 8.

                                                       4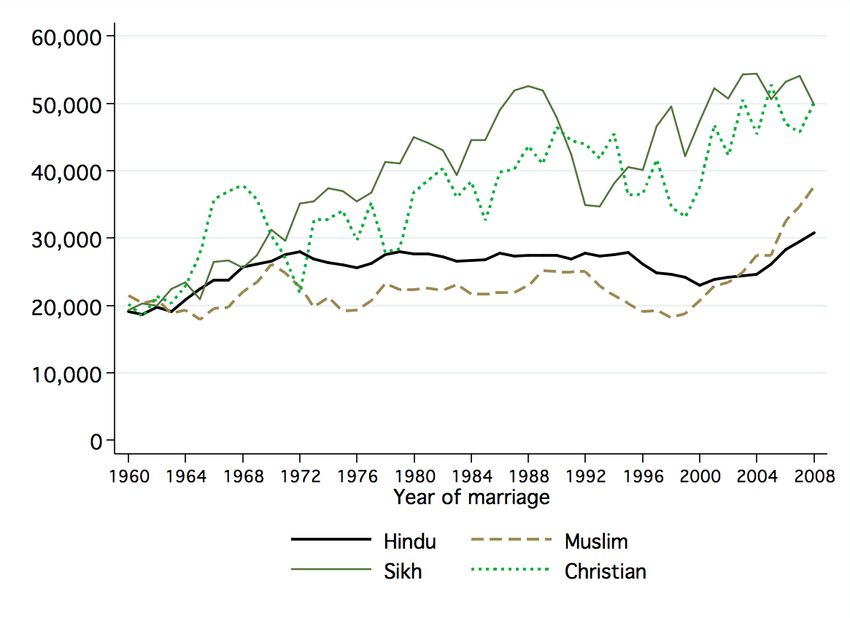
of recall error, we utilize data from the 1999 round of REDS and compare average dowry by year of
marriage for years that are available in both rounds. Figure 9 shows that, for the sample period of
our savings analysis (1991-2008), the two rounds report similar dowry amounts. Thus, recall bias
is unlikely to be a significant issue for our regression estimates.
         Savings. There is very limited literature that describes the variation in saving behavior of
households in developing countries. We start by examining the distribution of per capita household
savings in financial institutions in Figure 1. An average household in our data saves about INR
759 (or $12) in a year, with close to 50 percent of the families saving ≤ INR 100. Figure 2 shows
that the distribution across castes while Figure 3 plots the average per capita saving in financial
institution across states for various caste groups. Average saving decreases as one moves down the
caste hierarchy and there is substantial cross-state heterogeneity in saving amounts. Among upper
castes, the states of Gujarat, Kerala, and Punjab have the higher savings; as we will see later, these
states rank high in terms of average dowries.

3         Dowry in Contemporary Rural India
The first objective of this paper is to document the trends in dowry payments in contemporary rural
India. There has been a lively debate in the literature on whether India (and the rest of South Asia)
has been experiencing dowry inflation, and, if so, whether it has been caused by an excess supply
of women on the marriage market, referred to as the “marriage squeeze” (e.g., Rao (1993), Edlund
(2006), Anderson (2007b)).10 Remarkably, this debate has been based on data from an extremely
small sample that is not nationally representative. The International Crops Research Institute for
the Semi-Arid Tropics (ICRISAT) sample used in Rao (1993) and Edlund (2006) comprises 141
households from six villages in three districts of rural South Central India collected in 1983 through
a retrospective survey on marriage.11 This is likely due to lack of data on dowries during the time
period examined by these studies, roughly 1923-1978. Other papers on this topic (e.g., Anderson
(2007b)) have been theoretical and have assumed the presence of dowry inflation and have sought
to test if marriage squeeze is a credible explanation for it. Moreover, these studies do not inform
us about trends in more recent years that have witnessed remarkable economic and social changes.
         Recently, Logan and Arunachalam (2014) use data from Bangladesh, India, Nepal, and Pakistan
to assess this prior research, and conclude that there is no dowry inflation in South Asia. For
India, in addition to the 1983 ICRISAT survey used by the aforementioned studies, they use the
SWAF survey conducted in 1993-94. While SWAF data is more recent than ICRISAT data, a key
shortcoming of it, that the authors acknowledge, is that it does not report specific dowry amounts
and instead provides five ordinal categories that nominal dowries fall into.

    10
    Logan and Arunachalam (2014) provide a detailed and comprehensive discussion of this debate.
    11
    The six ICRISAT villages belong to two states: Andhra Pradesh (Aurepalle and Dokur villages of Mahbubnagar
district) and Maharashtra (Shirapur and Kalman under Solapur district, Kanzara and Kinkhed under Akola district).
The total number of surveyed households was 240, but the regression analysis sample in Rao (1993) and Edlund (2006)
comprises 141 and 160 households, respectively, due to missing data.

                                                        5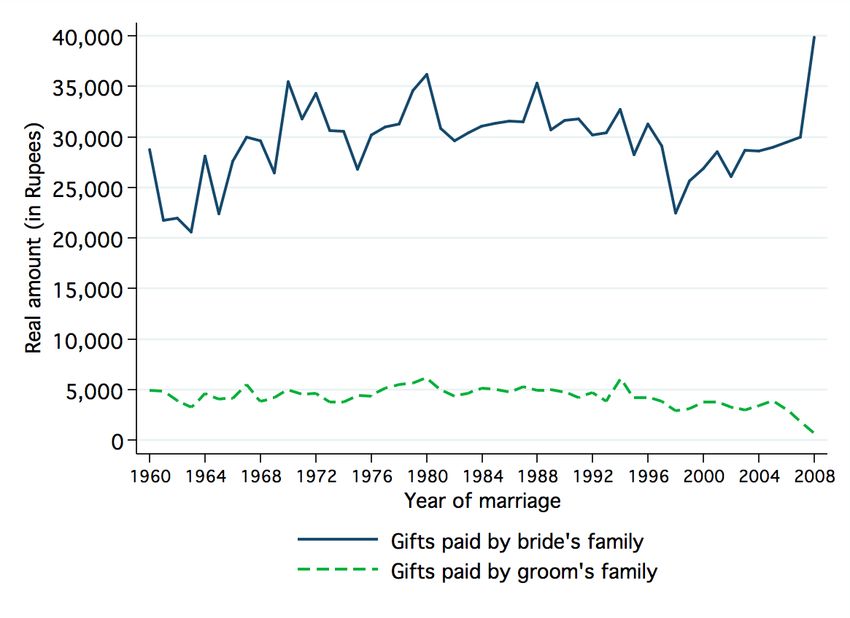
We supplement this literature by utilizing another data source—REDS 2006—that is more
recent, is larger, is more representative, and provides retrospective information on the nominal
value of gifts received or given at the time of marriage for each year during 1960 and 2009. While
some recent papers have used this dowry data (Chakraborty (2015), Roy (2015), Bhalotra et al.
(2016)) for part of their analyses, none have used it to describe the cross-sectional and temporal
variation in dowries.12
    In this section, we describe the evolution of (i) gross payments by the bride’s family to the
groom or his family, (ii) gross payments by the groom’s family to the bride’s family, and (iii) net
dowry computed as the difference between (i) and (ii). We deflate the nominal amounts using the
2005 Consumer Price Index (CPI) and plot 5-year moving averages in most graphs.
    Figure 4 shows that average dowry has been remarkably stable over time, with some dowry
inflation during 1960-73 and 2000-09. The trend in net dowry is mimicked by the trend in gross
payments by the bride’s family to the groom’s family. The flow of payments in the opposite
direction, i.e., from the groom to the bride, is also positive throughout, but substantially smaller.
While an average groom’s family spends about INR 5,000 on gifts to the bride’s family, gifts from
the bride’s family cost seven times more, i.e., about INR 35,000. Thus, the real net dowry fluctuates
around INR 27,000 during 1973-1995 in our sample.13 As per capita incomes have risen in India
during our study period, these stable trends imply that, on average, dowry as a share of household
income has gradually declined at the national level. The bottom figure in Figure 4 shows that
average net real dowry per marriage in 2007 was equivalent to 14 percent of annual household
income, as compared to 40 percent during early 1970s. Figure 5 plots the distribution of net and
gross marriage payments. The proportion of marriages with a negative net dowry, i.e., where the
groom’s family paid more to the bride’s family than the other way around, is non-zero, but quite
small. The vast majority of the marriages involved positive net dowry payments to the groom’s
family. We do not observe any marriages where the value of gifts was reported to be zero.14
    It is well-known that the Indian marriage market imposes significant barriers on marriage across
castes and religions. Thus, caste- and religious-groups can, in a sense, be considered distinct
marriage markets. In Figure 6 we therefore examine the trends in net real dowry separately for
Scheduled Caste (SC), Scheduled Tribe (ST), Other Backward Class (OBC), and other or upper
caste households in the top panel, and for four religious groups—Hindus, Muslims, Sikhs, and
Christians. Dowry is positively correlated with higher caste status and the caste hierarchy of
dowry payments has not changed over time. Upper caste marriages have the highest dowries,
followed by OBCs, SCs, and STs.

  12
     Since the beginning of this study, we have become aware of another paper (Chiplunkar and Weaver (2017)) that
also examines dowry trends using REDS data; however, they use an earlier round of REDS from 1999 and the focus
of that paper is on explaining the dowry variation where as we study the effects of dowry.
  13
     The INR 27,000 amount is roughly similar to the dowries reported in Figure 1 of Logan and Arunachalam (2014)
during 1923-78.
  14
     However, our data does contain marriages with missing information on gifts. A detailed discussion of this issue
and how we deal with it is in Appendix B.

                                                         6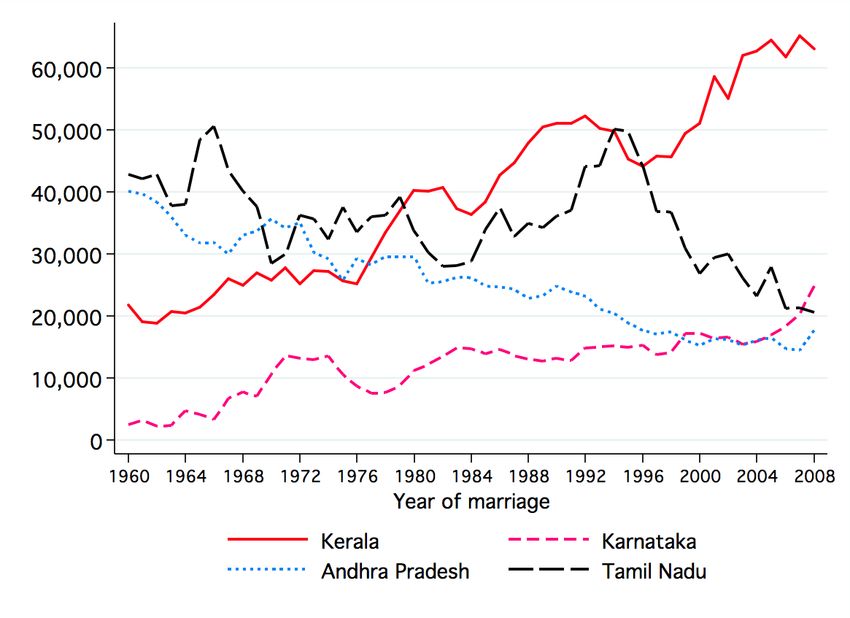
The trend for Hindus is similar to the national trend, which is not surprising as Hinduism is
the majority religion in India (89 percent of our sample is Hindu). It is also quite clear from the
graph that dowry is not just a Hindu phenomenon in India. In fact, Christians and Sikhs exhibit
a remarkable increase in dowry in recent years. Moreover, average net dowry payments in Muslim
marriages are only slightly lower than Hindu dowries. The prevalence of dowry among Indian
Muslims is consistent with the evidence from Bangladesh, a Muslim country where brideprice is
rarely observed in recent decades (Ambrus et al. (2010)). The dowry inflation in post-2000 years
appears to be driven by upper castes and non-Hindus.
We corroborate the cross-sectional patterns by caste and religion using dowry data from the
2004-05 IHDS. Unlike REDS, IHDS elicits dowry data indirectly by asking respondents how much
money is usually spent at the time of the marriage by a groom’s or a bride’s family that is similar to
the respondent’s family; this information is only collected for the survey year. Table A.1 shows the
sample means of the net dowry paid by the bride’s family calculated using these responses for various
castes and religions. Although our paper focuses on rural India because REDS does not cover urban
areas, we also report urban dowries from the IHDS for comparison. Reassuringly, the patterns in
Table A.1 are identical to those in the REDS data in 2004-05. The similarities between REDS
and IHDS also assuage concerns about differential under- or over-reporting of dowry payments and
receipts by the sampled households.
Figure 7 explores geographical variation in dowry trends. While the trend is quite flat for several
states, there are some noticeable exceptions. Kerala exhibits stark and persistent dowry inflation
since the 1970s, and has the highest average dowries in recent years. Given Kerala’s religious
composition—26 percent Muslims, 18 percent Christians, and 55 percent Hindus—this trend is
compatible with the differential trends by religion described earlier. Similarly, the inflationary
trend in Punjab—a majority Sikh state—is also consistent with the rise in Sikh dowries. Other
states with less dramatic inflationary trends are Haryana and Gujarat, although the latter exhibits
a sharp rise during 2000-09. On the other hand, dowry decreased in Orissa (with a slight recent
increase),15 West Bengal, Tamil Nadu, and in one of the two ICRISAT states, Maharashtra. The
second ICRISAT state, i.e., Andhra Pradesh, displays deflation since mid-1990s and a more volatile
trend before that. Note, however, that the studies by Rao (1993) and Edlund (2006) focus on the
1923-1978 time period.
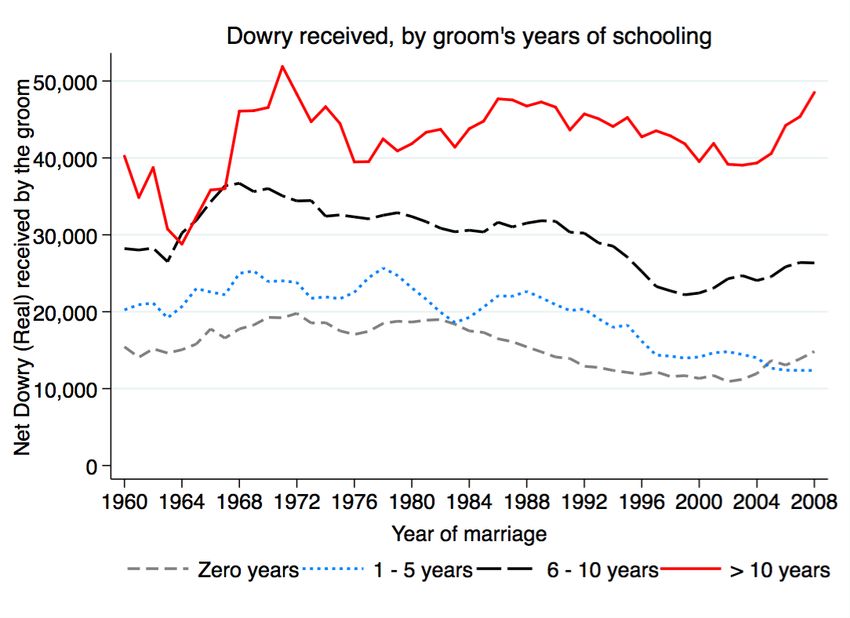
Lastly, Figure 8 shows how dowry varies by the educational attainment of brides and grooms.
More educated brides pay higher dowry and more educated grooms receive higher dowry. These
patterns could reflect the positive correlation between parental income and education, as well as
assortative matching on the marriage market.
15
The high level of average dowry in Orissa aligns well with the high prevalence of dowry-related crimes in the
state. In 2013, Orissa had the highest dowry-related crime rate among Indian states, accounting for 16.5 percent
of the total dowry-related cases recorded in the country during 2012. Source: http://www.newindianexpress.com/
states/odisha/State-tops-the-chart-in-dowry-cases/2013/08/08/article1723732.ece.
7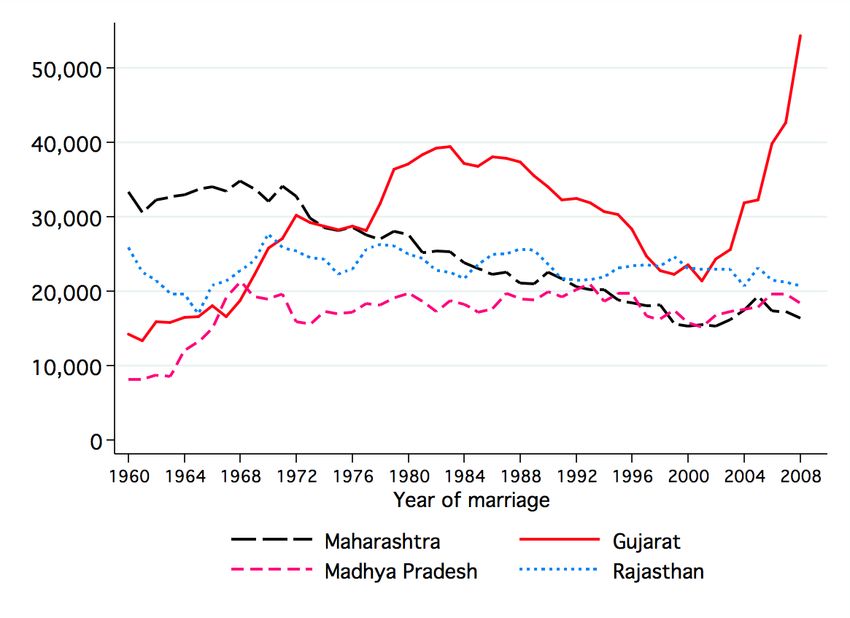
4    Identification Strategy
Our second goal is to estimate the causal effect of expected future net dowry payments on parents’
current saving behavior, current labor supply, and investments in children. However, this is not
straightforward because of two concerns about our dowry variable. First, does it accurately measure
expectations and second, is it exogenous? Note that our dowry variable differs by the child’s year of
birth, parents’ caste, and state of residence. Specifically, we define expected dowry as the average
net dowry paid by brides or received by grooms from the same caste and state as the child and
who married during the year of the child’s birth or the prior four years.
    The accuracy of the dowry variable depends on how correctly we define marriage markets and
capture expectation formation. We assume that the relevant marriage markets are based on caste
(and religion) and state. This is a reasonable assumption given the highly endogamous nature of
the Indian marriage market. According to the 2005 IHDS, only 4.4 percent of women were married
to a spouse from a different caste. Using responses to matrimonial advertisements in a Bengali
newspaper, Banerjee et al. (2013) find evidence in favor of a strong preference for in-caste marriage
– e.g., the bride’s family is willing to trade-off the difference between no education and a master’s
degree in the prospective husband to avoid marrying outside their caste. In addition to this “hor-
izontal” preference for same-caste marriages, inter-subcaste marriages are governed by strict rules
of hierarchy. Although caste is primarily a Hindu phenomenon, the notion of caste-based hierarchy
remains well-preserved among many other religious groups in India. In the 2009 National Sample
Survey, 31 percent of Sikh households identified themselves as belonging to a Scheduled Caste (SC).
Lastly, inter-religious marriages are far less common than inter-caste marriages. Moreover, while
patrilocal exogamy is widely practiced, most people marry within their state. To illustrate, less
than 4 percent of the population in 2001 had moved across states in the last ten years according
to the Census data. We also assume that parents form expectations about future dowries based on
recent dowries within their caste and state of residence.
    We also try two alternate definitions of dowry by changing the years over which the average
is calculated and by using both caste and religion to define the marriage market to modify how
expectations are formed. In ongoing work, we examine if other moments of dowry, such as its
variance, also matter. Moreover, we plan to test if dowry around the year of survey is a more
relevant explanatory factor for savings in the survey year.
    As mentioned in the introduction, we utilize the fact that dowry affects parents of boys and
girls in the opposite manner—the former expect to receive and the latter expect to pay dowry upon
marriage. However, fertility and child composition may be endogenous. Before sex-selection was
possible, girls were born in relatively larger families as compared to boys, and larger family size
would mechanically have lower savings per capita, irrespective of dowry expectations. Moreover, if
son-biased stopping rules or sex-selective abortions are more prevalent among groups with certain
socioeconomic characteristics that are also correlated with savings, for example, we are also likely
to encounter the omitted variables bias. Therefore, interacting expected dowry with the number
or the sex ratio of children is also not ideal.

                                                  8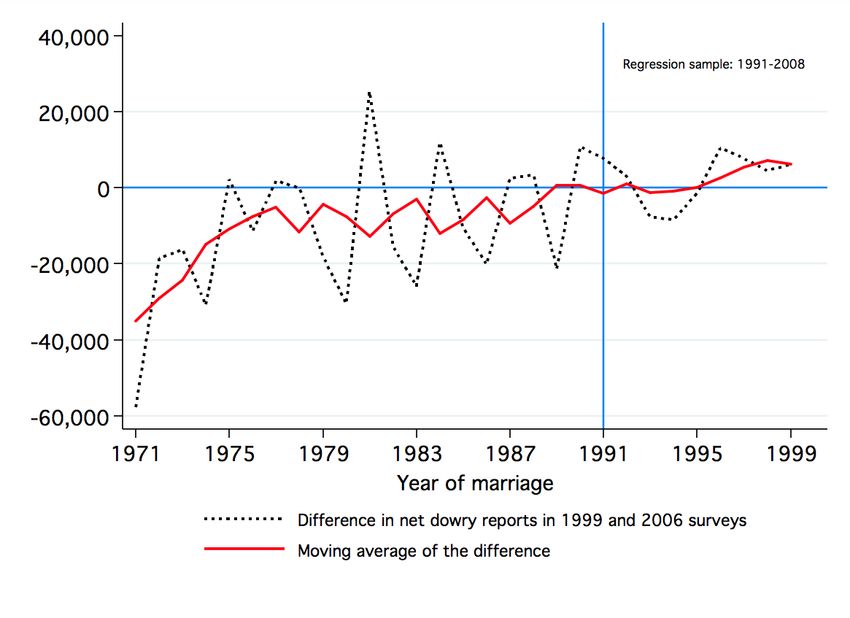
In order to address the endogeneity, we interact expected dowry with firstborn sex. Despite
access to sex-selection, the sex ratio at first parity has remained unbiased in India and is frequently
used as an exogenous shock in related literature (Bhalotra and Cochrane (2010), Rosenblum (2013),
Anukriti et al. (2016), Milazzo (2017)). Figure 10 shows that there has been no change in the
proportion of females among first births in India over time. Table 1 provides summary statistics
of the key variables used in our analysis by the gender of the first child. Reassuringly, there are
no significant differences between FB and FG families in terms of socioeconomic characteristics
such as expected dowry, caste, religion, mother’s years of schooling, except for small differences in
father’s schooling and belonging to a SC. Nevertheless, we control for all these covariates in our
specifications. For given expected dowry per marriage, we expect FG families to save more that
FB families.
       Ideally, we would focus on households that recently had their first child and compare FB families
with FG families. However, due to sample size concerns, we first use the entire sample regardless
of the number and the composition of children. While FG parents may be more likely to have
a subsequent birth and sex-select due to son preference or to compensate for the negative dowry-
related income shock from the first birth, FG families should still have more girls on average (unless
parents of the first boy want to have a girl and abort male fetuses, which is unlikely), and hence we
expect them to save more relative to FB families. Later, we examine heterogeneity in our results
by the number of children.
4.1      Savings
To investigate whether FG parents save more than FB parents during 2008 due to expected future
dowry payment, we estimate the following specification for household i from caste c in state s and
whose first child was born in year t:

                     2008
               Savingicst = α + β1 F irstGirli × Dowrycst + β2 Dowrycst + β3 F irstGirli
                           + πst + φct + ψsc + ηc F irstGirli + ηs F irstGirli + ηt F irstGirli               (1)
                                                0
                           + ωc + δs + θt + Xi γ + icst ,

            2008 denotes various flow measures of per capita household saving in 2008; F irstGirl
where Savingicst                                                                                  i
indicates that the firstborn child in household i is female; Dowrycst is expected dowry defined as
the average dowry paid by brides from caste c in state s who were married during the year of
the child’s birth or the prior four years (i.e., during t, t − 1, t − 2, t − 3, t − 4);16 Xi is a vector of
covariates comprising parents’ years of schooling, indicators for religion and the month of survey.
We report unweighted regressions in the main set of tables. However, our results remain the same
when we use weights.17 Standard errors are clustered at the state level. We also compute standard

  16
    The robustness checks using alternate definition of dowry expectation are provided in Section 7.
  17
    The 2006 REDS data does not provide sampling weights, hence we construct them in the following manner. Using
the village listing data which includes all households in REDS villages, we create an indicator for the households

                                                        9
errors that are wild-cluster bootstrapped by state.
The coefficient β2 captures how savings in FB families respond to expected dowry receipts, while
β1 captures the differential response of FG families to expected dowry, relative to the response of
FB families. The coefficient β3 describes the difference between savings behavior of FB and FG
families when expected dowry is zero. Thus, the inclusion of the FG main effect allows us to
control for any changes in per capita saving that could result for factors unrelated to dowry, for
instance, higher fertility among FG families due to the desire for at least one son. To exclude other
confounding factors related to the caste, state, gender, and year of birth of the firstborn child,
we control for all main and interaction fixed effects for these factors (i.e., ωc , δs , θt , πst , φct , ψsc ,
ηc F irstGirli , ηs F irstGirli , ηt F irstGirli ).
Thus, any remaining threats to identification come from caste-state-year specific factors that
may be correlated with Dowrycst and that differentially affect FG and FB parents. If this is so,
the coefficient of interest, β1 , would then be contaminated by these omitted variables, and would
not capture the causal effect of dowry expectations. To address the former concern, we replace
the main effect of Dowrycst with caste x state x year fixed effects in specification (2) to estimate
an even stricter specification that non-parametrically controls for everything that varies at the
caste-state-year level and is correlated with household savings:
2008
Savingicst = α + β1 F irstGirli × Dowrycst + δcst + β3 F irstGirli
+ πst + φct + ψsc + ηc F irstGirli + ηs F irstGirli + ηt F irstGirli (2)
0
+ ωc + δs + θt + Xi γ + icst ,
This leaves us with confounding factors that differ within caste-state-year and that differentially
affect FG and FB parents. One such factor could be fertility. If dowry changes in a caste-state-year
are correlated with changes in, say, the degree of son preference, the likelihood and the sex ratio of
higher parity births may differ by firstborn sex. Additionally, if dowry is more prevalent in regions
with stronger son preference, we would expect FG families to be more likely to have subsequent
births if they are following son-biased stopping rules with or without sex-selection, and that is
likely to lower per capita savings. Therefore this bias would go against us. A higher sex ratio may
eventually also reduce dowry due to scarcity of women on the marriage market (although there
is currently no evidence that this has happened in India). However (1) our variable of interest is
expected dowry, which is what determines parents’ financial decisions when the child is young and
(2) a lower expected dowry should make parents less likely to save.
Fertility could also be directly affected by expected dowry if FG families respond to dowry
that are actually sampled and regress it on the observables in the listing data. These inverted predicted probabilities
serve as weights, assuming that the observables capture differential reasons for being surveyed. The observables in
the listing sheet data used to construct weight are household size, number of earners in the household, head’s age,
head’s years of schooling, indicators of head’s caste (SC, ST, OBC, OC), religion (Muslim), and gender, and state
fixed effects.
10expectations by increasing sex-selection for subsequent births (to have a compensating son who
would receive dowry), that could lower fertility (and household size), and thereby increase per
capita savings. To test if this the case, we re-estimate equation (1) by using fertility and the
proportion of sons in second and higher parity births as the dependent variables.
Lastly, we examine how our results change when we restrict the sample to households with
specific number of children. A strict test for our story comes from one-child families. Since these
families have not yet had a second child, any saving response to firstborn sex and expected dowry
cannot be due to endogenous fertility change.18 Restricting to a short time horizon after the birth
of the first child shuts down the re-optimization that takes place in response to the revelation of
the first child’s gender.
4.2 Labor Supply
The birth of a son or a daughter can affect parents’ time allocation in the following ways. If FG
parents are income-constrained, they may increase labor supply in an attempt to supplement their
income to finance the higher savings needed for the future dowry expense. Moreover, the permanent
income shock is a pure lottery and doesn’t change the reward or wage from working, i.e., there is
no substitution effect. However, the income effect implies that in the absence of credit constraints,
FB parents should increase leisure, i.e., decrease labor supply and FG parents should increase labor
supply. When the household is credit constrained, the inability to borrow implies that current
leisure may not increase, i.e., current labor may not decrease, when permanent income goes up for
FB parents.19
Using the employment history between 1982 and 2008, we estimate the labor supply response
for father i from caste c in state s in year t0 and whose first child was born in year t. The following
specification estimates the impact on labor supply:
Lit0 = α + β1 F irstGirli × P ostt0 >t × Dowrycst
+ β2 P ostt0 >t × Dowrycst + β3 F irstGirli × P ostt0 >t (3)
+ δst0 + θct0 + πtt0 + γi + ωt0 + it0 ,
where Lit0 are the the number of days worked in year t0 ; P ostt0 >t equals 1 if t0 > t, and 0 otherwise;
and F irstGirli and Dowrycst are defined as before. We include the time interaction fixed effects
18
Note that we implicitly take into account duration since the first birth through the year of first birth fixed effects.
19
The predictions for mothers are not as straightforward. While child rearing may involve some decline in market
work irrespective of child gender, returns to investment of women’s time in child-care on the marriage market may be
an additional consideration while allocating time. If sons with higher human capital investment (HKI) obtain higher
dowry, FB mothers may decrease labor supply even more, if there are no credit constraints. Similarly, if daughters
with higher HKI pay smaller dowries, FG mothers may also work less outside the home to invest in daughters’ HKI;
however, in that case FG fathers would work even more to compensate for the loss of mothers’ income. In any case,
89 percent of the mothers in our dataset report being a housewife as their primary occupation. Since the data does
not report days worked separately for primary and secondary occupations, we cannot credibly estimate the effect on
market- and non-market work for mothers, and hence focus only on fathers.
11(i.e., δst0 , θct0 , πtt0 ) as well as time fixed effects (ωt0 ) in this specification. The coefficient β2 captures
how expected dowry affects father’s number of days worked after the birth of a firstborn boy and
β1 captures the differential response of parents of a firstborn girl after her birth. The panel nature
of the labor supply variable allows us to control for father fixed effects (γi ).
4.3 Children’s Education
ONGOING.
5 Results
5.1 Savings
In Table 2 we present results from equations (1) and (2) that estimate the impact of expected future
dowry payments on parents’ current saving behavior. Note that the expected dowry variable is in
Rs. 10,000. We expand the definition of the savings variable as we move from column (1) to column
(6). In the first two columns, we examine the effect on per capita saving in financial institutions; in
the next two columns we add per capita cash saving to per capita saving in financial institutions;
and in the last two columns we also add the per capita interest earned by the household on its
savings. The coefficient of F irstborn girl is negative and always insignificant, implying that, in the
absence of dowry expectations, there is no difference between the saving amount in FG families and
FB families. However, as the interaction coefficient demonstrates, when expected dowry is positive,
FG families save significantly more than FB families, and, within FG families, savings increase with
the amount of expected dowry. The specifications without caste-state-year fixed effects show that
FB families do not have a significant effect on savings when anticipated dowry receipts are higher as
the coefficients are largely insignificant. These results suggest that the impending future lump-sum
dowry expense induces FG families to start saving more in advance. The interaction coefficient
in column (6) (= Rs. 617.54) translates into 71 percent higher savings in FG families for a given
expected dowry amount, relative to average annual savings in FB families of Rs. 874.69.
To address the endogeneity concerns related to differential fertility in FG and FB families, we
first show that our results survive controlling for indicators for the number of children (see column
(1) of Table 3). In the second column of Table 3, we show that the interaction coefficient remains
positive and significant when we control for the stock of savings at the beginning of 2008.
In Table 4, we re-estimate the effects on savings for families that only have one child. The
sub-sample of one child families offers a strict test for our story since the saving behavior of these
families has not yet been affected by the differential likelihood of higher parity births or sex-selection
of these births by firstborn sex (given that we flexibly control for duration since first birth effects).
We find that families that have only a girl child also save significantly more than families that
have only a boy child for given expected dowry. For given positive expected dowry, FG families in
column (6) save 4.6 times FB families’ average annual per capita savings. The higher magnitude of
the savings effect in Table 4 relative to Table 2 suggests that per capita savings fall as the number
of children increases.
12The higher savings in FG families take the form of higher per capita formal saving in financial
institutions. As Table 5 shows, contrary to conventional beliefs about dowries in India, we do not
find a significant difference in jewelry saving (in precious stones and metals) among FG and FB
families.20 This pattern of saving behavior is consistent with greater access to financial institutions
and instruments in rural India and the less liquid nature of jewelry relative to cash savings in bank
accounts during our study period. Similarly, there is no significant difference in terms of saving in
livestock (although the coefficient is positive) and saving in durable goods.
Bhalotra et al. (2016), on the other hand, find that an unexpected increase in the price of
gold leads to immediate rise in fetal and infant mortality of girls, which suggests that families
neither switch to alternate forms of dowry nor wait to realize if the price shock is permanent before
withholding investments in girls. If parents selectively eliminate daughters that become more
expensive due to gold inflation, then the gold price shock, of course, does not have to translate
into higher savings. However, by that reasoning, FG families should also be more likely to practice
sex-selection at higher parities as expected dowry rises. However, we do not find this to be true in
our data.21 Table 6 shows that FG families have higher fertility and practice greater sex-selection
even if expected dowry is zero (although the coefficients are insignificant), and that there is no
differential effect of dowry on future childbearing and sex-selection.
The findings in Table 6 not only assuage concerns about endogenous fertility, but are also
important in their own right. It is frequently claimed that dowry is an underlying cause of son
preference and discrimination against girls in India. While the desire for at least one son is real and
affects childbearing decisions, it leads to higher fertility and more male-biased sex ratios even in
the absence of dowry, and dowry does not seem to be an additional significant explanatory factor.
In fact, our results also contradict the findings of Alfano (2015) who finds that an amendment that
made the Indian anti-dowry law stricter in 1985 led to decreases in male-biased fertility behaviors
as it potentially made the dowry cost of daughters smaller. Both Alfano (2015) and Bhalotra et al.
(2016) do not directly estimate the effect of dowries on excess female child mortality, male-biased
fertility, and the sex ratio at birth.
However, we acknowledge that the REDS data is not the most suitable for analyzing fertility
and sex ratios; therefore, in ongoing work we combine the expected dowry variable with data from
the National Family Health Surveys of India to check the robustness of these findings.
Heterogeneity by income constraints. Next we test the role of income constraints in the
ability of parents to alter current saving in response to future dowry expenditure. Table 7 shows
that the higher savings for FG relative to FB families for given positive expected dowry is driven
by above poverty line households. The coefficient of Firstborn girl * Expected dowry is also positive
for below poverty line families but is small and is insignificant, suggesting that income constraints
20
This is true irrespective of whether the family has only one child or more children.
21
We differ from Bhalotra et al. (2016) in the other ways: they use data from the 1999 REDS, while we use the
2006 REDS. They define dowry as the gross value of gifts from the bride’s side to the groom’s side, whereas we use
net dowry.
13limit poor parents’ ability to save for future dowry.
5.2 Father’s Labor Supply
Future dowry expenditure also causes FG fathers to work more relative to FB fathers; the latter
do not exhibit a significant change after the birth of their first child (column (1) in Table 8).
The triple-interaction coefficient translates into a 2.33 percent increase in FG fathers’ days worked
relative to the average days worked by FB fathers (= 156.30). Note that, when expected dowry is
zero, FG fathers do not work more than FB fathers. These results suggest that parents attempt
to finance the higher savings through higher earnings. As before, the increase in father’s labor
supply is larger for above poverty line households as compared to BPL families for whom the effect
is insignificant.
6 Other Robustness Checks
We perform a battery of additional robustness checks that include using two alternative definitions
of expected dowry, replacing net dowry with two separate gross marriage payment variables, and
treatment of missing observations and outliers. Our findings remain the same.
6.1 Alternate Definitions of Expected Dowry
We use two alternate definitions of expected dowry to test the sensitivity of our results. First, we
reconstruct the expected dowry variable by incorporating both religion and caste (column (1) of
Table A.2). Specifically, we split Hindus by caste and use other religions as it is (i.e., our seven
groups are: Hindu SCs, Hindu STs, Hindu OBCs, Hindu OCs, Muslims, Sikhs, Other religions)
and then separately define expected dowry for these groups (while using state and year of birth
as before).22 Second, instead of using the average of net dowries paid in marriages that occurred
during the year of the child’s birth (YOB) or the prior four years, in column (2) of Table A.2 we
use the average of net dowries paid around the YOB of the child (i.e., during Y OB + 2, Y OB +
1, Y OB, Y OB − 1, Y OB − 2). In both columns, the interaction coefficient remains positive and
significant. In ongoing work, we also explore how other moments of dowry, such as its variance,
affect savings.
6.2 Missing Observations
In REDS 2006, we observe 40,623 marriages for which the year of marriage is available and is during
1960-2008.23 In the analysis so far, we have excluded marriages where data on both gifts given and
received is missing (1,079 observations). Among the rest, while 18,275 (46 percent) observations
have information on both gifts, the remaining 21,269 (54 percent) have one of them missing. In the
latter case, when only one of the two is missing, we have calculated net dowry by assuming that the
22
Hinduism is the majority religion in India, and although other religions also exhibit caste, our sample size prevents
us from splitting non-Hindus into further groupings by caste.
23
Our data also reports several marriages that took place before 1960, but due to the lack of CPI data for pre-1960
years, we omit them from our analysis.
14missing value equals zero. In doing so (i.e., by replacing missing data with zeros), we are primarily
underestimating gifts from the groom’s side, and in turn overestimating net dowry, since in 95
percent of the cases where one of the gifts is missing, the missing data is for gifts from the groom’s
side. Therefore, we test if our findings are driven by our treatment of missing data.24 Reassuringly,
our results remain the same if we construct expected dowry only using marriages where both gifts
are non-missing (see column (2) of Table A.2).
6.3 Expected Gross Marriage Payments
Several economists have modeled dowry as net dowry following Becker (1981). Anthropologists,
on the contrary, define dowry as the gross assets brought by the bride to the groom’s family at
the time of marriage. Edlund (2006) has argued that net dowry is likely to overstate the relative
contribution of the bride’s family to the groom’s family due to marriage market factors, especially
among wealthier families, if dowries also comprise pre-mortem bequest to daughters. The only
evidence on the relative importance of the bequest motive of dowries, that we are aware of, comes
from Arunachalam and Logan (2016) who find that, in Bangladesh, bequest dowries have declined
in prevalence and amount over time. Since the majority of Indian states did not equalize inheritance
rights between sons and daughters until as recently as 2005, bequest may, however, be a crucial
component of Indian dowries during our sample period.
We check how replacing net dowry with its two component variables, i.e., gross payments by the
bride’s and the groom’s family in specification (1) alters the impact on savings. Since payments by
the groom are much smaller than those by the bride, we do not expect this to matter. Table A.3
confirms our intuition. The coefficient of Firstborn girl * Expected gross payment by bride continues
to be positive and significant, albeit is slightly larger in magnitude than the coefficient of Firstborn
girl * Expected net dowry in Table 2.
7 Conclusion
Marriage payments have the potential to affect the wealth distribution across generations and
families. Although recent work, e.g., Ashraf et al. (2016), has begun to examine these issues in the
context of brideprice, similar empirical investigations of the welfare consequences of dowry have
been hampered by the lack of data. We attempt to fill this gap. Using nationally representative
data from rural India, we document dowry trends in contemporary India and then estimate its
causal impact on savings, father’s labor supply, fertility, sex ratio, and expenditure on children’s
education. Our results so far imply that parents of daughters respond to expected lump-sum dowry
expenditure in the future by saving more in advance and fathers work more to finance the savings.
However, our study is entirely based on rural data, and the findings may not apply to urban India.25
24
We discuss missing observations in more detail in Appendix Section B.
25
Although we show that the cross-sectional patterns in dowry amounts in rural India are similar to those in urban
India but the average levels are higher in the latter.
15References
Alfano, M. (2015): “Daughters, Dowries, Deliveries: The Effect of Marital Payments on Fertility
Choices in India,” CReAM Discussion Paper.
Ambrus, A., E. Field, and M. Torero (2010): “Muslim Family Law, Prenuptial Agreements,
and the Emergence of Dowry in Bangladesh,” Quarterly Journal of Economics, 125, 1349–1397.
Anderson, S. (2003): “Why Dowry Payments Declined with Modernization in Europe but Are
Rising in India,” Journal of Political Economy, 111, 269–310.
——— (2007a): “The Economics of Dowry and Brideprice,” Journal of Economic Perspectives, 21,
151–174.
——— (2007b): “Why the Marriage Squeeze Cannot cause Dowry Inflation,” Journal of Economic
Theory, 137, 140–152.
Anderson, S. and C. Bidner (2015): “Property Rights over Marital Transfers,” The Quarterly
Journal of Economics.
Anukriti, S., S. Bhalotra, and H. Tam (2016): “On the Quantity and Quality of Girls: New
Evidence on Abortion, Fertility, and Parental Investments,” IZA Discussion Paper.
Arunachalam, R. and T. D. Logan (2016): “On the Heterogeneity of Dowry Motives,” Journal
of Population Economics, 29, 135–166.
Arunachalam, R. and S. Naidu (2015): “Price of Fertility: Marriage Markets and Family
Planning in Bangladesh,” Working Paper.
Ashraf, N., N. Bau, and A. Voena (2016): “Bride Price and Female Education,” NBER
Working Paper.
Banerjee, A., E. Duflo, M. Ghatak, and J. Lafortune (2013): “Marry for What? Caste
and Mate Selection in Modern India,” American Economic Journal: Microeconomics, 5, 33–72.
Becker, G. (1981): “A Treatise on the Family,” Harvard University Press.
Bhalotra, S., A. Chakravarty, and S. Gulesci (2016): “The Price of Gold: Dowry and
Death in India,” IZA Discussion Paper 9679.
Bhalotra, S. and T. Cochrane (2010): “Where Have All the Young Girls Gone? Identification
of Sex Selection in India,” IZA Discussion Paper No. 5381.
Bloch, F. and V. Rao (2002): “Terror as a Bargaining Instrument: A Case Study of Dowry
Violence in Rural India,” American Economic Review, 92, 1029–1043.
Botticini, M. and A. Siow (2003): “Why Dowries?” American Economic Review, 93, 1385–1398.
Campbell, J. Y. (1987): “Does Saving Anticipate Declining Labor Income? An Alternative Test
of the Permanent Income Hypothesis,” Econometrica, 55, 1249–73.
Chakraborty, T. (2015): “Impact of Industrialization on Relative Female Survival: Evidence
from Trade Policies,” World Development, 74, 158–170.
Chiplunkar, G. and J. Weaver (2017): “Marriage Markets and the Rise of Dowry in India,”
Working Paper.
Das Gupta, M. and P. Bhat (1997): “Fertility Decline and Increased Manifestation of Sex Bias
in India,” Population Studies, 51, 307–315.
Deolalikar, A. and E. Rose (1998): “Gender and Savings in Rural India,” Journal of Population
Economics, 11, 453–470.
16Edlund, L. (2006): “The Price of Marriage: Net vs. Gross Flows and the South Asian Dowry
Debate,” Journal of European Economic Association, 4, 542–551.
Franco, M. and R. H. Brumberg (1954): “Utility Analysis and the Consumption Function:
An Interpretation of Cross-Section Data,” In Post-Keynesians Economics, ed. K Kurihara. New
Brunswick: Rutgers University Press, 388–436.
Friedman, M. (1957): “A Theory of the Consumption Function,” Princeton, NJ: Princeton Uni-
versity Press.
Horioka, C. Y. and A. Terada-Hagiwara (2016): “The Impact of Pre-marital Sex Ratios on
Household Saving in Two Asian Countries: The Competitive Saving Motive Revisited,” NBER
Working Paper.
Jappelli, T. and L. Pistaferri (2010): “The Consumption Response to Income Changes,”
Annual Review of Economics, 2, 479–506.
Logan, T. D. and R. Arunachalam (2014): “Is there Dowry Inflation in South Asia,” Historical
Methods, 47, 81–94.
Maertens, A. and A. Chari (2012): “Learning your Child’s Price: Evidence from Anticipated
Dowry Payments in Rural India,” .
Milazzo, A. (2017): “Why Are Adult Women Missing? Son Preference and Maternal Survival in
India,” Working Paper.
Morduch, J. (1995): “Income Smoothing and Consumption Smoothing,” Journal of Economic
Perspectives, 9, 103–114.
Rao, V. (1993): “The Rising Price of Husbands: A Hedonic Analysis of Dowry Increases in Rural
India,” Journal of Political Economy, 101, 666–77.
Rose, E. (2000): “Gender Bias, Credit Constraints and Time Allocation in Rural India,” Economic
Journal, 110, 738–758.
Rosenblum, D. (2013): “The effect of fertility decisions on excess female mortality in India,”
Journal of Population Economics, 26, 147–180.
Roy, S. (2015): “Empowering Women? Inheritance Rights, Female Education and Dowry Pay-
ments in India,” Journal of Development Economics, 114, 233–251.
Visaria, L. (2005): “Female Deficit in India: Role of Prevention of Sex Selective Abortion Act,”
mimeo.
Wei, S.-J. and X. Zhang (2011): “The Competitive Saving Motive: Evidence from Rising Sex
Ratios and Savings Rates in China,” Journal of Political Economy, 119, 511–564.
8 Variable Definitions
1. Dowry
The dowry variables are constructed based on the retrospective information on the nominal
value of gifts received or given at the time of marriage for marriages during 1960 and 2009.
Real net dowry paid by bride’s family: "Gifts paid by bride’s family" − "Gifts paid by groom’s
family"
17You can also read