Corporate Presentation - February 2020 Canadian Natural - Canadian Natural Resources
←
→
Page content transcription
If your browser does not render page correctly, please read the page content below
Premium Value.
Leading Free Cash Flow.
                           Corporate
Independent.              Presentation
Canadian Natural.
                           February 2020
Delivering Value & Growth
SNAPSHOT                                                                     2018                      2019F                 2020B
Capital expenditures – net                    (C$ million)(1)             $4,731                      $3,800                $4,050

Annualized dividend (C$/share)(2)                                           $1.34                          $1.50

Production        (annual average, before royalties)

   Crude Oil (Mbbl/d)                                                          821               839 - 888             910 - 970

   Natural gas (MMcf/d)                                                     1,548          1,485 - 1,545           1,360 - 1,420

   BOE (MBOE/d)                                                             1,079          1,087 - 1,146           1,137 - 1,207

Company Gross Reserves, before royalties, of crude oil and natural gas
(as at December 31, 2018)(3)

   Proved crude oil and NGLs (MMbbl)                                        8,784

   Proved natural gas (Bcf)                                                 6,652

   Proved BOE (MMBOE)                                                       9,893

   Proved and probable BOE (MMBOE)                                        13,382
   (1) 2019F excludes costs related to the Devon Canada asset acquisition which closed on June 27, 2019.
   (2) 2019F and 2020B based on current quarterly dividend of $0.375 per common share.
   (3) Excludes Devon Canada asset acquisition, which closed on June 27, 2019.
   Note: See Advisory for pricing assumptions and cautionary statements.

   TABLE OF CONTENTS
   • Industry Leading Free Cash Flow                                                                               Page 4
   • Robust, Economic Long Life Low Decline Assets                                                                 Page 8
   • Increasing, Sustainable Returns to Shareholders with Significant Upside                                       Page 11
   • Asset Overview                                                                                                Page 13
   • Marketing                                                                                                     Page 22
   • Balance Sheet Strength                                                                                        Page 24
   • Long Term Sustainability                                                                                      Page 25
Corporate Presentation February 2020
The Canadian Natural Advantage
Delivering in Today’s Environment
Industry Leading Free Cash Flow
Capital Discipline and Operational Excellence
Robust, Economic, Long Life Low Decline Assets
Increasing, Sustainable Returns to Shareholders with Significant Upside
LEADING FREE CASH FLOW 2
Canadian Natural
Large, Long Life Low Decline asset base
UNIQUE Effective and efficient operations
o Area knowledge
o Extensive infrastructure ownership
o Operatorship of core areas
SUSTAINABLE o Environmentally and socially responsible operations
Defined growth / value enhancement plans by product and basin
Flexible capital allocation to maximize value
ROBUST Strong Balance Sheet supports investment grade credit ratings
Opportunistic acquisitions
LEADING FREE CASH FLOW 3
1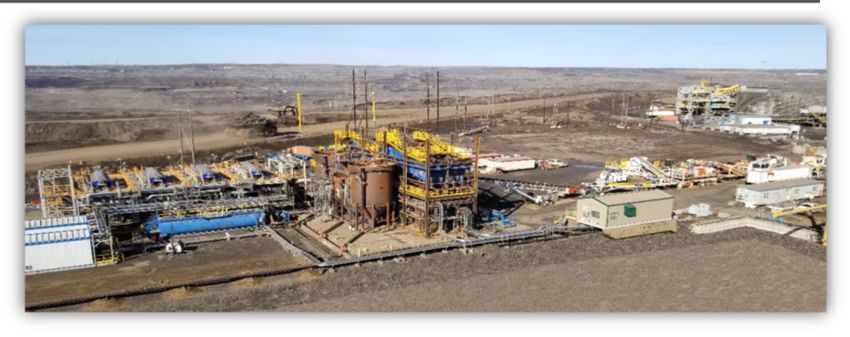
Corporate Presentation                                                                                                                                            February 2020

        Balanced, Diverse Portfolio

                                                                                           •   Balanced, diverse production mix
                                                                                           •   International exposure
        North America             North Sea
                                                                                           •   Vast, balanced resource base to develop
                                                                                           •   Growing, sustainable adjusted funds flow
                                                                                           •   ~48% light crude oil and SCO production
                                        Offshore
                                            Africa
                                                                                                            2020 Budget*
                                                                         BOE Production Mix                                       Liquids Production Mix
                                                               Natural Gas                                                                                       Conventional &
                                                                     ~20%                                 Oil Sands                                              Unconventional
                                                                                                          Mining & Upgrading                                     ~23%
                                                                                                          (SCO) ~36%

                                                                                                                          Long Life
                                                                                                                        Low Decline
                                                                    Heavy                                                    ~77%
                                                                  Crude Oil
                                                                     ~32%                          Light Crude
                  *Based upon mid-point of 2020B production guidance.                              Oil & NGLs ~12%

                                                     BALANCED PRODUCT MIX PROVIDES FLEXIBILITY                                                                              4

        2019F Production per Share Growth
        Top 15 Companies
                           66%
               (%)
               20%                                                                                         6 of 14 peers delivered:
                                                                                                           > 7% production per share growth
               15%

               10%
                                                                                                                      Group Average

                 5%

                 0%

                -5%

             -10%

             -15%

             -20%

                  Peers include: APA, CHK, COP, CVE, CVX, DVN, ECA, EOG, HSE, IMO, NBL, OXY, SU and XOM.
                  Note: Production per share growth based upon Q1/19 to Q4/19F. Q4/19F production based upon Bloomberg consensus data as at November 13, 2019.
                  Deliverable of ~7% based upon approximate group average.

                                                       TOP TIER PRODUCTION PER SHARE GROWTH                                                                                 5

                                                                                               2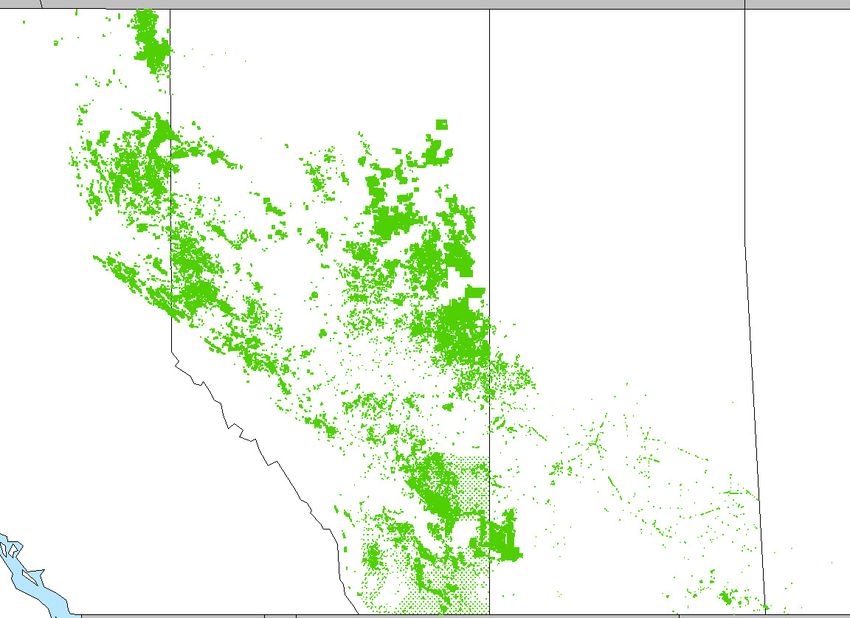
Corporate Presentation                                                                                                                                                 February 2020

        2020F Free Cash Flow Yield
        Top 15 Companies
           (%)
           20%
           18%                                                                                          3 of 14 peers delivered:
           16%                                                                                          > 7.5% free cash flow yield; &
           14%
                                                                                                        > 7% production per share growth

           12%
           10%
             8%                                                                                                   Group Average

             6%
             4%
             2%
             0%

             Peers include: APA, CHK, COP, CVE, CVX, DVN, ECA, EOG, HSE, IMO, NBL, OXY, SU and XOM. CHK shown as zero due to share price change.
             Source: Goldman Sachs Energy Comp – November 11, 2019. Deliverable of ~7.5% based upon approximate group average.

                                                             TOP TIER FREE CASH FLOW YIELD                                                                                         6

        Share Repurchases – Trailing 12 Months
        Top 15 Companies

         ($ million)
         $6,000

                                                                                                        2 of 14 peers delivered:
         $5,000
                                                                                                        > $1.2 billion share repurchase;
                                                                                                        > 7.5% free cash flow yield; &
         $4,000                                                                                         > 7% production per share growth

         $3,000

         $2,000
                                                                                                                   Group Average
         $1,000

             $0

             Peers include: APA, CHK, COP, CVE, CVX, DVN, ECA, EOG, HSE, IMO, NBL, OXY, SU and XOM.
             Source: Bloomberg data as at November 13, 2019. Deliverable of C$1.2 billion based upon approximate group average. Data based upon reported Q4/18 to Q3/19 repurchases.

                                                            BALANCED SHARE REPURCHASES                                                                                             7

                                                                                          3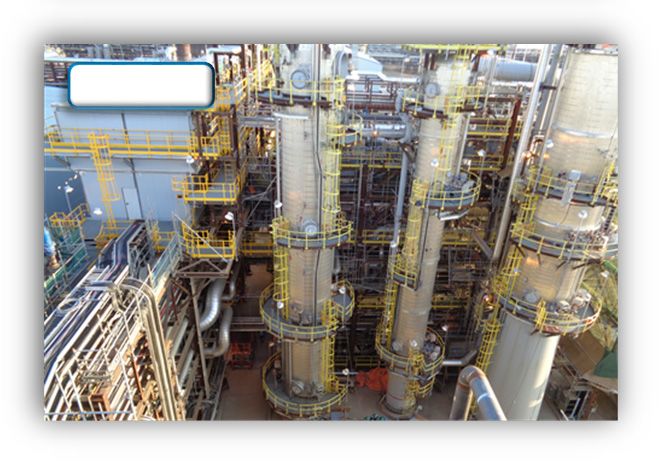
Corporate Presentation                                                                                                                                               February 2020

        Dividend Growth – 10 Year CAGR
        Top 15 Companies
           (%)                                                                                            Canadian Natural and only
           20%                                                                                            1 of 14 peers delivered:
                                                                                                          > 10% 10 year CAGR dividend;
           15%                                                                                            > $1.2 billion share repurchase;
                                                                         Group Average                    > 7.5% free cash flow yield; &
           10%                                                                                            > 7% production per share growth

            5%

            0%

           -5%

          -10%

          -15%
                                                                                                                                                (23%)    (100%)

            Peers include: APA, CHK, COP, CVE, CVX, DVN, ECA, EOG, HSE, IMO, NBL, OXY, SU and XOM.
            Source: 10 year CAGR based upon 2010 to current 2019 quarterly dividend annualized. Bloomberg data as at November 13, 2019. Deliverable of ~10% based upon
            approximate group average of Companies with positive growth.

                                                      INDUSTRY LEADING DIVIDEND GROWTH                                                                                    8

                                                                      Industry Leading
                                                                       Free Cash Flow

                                                                                        4
Corporate Presentation February 2020
Balance & Optimize the Four Pillars of Capital Allocation
Maximizing
Shareholder Value
Balance Resource
Returns to Opportunistic
Sheet Value
Shareholders Acquisitions
Strength Growth
FLEXIBLE CAPITAL ALLOCATION MAXIMIZES SHAREHOLDER VALUE 10
2019 Track Record
What CNQ Delivered on our Four Pillars
• Returns to Shareholders
‒ Distributed ~$2.7 billion to shareholders in 2019
~$941 million of common shares repurchased in 2019
Increased quarterly dividend 12% over 2018 levels ~$1.7 billion annualized
• Balance Sheet Strength
‒ ~$2.3 billion debt retired(1)
‒ Debt : EBITDA (2.0x ~1.9x)(2)
‒ Debt : Book Capital (39% ~38%)(2)
• Resource Value Growth
‒ Maintained disciplined capital budget $3.8 billion(3)
‒ 2019 entry to 2019 exit BOE production growth ~13% (~15% per share)(4)
• Opportunistic Acquisitions
‒ Execution on significant value adding acquisition
(1) Includes public debt retirement of C$1 billion and ~C$1.3 billion retirement of non-revolving term loan.
(2) December 31, 2018 to forecasted year ending 2019 debt metrics, including major acquisition.
(3) Excludes acquisition costs.
(4) 2019 entry to exit production growth calculated as average targeted Q4/19 production versus average Q1/19 actual production. Q4/19 targeted production reflects Government
of Alberta curtailment at November announced levels.
UNEQUALLED ABILITY TO DELIVER ON OUR FOUR PILLARS 11
5
Corporate Presentation February 2020
Canadian Natural
2020 Execution Priorities
• Disciplined capital budget focused on free cash flow generation
• Margin Growth and Asset Development
‒ Thermal in situ and Oil Sands Mining & Upgrading capture synergies
‒ Progress projects that add production/value in 2020 and beyond
Aligned with increased market access
• Adhere to free cash flow allocation policy
‒ Increasing returns to shareholders
‒ Continue to strengthen the Balance Sheet
• Enhance capital flexibility
‒ ~$1,565 million Conventional & Unconventional assets
‒ ~$2,485 million Long Life Low Decline assets
SAFE, SUSTAINABLE, EFFECTIVE & EFFICIENT OPERATIONS 12
Canadian Natural
2020 Budget
2020 Capital Budget ($ million) 2019F 2020B
Total(1) $3,800 $4,050
Targeted Production 2019F 2020B % Change(2)
Natural Gas (MMcf/d) 1,485 - 1,545 1,360 - 1,420 (8%)
Total Liquids (Mbbl/d)(3) 839 - 888 910 - 970 9%
Total MBOE/d 1,087 - 1,146 1,137 - 1,207 5%
(1) 2019F excludes asset acquisition costs.
(2) Percent change of 2020B midpoint over 2019F midpoint.
(3) Reflects planned downtime for turnaround activities and Canadian Natural’s 70% ownership in the AOSP.
Note: Rounded to the nearest 1,000 bbl/d. Numbers may not add due to rounding.
STRONG PRODUCTION PER SHARE GROWTH OF ~9% 13
6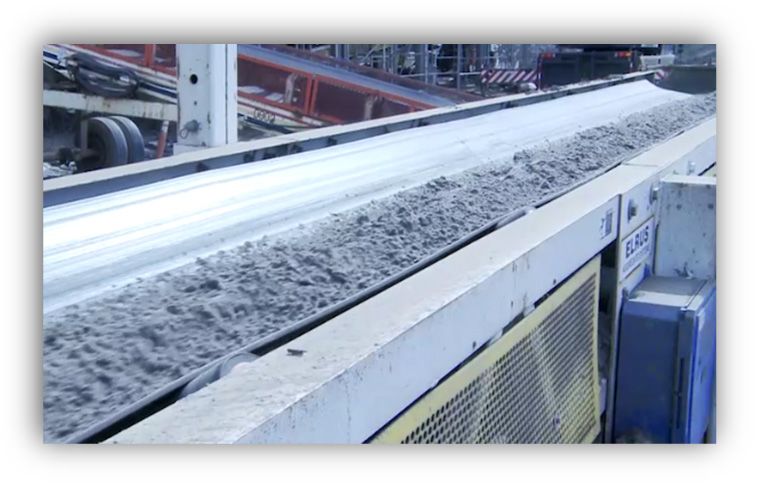
Corporate Presentation                                                                                                                                                       February 2020

        Canadian Natural
        Leading Free Cash Flow

                              ($ billion)
                              $9.0
                              $8.0
                              $7.0
                              $6.0
                              $5.0
                              $4.0
                              $3.0
                              $2.0
                              $1.0                                       Dividend                                      Dividend(1)                             Dividend(1)

                              $0.0
                                                           2018                                         2019F(2)                                      2020B
            Capital ($ billion)                             $4.7                                          $3.8                                         $4.05

                                                      Free Cash Flow                       +$5.00 WTI Incremental Free Cash Flow
              (1) Based upon current dividend.
              (2) Excludes acquisition costs.
              Note: Free cash flow represents adjusted funds flow less capital. See Advisory for cautionary statements, definitions and pricing assumptions.

                                                                   SUSTAINABLE FREE CASH FLOW                                                                                    14

        2020B Free Cash Flow Generation
        The Canadian Natural Opportunity

                                                                                                      ($ billion)
                                                                                                      $8.0

         Adjusted Funds Flow                           ~$10.5 billion                                 $7.0
         Less: Budgeted Capital                        ~$4.05 billion
         Less: Current Dividends*                       ~$1.7 billion
                                                                                                      $6.0

                            Free Cash Flow                                                            $5.0
                              ~$4.8 billion
                                                                                                      $4.0

                                                                                                      $3.0
          Balance Sheet                              Share
            Strength                              Repurchases
           ~$2.4 billion                          ~$2.4 billion
                                                                                                      $2.0

                                                                                                      $1.0
                                                                                                                     WTI +$2.50                 WTI +$5.00            WTI +$7.50

                                                                                                                                Free Cash Flow
              *Based upon 2019 dividends paid. Dividends have historically been reviewed in the first quarter of the year.      Incremental Free Cash Flow
              Note: See Advisory for cautionary statements, definitions and pricing assumptions.

                                                       SIGNIFICANT TORQUE TO COMMODITY PRICE                                                                                     15

                                                                                                7
Corporate Presentation                                                                                                                               February 2020

                                                                   Robust, Economic, Long Life
                                                                      Low Decline Assets

        Balanced Model – Production per Share Basis
        Price Impact on Production & Value
                                                                      • Assets deliver free cash flow in low              • Production per share
                                                                        price environment                                   grows at a higher rate
                                                                      • Free cash flow allocation policy results
                                                                        in share repurchases
                                                                      • Production per share continues to grow
                                        • Production per share
                                          grows at a higher rate

                                                                                                     Conventional & Unconventional Production
            Production per Share Rate

                                                Commodity Price
                                                                                                                                                     Commodity Price

                                                                                                               Long Life Low Decline Production

                                        Time

                                                           DELIVERS FREE CASH FLOW THROUGH THE CYCLE                                                                   17

                                                                                           8
Corporate Presentation February 2020
Canadian Natural’s Advantage
Low Corporate Decline Rate
BOE Production Mix Maintenance Capital of ~$3.7 billion required annually
Long Life
Oil Sands Mining Low Decline
& Upgrading Production ~62%
~0% Decline
Pelican &
Thermal ~10% Corporate
~13% Decline
Decline Rate
Conventional &
Unconventional
Conventional &
~19% Decline
Unconventional
Production ~38%
Note: Conventional & Unconventional assets include North America crude oil and NGLs, International crude oil and natural gas.
LONG LIFE LOW DECLINE ASSETS REDUCE MAINTENANCE CAPITAL REQUIREMENTS 18
Maintenance Capital
2019F
(US$/BOE)
$70 • Significantly lower maintenance capital
requirements
$60
‒ Strategic advantage of a Long Life Low
$50 ~75% lower than Decline asset base
the peer average
$40 ‒ Production of over 1,150,000 BOE/d
maintained with investment of ~US$6/BOE
$30
Peer Average
$20
• Allows for flexible project planning
$10 • Delivers safe, predictable and sustainable
free cash flow
CNQ
CNQ
$0 2019F 2020B
Peers Integrated Peers
Peers include: APA, DVN, EOG, HSE, IMO, NBL, MRO, SU.
Note: US Peers are 2019 estimates and include only D&C capital. Integrated Peers and Canadian Natural includes all maintenance capital costs.
Source: Barclays Research (No Treble, All “Base” Declines) and Company Reports.
TOP TIER CAPITAL EFFICIENCY 19
9Corporate Presentation February 2020
1P Reserves After Royalties
2018
(MMBOE) ~84% of reserves are Long Life Low Decline
9,000
Reserve Life Index ~24 years*
8,000
7,000
6,000
5,000
CNQ
4,000
3,000
2,000
1,000
0
Long Life Low Decline Integrated Peers Peers
*Reserve Life Index based upon 2018 Net Proved reserves, constant dollar over 2018 average net production. Excludes recently closed acquisition.
Peers include: APA, APC, CVE, CHK, DVN, ECA, EOG, HSE, IMO, NBL, OXY, SU.
Source: 2018 Net Proved reserves, constant dollar, per company reports.
MASSIVE LOW COST RESOURCE TO DEVELOP 20
The Canadian Natural Advantage
Production Growth Free Cash Flow
(MBOE/d) Potential ($ billion) Margin Growth ($ billion) Generation
3,000 $1.6 $9
$1.4 $8
2,500
$7
$1.2
2,000 $6
$1.0
$5
1,500 $0.8
$4
$0.6
1,000 $3
$0.4
$2
500
$0.2 $1 Dividend Dividend
Dividend
0 $0.0 $0
2018 2019F 2020B
Current Production (Q3/19) 2019 Captured Free Cash Flow
Future Potential Targeted Future Potential +$5.00 WTI Incremental Free Cash Flow
Note: See Advisory for cautionary statements, definitions, and pricing assumptions.
LEADING FREE CASH FLOW GENERATION 21
10Corporate Presentation February 2020
Increasing, Sustainable Returns
to Shareholders with
Significant Upside
Canadian Natural
Returns to Shareholders
• Disciplined allocation of capital delivers
($ million)
8,000 sustainable dividend policy
7,000 ~$10.8 billion returned ‒ 19 consecutive years of dividend increases
to shareholders
6,000 2014 - 2019 12% increase over 2018 levels in March 2019 to
quarterly dividend per common share
5,000
$1.50 per common share annualized
4,000
3,000 • ~$3.2 billion in share repurchases and
distributions*
2,000
1,000 ‒ 2018 share repurchases totalled ~30.9 million
shares for an aggregate total of ~$1.3 billion
0
Dividends Share Purchases & ‒ 2019 share repurchases totalled ~25.9 million
Distribution shares for an aggregate total ~$940 million
2014 - 2019*
*Includes PrairieSky distribution and shares repurchased from January 1, 2014 to December 31, 2019.
~22% OF CURRENT MARKET CAP RETURNED TO SHAREHOLDERS (2014 - 2019) 23
11Corporate Presentation February 2020
Canadian Natural
Returns to Shareholders
($ million)
3,000
2,500 19 years of dividend increases
~21% CAGR since inception
2,000
Horizon
Phase 3
complete
1,500
1,000
500 Horizon Phase 1 build years
0
2005 2006 2007 2008 2009 2010 2011 2012 2013 2014 2015 2016 2017 2018 2019
Dividend Share Purchase PSK Distribution
*2019 share repurchases are as at December 31, 2019.
Note: Based upon annualized dividends declared.
HISTORY OF GROWING RETURNS TO SHAREHOLDERS 24
Canadian Natural
Unique, Sustainable & Robust Dividend Growth
• Only 9 out of TSX60 companies across all sectors in Canada have increased dividends for
19 or more consecutive years
• Canadian Natural is the only crude oil and natural gas E&P company in this group
(CAGR)
24% Non-Energy Company
20% Energy Infrastructure Company
Integrated Peer
16%
Average
12%
8%
4%
0%
TSX60 Companies with 19 years or more consecutive dividend increases
Note: Energy related companies include: ENB, IMO and TRP. Non-energy companies include; CCL, CNR, FTS, SAP and MRU, all data sourced from Bloomberg & company
reports. Excludes special dividends declared.
LEADING, CANADIAN DIVIDEND GROWTH 25
12Corporate Presentation February 2020
Canadian Natural
World Class Dividend Growth
(CAGR)
25% • Returns via dividends are unique, robust
and sustainable
20%
• Strong track record displays commitment
15% to dividend growth
10% • Canadian Natural increased dividend for
19 consecutive years
5%
‒ Only 2 of 6 supermajors with similar record
0%
CNQ Supermajor
Average
CAGR 19 year CAGR 10 year CAGR 5 year
Note: Peers include BP, CVX, ENI, RDS, TOT and XOM. Data sourced from Bloomberg & company reports. Excludes special dividends declared.
WORLD CLASS TRACK RECORD 26
Asset Overview
13Corporate Presentation February 2020
Conventional & Unconventional
Natural Gas, Light Crude Oil & NGLs Core Area Summary
• Largest natural gas producer in Canada
‒ Q3/19 ~1,425 MMcf/d
BC AB SK MB ‒ 2P reserves 9.6 Tcf(1)
• Significant light crude oil and NGL
production base in Canada
‒ Q3/19 ~96,100 bbl/d
‒ 2P reserves 665 million barrels(1)
• High return international light crude oil
‒ Q3/19 ~48,700 bbl/d
‒ 2P reserves 307 million barrels(1)
CNQ Land Base Operating free cash flow
(2)
~$1.1 billion in 2019F
(1) Company Gross proved plus probable reserves at December 31, 2018.
(2) See Advisory for cautionary statements, definitions and pricing assumptions.
TOP TIER ASSET BASE 28
Natural Gas, Light Crude Oil & NGLs
Montney
• Large inventory of defined drilling opportunities
• Large contiguous land holdings
Umbach BC AB
West Nig
‒ ~1.0 million net acres
Graham Septimus • Liquids Enhancement & Gas Storage (LEGS)
Pilot
Stoddart
Greater ‒ Septimus Pilot
Septimus Wembley
Pilot
Recovery within forecast range
Greater Wembley
Injectivity/productivity suitable for gas storage
Elmworth
Gold Creek Supports potential for incremental liquids
Kakwa
‒ Next steps
Smoky Septimus 2nd and 3rd cycles 2019 / Q1/20*
Lean Gas (Corporate Presentation February 2020
Technology & Innovation
Liquids Enhancement & Gas Storage (LEGS)
600
1.3x-1.7x
500 Increased liquids
rates/reserves
400 from existing
Enhanced Liquids Recovery
assets Increased
1.0x ~30% to 70%
300 margins &
long-term
Primary Liquids Recovery
200 value
Price cycle
optimization
Production
100
0
Time
2016 2017 2018F 2019F 2020F 2021F
Source: Society of Petroleum Engineers paper SPE-189816-MS presented March 13, 2018.
RESOURCE POTENTIAL ~100 MILLION BARRELS 30
International Light Crude Oil
• Maximizing value through:
‒ Leveraging offshore expertise in Aberdeen
North Sea
‒ Capturing low risk development opportunities
‒ Effective and efficient operations
~46% reduction in operating costs since 2015
‒ Leveraging technology and innovation
Top tier drilling performance
Côte d’Ivoire
Generating ~$580 million of
operating free cash flow in 2019F*
South Africa
*See Advisory for cautionary statements, definitions and pricing assumptions.
MAXIMIZING FREE CASH FLOW GENERATION THROUGH EFFICIENCIES 31
15Corporate Presentation February 2020
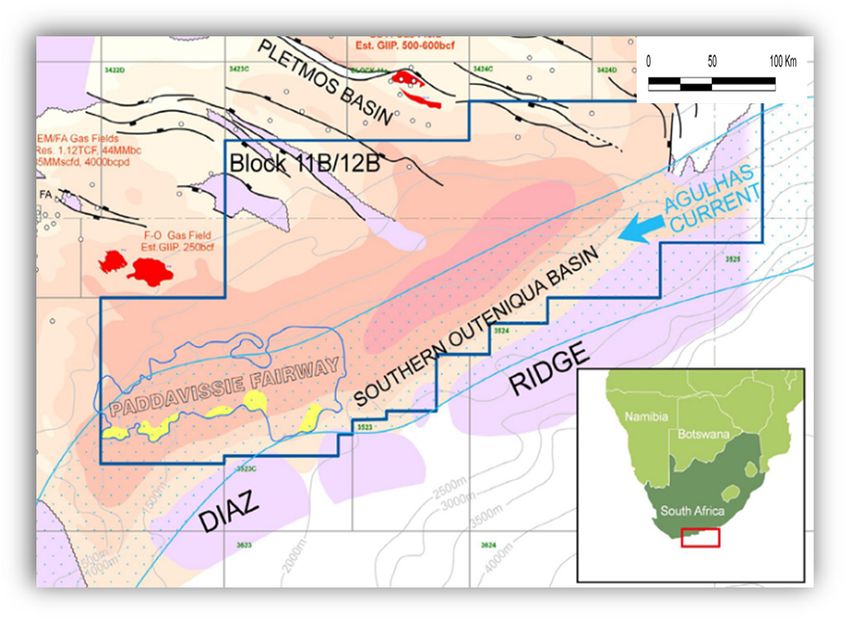
International
South Africa
• Significant gas condensate discovery
in Q1/19
0 10 20 40km
‒ 5 structures identified with
significant potential
• 20% working interest
‒ Upfront cash consideration and
financial carry
‒ Future bonus payments on commercial
development
• Next steps
Brulpadda Proposed ‒ 2D and 3D seismic targeted for Q4/19 and 2020
1AX well LUI-1X
location location ‒ Exploration well targeted for first half of 2020
‒ Potential for an additional exploration well in
2020 contingent on results
LOW CAPITAL EXPOSURE TO SIGNIFICANT EXPLORATION OPPORTUNITY 32
Conventional & Unconventional
Heavy Crude Oil Core Area Summary
~500 km
• Largest primary heavy crude oil producer
Cliffdale in Canada
Pelican Lake
‒ Deep inventory of tradional CHOPS, multilateral and
fishbone opportunities
AB SK ‒ Q3/19 production ~88,000 bbl/d
Smith
• Industry leading polymer flood at Pelican Lake
‒ Long Life Low Decline asset ~20 year reserve life
‒ Q3/19 production ~60,000 bbl/d
• 2P reserves 697 million barrels(1)
CNQ Land Base
CNQ Heavy Crude Oil
Producing Properties Operating free cash flow
Acquired Lands
Bonnyville &
Acquired Crude Oil
Lloydminster area
~$1.1 billion in 2019F(2)
Producing Properties
(1) Company Gross proved plus probable reserves at December 31, 2018.
(2) See Advisory for cautionary statements, definitions and pricing assumptions.
VAST LAND BASE & OWNED INFRASTRUCTURE MAXIMIZES VALUE 33
16Corporate Presentation February 2020
Thermal In Situ Oil Sands
Asset Overview
CNQ Thermal Producing Properties
CNQ In Situ Project Inventory
Birch Mtn. • Long Life Low Decline assets
Peers
Ells River
‒ 2P reserves 3.06 billion barrels(1)
• Facility capacity of ~340,000 bbl/d(2)
Liege
‒ Q3/19 production of ~206,400 bbl/d
Gregoire • 100% working interest and operatorship on
developed properties
Pelican
• Leverage use of technology to enhance
Leismer
recovery and optimize costs
‒ Expertise in Cyclic Steam Stimulation (CSS), Steam
Peace River Assisted Gravity Drainage (SAGD), Steam Flood
Jackfish
Grouse and solvents
Pike
Kirby
Operating free cash flow
(3)
~$1.1 billion in 2019F
Lindbergh
Primrose
(1) Company Gross proved plus probable reserves as at December 31, 2018. Excludes recently closed
Wolf Lake Marie asset acquisition.
Lake
(2) Includes Jackfish, Kirby & Primrose/Wolf Lake facility capacities.
(3) See Advisory for cautionary statements, definitions and pricing assumptions.
GREAT ASSETS + TECHNOLOGY + INNOVATION = VALUE CREATION 34
Thermal In Situ Oil Sands
Primrose / Wolf Lake Overview
• Total facility capacity ~140,000 bbl/d
‒ Q3/19 production of ~73,700 bbl/d
• Leverage unutilized facility capacity of
Primrose North ~60,000 bbl/d
Primrose East
‒ Average capital efficiency of ~$10,000/bbl/d
‒ Average CSS production of ~400 bbl/d per well(1)
Primrose South
• ~307 net sections of undeveloped land with
decades of highly economic pad additions(2)
Wolf Lake ‒ High rate and recovery in early life of CSS
Approved Project Areas
Approved Development Areas ‒ ~2,000 locations(2)
Drilled Development Pads
Future Approved Pads • Steam Flood as a follow up to CSS increases
Future Pads
Facilities
recovery factor by ~20%
• Solvent technology upside
(1) First 12 month production average.
(2) At US$50/bbl WTI and 22% WCS differential.
LEVERAGE INFRASTRUCTURE TO ADD LOW COST, LOW DECLINE BARRELS 35
17Corporate Presentation February 2020
Thermal In Situ Oil Sands
Kirby / Jackfish SAGD Overview
• Total facility capacity of ~200,000 bbl/d(1)
‒ Q3/19 production of ~129,000 bbl/d
Kirby Jackfish
North ‒ Kirby North ~40,000 bbl/d in early 2021
• Highly economic pad development to utilize
facility capacity
‒ Adding ~21,000 bbl/d at Jackfish for ~$8 million(2)
Pike(3) ‒ Future pad adds capital efficiency ~$8,500/bbl/d
• Consolidated land base with ~367 net sections
Kirby
South of undeveloped land
‒ Over 20 years of development opportunities
Approved Project Areas
Approved Development Areas
• Economies of scale
Drilled Development Pads ‒ Synergies drive lower operating costs
Future Approved Pads
Future Pads ‒ Leverage operating and technical expertise across
Facilities
operations
(1) Includes Jackfish, Kirby South and Kirby North facilities.
(2) Targeted completion and tie in costs. • Solvent technology upside
(3) CNQ 50% working interest.
LONG LIFE LOW DECLINE SAGD LAND BASE 36
Thermal In Situ Oil Sands
Applying Technology & Innovation to Increase Margins
Steam to Oil Ratio (SOR) • Reservoir enhancements to reduce SOR by ~10%
‒ Improved steam conformance and well design
~10%
• Using solvents to potentially reduce SOR by ~50%
‒ ~$1.00/bbl operating cost savings
‒ Targets to reduce GHG emissions intensity by ~50%
~50%
‒ Potential production capability increase of ~85%
• Emerging new technologies
‒ Electromagnetic heating
‒ Lower cost water recycling and steam generation technology
~$3.6 billion in margin growth potential(1)
Current Improved Solvents Future
~$128 million in annual savings on
SOR Reservoir SOR current and future operations(2)
Efficiencies
(1) Assumes improvements captured over Company’s remaining total proved plus probable reserves, undiscounted.
(2) At US$50/bbl WTI and 22% WCS differential.
APPLYING TECHNOLOGIES TO IMPROVE MARGINS 37
18Corporate Presentation February 2020
Oil Sands Mining & Upgrading
Overview
• Industry leading oil sands mine operator
• Q3/19 production of ~432,200 bbl/d of SCO
CNQ Operating Oil Sands Mines • No decline, reservoir risk or reserve replacement cost
CNQ Lands
‒ 2P reserves 7.03 billion barrels(1)
‒ 50+ year reserve life(2)
• Significant resource in place
‒ 17.5 billion barrels BIIP(3)
Horizon
• Significant economies of scale
AOSP
• Top tier operating costs, reliability and utilization
Operating free cash flow
~72 km
~$4.9 billion in 2019F(4)
Fort McMurray (1) Company Gross proved plus probable reserves as at December 31, 2018.
(2) Including future pit development.
(3) Discovered Bitumen Initially-in-Place (BIIP).
(4) See Advisory for cautionary statements, definitions and pricing assumptions.
LONG LIFE NO DECLINE ASSETS 38
Horizon Oil Sands
Operating Costs
($/bbl)
$45.00
$40.00
$35.00 ~50% reduction in
operating costs
$30.00
equates to
$25.00 ~$2.0 billion
in additional margin
$20.00 in 2019F
$15.00
$10.00
2013 2019 (1)
Cash Costs Fuel Costs(2)
(1) Reflects YTD 2019 operating costs as at September 30, 2019.
(2) Reflects natural gas costs used in operations.
Note: Operating costs reflect production downtime for turnarounds (unadjusted).
CONTINUOUS IMPROVEMENT MAXIMIZES VALUE 39
19Corporate Presentation February 2020
Oil Sands Mining & Upgrading
Plant Capacity Utilization
(%)
100%
90%
80%
70%
3 year 5 year
CNQ Peer Average
Note: Sourced from 2019 TD research, Mine your own Business reports.
Peers Include: IMO, SU, Syncrude and Shell (for 2014-2016 data).
CONTINUOUS IMPROVEMENT DRIVES HIGH SUSTAINABLE UTILIZATION 40
Horizon Oil Sands
Paraffinic Froth Treatment Expansion
• Incremental production target of 40,000 bbl/d - 50,000 bbl/d of bitumen
• Project utilizes excess capacity in extraction and OPP to produce diluted bitumen
‒ Utilize excess naphtha in SCO to dilute and transport product
‒ Potential for lean froth currently being tested in extraction
• Engineering and design specification work underway
• Favorable preliminary capital efficiencies
‒ Targeted total capital required of ~$1.4 billion
Potential operating cost savings of $0.50/bbl - $1.50/bbl
Targeting $55 million - $165 million in annual margin growth
HIGH QUALITY ECONOMIC PRODUCTION GROWTH 41
20Corporate Presentation February 2020
Horizon Oil Sands
Reliability Opportunities
• Reliability opportunities provide incremental economic production
‒ Incremental 35,000 bbl/d - 45,000 bbl/d of SCO
• Stage 1B – Reliability improvements on Diluent Recovery Unit
‒ Improves long term reliability
• Stage 2 – Increased reliability and productive capacity
‒ Increase capacity in process equipment and improve metallurgy
‒ Increase capacity in hydrotreaters and Diluent Recovery Unit
‒ Additional Sulphur Recovery Unit
Potential operating cost savings of $1.00/bbl - $2.00/bbl
Targeting $110 million - $220 million in annual margin growth
IMPROVED RELIABILITY & VALUE ENHANCEMENT 42
Oil Sands Mining & Upgrading Margin Enhancing Opportunity
In-Pit Extraction Process (IPEP)
• IPEP is a modular extraction plant that
separates bitumen in the mine pit
• Benefits
‒ Reduces GHG emissions by ~40%
‒ Eliminates tailings ponds, as it produces dry
stackable tailings IPEP Field Pilot at Horizon
‒ Significant potential reclamation savings
Targeted operating cost savings of
$2.00/bbl - $3.00/bbl
Example of dry tailings produced
ADVANCING TAILINGS MANAGEMENT TECHNOLOGIES 43
21Corporate Presentation February 2020
Marketing
Canadian Natural
Balanced Portfolio of Natural Gas Sales
2020B
Diversified sales points enhances margins by
~$230 million through 2019 & 2020
Canadian Exports
Natural 37%
Exports MMcf/d
Requirement
47% Dawn (Ontario) 160
Empress 190
AECO Emerson (Minnesota) 100
Sales 3%
13%
California 70
International
Note: Based upon midpoint of 2020B corporate natural gas guidance. Incremental margin based upon the difference in forecasted export pricing vs. forecasted AECO pricing.
DIVERSIFIED SALES POINTS DRIVE MARGIN GROWTH 45
22Corporate Presentation February 2020
Near-Term Crude Oil Outlook
Incremental Egress
Targeted
Capacity Timing
Enbridge Mainline Optimization ~100 Mbbl/d Today
Base Keystone Optimization ~50 Mbbl/d Q1/20
Express Optimization ~50 Mbbl/d Q1/20
NWR Refining ~40 Mbbl/d Q1/20
APMC Rail Contracts ~120 Mbbl/d Q4/19 - Q2/20
Estimated Incremental Industry Rail ~100 Mbbl/d Q4/19 - Q3/20
Total ~460 Mbbl/d
Incremental near-term takeaway capacity
TMX ~590 Mbbl/d
almost equivalent to a major export pipeline
Note: NWR incremental capacity as a result of ~80,000 bbl/d increase heavy crude oil; ~40,000 bbl/d decrease light crude oil.
EFFECTIVE TAKEAWAY OPPORTUNITY 46
Crude Oil Export Pipelines
PADD II
Enbridge Line 3 Superior, WI
~370,000 bbl/d in 2020*
Replacement Common Carrier
US Gulf Coast
Keystone XL ~830,000 bbl/d in 2022*
CNQ 200,000 bbl/d
Tidewater – West Ridge
Terminal & PADD V
Trans Mountain ~590,000 bbl/d mid-2022*
Expansion CNQ 94,000 bbl/d
*Based upon publically announced targeted timing.
INCREMENTAL WCSB EGRESS IS PROGRESSING 47
23Corporate Presentation February 2020
Balance Sheet
Strength
Canadian Natural
Robust Financial Position
Long-Term Ratings Outlook Short-Term Ratings
DBRS BBB High Stable n/a
Standard & Poor’s BBB+ Stable A-2
Moody’s Baa2 Stable P-2
• Target to exit 2019 with stronger debt metrics than 2018 year end
• Balance Sheet strengthens despite material accretive acquisition completed in 2019
• Debt to book capitalization at or below 38%
• Debt to adjusted EBITDA at or below 1.9x
• Robust financial position as of September 30, 2019
‒ Available liquidity $4.7 billion*
*Includes cash and cash equivalents.
Note: See Advisory for cautionary statements, definitions, and pricing assumptions.
DELIVERING ON OUR FINANCIAL PLAN 49
24Corporate Presentation February 2020
Canadian Natural
Balance Sheet Strength
Debt/Book Cap Debt/EBITDA
(%) (x)
45% 3.5
3.0
~2.7x
~41%
2.5
40%
2.0
~1.6x
1.5
~35%
35%
1.0
0.5
30% 0.0
2017 2020B 2017 2020B
Actual Forecast
Note: See Advisory for cautionary statements, definitions, and pricing assumptions.
STRONG & IMPROVING FINANCIAL METRICS 50
Long Term Sustainability
25Corporate Presentation February 2020
The World Needs More Canadian Energy
(Aggregate ESG Score)
300 Environment(1)
Social(2)
250 Governance(3)
200
Average
150
100
50
0
(1) 2018 Yale Environment Protection Index (EPI).
(2) 2018 Social Progress Index (SPI) prepared by Social Progress Imperative.
(3) 2018 World Governance Indicators (WGI), Regulatory Quality Score. *Iraq, Kuwait and Venezuela social score not shown due to insufficient data.
TOP OIL EXPORTING NATIONS IN THE WORLD 52
The Strength of Canadian Natural’s Business Model
• Leaders in ESG performance
• Advantaged assets for downside scenarios
• Leverage technology, innovation and continuous improvement
‒ Delivered game changing environmental performance
• Journey to net zero emissions in oil sands
• Canadian oil & natural gas on global markets reduces global GHG emissions
Canadian Natural should be an ESG investment priority
UNIQUE, SUSTAINABLE & ROBUST INCLUDING ESG 53
26Corporate Presentation February 2020
Governance
Risk Assessment & Mitigation
• Strong track record of identifying, assessing, adapting, aligning and executing
• Board of Directors as well as Board Governance and Risk Committees
‒ Review and hold management accountable to identify and mitigate risks
• Strong, effective strategies to plans and address risks
‒ Financial, Operational, Market, Technology, Environmental, Social, Governance, Safety, Asset Integrity
Board of Directors
Health, Safety, Asset Integrity and Nominating, Governance and
Environmental Committee Risk Committee
Management Committee
Marketing Finance Environmental, Social, Governance Operations Technology
STRONG GOVERNANCE 54
Governance
Management Aligned With Shareholders
Management Ownership
(% of Outstanding Shares)
2.5% ~2.4%
2.0% Substantial Management & Director invested wealth
delivers clear alignment with shareholder interests
1.5%
CNQ
1.0%
0.5%
0.0%
Peers Integrated Peers
Peers include APA, CVE, DVN, ECA, EOG, PXD and SU.
Note: Based on share ownership data from June 2019 (excluding options). Outstanding shares as at Q2/19 for peers per Bloomberg.
Source: SEDI and BD Corporate.
MANAGEMENT ALIGNED WITH SHAREHOLDER INTERESTS 55
27Corporate Presentation February 2020
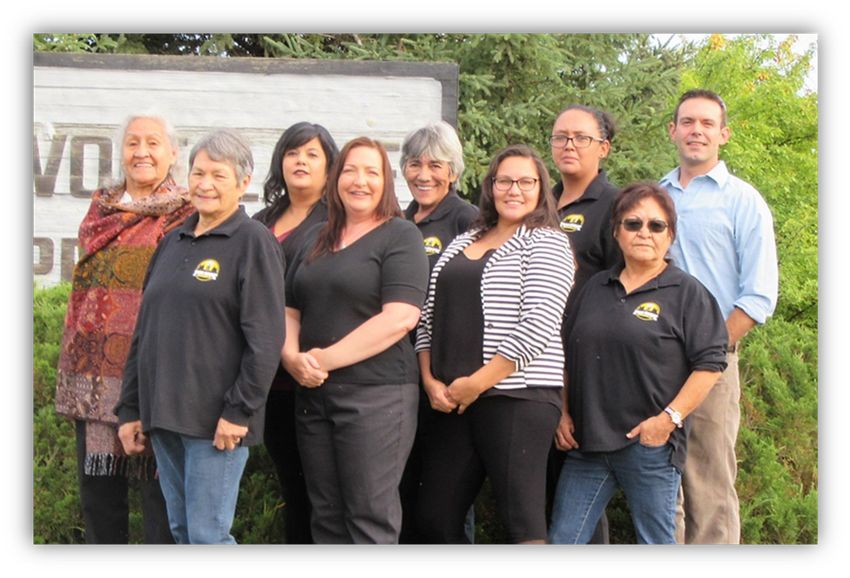
Social Performance
Investing in Indigenous Communities
~$500 Million
IN CONTRACTS WITH LOCAL
INDIGENOUS BUSINESSES IN 2018
~$1.2 Billion
IN LAST 3 YEARS
188 Indigenous Companies
DOING BUSINESS WITH CANADIAN NATURAL
41 COMMUNITIES IN WESTERN CANADA
INVESTING IN COMMUNITIES WHERE WE LIVE & WORK 56
Social Performance
Abandonment & Reclamation
(Wells)
2,100
Industry Leader in
1,800
AER approved Abandonment & Reclamation
ABC* pilots
1,500
1,293
1,200
INACTIVE WELLS ABANDONED
IN 2018
900
Adopted ABC*
planning ~2,000
600 TARGETED WELLS ABANDONED
IN 2019F
300
0
2016 2017 2018 2019F
Number of Wells Abandoned
*Area based closures.
PROACTIVELY REDUCING OUR ENVIRONMENTAL FOOTPRINT 57
28Corporate Presentation February 2020
Canada’s Crude Oil & Natural Gas Sector Has Delivered
Advancing Innovation
• Recognized a need to reduce GHG emissions ~$3.4 Billion
INVESTED BY
• Leverage technology and Canadian ingenuity CANADIAN NATURAL
• Opportunities to reduce emissions further IN R&D SINCE 2009
Reduced Environmental Footprint
Unlock Reserves
Increase Production
Effective & Efficient Operations
– Lowers costs
ONE OF CANADA’S LEADING R&D INVESTORS 58
Continuous Improvement in GHG Emissions
Horizon Oil Sands
GHG Emissions Intensity
(tonnes CO2e/BOE)
0.11
0.10
~37%
REDUCTION IN GHGs SINCE 2012
0.09 EQUIVALENT TO REMOVING
~665,000
0.08 CARS OFF THE ROAD ANNUALLY*
0.07
0.06
2012 2013 2014 2015 2016 2017 2018
*Relative to 2012 performance.
Note: Represents GHG emissions intensity at Horizon Oil Sands.
CONTINUING TO REDUCE ENVIRONMENTAL FOOTPRINT 59
29Corporate Presentation February 2020
Continuous Improvement in GHG Emissions
Heavy Crude Oil
Primary Heavy Oil Venting • Solution Gas Conservation has
(e3m3/year) reduced GHG emissions
250,000
200,000
~78%
REDUCTION IN ABSOLUTE VENT
150,000 VOLUMES SINCE 2012
100,000 EQUIVALENT TO REMOVING
~930,000
50,000 CARS OFF THE ROAD ANNUALLY*
0
2012 2013 2014 2015 2016 2017 2018
*Relative to 2012 performance; includes reductions in Primary Heavy crude oil venting and Primrose/Wolf Lake CSS flaring.
Note: 2012 is the reference point for the Government of Canada’s methane reduction target.
STRENGTHENING ENVIRONMENTAL INITIATIVES 60
Conventional Heavy Oil Pilot
Zero Emission Primary Heavy Oil Pad Site
• Canadian Natural is piloting zero emissions from
Vapor reservoir to storage tank in primary heavy oil
Recovery Unit
‒ Canadian Natural is at the forefront of innovative
emission reduction initiatives
This pilot is believed to be among the first of its kind
Electric Drive TANK VAPOR
Well Head
OIL
Tank
Emulsion WATER
Heater 0
SAND
CARBON & METHANE EMISSIONS
Gas
Sales 100%
OF ALL METHANE & CO2 VENTING
CAPTURED
Solution Gas
Compressor
Driven by Electricity.
JOURNEY TO NET ZERO IN CONVENTIONAL HEAVY OIL 61
30Corporate Presentation February 2020
Carbon Capture & Sequestration / Storage Technology
Quest
TOP TIER
CO2 CAPTURER AND SEQUESTERER IN THE WORLD(1)
• Reduced CO2 footprint
• Reduced CO2 charges
Tonnes per Year Horizon
EQUIVALENT TO
Quest(2) ~1.1 million REMOVING
Horizon ~0.4 million ~576,000
NWR(3) ~1.2 million CARS OFF THE
ROAD ANNUALLY
~2.7 million
(1) Per the Global CCS Institute.
(2) Canadian Natural is a 70% working interest owner in Quest.
(3) Canadian Natural is a 50% owner in NWR.
LEADING CANADA IN CARBON CAPTURE & STORAGE 62
Oil Sands Well-to-Combustion
GHG Emissions Intensity
(tonnes CO2e/bbl) Realized Success
0.7 2009
Intensity
0.6
US Refined Average
0.5
0.4
0.3
0.2
0.1
0 US Saudi Arabia Typical Russia Libya Waha CNQ Oil CNQ Kirby Anglo Kutto Norway Iraq Kirkuk China CNQ Oil Brazil Frade Iran Marun US Alaska US US Texas Iraq Zubair Nigeria Nigeria Venezuala Indonesi Oil Sands US US
Wyoming Ghawar SAGD SOR Samatlor Sands SAGD Oseberg Bozhong Sands 2018 North Slope California Eagle Ford Escravos Bonny Hamaca Duri FCC & HC California California
WC 2 Pathway Wilmington Condensate Beach SCO ~2009 South Midway
Zone Belridge Sunset
Note: Total emissions intensity includes: production and upgrading, transportation, refining, transportation of refined product and combustion.
Canadian Natural Oil Sands includes Oil Sands Mining and Upgrading and Thermal Crude Oil.
Source: Internal company reports and ARC Energy Research Institute 2017 Report.
CLEAR DEFINED GOAL TO REDUCE GHG EMISSIONS 63
31Corporate Presentation February 2020
Capturing Oil Sands Technological Improvements
Journey to Net Zero Emissions
GHG Emissions Intensity(1)
(tonnes CO2e/bbl)
0.54
0.52
US Refined Average (2)
0.50
0.48
Targeting
0.46 net zero oil sands
direct and indirect
0.44
emissions
0.42
0.40
2018 Current Future Future Intensity after Aspiration Net
Technology Technology Techology Mitigation Zero
Execution Execution Development
(1) GHG emissions intensity reflects Canadian Natural’s oil sands operations, including Oil Sands Mining and Upgrading and Thermal Crude Oil.
(2) US Refined Average emissions intensity includes: production and upgrading, transportation, refining, transportation of refined product and combustion.
JOURNEY TO CONTINUE TO REDUCE GHG EMISSIONS 64
Canadian Natural Committed to Environmental Performance
• Stated targets going forward
Already Delivered ‒ Reduce oil sands GHG emissions intensity by 25% by 2025
Game Changing
Performance From 2016 base line
‒ Reduce E&P methane emissions by 20% by 2025
From 2016 baseline
‒ Reduce in situ fresh water intensity by 50% by 2022
Committed
to Enhancing From 2012 baseline
Performance ‒ Reduce mining fresh river water intensity by 30% by 2022
From 2012 baseline
DELIVERING GAME CHANGING PERFORMANCE 65
32Notes
Advisory
Forward Looking Statements

Certain statements relating to Canadian Natural Resources Limited (the “Company”) in this document or documents incorporated herein by
reference constitute forward-looking statements or information (collectively referred to herein as “forward-looking statements”) within the meaning
of applicable securities legislation. Forward-looking statements can be identified by the words “believe”, “anticipate”, “expect”, “plan”, “estimate”,
“target”, “continue”, “could”, “intend”, “may”, “potential”, “predict”, “should”, “will”, “objective”, “project”, “forecast”, “goal”, “guidance”, “outlook”,
“effort”, “seeks”, “schedule”, “proposed” or expressions of a similar nature suggesting future outcome or statements regarding an outlook.
Disclosure related to expected future commodity pricing, forecast or anticipated production volumes, royalties, production expenses, capital
expenditures, income tax expenses and other guidance provided throughout this Management’s Discussion and Analysis (“MD&A”) of the financial
condition and results of operations of the Company, constitute forward-looking statements. Disclosure of plans relating to and expected results of
existing and future developments, including but not limited to the Horizon Oil Sands ("Horizon"), the Athabasca Oil Sands Project ("AOSP"),
Primrose thermal projects, the Pelican Lake water and polymer flood project, the Kirby Thermal Oil Sands Project, the Jackfish Thermal Oil Sands
Project, the timing and future operations of the North West Redwater bitumen upgrader and refinery, construction by third parties of new, or
expansion of existing, pipeline capacity or other means of transportation of bitumen, crude oil, natural gas, natural gas liquids ("NGLs") or synthetic
crude oil (“SCO”) that the Company may be reliant upon to transport its products to market, and the development and deployment of technology
and technological innovations also constitute forward-looking statements. These forward-looking statements are based on annual budgets and
multi-year forecasts, and are reviewed and revised throughout the year as necessary in the context of targeted financial ratios, project returns,
product pricing expectations and balance in project risk and time horizons. These statements are not guarantees of future performance and are
subject to certain risks. The reader should not place undue reliance on these forward-looking statements as there can be no assurances that the
plans, initiatives or expectations upon which they are based will occur.

In addition, statements relating to “reserves” are deemed to be forward-looking statements as they involve the implied assessment based on
certain estimates and assumptions that the reserves described can be profitably produced in the future. There are numerous uncertainties inherent
in estimating quantities of proved and proved plus probable crude oil, natural gas and NGLs reserves and in projecting future rates of production
and the timing of development expenditures. The total amount or timing of actual future production may vary significantly from reserves and
production estimates.

The forward-looking statements are based on current expectations, estimates and projections about the Company and the industry in which the
Company operates, which speak only as of the date such statements were made or as of the date of the report or document in which they are
contained, and are subject to known and unknown risks and uncertainties that could cause the actual results, performance or achievements of the
Company to be materially different from any future results, performance or achievements expressed or implied by such forward-looking
statements. Such risks and uncertainties include, among others: general economic and business conditions which will, among other things, impact
demand for and market prices of the Company’s products; volatility of and assumptions regarding crude oil and natural gas prices; fluctuations in
currency and interest rates; assumptions on which the Company’s current guidance is based; economic conditions in the countries and regions in
which the Company conducts business; political uncertainty, including actions of or against terrorists, insurgent groups or other conflict including
conflict between states; industry capacity; ability of the Company to implement its business strategy, including exploration and development
activities; impact of competition; the Company’s defense of lawsuits; availability and cost of seismic, drilling and other equipment; ability of the
Company and its subsidiaries to complete capital programs; the Company’s and its subsidiaries’ ability to secure adequate transportation for its
products; unexpected disruptions or delays in the resumption of the mining, extracting or upgrading of the Company’s bitumen products; potential
delays or changes in plans with respect to exploration or development projects or capital expenditures; ability of the Company to attract the
necessary labour required to build its thermal and oil sands mining projects; operating hazards and other difficulties inherent in the exploration for
and production and sale of crude oil and natural gas and in mining, extracting or upgrading the Company’s bitumen products; availability and cost
of financing; the Company’s and its subsidiaries’ success of exploration and development activities and its ability to replace and expand crude oil
and natural gas reserves; timing and success of integrating the business and operations of acquired companies and assets; production levels;
imprecision of reserves estimates and estimates of recoverable quantities of crude oil, natural gas and NGLs not currently classified as proved;
actions by governmental authorities (including production curtailments mandated by the Government of Alberta); government regulations and the
expenditures required to comply with them (especially safety and environmental laws and regulations and the impact of climate change initiatives
on capital expenditures and production expenses); asset retirement obligations; the adequacy of the Company’s provision for taxes; and other
circumstances affecting revenues and expenses.

The Company’s operations have been, and in the future may be, affected by political developments and by national, federal, provincial and local
laws and regulations such as restrictions on production, changes in taxes, royalties and other amounts payable to governments or governmental
agencies, price or gathering rate controls and environmental protection regulations. Should one or more of these risks or uncertainties materialize,
or should any of the Company’s assumptions prove incorrect, actual results may vary in material respects from those projected in the forward-
looking statements. The impact of any one factor on a particular forward-looking statement is not determinable with certainty as such factors are
dependent upon other factors, and the Company’s course of action would depend upon its assessment of the future considering all information
then available.

Readers are cautioned that the foregoing list of factors is not exhaustive. Unpredictable or unknown factors not discussed in the Company's MD&A
could also have adverse effects on forward-looking statements. Although the Company believes that the expectations conveyed by the forward-
looking statements are reasonable based on information available to it on the date such forward-looking statements are made, no assurances can
be given as to future results, levels of activity and achievements. All subsequent forward-looking statements, whether written or oral, attributable to
the Company or persons acting on its behalf are expressly qualified in their entirety by these cautionary statements. Except as required by
applicable law, the Company assumes no obligation to update forward-looking statements in the Company's MD&A, whether as a result of new
information, future events or other factors, or the foregoing factors affecting this information, should circumstances or the Company’s estimates or
opinions change.
Advisory
Special Note Regarding non-GAAP and other Financial Measures
This presentation includes references to financial measures commonly used in the crude oil and natural gas industry, such as: adjusted net
earnings from operations; adjusted funds flow (previously referred to as funds flow from operations) and net capital expenditures. These financial
measures are not defined by International Financial Reporting Standards ("IFRS") and therefore are referred to as non-GAAP measures. The non-
GAAP measures used by the Company may not be comparable to similar measures presented by other companies. The Company uses these non-
GAAP measures to evaluate its performance. The non-GAAP measures should not be considered an alternative to or more meaningful than net
earnings, cash flows from operating activities, and cash flows used in investing activities, as determined in accordance with IFRS, as an indication
of the Company's performance.
Adjusted net earnings (loss) from operations is a non-GAAP measure that represents net earnings (loss) as presented in the Company's
consolidated Statements of Earnings (Loss), adjusted for the after-tax effects of certain items of a non-operational nature. The Company considers
adjusted net earnings (loss) from operations a key measure in evaluating its performance, as it demonstrates the Company's ability to generate
after-tax operating earnings from its core business areas. The reconciliation “Adjusted Net Earnings (Loss) from Operations, as Reconciled to Net
Earnings (Loss)" is presented in the Company’s MD&A.
Adjusted funds flow (previously referred to as funds flow from operations) is a non-GAAP measure that represents cash flows from operating
activities as presented in the Company's consolidated Statements of Cash Flows, adjusted for the net change in non-cash working capital,
abandonment expenditures and movements in other long-term assets, including the unamortized cost of the share bonus program and prepaid
cost of service tolls. The Company considers adjusted funds flow a key measure as it demonstrates the Company’s ability to generate the cash
flow necessary to fund future growth through capital investment and to repay debt. The reconciliation “Adjusted Funds Flow, as Reconciled to Cash
Flows from Operating Activities” is presented in the Company’s MD&A.
Net capital expenditures is a non-GAAP measure that represents cash flows used in investing activities as presented in the Company's
consolidated Statements of Cash Flows, adjusted for the net change in non-cash working capital, investment in other long-term assets, share
consideration in business acquisitions and abandonment expenditures. The Company considers net capital expenditures a key measure as it
provides an understanding of the Company’s capital spending activities in comparison to the Company's annual capital budget. The reconciliation
“Net Capital Expenditures, as Reconciled to Cash Flows used in Investing Activities” is presented in the Net Capital Expenditures section of the
Company’s MD&A.
Free cash flow is a non-GAAP measure that represents cash flows from operating activities as presented in the Company's consolidated
Statements of Cash Flows, adjusted for the net change in non-cash working capital from operating activities, abandonment, certain movements in
other long-term assets, less net capital expenditures and dividends on common shares. The Company considers free cash flow a key measure in
demonstrating the Company’s ability to generate cash flow to fund future growth through capital investment, pay returns to shareholders, and to
repay debt.
Adjusted EBITDA is a non-GAAP measure that represents net earnings (loss) as presented in the Company's consolidated Statements of Earnings
(Loss), adjusted for interest, taxes, depletion, depreciation and amortization, share-based compensation expense (recovery), unrealized risk
management gains (losses), unrealized foreign exchange gains (losses), and accretion of the Company’s asset retirement obligation. The
Company considers adjusted EBITDA a key measure in evaluating its operating profitability by excluding non-cash items.
Debt to Adjusted EBITDA is a non-GAAP measure that is derived as the current and long-term portions of long-term debt, divided by the 12 month
trailing Adjusted EBITDA, as defined above. The Company considers this ratio to be a key measure in evaluating the Company's ability to repay
long-term debt.
Debt to cash flow is a non-GAAP measure that is derived as the current and long term portions of long-term debt, divided by the 12 month trailing
adjusted funds flow, as defined above. The Company considers this ratio to be a key measure in evaluating the Company's ability to repay long-
term debt.
Debt to book capitalization is a non-GAAP measure that is derived as net current and long-term debt, divided by the book value of common
shareholders' equity plus net current and long-term debt. The Company considers this ratio to be a key measure in evaluating the Company's
ability to repay long-term debt.
Available liquidity is a non-GAAP measure that is derived as cash and cash equivalents, total bank and term credit facilities (reported as long-term
debt), less amounts drawn on the bank and credit facilities including under the commercial paper program. The Company considers available
liquidity a key measure in evaluating the sustainability of the Company’s operations and ability to fund future growth. See note 8 - Long-term Debt
in the Company’s consolidated financial statements.
Special Note Regarding Currency, Financial Information and Production and Reserves
This presentation should be read in conjunction with the Company's MD&A and the unaudited interim consolidated financial statements for the
three and nine months ended September 30, 2019 and the MD&A and the audited consolidated financial statements of the Company for the year
ended December 31, 2018. All dollar amounts are referenced in millions of Canadian dollars, except where noted otherwise. The Company’s
unaudited interim consolidated financial statements for the three and nine months ended September 30, 2019 and the Company's MD&A have
been prepared in accordance with IFRS as issued by the International Accounting Standards Board ("IASB"). Changes in the Company's
accounting policies in accordance with IFRS, including the adoption of IFRS 16 "Leases" on January 1, 2019, are discussed in the "Changes in
Accounting Policies" section of the Company's MD&A. In accordance with the new "Leases" standard, comparative period balances in 2018
reported in the Company's MD&A have not been restated.
Production volumes and per unit statistics are presented throughout the Company's MD&A on a “before royalties” or “company gross” basis, and
realized prices are net of blending and feedstock costs and exclude the effect of risk management activities. In addition, reference is made to crude
oil and natural gas in common units called barrel of oil equivalent ("BOE"). A BOE is derived by converting six thousand cubic feet (“Mcf”) of natural
gas to one barrel (“bbl”) of crude oil (6 Mcf:1 bbl). This conversion may be misleading, particularly if used in isolation, since the 6 Mcf:1 bbl ratio is
based on an energy equivalency conversion method primarily applicable at the burner tip and does not represent a value equivalency at the
wellhead. In comparing the value ratio using current crude oil prices relative to natural gas prices, the 6 Mcf:1 bbl conversion ratio may be
misleading as an indication of value. In addition, for the purposes of the Company's MD&A, crude oil is defined to include the following
commodities: light and medium crude oil, primary heavy crude oil, Pelican Lake heavy crude oil, bitumen (thermal oil), and SCO. Production on an
“after royalties” or “company net” basis is also presented in the Company's MD&A for information purposes only.
For the year ended December 31, 2018, the Company retained Independent Qualified Reserves Evaluators (“IQRE”), Sproule Associates Limited
and Sproule International Limited (together as “Sproule”) and GLJ Petroleum Consultants Ltd. (“GLJ”), to evaluate and review all of the Company’s
proved and proved plus probable reserves with an effective date of December 31, 2018 and a preparation date of February 4, 2019. Sproule
evaluated and reviewed the North America and International light and medium crude oil, primary heavy crude oil, Pelican Lake heavy crude oil,
bitumen (thermal oil), natural gas and NGLs reserves. GLJ evaluated the Oil Sands Mining and Upgrading SCO reserves. The evaluations and
reviews were conducted in accordance with the standards contained in the Canadian Oil and Gas Evaluation Handbook (“COGE Handbook”) and
disclosed in accordance with National Instrument 51-101 – Standards of Disclosure for Oil and Gas Activities (“NI 51-101”) requirements.
The Company annually discloses net proved reserves and the standardized measure of discounted future net cash flows using 12-month average
prices and current costs in accordance with United States Financial Accounting Standards Board Topic 932 “Extractive Activities - Oil and Gas” in
the Company’s annual report on Form 40-F filed with the SEC and in the “Supplementary Oil and Gas Information” section of the Company’s
Annual Report on pages 98 to 105 which isincorporated herein by reference.
Additional information relating to the Company, including its Annual Information Form for the year ended December 31, 2018, is available on
SEDAR at www.sedar.com, and on EDGAR at www.sec.gov. Detailed guidance on production levels, capital expenditures and production
expenses can be found on the Company's website at www.cnrl.com, provided that such guidance does not form part of and is not incorporated by
reference in the Company's MD&A.You can also read