2017 FEATURE FILM STUDY - Film LA
←
→
Page content transcription
If your browser does not render page correctly, please read the page content below
2017 FEATURE FILM STUDY


TABLE OF CONTENTS
ABOUT THIS REPORT                                    2
FILMING LOCATIONS                                    4
CANADA IN FOCUS                                      5
FILM TAX CREDITS OVERVIEW                            6
CALIFORNIA IN FOCUS                                  7
THE THREAT TO ANIMATED FILMS IN CALIFORNIA           8
FILM PRODUCTION: BUDGETS AND SPENDING                10
FILM PRODUCTION: JOBS                                12
                                                          6255 W. Sunset Blvd.
FILM PRODUCTION: VISUAL EFFECTS                      13
                                                          12th Floor
FILM PRODUCTION: MUSIC SCORING                       16
                                                          Hollywood, CA 90028
FILM INCENTIVE PROGRAMS                              16
CONCLUSION                                           18
STUDY OVERSIGHT                                      19   filmla.com
SOURCES                                              20      @FilmLA
MOVIES OF 2017: APPENDIX A (TABLE)                   21      FilmLA
MOVIES OF 2017: APPENDIX B (VISUAL MAP)              24      FilmLAinc

CREDITS:                    QUESTIONS? CONTACT US!

Research Analyst:           Adrian McDonald
Adrian McDonald             Research Analyst
                            (213) 977-8636
Graphic Design:             amcdonald@filmla.com
Shane Hirschman

Photography:
Shutterstock
20th Century Fox©
ABOUT THIS REPORT
    For the last five years, FilmL.A. Research has tracked the feature films released theatrically
    in the U.S. to determine where they were filmed, why they filmed in the locations they
    did and how much was spent to produce them. We do this to help businesspeople and
    policymakers, particularly those with investments in California, better understand the
    state’s place in the competitive business environment that is feature film production.
    And we also do it for the millions of movie lovers out there who want to know where their
    favorite films were made and what went into making them.

    Our sample is based on the top 100 feature films at the domestic box office released
    theatrically within the U.S. during the 2017 calendar year. The 2018 Feature Film Study
    follows the same basic approach as prior reports and analyzes the following data for
    included films:

        •   Primary and secondary filming locations
        •   Primary and secondary locations for postproduction / visual effects (VFX) work
        •   The number of films that scored music within California
        •   Production spending and filming jobs created

    In determining the primary production location of a given film, the overriding factor was
    where the production spent most of its reported budget. This is sometimes a more
    complex activity than it may seem.

    Due to the heavy reliance on visual effects (VFX) common in most big-budget films, some
    projects may be primarily produced in a location where none of the live-action principal
    photography took place. For example, in last year’s study, FilmL.A. credited the United
    Kingdom (U.K.) as the primary production location for Disney©’s Jungle Book, a live-
    action remake of the animated film that did all of its principal photography in Los Angeles.
    Because the film spent more money (on VFX) in the U.K., however, it was given credit as
    the primary production center rather than California.

    Similarly, in this year’s report, FilmL.A. designated New Zealand as the primary production
    center for War for the Planet of the Apes rather than Vancouver, British Columbia. While
    the film did the vast majority of its principal photography in British Columbia (where it
    spent more than $81 million (CAD) while filming over 180 days),1 the production spent
    more money — $131.5 million (NZD) — on VFX in New Zealand.

    The 100 films in this year’s sample set included 14 animated and 86 live-action projects.
    More than half (52) of the films completed production in 2016, 21 in 2017, 18 in 2015 and
    two completed production in 2014. The reported budgets of the 100 films (see Appendix A
    for complete list) ranged from $4.5 million to $300 million. The average production budget in
    the sample was $74.3 million.

    The films in this study also represent over $7.55 billion in direct production spending and
    tens of thousands of high-wage jobs in a wide array of professions. The $7.55 billion spent
    on the 2017 films is just over the $7.5 billion spent on the top 100 films of 2016.

    1
        MPA, Canada: https://www.mpa-canada.org/wp-content/uploads/2017/07/Apes-Release-no-Watermark.pdf

2
$800
$700 $2,000
$600
$500 $1,500
$400
$1,000
$300
$200
$100
SHARE OF TOP 50 FILMS AT GLOBAL BOX
$500OFFICE
$0 0
$50
$40.6
$40 $38.4 $38.6
$35.9 $36.4
$34.7
$32.6
$31.6
$29.4
BILLIONS ($)
$30 $27.7
$26.3
$25.5 100%
$23.1
$24.6
$23.0
$22.1
$20 $21.0 $20.3 $20.3
80%
$18.5 $18.0
$17.8
$16.7 $15.2 $15.4
60%
$12.6 $12.8
$10 $11.6
40%
$0 20%
2001 2005 2006 2007 2008 2009 2010 2011 2012 2013 2014 2015 2016 2017
80
GLOBAL BOX OFFICE TOP 50 FILMS 15
70
60
12
50
Total box-office revenues reached a record high 9 in 2017, with global box
40
office ticket sales hitting $40.6 billion.2 Despite the release of hundreds of
30 movies every year, a relative handful account for 6 most of the global revenue.
The top 50 films of 2017 pulled in $24.6 billion worldwide; the top 25 films
20
raked in $18 billion and the top five films took in $5 billion.3
10
3
For more than a decade, the top 50 films released each year have slowly
0
0
been increasing their overall share of the worldwide box office. In 2006,
the $12.8 billion earned by the top 50 films represented 50 percent of
the worldwide box office total of $25.5 billion. By 2017, the share of the
worldwide box office total ($39.9 billion) held by the top 50 films ($24.6
billion) increased to 62 percent.
2
MPAA, 2017 Theme Report, pg. 7: https://www.mpaa.org/wp-content/uploads/2018/04/MPAA-THEME-Report-2017_Final.pdf
3
2017 Worldwide Grosses, Box Office Mojo: http://www.boxofficemojo.com/yearly/chart/?view2=worldwide&yr=2017&p=.htm
3
FILMING LOCATIONS$40
    While Southern California and Hollywood are widely regarded as the traditional home of
    moviemaking, today’s film industry is a worldwide enterprise. Feature films produced by U.S.
    companies are filmed across the globe. For many films, principal photography occurs in more
    than one location. Accordingly, FilmL.A. works to identify both primary production locations and
    secondary production locations for films studied.

                                                         $30
    In the end, our research determined that 14 different U.S. states and 11 foreign countries were
    used as primary production locations among this study’s 100 films.

    Over the last five years, a handful of locations (California, Canada, Georgia, the U.K., New York
    and Louisiana) have traded spots for the top five filming locations each year. In 2017, Canada
    was the top location for 20 of the surveyed films, replacing Georgia, which ranked first in 2016.
    This marks Canada’s first time in the top slot in FilmL.A.’s Feature Film Reports. Within Canada,
    the top provinces were British Columbia (11 films), Ontario (7), Quebec (1) and Manitoba (1).

    TABLE 1:
                                                           $20
    NUMBER OF TOP 100 DOMESTIC FILMS PRODUCED BY LOCATION
     PRODUCTION CENTER                   2017     2016      2015        2014   2013
           Canada                         20        13       11          7      16

           Georgia                        15        17       13          8      9

           U.K.

           California
                                          15

                                          10
                                                    16

                                                    12
                                                           $10
                                                             15

                                                             14
                                                                         12

                                                                         20
                                                                                9

                                                                                16

           New York                        6        6        7           12     4

           Louisiana                       5        6        9           6      15

           Australia                       5        4        1           2      2

           France                          3        2        1           3      2

                                                            $0
    Falling from the top spot in 2016, Georgia tied with               U.S. SHARE OF TOP MOVIES
    the U.K. in 2017 with 15 films.
                                                                  80
    The U.K., which tied with Georgia in terms of
    project count, hosted 15 movies in 2017, one
    short of their previous high of 16 films in 2016.             70
    More importantly, the U.K. ranked first in total
    budget value and budget spend within its borders
    for the third year in a row.
                                                                        65%    64%    65%
                                                                  60

    California finished 2017 in fourth place, with                                              57%
    ten films produced primarily in the state. As in              50
    previous FilmL.A. reports, California’s project                                                     50%
    count and, more importantly, its total spend, was
    bolstered by four major animated films.                       40

    While New York remains the second largest
    production center in the U.S., it has not been able
                                                                  30
    to capture a significant share of the top 100 films.
    However, with six of the top 100 films produced
    primarily within the state, New York edged out
                                                                  20
    Louisiana (with five films) to rank fifth.

    From a national perspective, the U.S. served as
    the primary production location for 50 percent                10
    of the top 100 films at the domestic box office in
    2017. This is the lowest share for the U.S. since
    FilmL.A. began tracking in 2013.                               0
                                                                        2013   2014    2015     2016    2017

4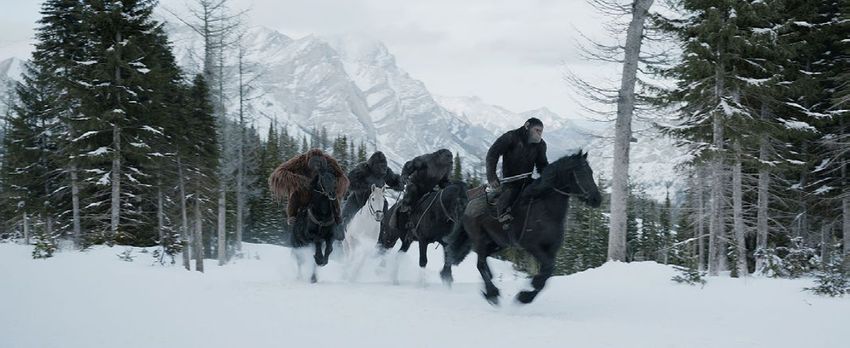
CANADA IN FOCUS
Over the last 20 years, film incentives offered For specialty services like VFX, provincial incentives
by various state and national governments have are even higher. In British Columbia, for example,
become the predominant factor in determining the incentives for film production can be stacked
where a given film or television project will be with incentives for VFX and the Canadian federal
produced. The number one location in the world film incentive to pay for 53 percent of qualified
for the primary production of top 100 films released VFX labor costs. Put another way, if a U.S. based
in 2017 is Canada, the nation that pioneered the producer spends $10 million on qualified VFX labor
creation of modern film tax credits in the late 1990s. in British Columbia, the various incentives will cover
$5.3 million of their cost. Add in the low value of
Historically, the draw for foreign producers and the Canadian dollar, and the producer could see
studios to film in Canada “was once the favourable potential savings of 70 percent.
currency exchange rate,” which ranged from 60-70
cents against the U.S. dollar from the mid-1990s to For cost conscious filmmakers, the deals in Canada
the early 2000s.4 But the introduction of significant have been too good to ignore. As a result of the
film tax credits, which began to have an effect in synergistic savings created by extremely competitive
1999/2000, is when foreign production spending incentives and the beneficial exchange rate, foreign
crossed the $1 billion (CAD) mark in Canada for production spending in Canada has exploded to
the first time. According to the Canadian Media record highs, going from $2.64 billion (CAD) in 2016
Producers Association (CMPA), foreign producers to $3.75 billion in 2017.7
now go to Canada “mainly for the competitive
incentives, skilled crews, award-winning creative The favorable exchange rate came at an ideal time
talent, state-of-the-art technical facilities, and in Canada, specifically for the production hubs in
exceptional locations.” 5 British Columbia and Ontario. In recent years, both
provinces trimmed their respective film incentive
Even as the value of the Canadian dollar reached rates due to escalating cost concerns. The base
parity with the U.S. dollar from 1998-2014, foreign labor production credit in British Columbia was
production spending in Canada (which is dominated reduced from 33 percent to 28 8 and the all-spend
by U.S. production spending) climbed from under production incentive in Ontario was reduced from 25
$900 million (CAD) to $2.6 billion in 2014.6 And percent to 21.5 percent.9 While there were concerns
then, beginning in 2015, the value of the Canadian the reductions would result in less production
dollar fell precipitously from over 90-cents on the activity, the favorable exchange rate more than
U.S. dollar to 75-cents by 2016. At the time of this offset the relatively minor reductions to the programs
writing, the value of the Canadian dollar is 77-cents. and Canada has never been busier.
For U.S. producers, the impact of this large drop in 4
Canadian Media Producers Association (CMPA), Profile 2017 Report, pg. 7:
the Canadian dollar, combined with the extremely http://cmpawebsite.wpengine.com/wp-content/uploads/2018/04/Profile-2017.pdf
5
large national and provincial film incentives cannot 6
Id.
CMPA, Profile 2017 Report, pg. 15.
be understated. The low exchange rate effectively 7
Id.
creates an additional 25 percent savings, on top of 8
CreativeBC, PSTC Overview:
existing incentives. With base provincial incentives https://www.creativebc.com/database/files/library/Tax_credit_information___Foreign_October_2016(3).pdf
9
in places like British Columbia and Ontario at 21-33 Etan Vlessing, The Hollywood Reporter, “Ontario Cuts Foreign Film Tax Credit, Hollywood to take
Hit,” April 23, 2015:
percent of qualified costs or more, filmmaking in https://www.hollywoodreporter.com/news/ontario-cuts-foreign-film-tax-791058
some parts of Canada today is very economical.
Other Postproduction
2%
4%
4%
Executive
Above the Line
FOREIGN PRODUCTION SPENDING IN CANADA
49% Below the Line
1%
-THE-LINE
VFX VFX
$4,000
$3,500 $1,895
$3,000
MILLIONS ($)
$2,500
$1,533 $1,520
$2,000
$941 $969
$1,500 $946 $1,098 $1,862
$846
$795 $833
$1,000
$1,067 $1,124
$933 $857
$500 $448 $816 $841 Television
$667 $675 $642
$320 Film
0
1997 2001 2005 2010 2011 2012 2013 2014 2015 2016 2017
0
5
0
FILM TAX CREDITS OVERVIEW
    If lower taxes were enough to lure Hollywood film and television productions outside of the state,
    then the U.S. film industry would have decamped California decades ago for other states with
    significantly lower tax burdens. Recognizing this fact, policymakers in Canada repurposed tax
    credits into an extremely effective business incentive.

    The tax credits engineered in Canada and later copied and/or modified in many U.S. states and
    other nations do not function like a personal tax credit that most people are familiar with, in which
    a tax credit is used to offset any taxes owed. For individual income tax filers, when a taxpayer has
    more credits than they owe in taxes, the credits are generally forfeit or allowed to be carried forward
    for use in future years. But film tax credits work differently.

    When a film is greenlit, it is common practice for a studio or the producers to form a temporary
    business entity like a limited liability company (LLC). These business entities are typically short-term
    operations that remain active only for the duration of the production. On paper, these production
    companies spend their relatively short operational period spending resources to complete the
    film. Profits, if any, will come much later when the project is finished and they will flow not to
    the temporary production entity, but to the parent studio or producers (who are often based in
    California).

    Since the temporary production companies created to produce a film or television project rarely
    incur tax liabilities in states like Georgia or the Canadian provinces, standard tax credits that act
    only to reduce taxes owed would be worthless in jurisdictions outside of California. Tax credits for
    film and television productions are rarely used to reduce taxes for filmmakers. Instead, their main
    function is to finance a portion of the film.

    The most common type of film incentives in the modern era come in the form of either transferable
    or fully refundable tax credits.10 Transferable tax credits allow the production to sell any credits it
    cannot utilize to a third-party business or individual(s) who do have tax liabilities in that jurisdiction.
    For example, a production with $20 million in transferable tax credits may sell them for $18 million
    (or 90-cents on the dollar), if a buyer can be found.

    Refundable tax credits, on the other hand, allow the production to receive full cash value for the
    credits, even when the production company or studio has no local tax liability. In this case, the
    production with $20 million in refundable tax credits will receive a check from the issuing jurisdiction
    for the full $20 million value of the credits. This investment is usually justified with reference to jobs
    and economic output created during production.

    A U.S. state or Canadian province offering a 25 percent tax credit does not mean the production’s
    taxes will be reduced by 25 percent, which is a common misunderstanding. Instead, a 25 percent
    tax credit on qualified production spending in that location means 25 percent of the qualified
    cost incurred there will be covered by the tax credits when they are either sold to a third party
    (transferable tax credits) or fully refunded (refundable tax credits) by the issuing jurisdiction.

    10
         Thus far, only refundable tax credits have been implemented at the Federal and Provincial levels in Canada; in the U.S.,
         nine states (including Louisiana, New Mexico and New York) use refundable tax credits, eight states (including Georgia,
         Illinois and Massachusetts) use transferable tax credits and 14 states (including Texas, North Carolina and South Carolina)
         use straight rebate/grants programs.
         https://www.epfinancialsolutions.com/home/production-incentives/united-states-incentives/

6
CALIFORNIA IN FOCUS
California ranked fourth among all locations for feature films included in this survey. California hosted primary
production for 10 (4 animated & 6 live-action) of the films surveyed.

Of the six live-action films produced in California, four (The House, Home Again, Lady Bird, The Disaster Artist)
were made in the state despite not receiving tax credits. Only one of these non-incentivized films (The House,
$40 million) had a budget over $20 million. The other three non-incentivized films had budgets of $15 million
or less (Home Again, $15 million; Lady Bird, $10 million; The Disaster Artist, $10 million). As noted in previous
FilmL.A. studies, incentives in other locations are often not lucrative enough to attract smaller projects with
budgets of $10 million or less. Such projects would incur additional travel, lodging and shipping costs if they
left the state.

California also hosted four animated films, which are not eligible for the state’s film incentive. The importance
of these projects should not be overlooked. While these four animated films represent less than half of
California’s project count, they account for 83 percent ($514 million) of the combined budgets (budget value)
for all 10 California movies in this survey. By comparison, the five animated California films in last year’s
study accounted for 78 percent of the budget value for the 12 films produced in the state. Animated films and
California’s position in the industry is discussed in greater detail in the next section.

The impact of the improved California Film & Television Tax Credit 2.0 Program on the state’s output of top
100 films has been limited over the last two years, but shows signs of picking up in the future. In 2016, three
incentivized California films (Ouija: Origin of Evil, Why Him? and The Conjuring 2) were in the top 100 films.
And in 2017, two incentivized California films (How to Be a Latin Lover and Annabelle Creation) made the list.

TABLE 2:
CALIFORNIA FILM & TELEVISION TAX CREDIT RECIPIENTS

     CA TAX CREDIT PROJECT                           CA Spend                      Cast       Crew   Extras
     Annabelle Creation                               $17,393,186                        36   518     343
     How to Be a Latin Lover                          $12,898,068                        65   100     1,580

Of the 53 feature films that have qualified for the expanded incentive, almost half are independent films. Some
of these may not reach a position as one of the top 100 box office films of the year upon release.

Generally speaking, California remains at a disadvantage in attracting the most expensive feature film projects.
Most of the movies that rank in the top 25 at the domestic box office (a quarter of the surveyed films) have
budgets over $100 million; just four of the top 25 films in 2017 had budgets below $100 million.

For the third year in a row, California did not benefit from a single major live-action film with a budget of $100
million or more. In fact, the largest live-action movie budget spent in California was The House which had an
estimated budget of $40 million.

Thus far, just a few of the feature film recipients of the new film tax credit in California have reported a budget
over $100 million and only one, 2018’s A Wrinkle in Time (which spent $117 million in the state), has been
released. Later this year, another California incentive project, the Transformers spinoff film Bumblebee, is set
for release after spending an estimated $128 million in the state. Looking ahead to 2019, Marvel© Studios’
upcoming film Captain Marvel will be released and the project is expected to spend just north of $118 million
in California under the state’s incentive program.

Finally, another factor impacting California’s production of top 100 films under its incentive program is that
major players like Amazon© and Netflix that both produce their own content and/or acquire it from other
studios, tend to skip theatrical exhibition of many films—including medium to large budget projects—and
make them available for their streaming services instead. Some recent examples of these films, which all
received the California incentive, include Sandy Wexler ($58 million CA spend), Bright ($45 million CA spend)
and The Cloverfield Paradox ($26 million CA spend).

Online video subscription services and the streaming content created for them represent the largest area of
growth for U.S. audiences. From 2013 to 2017, the number of online video subscriptions in the U.S. more than
doubled, hitting 157 million last year.11 That’s more than the total number of cable television and satellite cable
subscribers combined. Revenue for online video subscription services reached $17.7 billion in 2017, which is
substantially more than the $11.1 billion spent at the box office in North America last year.

11
      MPAA, 2017 Theme Report, pg. 33:
      https://www.mpaa.org/wp-content/uploads/2018/04/MPAA-THEME-Report-2017_Final.pdf

                                                                                                                      7
$4,000

$3,500

$3,000
             THE THREAT TO ANIMATED FILMS IN CALIFORNIA
$2,500
             From 2010 to 2016, California captured 40 percent or more of the
$2,000       top 100 animated films at the domestic box office. Over that period,
             California’s share was over 50 percent in four of the seven years,
$1,500       peaking at 67 percent in 2010.

$1,000       For historical context, FilmL.A. looked at California’s share of top 100
             animated films in five year increments going back to 1995. In 1995,
 $500        California captured 100 percent of the animated films that ranked in the
             top 100 movies released that year. In 2000, California’s share slipped,
    0        but the state still retained a commanding 75 percent of the animated
             films in the top 100. In 2005, California’s share was only 33 percent,
             but that year appears to be an anomaly. In the prior year (2004), for
             example, California’s share was 83 percent.

             CALIFORNIA’S SHARE OF TOP 100 ANIMATED FILMS
             100%          100%
                                                                                                                  Since the first FilmL.A. feature film
                                                                                                                  study, FilmL.A. Research has cautioned
                                                                                                                  policymakers to keep an eye on the
             80%                                                                                                  health of California’s animation industry
                                  75%
                                                                                                                  and warned that its future dominance
                                                  67%                                                             was far from guaranteed. In 2017,
                                                                        100%
                                                                                                                  California’s share of animated films in
             60%                                             56%   55%                                            the top 100 dropped precipitously to
                                                                                       50%                        just 29 percent, the lowest year
                                                                          80%                                     on record.
                                                                                              43%
                                                                                                     42%
             40%                                                                                                  Unfortunately, California’s decline
                                                                            40%
                                                                          60%
                                                                                                                  comes at a time when animated
                                        33%                                                                       features are making up a larger share of
                                                                                                           29%
                                                                                                                  the top 100 films released each year.
             20%
                    1995 2000 2005 2010 2011 2012 2013 2014 2015 2016 2017
                                                 40%

             NUMBER OF ANIMATED PROJECTS 20%
                                         IN THE TOP 100 FILMS RELEASED AT THE
             DOMESTIC BOX OFFICE
             15
                                                                                                                          14
             12
                                                                                                                  12
                                                                                11
              9                                                                              10
                                                                    9
                                  8                                                                  8
              6                                                                                             7
                                              6          6
              3
                     3
              0
                    1995      2000        2005          2010       2011         2012     2013       2014   2015   2016   2017

             Competing locations, like Canada, Australia, France and the U.K. have all made significant strides
             in establishing themselves as animated feature film hubs that now challenge California’s historically
             unrivaled animation industry. In 2017, Canada produced six animated films ranked in the top 100,
             which eclipsed not just California (with four animated films in the top 100), but the entire U.S., which
             produced five of the animated films in the top 100 (Blue Sky Studios© in Connecticut produced the
             fifth U.S. animated film, Ferdinand).

             Canada’s rapid ascent in the animation industry, along with growth in the other nations mentioned
             above, suggest that the health of the domestic animation industry is not just a California issue, but a
             national one as well.

         8
Photo: Kilmer Media / Shutterstock.com
9FILM PRODUCTION: BUDGETS AND SPENDING
Determining where filmmakers spend their budgets is very difficult, given that full production
budgets are rarely disclosed. Complicating matters further, most feature films produced today
use multiple jurisdictions throughout every stage of development. One of the challenges when
determining the total budget for a given movie (especially when shot in a location that does not
provide project level detail in its incentive program) is that some budget estimates that are reported
in the press reflect the net cost to the studio, and not necessarily the full amount spent to make
the project.
For the dozens of films FilmL.A. has surveyed over the last four years where final confirmed
budgets were available, the vast majority of reported budget estimates in industry trades and other
news publications for these same films underestimated the actual cost of the film. The proliferation
of film incentives across the world has given researchers some valuable tools to address budget
data gaps. The quality and detail level of publicly available information among the top production
locations varies.
For California, precise in-state spend amounts for the three films that received the California
Film & Television Tax Credit were provided by The California Film Commission (CFC). In some
instances, FilmL.A. was able to obtain the exact California spend for specific films from filmmakers
and/or respective studios. For the remaining live-action films, a different approach was required.
According to the Los Angeles Economic Development Corporation (LAEDC), 90 percent of
all production spending on live-action production in California is wholly sourced from within the
state. For projects that were produced in California without an incentive or where the actual spend
was not confirmed by the studio or filmmakers, FilmL.A. applied the LAEDC ratio to determine the
California spend.
California was fortunate to have four of the major animated films released in 2017. The combined
budget value of the four animated films was $514 million, which is a majority (83 percent) of the
total budget value for films shot in the state. California was the lucky beneficiary of virtually all
money spent producing the four animated films.12
Louisiana maintains an online database with detailed project-level information on total budget,
amount spent in the state, amount spent on payroll and total tax credits awarded. While Louisiana
lists the total number of jobs supported by each production, they do not break the jobs out by
categories like cast or crew as California does. Unlike California, Louisiana does list the total
budget for each project, which allows for the exact share of Louisiana’s budget spend to
be calculated.
In Canada and the U.K., government agencies and film commissions that report on production
activity do not typically disclose spending information for individual projects. However, aggregate
spending totals for different production categories and country of origin are disclosed. Jurisdiction
spend percentages versus total budget are reported in the U.K., but Canada, which once reported
this information, no longer breaks out the share captured relative to the total budget. Spend
information for many films produced in the U.K. are available from their company filings.13 Specific
spend amounts for major films produced in Canada (It and War for the Planet of the Apes) were
made available in press releases about economic impact from the Motion Picture Association in
Canada. To estimate Canada’s share of the total budgets for the films that were primarily produced
there, FilmL.A. used the historical share reported in prior provincial reports and historical share for
individual feature films included in FilmL.A.’s four prior feature film reports.
The Georgia Department of Economic Development (GDED—the agency that administers
the state’s film incentive program) releases one reliable data point each year—total aggregate
production spending. Unlike Canada or the U.K., the total direct spend in Georgia is not broken
out by specific production categories (i.e. feature films, commercials, television series, etc.). As a
result, creating feature-specific spending estimates requires a greater reliance on media reports.
Fortunately, many of the biggest features produced in Georgia in 2017 had their in-state spends
reported by various news outlets (see footnote 14 on the next page).
12
Based on information about the four animated films provided to FilmL.A., an estimated 90 percent of the total budgets for three of California’s animated films was spent in the state.
For the fourth animated film, 75 percent of the budget was spent in California.
13
Company filings in the U.K. show total production spending, regardless of where all production activity occurred. The spending does not reflect U.K. spending only.
10So where was the most money spent on feature production among sampled films in 2017?
In terms of total production value, Canada, Georgia and the U.K. all outperformed California.
On the more important metric of actual production spend in each location, California ($554 million)
ranked third behind Canada ($564 million) and the U.K. ($1.3 billion).
Finally, in terms of the share of total budget value spent in the location, California ranked first with
90 percent. Established production centers like California, New York and the U.K., as one might
expect, capture a much higher percentage of the budget on hosted projects.
TABLE 3:
TOTAL MOVIE BUDGET VALUES VS. ACTUAL SPEND IN TOP LOCATIONS14 IN 2017
Budget Value 15 Estimated Amount / Percent
PRODUCTION CENTER Movies (millions) Spent in Location (millions)16
California 10 $617 $554 (90%)
Canada 20 $855 $564 (66%)
Georgia 15 $1,095 $486 (44%)
Louisiana 5 $293 $185 (63%)
NY 6 $230 $190 (83%)
U.K. 15 $1,685 $1,348 (80%)
14
Percentage sources: 2017 British Film Institute Statistical Yearbook; CMPA Profile 2017 Report; MPA Canada press releases for It &
War for the Planet of the Apes; UK Companies House filings for Star Wars: The Last Jedi, 47 Meters Down, Victoria & Abdul,
Murder on the Orient Express, Kingsman: The Golden Circle, Beauty & the Beast, and The Mummy. Georgia’s spending estimate stems
from a 2010 economic impact report commissioned by the MPAA and prepared by Meyer’s Norris Penny (MNP) and exact spend
information for Logan Lucky, Baby Driver, Fate of the Furious, Spiderman: Homecoming, Guardians of the Galaxy Vol. 2, and
Jumanji: Welcome to the Jungle were obtained from press sources.
15
Total budget value is the value of the combined budgets for projects that shoot in a particular location. It is not the amount actually
spent by those productions in that location.
16
The estimated amount spent in each location represents only the amount of money spent by films that FilmL.A. identified as being
primarily produced in that location. It does not include spending by productions that were partially produced there. For example, the
reported spend in British Columbia for War for the Planet of the Apes is not included in the estimated amount/percent spent for the
province because the film was primarily produced in New Zealand, not British Columbia. Where available, spending by productions in
secondary locations were included in the Appendix.
11FILM PRODUCTION: JOBS
In the U.S., some jurisdictions seeking to attract film projects work to track the jobs they create in the
process. Unfortunately, the number of different counting methods makes comparing job growth across
jurisdictions a difficult challenge.
For example, some states report the total number of people who work on film projects in their state,
regardless of how long those jobs last. A background actor who worked a single day on a film would be
counted as holding one job, the same as the director, who worked on the film every day and was paid
substantially more. Nevertheless, from a total job count perspective, many jurisdictions would count this
as two jobs.
Officials in some states prefer to calculate the number of Full Time Equivalent (FTE) jobs created by local
filming. A head count of 1,000 workers may result in 300 FTE jobs, for example.
New Mexico and Georgia use a different approach altogether and report the number of film “work days.”
Both states report this number in the aggregate, making it impossible to know how many worker days
a given movie generates. Providing the total number of worker days also allows for an estimate of the
number of FTE jobs.
FilmL.A. uses “credited job count” estimates to standardize its jobs analysis. While not a perfect
method, the estimated job counts based on credited positions tends to be more conservative than
many headcount estimates employed in different states. Because most films (including pre-production,
principal photography and postproduction) are made in more than one location, determining which
location gets a share of the credited job count is virtually impossible. Given this difficulty, it may be more
informative to look how credited film jobs are allocated within the various departments of a film project
at all phases of the production.
Looking at big live-action films with budgets of $100 million or more and condensing the various
departments, which include Above-the-Line (actors, directors, producers, writers), Executive
(accounting, executive), Other Postproduction (music, editing, publicity), VFX (visual effects and
animation) and Below-the-Line (wardrobe, hair & makeup, props, engineering, electrical & grips,
craft services, camera, film & tape, animals, art department), an even clearer picture emerges for the
breakdown of where most of the jobs are held for the most expensive films released in 2017.
MAIN JOB CATEGORY BREAKDOWNS OF $100 MILLION+ BUDGET FILMS
Other Postproduction
2% As this chart illustrates, over half
4% of the jobs on the major top 100
4% live-action films with budgets
of $100 million or more are in
postproduction.
Executive
VFX
Below-the-Line
Above the Line
49%
Above-the-Line
Executive
Below the Line
Other Postproduction
41%
BELOW-THE-LINE
VFX VFX
$4,000
$3,500
$3,000
12 $2,500
$800FILM PRODUCTION: VISUAL EFFECTS
As FilmL.A. reported in last year’s study, the U.S. has been surpassed by both Canada and the U.K. in VFX
industry output. If competing for high-wage, high-tech jobs is a priority, this is a concern for both California
and the U.S. as a whole, as big-budget films are now frequently spending more than half of their total budgets
on VFX, which also accounts for a majority of the jobs on these films.
In the leading Canadian provinces of British Columbia, Ontario and Quebec, separate incentives for VFX are
offered to lure postproduction work. Otherprovincial
These VFX incentives can be stacked with other Postproduction
and federal film
2%
4%regions especially attractive.
incentives, which makes these
4%
For example, in British Columbia, once the stand-alone VFX credit is stacked with Executive
the regular provincial and
federal film incentives, a total of 53 percent of the VFX spend can be offset. Predictably, VFX and digital
animation (which qualifies under the VFX incentive) has taken off in British Columbia at breakneck speed.
CreativeBC, the agency in British Columbia that administers the film incentives, began reporting “VFX Only”
Above the Line
and digital animation spending separate from live-action filming in 2012.
49%
By 2017, in just five years, VFX Only spending by foreign productions (primarily from the U.S.17) increased 344
Below the
percent and digital animation spending increased by 174 percent.18 Finally, it’s important Linethat VFX Only
to note
41% VFX
spending does not reflect all of the VFX spending in the province, as projects doing live-action work there may
also do some or all of their VFX work in British Columbia as well. $4,000
VFX
17
BELOW-THE-LINE
In 2017, 73 percent of all foreign productions that spent money in Canada were from the U.S.; since 2008, the U.S. share has ranged from 71-87 percent of
18
all foreign production activity. CMPA, Profile 2017 Report, pg. 82.
CreativeBC, Film & Television Statistics: $3,500
https://www.creativebc.com/about-us/research-and-reports/film-and-television-statistics
$3,000
FOREIGN VFX ONLY & DIGITAL ANIMATION SPENDING IN BRITISH COLUMBIA
VFX Digital Animation
$2,500
$800
$700 $2,000
$444
$600
MILLIONS (CAD $)
$500 $1,500
$400
$1,000
$300 $195 $226
$200 $114
$100 $307 $500
$100 $185 $144
$112 $137
$0
2012-13 2013-14 2014-15 2015-16 2016-17 0
$50
$40
13
$30FILM PRODUCTION: VISUAL EFFECTS (CONTINUED)
But not all jurisdictions are, or have needed to be, as generous as British Columbia to attract
and/or retain VFX work. With a comparatively modest 20 percent incentive, New Zealand has
been able to lure extremely large VFX projects.
Thanks to government disclosure in New Zealand,19 home of Weta Digital™, which is one
of the largest VFX companies in the world, it’s possible to get a close look at spending
dedicated solely to VFX. Below is a sample of VFX spending by films in recent years that did
all of their live-action principal photography outside of New Zealand, but some or all of their
VFX and other postproduction work in the nation.
TABLE 4:
NEW ZEALAND / WETA VFX SPENDING
MOVIE Amount Spent in New Zealand Incentive Amount
War for the Planet of the Apes $131 million ($95M U.S.) $26 million ($19M U.S.)
Valerian $74 million ($54M U.S.) $15 million ($11M U.S.)
Guardians of the Galaxy Vol. 2 $39 million ($28M U.S.) $8 million ($6M U.S.)
The BFG $89 million ($64M U.S.) $18 million ($13M U.S.)
Alvin & the Chipmunks 4 $60 million ($43M U.S.) $12 million ($9M U.S.)
Fast & Furious. 7 $29 million ($21M U.S.) $6 million ($4M U.S.)
Dawn of the Planet of the Apes $101 million ($73M U.S.) $17 million ($12M U.S.)
On a film in the Planet of the Apes franchise, a single VFX house like Weta will employ hundreds of
people. On War for the Planet of the Apes, roughly 800 VFX artists, producers and managers worked
on the film and an additional 200 people provided support and information technology services.
Moreover, VFX jobs tend to last much longer than on-set jobs tied to physical production. For
example, principal photography for the live-action filming on War for the Planet of the Apes lasted for
six months; the VFX work for the film, on the other hand, took “a year and a half,” according to Dan
Lemmon, the film’s VFX Supervisor.20
New Zealand’s 20 percent incentive for VFX translated into an efficient tool for job creation and local
economic impact. For $18 million in tax credits awarded to War for the Planet of the Apes, New
Zealand benefited from over 800 jobs in VFX and $95 million in direct spending in the economy. By
way of comparison, the $18 million in tax credits awarded by California to A Wrinkle in Time yielded
a total of 378 jobs for cast & crew, plus a large number of indirect support jobs with $85 million in
qualified spending.
19
New Zealand Film Commission, Large Budget Screen Production Grants and New Zealand Screen Production Grants paid between 2010 and 2018:
https://www.nzfilm.co.nz/resources/lbspg-nzspg-international-grants-approved-1-jan-2010-1-jan-2018
20
Verhoeven, Beatrice. “’War for the Planet of the Apes’: How the VFX Team Created the Most Realistic Apes Yet.” TheWrap. July 17, 2017. Accessed May 01, 2018.
https://www.thewrap.com/war-for-the-planet-of-the-apes-vfx-team-more-real/
Photo: 20th Century Fox ©As the following table illustrates, California and the U.S. has ceded its position as a world leader in creating
cutting edge VFX to other locations, namely Canada and the U.K.
TABLE 5:
VFX LOCATIONS FOR TOP 25 $100M+ LIVE ACTION FILMS IN 2017
Budget
MOVIE (millions)
Primary VFX Location(s) Secondary VFX Location(s)
Star Wars: The Last Jedi $317,000,000 ILM (U.K., CA) StereoD (Canada, CA)
Justice League $300,000,000 Scanline (Canada) MPC (UK), Weta Digital (NZ), Pixomondo (Canada, Germany),
RodeoFX (Canada) Dneg (UK, Canada)
Transformers: The Last Knight $260,000,000 ILM (CA, UK) MPC (UK), Scanline (Canada), Prime Focus (India)
The Fate of the Furious. $250,000,000 Digital Domain (Canada, CA) Dneg (UK, Canada), Pixomondo (Canada, Germany)
Pirates of the Caribbean: Dead Men Tell $230,000,000 MPC (Canada, UK) Atomic Fiction (Canada), Rodeo FX (Canada),
No Tales Lola VFX (UK, CA)
Guardians of the Galaxy Vol. 2 $200,000,000 Weta (NZ), Framestore (U.K.), Third Floor, Trixter (Germany), Animal Logic (Australia),
Method (California, Canada) Scanline, Lola, Luma (Australia, CA), Stereo D (Canada)
The Mummy $195,000,000 MPC (UK, Canada) Dneg (UK, Canada), ILM (UK, CA), StereoD
Kong: Skull Island $185,000,000 ILM (Canada, CA) Hybride (Canada), Rodeo FX (Canada, CA),
Prime Focus (Canada, India)
Blade Runner 2049 $185,000,000 Dneg (Canada, UK), Framestore (Canada, UK) MPC (UK, Canada), StereoD (Canada)
Thor: Ragnarok $180,000,000 ILM (CA, Canada), Framestore (UK, Canada) The Third Floor (Canada, CA), Method Studios (Canada,
UK) Digital Domain (Canada, CA), Rising Sun Pictures
(Australia), Luma (Australia, CA), Iloura (Australia),
Trixter, Whiskytree (CA), Dneg (UK, Canada)
Valerian and the City of a Thousand Planets $180,000,000 Weta (NZ) ILM, Hybride (Canada), Rodeo FX (Canada, CA),
Mikros Image (France, Canada), Southbay (CA)
Spider-Man: Homecoming $175,000,000 Sony Imageworks (Canada), Luma (Australia, CA), Method (CA),
Digital Domain (Canada, CA) Trixter, Lloura (Australia), Cantina Creative (CA),
The Third Floor (CA, UK), StereoD (Canada)
King Arthur: Legend of the Sword $175,000,000 Framestore (UK, Canada), MPC (Canada, UK) Prime Focus (India), Nvizible (UK),
Method Studios (CA), One of Us (UK)
Beauty and the Beast $244,000,000 Framestore (UK, Canada). Lola VFX (UK, CA)
Digital Domain (Canada)
The Great Wall $150,000,000 ILM (Sigapore), Weta (New Zealand) Hybride (Canada), Third Floor (CA, UK)
Dunkirk $116,000,000 - Dneg (UK, Canada)
$135,000,000
War for the Planet of the Apes $150,000,000 Weta (New Zealand) Exceptional Minds (CA), Halon (CA)
Wonder Woman $150,000,000 MPC (Canada, UK), Dneg (Canada, UK) Pixomondo (Canada, Germany), Weta (New Zealand)
Third Floor (CA)
Logan $127,000,000 Rising Sun Pictures (Australia), Soho VFX (Canada), Lola VFX (CA)
Image Engine (UK, Canada)
Monster Trucks $125,000,000 MPC (Canada, UK) Lola VFX (CA), Industrial Pixel VFX (CA),
Prime Focus (India)
Geostorm $120,000,000 Framestore (Canada, UK), Dneg (Canada, UK) Hydraulx (CA), Electric Effects, Stereo D (Canada),
Scanline, Soho VFX (Canada) Third Floor (CA)
Based on a review of the top 25 live-action films with the largest budgets over the last five years, the situation
for the California VFX industry was strongest in 2013 and, with the exception of 2015, has steadily declined.
In 2017, California VFX houses saw only a marginal improvement over the prior year, with primary VFX work on
six films in 2017 compared to just five in 2016.
TABLE 6:
PROJECT COUNT FOR PRIMARY VFX WORK ON TOP 25 LIVE-ACTION FILMS, 2013-2017
Primary VFX Location Primary VFX Location Primary VFX Location Primary VFX Location Primary VFX Location
PRODUCTION CENTER 2013 Movies 2014 Movies 2015 Movies 2016 Movies 2017 Movies
California 10 7 9 5 6
Canada 7 10 14 17 16
UK 7 11 15 9 15
15FILM PRODUCTION: MUSIC SCORING
As for music scoring, California was the primary location for musical work for 37 of the 100 films in
this year’s study, a 37 percent share. This is a slight improvement over last year, when the state’s
share was just 35 percent. California captured scoring work for 39 percent of the surveyed films in
2015, 41 percent in 2014 and 40 percent in 2013.
The average film employs 75 musicians and spends from $1.2 million for a $65 million film to over
$3 million on large-budget film with a budget of $150 or more.21
FILM INCENTIVE PROGRAMS
With the exception of New York and Louisiana22, all of California’s top five competitors offer
substantial uncapped film incentive programs. Full or partial film incentive award amounts to
individual productions were available for 46 of the films in this study (see Appendix A for complete
list of incentive award amounts). In all, these 46 films received at least $702 million from various
state/provincial and national governments.
The emergence of Australia as a production center for U.S. producers in 2017 provides a good
example of what foreign governments—at both the national and local level—offer in order to attract
major U.S. productions. Until 2018, Australia offered a 16.5 percent incentive for live-action location
filming done by foreign productions from the U.S. and elsewhere. Because the rate of this incentive
was not as competitive as many foreign jurisdictions, the federal government would supplement
the incentive with grants awarded on an individual basis to raise the 16.5 percent incentive rate to a
more competitive 30 percent.
In 2017, three big-budget films (Thor: Ragnarok, Pirates of the Caribbean: Dead Men Tell No Tales
and Alien: Covenant) filmed in Australia and did a significant amount of their VFX there as well. For
Alien: Covenant, the Australian Federal Government approved a $14 million grant (A$19.3 million) to
compliment an estimated tax credit of $17 million, for a combined total of $31 million in incentives
at the federal level. The $31 million awarded to Alien: Covenant represents 30 percent of the $105
million the film is estimated to have spent in Australia.
For Thor: Ragnarok and Pirates of the Caribbean: Dead Men Tell No Tales, company financial
filings in Australia provide even greater detail about incentives awarded to the two films at both the
Australian federal and state levels.
TABLE 7:
COMPARING AUSTRALIAN INCENTIVES
Pirates of the Caribbean:
AUSTRALIAN INCENTIVE Thor: Ragnarok
Dead Men Tell No Tales
Federal Tax Incentive $22 million (A$30.3M) $26 million (A$36.7M)
Federal Grant $18 million (A$24.76M) $15.4 million (A$21.6M)
Queensland State Payroll Tax Rebate $2.8 million (A$3.87M) $2.5 million (A$3.48M)
Screen Queensland Production $8.4 million (A$11.62M) $2.8 million (A$4M)
Incentive
Gold Coast (Queensland) Grant $145,000 (A$200,000) N/A
TOTAL $52 million (A$71M) $48 million (A$66M)
The $52 million (A$71M) in combined Australian federal and state incentives given to
Thor: Ragnarok represents 38.5 percent of the $135 million (A$185M) spent by the film while
shooting there. The $48 million (A$66M) in combined Australia federal and state incentives
given to Pirates of the Caribbean: Dead Men Tell No Tales represents 30 percent of the $160
million spent by the film while shooting there.
21
Laane, “Keeping the Score” pg. 3: http://www.laane.org/wp-content/uploads/2014/12/Keeping_the_Score-Full_Report.pdf
22
In 2015, Louisiana capped the amount of film tax credits that can be redeemed in a single year at $180 million. Previously, the state’s incentive was uncapped.
16TABLE 8:
COMPARISON OF FILM INCENTIVE PROGRAMS IN TOP LOCATIONS
LOCATION FILM INCENTIVE
California 20-25% on qualifying Below-the-Line costs on first $100 million of qualified spend. Additional
5% uplift for music, visual effects and filming outside of the Los Angeles zone. Above-the-line
costs are excluded. Annual cap of $330 million.
Canada 16% of Canadian labor expenditures.
Can be combined with Provincial incentives. No annual cap.
Canada (British Columbia) 28% of qualifying British Columbia (BC) labor expenditures; Digital Animation or Visual Effects (DAVE) Credit
bonus: 16% additional credit on qualifying DAVE labor. No annual cap.
Canada (Ontario) 21.5% of qualifying Ontario expenditures (not limited to ON labor); Bonuses: Computer Animation and Special
Effects- 20% of qualifying labor related to digital animation and special effects work. No annual cap.
Canada (Quebec) 25% of qualifying Quebec (QC) expenditures (not limited to QC labor); Bonuses: QC Computer Animation and
Special Effects Tax Credit = 20% additional credit on qualifying animation and special effects QC labor. No
annual cap.
Georgia 20% of the base investment in the state, plus. 10% if the qualified production activities include
a Georgia promotional logo in credits. ATL and BTL costs are covered. No annual cap.
Louisiana 30% (45% maximum with bonus) on qualifying local spend for BTL and Above-the-Line (ATL)
costs. Bonus: 10% for each individual LA resident (mU.S.t have residency form and backup for
each LA resident). Bonus: 15% of base investment for qualifying Louisiana screenplay
Bonus: 15% of music expenditures for qualifying Louisiana music. Annual cap of $180 million until 2018.
New York 30% on qualifying local spend for Below-the-Line (BTL) costs. Extra 10% for shooting upstate.
Above-the-Line costs are excluded from the incentive. Annual cap of $420 million.
U.K. 20-25% of all qualifying local U.K. spend. ATL and BTL costs are covered, as well as back-end
profit participation payments. No annual cap.
Among the world’s top production centers, there is clearly a willingness to invest in attracting film & television
production. However, since the ability of most locations to lure productions depends on a stable incentive
program, and the current trend in many jurisdictions has been to limit or eliminate programs like film tax
credits, the biggest factor keeping top production centers in the game will be their ability to sustain these
investments.
Louisiana, which was once the number one location in the world in the first FilmL.A. feature film study,
serves as a cautionary tale. After spending over $1 billion over the course of a decade and faced with budget
shortfalls, Louisiana reduced the rate of its incentive, limited the types of costs that could qualify under the
program and placed a $180 million annual cap on the incentive in 2015, which had previously been uncapped.
As a result of the changes, production activity in Louisiana fell dramatically.
With Georgia’s film incentive investment now exceeding $800 million (the most expensive program in North
America) and the U.K.’s investment exceeding $820 million (the most expensive in the world), the ability and
willingness to keep these programs in place will be a critical factor affecting a given location’s future ranking in
FilmL.A. reports.
TABLE 9:
COST OF FILM INCENTIVE IN TOP PRODUCTION CENTERS
PRODUCTION CENTER INCENTIVE AMOUNT (MOST RECENT YEAR) ANNUAL COST FIVE YEARS AGO
California $330 million $100 million
British Columbia $557 million (CAD) 23 $280 million (CAD)
Georgia $800 million 24 $232 million
New York $420 million $420 million
Ontario $428 million (CAD) 25 $267 million (CAD)
U.K. £578 million 26
($822M U.S. Dollars) £203 million ($289M U.S. Dollars)
23
Creative BC, Impact Report 2016-2017, pg. 33
24
Georgia Performance Measures Report, pg. 34 http://bcbudget.gov.bc.ca/2018/bfp/2018_Budget_and_Fiscal_Plan.pdf
25
OMDC, Tax Credit Statistics for 2016/17: http://www.omdc.on.ca/Assets/Tax+Credits/English/Tax+Credit+Statistics/Tax+Credit+Applications+Received+and+Certificates+Issued+in+2016-17_en.jpg
26
HM Revenue & Customs, Creative Industries Statistics, July 2017:
https://www.gov.uk/government/uploads/system/uploads/attachment_data/file/630501/July_2017_Commentary_Creative_Industries_Statistics2.pdf
17Photo: Philip Pilosian / Shutterstock.com
CONCLUSION
With the underlying economics of the U.S. motion picture industry unchanged since our
previous report, a look at last year’s top-performing films yields few surprises. Feature films –
particularly the most expensive, VFX-heavy tent pole projects, continue to be made in areas
offering competitive film production incentives.
Despite California’s ranking in this report, the state is better positioned to remain competitive
under the state’s improved film & television tax credit program than it was with the original
program, which excluded films with budgets over $75 million. Over the next two years, A
Wrinkle in Time, Bumblebee, Captain Marvel and other key projects that qualified for the
California Film & Television Tax Credit Program 2.0 will help increase California’s share of top
100 films.
Moreover, California’s position in creating major projects for online streaming services like
Netflix and Amazon with films like Bright and The Cloverfield Paradox (which also received
the state’s film incentive) is also likely to remain competitive. While these streaming films
will not have an impact on the future FilmL.A. reports about the top 100 theatrical films, they
have a major impact on the local economy in terms of jobs and spending.
While California finished fourth in overall project count in this year’s study, the Golden State
is still the world’s top film & television production center. Thanks to the continued support of
the California Film & Television Tax Credit Program, the state’s status as the entertainment
capital of the world should be secure for the foreseeable future.
18STUDY OVERSIGHT
Creation and approval of FilmL.A. Research reports
is overseen by a Research Taskforce organized
by the FilmL.A. Board of Directors, which includes
executives from major studios, industry unions and
guilds, staff from the California Film Commission,
the Motion Picture Association of America, the
Independent Film & Television Alliance, and the Los
Angeles Economic Development Corporation. The
arguments and conclusions advanced in this study
are wholly FilmL.A.’s and do not reflect the opinions
or positions of individual board or review committee
members or of their respective employers.
IDENTIFYING SOURCES ANALYZING BUDGETS
There are now several robust, credible and valuable Determining where filmmakers spend their budgets
online databases that offer employment information, is very difficult, as full production budgets are rarely
budget estimates, shooting locations, studio disclosed. Complicating matters, most feature films
involvement and box-office performance for major produced today use multiple locations throughout
feature films. every stage of development. One of the challenges
when determining the total budget for a given movie
In addition, various spending amounts, budget (especially for locations that do not provide project
information and film incentive award amounts for level detail in their incentive programs) is that some
several of the movies in this study are reported budget estimates that are reported in the press
by credible media outlets and/or disclosed by reflect the net cost to the studio, and not necessarily
filmmakers themselves. the full amount spent to make the project.
When compiling information about surveyed films in A good example of this is the 2015 film,
this report, FilmL.A. initially relies on widely reported Daddy’s Home,27 which was reported in industry
budget figures compiled in news reports and public trade publications as having a $50 million budget.
sources like Box Office Mojo. Often, these amounts For the studio, this amount is fairly precise, as the
are budget estimates, which tend to understate the out of pocket cost for the studio itself was $53
actual cost of the production. million. However, the gross (i.e. actual) cost of
the film was $69 million. The other $16 million of
After the initial data is compiled, FilmL.A. adjusts the the actual cost was financed by Louisiana’s film
reported budgets for films where complete budget incentive.
information is available from other sources, typically
transparency reports from various state film offices For the dozens of films FilmL.A. has surveyed over
and company filings in international locations like the last four years where final confirmed budgets
the U.K. and New Zealand. Since public reports and/ were available, the vast majority of reported budget
or company financial filings from many jurisdictions estimates in industry trades and other news
may not report needed information by the time publications for these same films underestimate the
of publication, FilmL.A. reports the information actual cost of the film.
available at the time and will update amounts in this
and older reports periodically as new information 27
Final audited production budget information was provided by the Louisiana
becomes available. Economic Development Department.
19SOURCES
ANNUAL FILM TAX CREDIT/TRANSPARENCY REPORTS:
British Columbia
Connecticut
Florida
Hawaii
Louisiana
Massachusetts
Michigan
New York
New Zealand
North Carolina
Ontario
Pennsylvania
Quebec
Texas
United Kingdom
Utah
ONLINE DATABASES:
Baseline Studio System
Box Office Mojo
Development Leads
IMDbPro
Variety Insight
OTHER:
Amber Kling
The Animation Guild, I.A.T.S.E. Local 839
American Federation of Musicians, Local 47
CreativeBC
British Film Institute
California Film Commission
Canadian Media Production Association
Connecticut Department of Economic Development
DreamWorks Animation
Industrial Light & Magic
Los Angeles Economic Development Corporation
Louisiana Department of Economic Development
Luma Pictures
Major news & media outlets
Motion Picture Association of America
Screen Australia
Steve Kaplan, The Animation Guild
Walt Disney Pictures
Warner Bros.
20MOVIES OF 2017 (APPENDIX A):
LOCATION, SPENDING, AND INCENTIVE LIST
Budget Est. Primary Secondary Location Spending Incentive Amount Scored in
FILM TITLE Shoot Start Shoot Wrap
(millions) Location Location(s) (millions) (millions) California
47 Meters Down $5,270,000 06/15/2015 08/15/2015 UK Dominican Republic $5 (UK) $720k (UK)
A Bad Moms Christmas $28,000,000 05/01/2017 06/17/2017 Georgia
A Dog's Purpose $22,000,000 08/17/2015 11/2015 Canada, Winnipeg
$104 (Australia), $31 (Australia),
Alien: Covenant $111,000,000 04/04/2016 07/19/2016 Australia
$9.6 (NZ) $2 (NZ)
All Eyez on Me $40,000,000 12/17/2015 03/01/2016 Georgia New York, California
All the Money in the World $40,000,000 05/29/2017 08/01/2017 Italy Jordan, UK
Italy, Hungary,
American Assassin $63,000,000 09/12/2016 12/16/2016 UK $63.4 (UK) $11.4 (UK)
Turkey, Malta
American Made $50,000,000 05/18/2015 09/2015 Georgia Colombia
Annabelle: Creation $17,400,000 06/27/2016 08/15/2016 California $17.4 $2.4
Atomic Blonde $30,000,000 11/22/2015 02/13/2016 Hungary Germany $16.7 (Hungary) $4.1 (Hungary)
Baby Driver $34,000,000 02/20/2016 05/08/2016 Georgia $30 $10
Baywatch $65,000,000 02/25/2016 05/18/2016 Georgia Florida
$231.5 (UK),
Beauty and the Beast $244,000,000 05/18/2015 08/21/2015 UK NY (VFX) $45.46 (UK), $3 (NY)
$12.5 (NY)
Blade Runner 2049 $185,000,000 07/04/2016 11/10/2016 Hungary UK $97 (Hungary) $24 (Hungary)
Captain Underpants: The First
$39,000,000 04/04/2016 03/2017 California
Epic Movie
Cars 3 $175,000,000 2016 03/2017 California
Coco $175,000,000 08/2016 08/2017 California
Daddy's Home 2 $70,000,000 03/20/2017 05/24/2017 Massachusetts
Darkest Hour $30,000,000 10/30/2016 01/06/2017 UK $30 $6
Despicable Me 3 $80,000,000 04/2016 03/2017 France
Downsizing $76,000,000 04/04/2016 08/05/2016 Canada, Ontario Nebraska, California
$116,000,000- UK, Netherlands,
Dunkirk 05/23/2016 09/07/2016 France $1.08 (NL)
$135,000,000 California
Everything, Everything $10,000,000 08/29/2016 10/10/2016 Canada, Vancouver Mexico
Ferdinand $111,000,000 07/2016 09/2017 Connecticut
Fifty Shades Darker $55,000,000 02/19/2016 07/19/2016 Canada, Vancouver France
Fist Fight $22,000,000 09/28/2015 11/13/2015 Georgia
Geostorm $120,000,000 10/22/2014 02/10/2015 Louisiana $88 $27
Get Out $4,500,000 02/16/2016 03/10/2016 Alabama New York
Ghost in the Shell $110,000,000 02/2016 06/26/2016 New Zealand California, China $83 (New Zealand) $21 (New Zealand)
Gifted $7,000,000 10/07/2015 11/20/2015 Georgia $2.1 in NY $500k (NY)
Girls Trip $20,000,000 06/27/2016 07/22/2016 Louisiana $18 $6
Going in Style $25,000,000 08/03/2015 10/01/2015 NY $26 $6
$75 (GA) $23 (GA),
Guardians of the Galaxy Vol. 2 $200,000,000 02/17/2016 06/17/2016 Georgia New Zealand (VFX)
$28 (New Zealand) $6 (New Zealand)
Happy Death Day $5,000,000 11/07/2016 12/13/2016 Louisiana $6
Home Again $15,000,000 10/24/2016 12/07/2016 California
Hostiles $39,000,000 New Mexico
21You can also read