Interim Report and Accounts 2017 - Interim Report 2017 Cover
←
→
Page content transcription
If your browser does not render page correctly, please read the page content below
169771 Johnson Service Group - Interim Report 2017 Cover_169771 Johnson Service Group - Interim Report 2017 Cover 11/09/2017 13:34 Page 1

          Johnson House,
                                                                                                                                            Interim Report
          Abbots Park, Monks Way
          Preston Brook
          Cheshire WA7 3GH
                                                                                                                                             and Accounts
          Tel:   +44 (0)1928 704 600
          Fax: +44 (0)1928 704 620
          Email: enquiries@jsg.com                                                                                                                   2017
169771 Johnson Service Group - Interim Report 2017 Cover_169771 Johnson Service Group - Interim Report 2017 Cover 11/09/2017 13:34 Page 2

          Johnson Service Group PLC Interim Report and Accounts 2017                                                                                                                                                                                 Interim Report and Accounts 2017 Johnson Service Group PLC

          THE LEADING NAME
          IN TEXTILE RENTAL

                                                                                                                                            Electronic Communications
                                                                                                                                            The Company offers Shareholders the                 If you would like to receive electronic                 Design: mediasterling.com
                                                                                                                                            opportunity to receive communications such as       communications, you will need to register your          Production: sterlingfp.com
                                                                                                                                            notices of Shareholder meetings and the annual      email address by accessing the Shareholder
                                                                                                                                            report and accounts electronically. The Company     Services page within the Investor Relations             This annual report is printed using vegetable
                                                                                                                                            encourages the use of electronic communication      section of the Company’s website at                     inks on paper from an ISO 14001 certified
                                                                                                                                            as, not only does it save the Company printing      www.jsg.com.                                            manufacturer, and is made with ECF pulp
                                                                                                                                            and mailing costs, it is also a more convenient                                                             sourced from carefully managed and
                                                                                                                                            and prompt method of communication.                 This will link you to the service offered by the        renewed forests.
                                                                                                                                                                                                Company’s Registrar. If you decide not to register
                                                                                                                                            If you decide to receive communications             an email address with the Registrar, you will
                                                                                                                                            electronically, you will be sent an email message   continue to receive all communications in hard
                                                                                                                                            each time a new Shareholder report or notice        copy form.
                                                                                                                                            of meeting is published. The email will contain
                                                                                                                                            links to the appropriate website where              Those Shareholders who are CREST members
                                                                                                                                            documents can be viewed. It is possible             and who wish to appoint a proxy or proxies
                                                                                                                                            to change your instruction at any time by           utilising the proxy voting service please refer to
                                                                                                                                            amending your details on the register.              Note 2 of the Notice of Annual General Meeting.

                                                                                                                                            If you have any queries regarding electronic communications, please contact the Company’s registrar,
                                                                                                                                            Capita Asset Services, on 0871 664 0300 (calls cost 12p per minute plus network extras, lines are
                                                                                                                                            open 9.00am-5.30pm Mon-Fri).
Interim Report and Accounts 2017 Johnson Service Group PLC 1

OPERATIONAL AND FINANCIAL REVIEW

             Introduction                                                   Finances
             Johnson Service Group has delivered another strong             Total net debt at 30 June 2017 was £90.0 million
             performance. This encouraging outcome reflects the             (December 2016: £98.2 million), slightly better than
             progress we have made over the last five years or so to        management expectations, and reflected the strong
             develop the Group, refocusing on its textile rental            trading performance in the first half together with the
             activities and subsequently expanding its activities in this   receipt of proceeds from the sale of the Drycleaning
             area. The sale of the Drycleaning business in January          business in January 2017. The Group’s net debt to
             completed this transition and leaves us wholly focused on      adjusted EBITDA leverage ratio was 1.7x at the end of
             textile rental services, consisting of workwear rental, and    June 2017.
             linen services to the hotel, restaurant and hospitality
             sectors.                                                       The Group has a £120.0 million revolving credit bank
                                                                            facility which is considerably in excess of the anticipated
             Our acquisition and integration strategy has been key to       level of borrowings, with comfortable cover on all bank
             the Group’s successful growth, as is our ongoing               covenants for the foreseeable future. The facility matures
             investment programme. Together, they are driving synergy       in April 2020.
             benefits, operational efficiencies and improved customer
             service within JSG. We will continue to expand our             Interest cover based on adjusted operating profit was
             presence organically as well as through further                11.6 times (June 2016: 9.7 times), with interest costs on
             acquisitions in our chosen marketplaces while striving to      our floating rate borrowings continuing to benefit from
             maintain the high service levels that help put us at the       the current low levels of LIBOR. Two hedging
             forefront of our industry.                                     arrangements, each for £15.0 million of borrowings, are in
                                                                            place whereby LIBOR is replaced by a fixed rate of
             Financial Results                                              1.4725% for the period January 2016 to January 2019
             The Group’s continuing revenue for the six months to           and 1.665% for the period January 2016 to January
             30 June 2017 increased by 19.3% to £138.0 million              2020. Two further hedging arrangements, each for
             (June 2016: £115.7 million). This was driven by strong         £10.0 million, were entered into at the end of June 2016
             organic growth of some 4.8% and a full six months of           whereby LIBOR is replaced by a fixed rate of 0.49% to
             trading from the acquisitions completed in 2016.               June 2018 and 0.5525% to June 2019.
             Adjusted operating profit increased by 20.0% to
             £18.6 million (June 2016: £15.5 million).                      Pension Deficit
                                                                            The recorded net deficit after tax for all post-employment
             Adjusted profit before taxation increased to £16.8 million     benefit obligations, calculated in accordance with
             (June 2016: £13.6 million) after net finance costs of          IAS 19R, has reduced to £7.9 million at June 2017 from
             £1.8 million (June 2016: £1.9 million). The underlying tax     £14.8 million at December 2016. The reduction is due, in
             rate was 19.4% (June 2016: 20.3%).                             part, to the higher than expected returns on scheme
                                                                            assets offset by the net impact of lower Corporate Bond
             There were no exceptional items in the first half of 2017      yields and lower inflation on the valuation of scheme
             (June 2016: £0.7 million). The statutory profit before tax     liabilities.
             after amortisation of intangible assets (excluding
             software amortisation) of £3.9 million (June 2016:             The current agreement with the Trustee of the defined
             £3.0 million) increased by 30.3% to £12.9 million (June        benefit pension scheme requires deficit recovery
             2016: £9.9 million).                                           payments of £1.9 million in the year to December 2017,
                                                                            of which £0.9 million was contributed during the first half.
             Continuing adjusted fully diluted earnings per share           In addition to this agreed schedule of contributions a
             increased by 15.6% to 3.7 pence (June 2016:                    further payment of £1.5 million was made to the pension
             3.2 pence). Fully diluted earnings per share from              scheme in April 2017.
             continuing operations after amortisation of intangible
             assets (excluding software amortisation) and exceptional       The triennial actuarial valuation of the defined benefit
             items increased to 2.8 pence (June 2016: 2.3 pence).           scheme as at 30 September 2016 has recently been
                                                                            finalised. Calculated under the more prudent technical
             Dividend                                                       provisions of the scheme the deficit has increased to
             Reflecting the Group’s strong performance and                  £39.3 million. However given the additional contribution
             prospects, the Board is pleased to increase the interim        of £1.5 million referred to above, the Trustee has agreed
             dividend by 12.5% to 0.9 pence (June 2016: 0.8 pence).         that ongoing deficit funding contributions will remain at
             This is in line with our progressive dividend policy, whilst   the current level of £1.9 million per annum.
             also maintaining satisfactory dividend cover.
                                                                            Acquisition of Professional Laundry Services (“PLS”)
             The interim dividend will be paid on 3 November 2017 to        After the period end, on 28 July 2017, we were pleased
             those Shareholders on the register of members at the           to add another well-established, high volume hotel linen
             close of business on 6 October 2017. The ex-dividend           business, through the acquisition of Clayfull Limited,
             date is 5 October 2017.                                        which trades as PLS. The consideration was £6.6 million,
                                                                            on a debt free, cash free basis and subject to an
2 Johnson Service Group PLC Interim Report and Accounts 2017
OPERATIONAL AND FINANCIAL REVIEW CONTINUED
adjustment for normalised working capital. We also Apparelmaster, the UK’s largest workwear brand,
purchased a freehold building used by PLS for an performed very strongly throughout the first six months of
additional £1.25 million. 2017 winning over 1,200 new customers (June 2016:
1,100) with average sales value to those customers
As reported in the management accounts for the year increasing by some 6%. We re-signed a number of large
ended August 2016, the business generated revenue of national accounts and customer retention levels were
£4.9 million and adjusted EBIT of £0.5 million. maintained at over 95%, a similar level to last year.
Based in Bonnyrigg, south of Edinburgh, PLS The business faced higher operating costs in the period
predominantly services the high volume hotel linen owing to the combined impact of the implementation of
market processing some 350,000 pieces of linen per the National Living Wage (“NLW”), rising fuel costs and
week and employing 130 staff. It operates across much contributions towards the Government’s Apprenticeship
of Scotland and also in the North East of England and so Levy. However, the additional revenue combined with
establishes the Group with a presence in high volume strong cost control mitigated their impact.
hotel linen in these areas.
We continue to actively manage Apparelmaster’s
We see scope for further growth and are planning to increasing volumes by transferring customers between
invest approximately £0.8 million in a new fully integrated processing facilities in order to ensure optimal
soiled linen sorting and automated bagging system to operational efficiencies. At the same time we progressed
support expansion. with its capital investment programme which will deliver
further production efficiencies as well as increased
OPERATIONAL HIGHLIGHTS capacity. The major refurbishments we are undertaking at
the Letchworth and Brighton facilities are nearing
Our Textile Rental business trades through a number of completion and we have increased capacity at our
very well recognised brands which service the UK’s Basingstoke facility. We will be starting a partial refit of
Workwear and Hotel Restaurant and Catering the Uttoxeter site in the second half of the year.
(“HORECA”) market sectors. The Group’s ‘Apparelmaster’
brand predominantly provides workwear rental and In order to ensure that we continue to meet the ever
laundry services to corporates across all industry sectors, increasing needs of our customers, we have adopted new
‘Stalbridge’ and ‘London Linen’ provide premium linen tablet technology for all of our customer-facing staff. In
services to the restaurant, hospitality and corporate particular a new online catalogue and automated sales
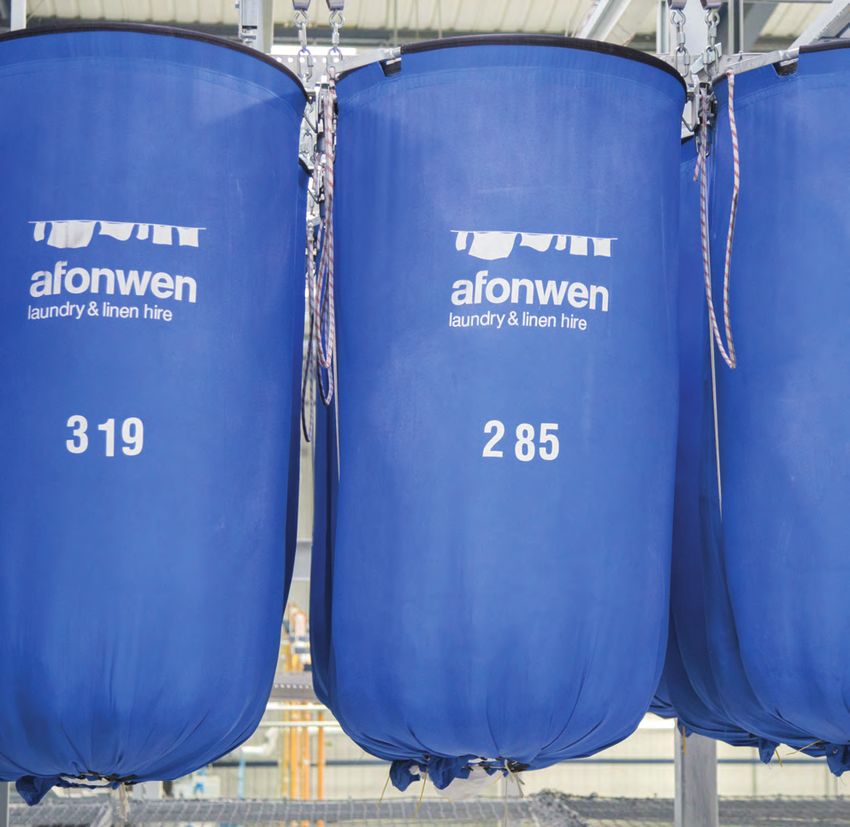
events market and ‘Bourne’ and ‘Afonwen’ provide high quotation system have been put in place to provide our
volume hotel linen services. Our newly acquired PLS account managers with a more holistic view of each
brand will complement our existing Bourne and Afonwen customer’s account and further new IT driven
brands. developments are planned.
The combined businesses performed very strongly Our internal training and development facility (The
throughout the first six months of the year generating Johnsons Academy) continues to improve the skill set of
revenue of £138.0 million (June 2016: £115.7 million), our workforce and foster the development of staff for
an increase of 19.3%. This £22.3 million increase future managerial positions. External training providers
includes an additional four months of trading from the have been supporting the Academy in providing best
acquisitions completed in 2016. We also saw strong practice service training techniques to ensure
underlying organic growth of some 4.8%, which included Apparelmaster maintains its reputation for service
the benefit of price increases. There was a one-off excellence in the industry.
benefit of approximately £1.0 million for work processed
on behalf of a privately owned laundry, whose operations Stalbridge enjoyed a very strong start to 2017, with both
have been disrupted by a fire. This work is expected to revenue and margin increasing substantially. This was
continue until October 2017 and has resulted in helped by high customer retention rates and a 50%
additional, high margin throughput for both Stalbridge increase in new sales year-on-year.
and Afonwen.
Contract caterers and facilities management companies
Adjusted operating profit from our Textile Rental remain a core market for Stalbridge and the business
businesses increased by £3.4 million to £20.7 million renewed a number of long term agreements. These
(June 2016: £17.3 million), representing an increase of included a supply agreement with the Ministry of Defence
19.7%, with the operating margin remaining constant at where a large scale reorganisation of its ‘soft service’
15.0% (June 2016: 15.0%). This was achieved despite supply across the country has already benefitted revenue
the inclusion of a full six months of trading from the high growth at Stalbridge, with further opportunities expected
volume hotel linen acquisitions completed in 2016, which to come through. A large number of Stalbridge’s
traditionally generate a much lower margin during the first customer base are smaller operations within the premium
quarter of the year. hotel, restaurant and catering sub-sectors who are more
discerning about quality and service. Stalbridge’s flexible
“no contract” terms play well in this marketplace and a
Interim Report and Accounts 2017 Johnson Service Group PLC 3

particular area of growth has been through the               Our high volume hotel linen offering operates under the
emergence of independent and pub groups that are food        Afonwen and Bourne brands, with PLS a newly added
and accommodation lead.                                      brand. Trading over the first six months has been very
                                                             strong in terms of new sales and interest from potential
We continue to increase operating efficiencies at            new customers although, as we re-tendered, market
Stalbridge through ongoing investment in modern plant        pricing has been very challenging for large contracts, with
and equipment and realigning customers’ work on a            competitors pricing to win volume. As a result, average
geographical basis. The Grantham site, acquired in           prices are generally slightly down compared to the
November 2015, benefited from the installation of a new      previous year. However, the benefits derived from
continuous batch washer, hydraulic press and high speed      operational savings and synergies have offset the pricing
ironer line, while a new high speed sheet and duvet ironer   effect and we have maintained margins.
line at our Glasgow facility, and the additional railing
systems for the storage of extra new work and enhanced       The management team continued to focus on improving
drying capacity for toweling products at our Sturminster     transportation efficiencies, successfully transferring work
site, have improved the operational performance of these     for a number of customers to the most local laundry site.
plants.                                                      This not only generates cost savings but also improves
                                                             our service delivery and reliability. At the same time, we
Given the high levels of sales growth and the speed at       have taken care to balance the output levels of each
which capacity has been reached at Grantham, we are          factory unit to optimise efficiency during the very busy
now considering adding further processing capacity in        summer months.
the North West of England and also opportunities to
service the London market more efficiently.                  Over the period, we reorganised the sales and customer
                                                             service activity at Afonwen and Bourne into a new
London Linen also increased revenue during the first six     national structure which is more streamlined and
months of the year despite some early pricing pressures      logistically more effective. This has been well received by
on major contracts when restauranteurs and catering          our major national and regional hotel customer groups.
companies were all facing significant cost pressures         The business has continued to retain a number of key
themselves due to NLW and property rates increases.          national accounts and has also further expanded and
                                                             developed its customer base, particularly across the
Operationally, the main focus of London Linen in the         corporate four star and budget hotel sectors.
period was the completion of the £4.5 million capital
investment programme at the Southall plant. The              The £3.5 million refit of the Chester site was successfully
investment has delivered a new mezzanine floor               completed on time and to budget and has created a more
containing highly automated conveyor systems, new            modern and efficient plant. We have achieved a 30%
ergonomically efficient sorting tables and an automated      improvement in pieces produced per operator whilst at
bag-loading system which transports soiled linen directly    the same time improving the quality and service in line
to two new continuous batch washers. Our capital             with our expectations.
investment programme was completed on schedule and
has helped to reduce operating costs as well as              We are focusing strongly on operational performance,
increasing production capacity.                              and in particular the use of scanning technology to
                                                             ensure consistency of product and quality assurance. We
London Linen also commenced a programme to fully             have installed scanners across our Birmingham and
co-ordinate the sales and service functions of its London    Chester sites in the first half of this year which has led to
Linen and London Workwear brands. We believe that this       improvements in customer perception and retention. We
initiative will enhance customer service and streamline      also want to ensure that all of our high volume linen
product offerings to customers.                              operations are fully integrated, deploying best working
                                                             practices across all sites. The integration journey is still
We are also pleased to report that we have secured a         ongoing and the next large project is a strategic review of
17,000 square foot site in an adjoining building to London   linen purchasing across the Afonwen, Bourne and PLS
Linen’s existing plant, which we plan to put into            brands so that we can standardise and improve the
operational use at a cost of some £2.0 million. We should    product specification for our customers and reduce
be able to achieve further benefits when this new unit is    purchasing costs by consolidating volumes.
fully operational, currently planned for the first half of
2018.                                                        TECHNICAL INNOVATION
Stalbridge and London Linen continue to work closely         We have started work on the in-house development of
together in order to ensure that the respective              new operating systems for both the workwear and high
businesses are utilising plant capacity efficiently and      volume hotel linen businesses. This project, which will
providing customers with optimal service levels and          incorporate the use of Microsoft Dynamics, is expected to
product.                                                     take two years until full implementation and will further
                                                             improve our operating systems and customer
                                                             engagement.
4 Johnson Service Group PLC Interim Report and Accounts 2017

OPERATIONAL AND FINANCIAL REVIEW CONTINUED

                                        EMPLOYEES                                                          Responsibility Statement
                                                                                                           The condensed consolidated interim financial statements
                                        Our teams have worked with skill, enthusiasm and                   comply with the Disclosure and Transparency Rules
                                        dedication and have helped to ensure that our customers            (‘DTR’) of the United Kingdom’s Financial Conduct
                                        receive market-leading service standards. We thank them            Authority in respect of the requirement to produce a half-
                                        for their significant contribution to another tremendous           yearly financial report. The interim report is the
                                        first half performance.                                            responsibility of, and has been approved by, the Directors.

                                        SUCCESSION                                                         The Directors confirm that to the best of their knowledge:

                                        In a separate statement issued today, we also announce             ➔ this financial information has been prepared in
                                        that after 33 years with the Group, Chris Sander, Chief              accordance with IAS 34, ‘Interim Financial Reporting’
                                        Executive Officer, has informed the Board of his intention           as adopted by the European Union;
                                        to retire in the first half of 2018. Chris is retiring at a time   ➔ this interim management report includes a fair review
                                        when the Group is in excellent shape and very well                   of the information required by DTR 4.2.7R (indication
                                        placed for continued growth.                                         of important events during the first six months and
                                                                                                             description of principal risks and uncertainties for the
                                        OUTLOOK                                                              remaining six months of the year); and
                                                                                                           ➔ this interim management report includes a fair review
                                        The Board is continuing to invest in increasing the                  of the information required by DTR 4.2.8R (disclosure
                                        production capacity of the business in order to take                 of related party transactions and changes therein).
                                        advantage of market opportunities as they arise.
                                                                                                           The Directors of Johnson Service Group PLC are listed in
                                        The acquisitions we have made over recent years, and               the Johnson Service Group PLC Annual Report for 2016.
                                        the latest purchase of PLS, based in Scotland, have                Details of the Directors are available on the Johnson
                                        expanded our services over a wider geographical area               Service Group PLC website: www.jsg.com
                                        and our integration strategy is enabling us to realise
                                        material distribution and synergy efficiencies. We have            By order of the Board
                                        further to go in achieving national coverage and we will
                                        continue to consider new expansion opportunities. The
                                        addition of PLS, together with continuing strong
                                        performance across all our existing brands gives us                Chris Sander                   Yvonne Monaghan
                                        confidence in the second half performance. We expect               Chief Executive Officer        Chief Financial Officer
                                        results for the full year to be slightly ahead of current          4 September 2017               4 September 2017
                                        market expectations.

                                       Forward Looking Statements
                                       Certain statements in these condensed consolidated interim financial statements constitute forward-looking
                                       statements. Any statement in this document that is not a statement of historical fact including, without limitation, those
                                       regarding the Company’s future expectations, operations, financial performance, financial condition and business is a
                                       forward-looking statement. Such forward-looking statements are subject to risks and uncertainties that may cause
                                       actual results to differ materially. These risks and uncertainties include, among other factors, changing economic,
                                       financial, business or other market conditions. These and other factors could adversely affect the outcome and
                                       financial effects of the plans and events described in these condensed consolidated interim financial statements. As a
                                       result you are cautioned not to place reliance on such forward-looking statements. Nothing in this document should be
                                       construed as a profit forecast.
Interim Report and Accounts 2017 Johnson Service Group PLC 5

CONSOLIDATED INCOME STATEMENT

                                                                                              Half year to                    Half year to                     Year ended
                                                                                                 30 June                         30 June                     31 December
                                                                                                     2017                            2016                            2016
                                                                                                      £m                              £m                              £m
                                                                         Note                                                 (Restated*)

Revenue from continuing operations                                         2                    138.0                           115.7                            256.7
Operating profit                                                           2                      14.7                            11.8                            29.8
Operating profit before amortisation of intangible assets
(excluding software amortisation) and exceptional items                                           18.6                            15.5                             37.7
Amortisation of intangible assets (excluding software
amortisation)                                                                                      (3.9)                           (3.0)                           (6.9)
Exceptional items                                                          3
– Costs in relation to business acquisition activity                                                   –                           (0.9)                           (1.2)
– Pension costs                                                                                        –                           (0.3)                           (0.3)
– Profit on disposal of freehold property                                                              –                            0.5                             0.5

Operating profit                                                           2                      14.7                            11.8                            29.8
Finance cost                                                                                       (1.6)                           (1.6)                           (3.3)
Notional pension interest                                                                          (0.2)                           (0.3)                           (0.6)

Total finance cost                                                                                 (1.8)                           (1.9)                           (3.9)
Profit before taxation                                                                            12.9                              9.9                           25.9
Taxation charge**                                                          4                      (2.5)                            (2.2)                          (5.0)
Profit for the period from continuing operations                                                  10.4                              7.7                           20.9
Result for the period from discontinued operations                                                   –                              0.4                           (0.3)
Profit for the period attributable to equity holders                                              10.4                              8.1                           20.6

Earnings per share                                                         7
Basic earnings per share
From continuing operations                                                                         2.8p                            2.3p                            6.0p
From discontinued operations                                                                          –                            0.1p                           (0.1p)
From total operations                                                                              2.8p                            2.4p                            5.9p

Fully diluted earnings per share
From continuing operations                                                                         2.8p                            2.3p                            5.9p
From discontinued operations                                                                          –                            0.1p                           (0.1p)
From total operations                                                                              2.8p                            2.4p                            5.8p

Adjusted basic earnings per share
From continuing operations                                                                         3.7p                            3.2p                            7.7p
From discontinued operations                                                                          –                            0.1p                            0.4p
From total operations                                                                              3.7p                            3.3p                            8.1p

Adjusted fully diluted earnings per share
From continuing operations                                                                         3.7p                            3.2p                            7.6p
From discontinued operations                                                                          –                            0.1p                            0.4p
From total operations                                                                              3.7p                            3.3p                            8.0p
The notes on pages 9 to 23 form an integral part of these condensed consolidated interim financial statements.

* The June 2016 Consolidated Income Statement has been restated to reflect the presentation of Drycleaning as a Discontinued Operation. See
  page 10 for further information.

** Including £0.7 million credit (June 2016: £0.6 million credit; December 2016 £1.5 million credit) relating to amortisation of intangible assets
   (excluding software amortisation) and £nil (June 2016: £nil; December 2016 £0.2 million credit) relating to exceptional items.
6 Johnson Service Group PLC Interim Report and Accounts 2017
CONSOLIDATED STATEMENT OF COMPREHENSIVE INCOME
Half year to Half year to Year ended
30 June 30 June 31 December
2017 2016 2016
Note £m £m £m
Profit for the period 10.4 8.1 20.6
Items that will not be subsequently reclassified to profit or loss
– Re-measurement and experience gains/(losses) on
post-employment benefit obligations 8 6.2 1.5 (3.5)
– Taxation in respect of re-measurement and experience
(gains)/losses (1.2) (0.3) 0.6
– Change in deferred tax due to change in tax rate – – (0.1)
Items that may be subsequently reclassified to profit or loss
– Cash flow hedges (net of taxation) – fair value loss (0.2) (0.7) (0.4)
– transfers to operating profit – 0.2 0.2
– transfers to finance cost 0.2 0.1 0.3
Other comprehensive income/(loss) for the period 5.0 0.8 (2.9)
Total comprehensive income for the period 15.4 8.9 17.7
CONSOLIDATED STATEMENT OF CHANGES IN SHAREHOLDERS’ EQUITY
Share Share Hedge Other Retained Total
Capital Premium Reserve Reserves* Earnings Equity
£m £m £m £m £m £m
Balance at 1 January 2016 33.1 14.5 (0.8) 2.2 57.8 106.8
Profit for the period – – – – 8.1 8.1
Other comprehensive (loss)/income for the period – – (0.4) – 1.2 0.8
Total comprehensive (loss)/income for the period – – (0.4) – 9.3 8.9
Share options (value of employee services) – – – – 0.4 0.4
Issue of share capital (net of costs) 3.3 0.1 – – 25.4 28.8
Dividend paid – – – – (4.8) (4.8)
Transactions with Shareholders
recognised directly in Shareholders’ equity 3.3 0.1 – – 21.0 24.4
Balance at 30 June 2016 36.4 14.6 (1.2) 2.2 88.1 140.1
Profit for the period – – – – 12.5 12.5
Other comprehensive income/(loss) for the period – – 0.5 – (4.2) (3.7)
Total comprehensive income for the period – – 0.5 – 8.3 8.8
Share options (value of employee services) – – – – 0.4 0.4
Current tax on share options – – – – 0.2 0.2
Issue of share capital (net of costs) 0.1 0.4 – – – 0.5
Dividend paid – – – – (2.9) (2.9)
Transactions with Shareholders recognised directly in Shareholders’ equity 0.1 0.4 – – (2.3) (1.8)
Balance at 31 December 2016 36.5 15.0 (0.7) 2.2 94.1 147.1
Profit for the period – – – – 10.4 10.4
Other comprehensive income for the period – – – – 5.0 5.0
Total comprehensive income for the period – – – – 15.4 15.4
Share options (value of employee services) – – – – 0.3 0.3
Current tax on share options – – – – 0.2 0.2
Issue of share capital (net of costs) 0.1 0.2 – – – 0.3
Purchase of shares by EBT** – – – – (0.1) (0.1)
Dividend paid – – – – (6.2) (6.2)
Transactions with Shareholders recognised directly in Shareholders’ equity 0.1 0.2 – – (5.8) (5.5)
Balance at 30 June 2017 36.6 15.2 (0.7) 2.2 103.7 157.0
* Other Reserves comprise a £1.6 million Merger Reserve and a £0.6 million Capital Redemption Reserve.
** The Group has an Employee Benefit Trust (EBT), to administer share plans and to acquire shares, using funds controlled by the Group, to meet
commitments to employee share schemes.Interim Report and Accounts 2017 Johnson Service Group PLC 7
CONSOLIDATED BALANCE SHEET
As at As at As at
30 June 30 June 31 December
2017 2016 2016
Note £m £m £m
Non-current assets
Goodwill 115.6 124.4 115.6
Intangible assets 44.0 52.1 47.9
Property, plant and equipment 82.2 82.9 81.7
Textile rental items 45.0 43.5 44.1
Trade and other receivables 0.3 0.4 0.3
Deferred income tax assets 2.2 3.1 4.2
289.3 306.4 293.8
Current assets
Inventories 2.4 2.7 2.2
Trade and other receivables 46.5 48.5 43.3
Cash and cash equivalents 6.5 5.4 2.9
Assets classified as held for sale – – 17.2
55.4 56.6 65.6
Current liabilities
Trade and other payables 61.3 66.1 60.6
Current income tax liabilities 3.9 4.0 4.3
Borrowings 24.5 17.9 19.9
Derivative financial liabilities 0.3 – 0.3
Provisions 2.2 4.6 1.9
Liabilities directly associated with assets classified as held for resale – – 9.4
92.2 92.6 96.4
Non-current liabilities
Post-employment benefit obligations 8 9.7 13.7 18.2
Deferred income tax liabilities 8.1 10.1 10.0
Trade and other payables 2.6 3.2 2.3
Borrowings 72.0 96.4 82.0
Derivative financial liabilities 0.5 1.4 0.5
Provisions 2.6 5.5 2.9
95.5 130.3 115.9
Net assets 157.0 140.1 147.1
Capital and reserves attributable to the company’s shareholders
Share capital 10 36.6 36.4 36.5
Share premium 15.2 14.6 15.0
Hedge reserve (0.7) (1.2) (0.7)
Other reserves 2.2 2.2 2.2
Retained earnings 103.7 88.1 94.1
Total equity 157.0 140.1 147.1
* Other Reserves comprise a £1.6 million Merger Reserve and a £0.6 million Capital Redemption Reserve.
The notes on pages 9 to 23 form an integral part of these condensed consolidated interim financial statements. The condensed consolidated interim
financial statements on pages 5 to 23 were approved by the Board of Directors on 4 September 2017 and signed on its behalf by:
Yvonne Monaghan
Chief Financial Officer8 Johnson Service Group PLC Interim Report and Accounts 2017
CONSOLIDATED STATEMENT OF CASH FLOWS
Half year to Half year to Year ended
30 June 30 June 31 December
2017 2016 2016
£m £m £m
Note (Restated*)
Cash flows from operating activities
Profit for the period 10.4 8.1 20.6
Adjustments for:
Taxation charge – continuing operations 4 2.5 2.2 5.0
– discontinued operations – 0.1 0.6
Total finance cost – continuing operations 1.8 1.9 3.9
– discontinued operations – 0.1 0.1
Depreciation of tangible fixed assets 23.3 19.9 44.5
Amortisation of intangible fixed assets 4.0 3.1 7.1
Revaluation of assets classified as held for sale – – 2.0
Profit on sale of tangible fixed assets – (0.3) –
(Increase)/decrease in inventories (0.2) 0.3 0.4
(Increase)/decrease in trade and other receivables (2.3) (0.8) 0.8
Increase in trade and other payables 1.6 3.0 0.9
Costs in relation to business acquisition activity – 0.9 1.2
Deficit recovery payments in respect of post-employment benefit obligations (2.4) (0.9) (1.9)
Share-based payments 0.3 0.4 0.8
Post-employment benefit obligations (0.1) (0.1) (0.1)
Decrease in provisions – (2.4) (4.4)
Cash generated from operations 38.9 35.5 81.5
Interest paid (1.5) (1.6) (3.0)
Taxation paid (3.9) (1.9) (5.9)
Net cash generated from operating activities 33.5 32.0 72.6
Cash flows from investing activities
Acquisition of business (net of cash and cash equivalents acquired) 11 – (57.2) (58.0)
Proceeds from sale of business (net of cash disposed) 12 6.0 – –
Purchase of property, plant and equipment (7.0) (5.1) (15.5)
Proceeds from sale of property, plant and equipment 0.1 0.6 0.6
Purchase of intangible assets – (0.1) –
Purchase of textile rental items (19.4) (16.9) (34.5)
Proceeds received in respect of special charges 1.2 1.5 2.7
Net cash used in investing activities (19.1) (77.2) (104.7)
Cash flows from financing activities
Proceeds from borrowings 54.0 68.0 88.0
Repayments of borrowings (62.0) (43.3) (69.3)
Capital element of finance leases (2.5) (2.6) (5.3)
Purchase of own shares by EBT (0.1) – –
Net proceeds from issue of Ordinary shares 0.3 28.8 29.3
Dividend paid (6.2) (4.8) (7.7)
Net cash generated from financing activities (16.5) 46.1 35.0
Net (decrease)/increase in cash and cash equivalents (2.1) 0.9 2.9
Cash and cash equivalents at beginning of period (1.5) (4.4) (4.4)
Cash and cash equivalents at end of period 14 (3.6) (3.5) (1.5)
Cash and cash equivalents comprise:
Cash 6.5 5.4 2.9
Overdraft (10.1) (8.9) (5.2)
Within assets classified as held for sale – – 0.8
Cash and cash equivalents at end of the period (3.6) (3.5) (1.5)
The notes on pages 9 to 23 form an integral part of these condensed consolidated interim financial statements.
* The June 2016 Consolidated Statement of Cash Flows has been restated to reflect the presentation of Drycleaning as a Discontinued Operation.
See page 9 for further information.Interim Report and Accounts 2017 Johnson Service Group PLC 9 NOTES TO THE CONDENSED CONSOLIDATED INTERIM FINANCIAL STATEMENTS Johnson Service Group PLC (the ‘Company’) and its subsidiaries (together ‘the Group’) provide textile rental and related services across the UK. The Company is incorporated and domiciled in the UK, its registered number is 523335 and the address of its registered office is Johnson House, Abbots Park, Monks Way, Preston Brook, Cheshire, WA7 3GH. The Company is a public limited company and has its primary listing on the AIM division of the London Stock Exchange. The condensed consolidated interim financial statements were authorised for issue by the Board on 4 September 2017. 1 Basis of preparation These condensed consolidated interim financial statements of the Group are for the six months ended 30 June 2017. They have been prepared in accordance with the Disclosure and Transparency Rules of the Financial Conduct Authority and with IAS 34, ‘Interim Financial Reporting’, as adopted by the European Union. The condensed consolidated interim financial statements have not been reviewed nor audited, nor do they comprise statutory accounts for the purpose of Section 434 of the Companies Act 2006, and do not include all of the information or disclosures required in the annual financial statements and should therefore be read in conjunction with the Group’s 2016 consolidated financial statements, which have been prepared in accordance with International Financial Reporting Standards as adopted by the European Union. Other than as set out in note 19, financial information for the year ended 31 December 2016 included herein is derived from the statutory accounts for that year, which have been filed with the Registrar of Companies. The auditors’ report on those accounts was unqualified, did not contain an emphasis of matter paragraph and did not contain a statement under Section 498 of the Companies Act 2006. Other than as described within note 19, financial information for the half year ended 30 June 2016 included herein is derived from the condensed consolidated interim financial statements for that period. Going Concern The Group currently meets its day-to-day working capital requirements through committed bank facilities which run to April 2020. Current economic conditions continue to create uncertainty, particularly over the level of demand for the Group's services. The Group’s latest forecasts and projections, taking account of reasonably possible changes in trading performance, show that there is not a substantial doubt that the Group should be able to operate within the level of its current facilities for a period of at least 12 months from the date of these condensed consolidated interim financial statements. As a consequence, and having reassessed the principal risks and uncertainties, the Directors considered it appropriate to adopt the going concern basis of accounting in preparing the condensed consolidated interim financial information. Discontinued operations The Consolidated Income Statement for the period ended 30 June 2016 has been restated, as shown below, to reflect the Drycleaning reporting segment being presented as a Discontinued Operation. The Consolidated Statement of Cash Flows for the same period has also been restated to analyse the income tax charge and finance income and expense between continuing and discontinued operations.
10 Johnson Service Group PLC Interim Report and Accounts 2017

NOTES TO THE CONDENSED CONSOLIDATED INTERIM FINANCIAL STATEMENTS
CONTINUED
1       Basis of preparation continued
The presentation of Drycleaning as a Discontinued Operation does not impact the Consolidated Statement of Comprehensive Income, Consolidated
Statement of Changes in Shareholders Equity or Consolidated Balance Sheet.

Half year to 30 June 2016                                                                                   As                                                As
                                                                                           Previously Reported              Adjustment                  Restated
                                                                                                           £m                      £m                        £m

Revenue                                                                                              137.6                    (21.9)                    115.7
Operating profit before amortisation of intangible
assets (excluding software amortisation) and exceptional items                                         16.1                     (0.6)                    15.5
Amortisation of intangible assets                                                                      (3.0)                       –                     (3.0)
Exceptional items:
– Costs in relation to business acquisition activity                                                    (0.9)                       –                     (0.9)
– Pension costs                                                                                         (0.3)                       –                     (0.3)
– Profit on freehold property disposal                                                                   0.5                        –                      0.5
Operating profit                                                                                       12.4                     (0.6)                    11.8
Total finance cost                                                                                     (2.0)                     0.1                     (1.9)
Profit before taxation                                                                                 10.4                     (0.5)                      9.9
Taxation                                                                                               (2.3)                     0.1                      (2.2)
Profit for the year from continuing operations                                                           8.1                    (0.4)                       7.7
Profit for the year from discontinued operations                                                           –                     0.4                       0.4
Profit for the period attributable to equity holders                                                     8.1                        –                      8.1

2       Segment analysis
Segment information is presented in respect of the Group’s operating segments, which are based on the Group’s management and internal reporting
structure as at 30 June 2017. These segments are the same as those included within the 2016 Annual Report. The chief operating decision-maker
has been identified as the Board of Directors (the ‘Board’). The Board reviews the Group’s internal reporting in order to assess performance and
allocate resources. The Board determines the operating segments based on these reports and on the internal reporting structure. For reporting
purposes, in accordance with IFRS 8, the Board aggregates operating segments with similar economic characteristics and conditions into reporting
segments, which form the basis of reporting in the Interim and Annual Reports.

The Board assesses the performance of the reporting segments based on a measure of operating profit, both including and excluding the effects of
non-recurring items from the reporting segments, such as restructuring costs and impairments when the impairment is the result of an isolated, non-
recurring or non-operating event. Interest income and expenditure are not included in the result for each reporting segment that is reviewed by the
Board. Segment results include items directly attributable to a segment as well as those that can be allocated on a reasonable basis, for example,
rental income received by Johnson Group Properties PLC is credited back, where appropriate, to the paying company for the purposes of segment
reporting. There have been no changes in measurement methods used compared to the prior year.

Other information provided to the Board is measured in a manner consistent with that in the financial statements. Segment assets exclude deferred
income tax assets, current income tax assets and cash and cash equivalents, all of which are managed on a central basis. Segment liabilities include
non-bank borrowings, but exclude deferred income tax liabilities, current income tax liabilities, bank borrowings and derivative financial liabilities all of
which are managed on a central basis. These balances form part of the reconciliation to total assets and liabilities.
Interim Report and Accounts 2017 Johnson Service Group PLC 11
2 Segment analysis continued
The reporting segment results for the half year ended 30 June 2017, together with comparative figures, are as follows:
Half year to 30 June 2017 Textile All Other
Rental Segments Total
£m £m £m
Revenue
Continuing 138.0 – 138.0
Discontinued –
Total Revenue 138.0
Result
Operating profit/(loss) before amortisation of intangible assets
(excluding software amortisation) 20.7 (2.1) 18.6
Amortisation of intangible assets (excluding software amortisation) (3.9) – (3.9)
Operating profit/(loss) 16.8 (2.1) 14.7
Total finance cost (1.8)
Profit before taxation 12.9
Taxation (2.5)
Profit for the period attributable to equity holders 10.4
Discontinued Textile All Other
Operations Rental Segments Total
£m £m £m £m
Balance sheet information
Segment assets 1.0 333.7 1.3 336.0
Unallocated assets: Deferred income tax assets 2.2
Cash and cash equivalents 6.5
Total assets 344.7
Segment liabilities (4.1) (72.9) (3.6) (80.6)
Unallocated liabilities: Bank borrowings (84.6)
Current income tax liabilities (3.9)
Deferred income tax liabilities (8.1)
Derivative financial liabilities (0.8)
Post-employment benefit obligations (9.7)
Total liabilities (187.7)
Other information
Non-current asset additions
– Property, plant and equipment – 6.5 – 6.5
– Textile rental items – 19.6 – 19.6
Depreciation and amortisation expense
– Property, plant and equipment – 5.8 0.1 5.9
– Textile rental items – 17.4 – 17.4
– Intangible software – 0.1 – 0.1
– Customer contracts – 3.9 – 3.912 Johnson Service Group PLC Interim Report and Accounts 2017
NOTES TO THE CONDENSED CONSOLIDATED INTERIM FINANCIAL STATEMENTS
CONTINUED
2 Segment analysis continued
Half year to 30 June 2016 (restated) Textile All Other
Rental Segments Total
£m £m £m
Revenue
Continuing 115.7 – 115.7
Discontinued 21.9
Total Revenue 137.6
Result
Operating profit/(loss) before amortisation of intangible assets
(excluding software amortisation) and exceptional items 17.3 (1.8) 15.5
Amortisation of intangible assets (excluding software amortisation) (3.0) – (3.0)
Exceptional items:
– Costs in relation to business acquisition activity (0.9) – (0.9)
– Pension costs – (0.3) (0.3)
– Profit on freehold property disposal 0.5 – 0.5
Operating profit/(loss) 13.9 (2.1) 11.8
Total finance cost (1.9)
Profit before taxation 9.9
Taxation (2.2)
Profit for the period from continuing operations 7.7
Profit for the period from discontinued operations 0.4
Profit for the period attributable to equity holders 8.1
Discontinued Textile All Other
Operations Rental Segments Total
£m £m £m £m
Balance sheet information
Segment assets 18.6 333.1 2.8 354.5
Unallocated assets: Deferred income tax assets 3.1
Cash and cash equivalents 5.4
Total assets 363.0
Segment liabilities (16.5) (75.8) (4.3) (96.6)
Unallocated liabilities: Bank borrowings (97.1)
Current income tax liabilities (4.0)
Deferred income tax liabilities (10.1)
Derivative financial liabilities (1.4)
Post-employment benefit obligations (13.7)
Total liabilities (222.9)
Other information
Non-current additions
– Property, plant and equipment 0.4 4.2 0.3 4.9
– Textile rental items – 15.9 – 15.9
– Intangible software – 0.1 – 0.1
Depreciation and amortisation expense
– Property, plant and equipment 0.7 4.4 0.1 5.2
– Textile rental items – 14.7 – 14.7
– Intangible software – 0.1 – 0.1
– Customer contracts – 3.0 – 3.0Interim Report and Accounts 2017 Johnson Service Group PLC 13
2 Segment analysis continued
Year ended 31 December 2016 Textile All Other
Rental Segments Total
£m £m £m
Revenue
Continuing 256.7 – 256.7
Discontinued 44.3
Total Revenue 301.0
Result
Operating profit/(loss) before amortisation of intangible assets
(excluding software amortisation) and exceptional items 41.7 (4.0) 37.7
Amortisation of intangible assets (excluding software amortisation) (6.9) – (6.9)
Exceptional items:
– Costs in relation to business acquisition activity (1.2) – (1.2)
– Pension costs – (0.3) (0.3)
– Profit on disposal of freehold property 0.5 – 0.5
Operating profit/(loss) 34.1 (4.3) 29.8
Finance cost (3.9)
Profit before taxation 25.9
Taxation (5.0)
Profit for the period from continuing operations 20.9
Result for the period from discontinued operations (0.3)
Profit for the period attributable to equity holders 20.6
Discontinued Textile All Other
Operations Rental Segments Total
£m £m £m £m
Balance sheet information
Segment assets 17.2 334.0 1.1 352.3
Unallocated assets: Deferred income tax assets 4.2
Cash and cash equivalents 2.9
Total assets 359.4
Segment liabilities (13.7) (74.6) (3.2) (91.5)
Unallocated liabilities: Bank borrowings (87.5)
Current income tax liabilities (4.3)
Deferred income tax liabilities (10.0)
Derivative financial liabilities (0.8)
Post-employment benefit obligations (18.2)
Total liabilities (212.3)
Other information
Non-current additions
– Property, plant and equipment 0.7 14.9 – 15.6
– Textile rental items – 35.4 – 35.4
Depreciation and amortisation expense
– Property, plant and equipment 1.4 10.4 0.3 12.1
– Textile rental items – 32.4 – 32.4
– Intangible software – 0.2 – 0.2
– Customer contracts – 6.9 – 6.914 Johnson Service Group PLC Interim Report and Accounts 2017
NOTES TO THE CONDENSED CONSOLIDATED INTERIM FINANCIAL STATEMENTS
CONTINUED
3 Exceptional items
Half year to Half year to Year ended
30 June 30 June 31 December
2017 2016 2016
£m £m £m
Continuing operations
Costs in relation to business acquisition activity – (0.9) (1.2)
Pension costs – (0.3) (0.3)
Profit on disposal of freehold property – 0.5 0.5
Total exceptional items – (0.7) (1.0)
Current year exceptional items
There are no exceptional items in the period to 30 June 2017.
Prior year exceptional items
Costs in relation to business acquisition activity
During the period to 31 December 2016, professional fees of £0.6 million, of which £0.4m related to the period to 30 June 2016, and Stamp Duty of
£0.3 million, all of which related to the period to 30 June 2016, were paid relating to the acquisitions of Zip Textiles (Services) Limited, Chester
Laundry Limited and Portgrade Limited, the parent company of Afonwen Laundry Limited. In addition, costs of £0.3 million, of which £0.2 million
related to the period to 30 June 2016, were incurred as part of the ongoing restructuring and integration of recent acquisitions.
Pension costs
During the period to 30 June 2016, professional fees of £0.3 million were incurred in respect of liability management exercises in relation to the
defined benefit pension scheme.
Profit on disposal of freehold property
A former Textile Rental site in Leeds that was closed in 2015 was disposed of during the period for net proceeds of £0.5 million. The carrying value
was previously written down to £nil in 2014.
4 Taxation
Half year to Half year to Year ended
30 June 30 June 31 December
2017 2016 2016
£m £m £m
Continuing operations
Current tax
UK corporation tax charge for the period 3.6 3.1 7.3
Adjustment in relation to previous periods – – (0.1)
Current tax charge for the period 3.6 3.1 7.2
Deferred tax
Origination and reversal of temporary differences (1.1) (0.9) (1.8)
Changes in statutory tax rate – – (0.3)
Adjustment in relation to previous years – – (0.1)
Deferred tax credit for the period (1.1) (0.9) (2.2)
Total charge for taxation included in the income statement 2.5 2.2 5.0
Taxation in relation to amortisation of intangible assets (excluding software amortisation) has reduced the charge for taxation on continuing operations
in the current period by £0.7 million (June 2016: £0.6 million reduction in the charge; December 2016: £1.5 million reduction in the charge). Taxation
in relation to exceptional items in the current period relating to continuing operations is £nil (June 2016: £nil; December 2016: £0.2 million reduction
in the charge).
During the period, a £0.2 million credit relating to current taxation (June 2016: £nil credit; December 2016: £0.2 million credit) has been recognised
directly in Shareholders’ equity.
Reconciliation of effective tax rate
Taxation on non-exceptional items for the six months to 30 June 2017 is calculated based on the estimated average annual effective tax rate
(excluding prior year items) of 19.4% (June 2016: 20.3%; December 2016: 20.7%). This compares to the weighted average tax rate expected to be
enacted or substantively enacted at the balance sheet date of 19.25% (June 2016: 20.00%; December 2016: 20.00%). Taxation on exceptional
items is calculated based on the actual tax charge or credit for each specific item.Interim Report and Accounts 2017 Johnson Service Group PLC 15
4 Taxation continued
Differences between the estimated average annual effective tax rate and statutory rate include, but are not limited to, the effect of non-deductible
expenses and the effect of tax losses utilised. The adjustment for under or over provisions in previous years is recognised when the amounts are
agreed.
Changes to UK corporation tax rate
Changes to the UK corporation tax rates were announced on 8 July 2015. These changes, which proposed to reduce the main rate to 19% from
1 April 2017 and to 18% from 1 April 2020, were substantively enacted as part of Finance Bill 2015 on 26 October 2015. A further change to
reduce the rate from 1 April 2020 from 18% to 17% was announced on 16 March 2016. This change was substantively enacted as part of Finance
Bill 2016 on 15 September 2016.
Deferred income taxes at the balance sheet date have been measured at the tax rate expected to be applicable at the date the deferred income tax
assets and liabilities are realised. Management has performed an assessment, for all material deferred income tax assets and liabilities, to determine
the period over which the deferred income tax assets and liabilities are forecast to be realised, which has resulted in an average deferred income tax
rate of 18.5% being used to measure all deferred tax balances as at 30 June 2017 (June 2016: 19.0%; December 2016 18.5%).
5 Adjusted profit before and after taxation
Half year to Half year to Year ended
30 June 30 June 31 December
2017 2016 2016
£m £m £m
(Restated)
Continuing operations
Profit before taxation 12.9 9.9 25.9
Amortisation of intangible assets (excluding software amortisation) 3.9 3.0 6.9
Costs in relation to business acquisition activity – 0.9 1.2
Pension costs – 0.3 0.3
Profit on freehold property disposal – (0.5) (0.5)
Adjusted profit before taxation 16.8 13.6 33.8
Taxation on adjusted profit (3.2) (2.8) (6.7)
Adjusted profit after taxation 13.6 10.8 27.1
6 Dividends
Half year to Half year to Year ended
30 June 30 June 31 December
2017 2016 2016
Dividend per share (pence)
2017 Interim dividend proposed 0.9 – –
2016 Interim dividend proposed and paid – 0.8 0.8
2016 Final dividend proposed and paid – – 1.7
0.9 0.8 2.5
Half year to Half year to Year ended
30 June 30 June 31 December
2017 2016 2016
Shareholders’ funds committed (£m)
2017 Interim dividend proposed 3.3 – –
2016 Interim dividend proposed and paid – 2.9 2.9
2016 Final dividend proposed and paid – – 6.2
On 9 May 2017 a final dividend of 1.7 pence per share in respect of 2016 was paid to Shareholders, utilising £6.2 million of Shareholders’ funds.
The Directors are proposing an interim dividend in respect of the year ended 31 December 2017 of 0.9 pence which will reduce Shareholders’ funds
by £3.3 million. The dividend will be paid on 3 November 2017 to Shareholders on the register of members at the close of business on 6 October
2017. The trustee of the EBT has waived the entitlement to receive dividends on the Ordinary shares held by the trust.
In accordance with IAS 10 there is no payable recognised at 30 June 2017 in respect of this proposed dividend.16 Johnson Service Group PLC Interim Report and Accounts 2017
NOTES TO THE CONDENSED CONSOLIDATED INTERIM FINANCIAL STATEMENTS
CONTINUED
7 Earnings per share
Half year to Half year to Year ended
30 June 30 June 31 December
2017 2016 2016
£m £m £m
(Restated)
Profit for the period from continuing operations attributable to Shareholders 10.4 7.7 20.9
Profit/(loss) for the period from discontinued operations attributable to shareholders – 0.4 (0.3)
Amortisation of intangible assets from continuing operations (net of taxation) 3.2 2.4 5.4
Impairment of assets classified as held for sale – – 2.0
Exceptional items from continuing operations (net of taxation) – 0.7 0.8
Exceptional items from discontinued operations (net of taxation) – – (0.3)
Adjusted profit attributable to Shareholders relating to continuing activities 13.6 10.8 27.1
Adjusted loss attributable to Shareholders relating to discontinued activities – 0.4 1.4
Adjusted profit attributable to Shareholders 13.6 11.2 28.5
Number Number Number
of shares of shares of shares
Weighted average number of Ordinary shares 365.9m 340.9m 352.5m
Potentially dilutive options* 2.7m 4.0m 4.4m
Fully diluted number of Ordinary shares 368.6m 344.9m 356.9m
Pence Pence Pence
per share per share per share
Basic earnings per share
From continuing operations 2.8p 2.3p 6.0p
From discontinued operations – 0.1p (0.1p)
From continuing and discontinued operations 2.8p 2.4p 5.9p
Adjustment for amortisation of intangibles assets (continuing operations) 0.9p 0.7p 1.5p
Impairment of assets classified as held for sale (discontinued operations) – – 0.6p
Adjustment for exceptional items (continuing operations) – 0.2p 0.2p
Adjustment for exceptional items (discontinued operations) – – (0.1p)
Adjusted basic earnings per share (continuing operations) 3.7p 3.2p 7.7p
Adjusted basic earnings per share (discontinued operations) – 0.1p 0.4p
Adjusted basic earnings per share from continuing and discontinued operations 3.7p 3.3p 8.1p
Diluted earnings per share
From continuing operations 2.8p 2.3p 5.9p
From discontinued operations – 0.1p (0.1p)
From continuing and discontinued operations 2.8p 2.4p 5.8p
Adjustment for amortisation of intangibles assets (continuing operations) 0.9p 0.7p 1.5p
Impairment of assets classified as held for sale (discontinued operations) – – 0.6p
Adjustment for exceptional items (continuing operations) – 0.2p 0.2p
Adjustment for exceptional items (discontinued operations) – – (0.1p)
Adjusted diluted earnings per share (continuing operations) 3.7p 3.2p 7.6p
Adjusted diluted earnings per share (discontinued operations) – 0.1p 0.4p
Adjusted diluted earnings per share from continuing and discontinued operations 3.7p 3.3p 8.0p
* Includes outstanding share options granted to employees.
Basic earnings per share is calculated using the weighted average number of Ordinary shares in issue during the period, excluding those held by the
Employee Benefit Trust, based on the profit for the year attributable to Shareholders.
Adjusted earnings per share figures are given to exclude the effects of amortisation of intangible assets (excluding software amortisation) and
exceptional items, all net of taxation, and are considered to show the underlying performance of the Group.Interim Report and Accounts 2017 Johnson Service Group PLC 17
7 Earnings per share continued
For diluted earnings per share, the weighted average number of Ordinary shares in issue is adjusted to assume conversion of all potentially dilutive
Ordinary shares. The Company has potentially dilutive Ordinary shares arising from share options granted to employees where the exercise price is
less than the average market price of the Company’s Ordinary shares during the period.
Potential Ordinary shares are dilutive at the point, from a continuing operations level, when their conversion to Ordinary shares would decrease
earnings per share or increase loss per share from continuing operations. For all periods, potential Ordinary shares have been treated as dilutive, as
their inclusion in the diluted earnings per share calculation decreases earnings per share from continuing operations.
There were no events occurring after the balance sheet date that would have changed significantly the number of Ordinary shares or potentially
dilutive Ordinary shares outstanding at the balance sheet date if those transactions had occurred before the end of the reporting period.
8 Retirement benefit obligations
The Group has applied the requirements of IAS 19R, ‘Employee Benefits’ to its employee pension schemes and post-employment healthcare benefits.
In the six months to 30 June 2017 deficit recovery payments of £0.9 million were paid by the Group to the defined benefit scheme (June 2016:
£0.9 million; December 2016: £1.9 million). In addition, a further, one off, deficit recovery payment of £1.5 million was made in April 2017.
Following discussions with the Group’s appointed actuary a re-measurement gain of £6.2 million has been recognised in the period to 30 June 2017.
This is principally as a result of asset returns over the period being £4.4 million higher than previously assumed, and experience gain on liabilities of
£2.2 million offset by an increase in liabilities due to changes in financial assumptions of £0.4 million.
The post-employment benefit obligation and associated deferred income tax asset thereon is shown below:
As at As at As at
30 June 30 June 31 December
2017 2016 2016
£m £m £m
Post-employment benefit obligation (9.7) (13.7) (18.2)
Deferred income tax asset thereon 1.8 2.6 3.4
(7.9) (11.1) (14.8)
The reconciliation of the opening gross post-employment benefit obligation to the closing gross post-employment benefit obligation is shown below:
As at As at As at
30 June 30 June 31 December
2017 2016 2016
£m £m £m
Opening post-employment benefit obligation (18.2) (16.0) (16.0)
Notional interest (0.2) (0.3) (0.6)
Employer contributions 2.4 0.9 1.9
Re-measurement gains/(losses) 6.2 1.5 (3.5)
Utilisation of healthcare provision 0.1 0.2 –
Closing post-employment benefit obligation (9.7) (13.7) (18.2)
9 Capital expenditure and commitments
Capital expenditure
In the half year ended 30 June 2017 the Group acquired property, plant and equipment and intangible assets for a cost of £6.5 million (June 2016:
£4.9 million; December 2016: £15.6 million), not including property, plant and equipment and intangible assets acquired through business
combinations. In addition, textile rental items with a cost of £19.6 million were acquired during the period (June 2016: £15.9 million; December 2016:
£35.4 million), not including textile rental items acquired through business combinations.
Offsetting this, property, plant and equipment with a net book value of £nil million was disposed of during the period (June 2016: £0.3 million;
December 2016: £0.6 million). In addition, amounts received in respect of textile rental special charges were £1.2 million (June 2016: £1.5 million;
December 2016: £2.7 million).You can also read