Natural Gas Market 2019-2020 Winter Outlook
←
→
Page content transcription
If your browser does not render page correctly, please read the page content below

2019-2020 WINTER

                   Natural Gas Market
                   2019-2020 Winter Outlook

                   Prepared for:
NATURAL GAS

                                   Natural Gas Supply Association

                   Prepared by:
                                   Energy Ventures Analysis
                                   June Yu – Senior Analyst
                                   Michael Schaal – Principal
                                   Robert DiDona – Principal

1901 N. Moore Street                                                                703-276-8900
Suite 1200                                                                        www.evainc.com
Arlington, VA 22209-1706                                            © 2019 Energy Ventures Analysis
Natural Gas Market 2019-2020 Winter Outlook                                                                                                          2019-2020 Winter

Table of Contents
Overview ................................................................................................................................................................................. 3
Demand Outlook ..................................................................................................................................................................... 5
   Power .................................................................................................................................................................................. 5
   Residential and Commercial ............................................................................................................................................. 11
   Industrial ........................................................................................................................................................................... 12
   Export ................................................................................................................................................................................ 15
       Pipeline Exports to Mexico ........................................................................................................................................... 15
       LNG Exports ................................................................................................................................................................... 16
Supply Outlook ...................................................................................................................................................................... 20
   Production......................................................................................................................................................................... 20
   Import ............................................................................................................................................................................... 27
       Pipeline Imports from Canada ...................................................................................................................................... 27
       LNG Imports .................................................................................................................................................................. 28
Storage Outlook .................................................................................................................................................................... 29
   Storage Capacity ............................................................................................................................................................... 29
   Storage Forecast ............................................................................................................................................................... 30
   Storage Scenario Analysis ................................................................................................................................................. 31
Appendix ............................................................................................................................................................................... 33
   1. Short Term Henry Hub Price Forecast........................................................................................................................... 33
   2. Existing and Future U.S. LNG Export Facilities .............................................................................................................. 33
   3. Winter Gas Imports and Exports ................................................................................................................................... 33
   4. Total Gas Demand by EIA Gas Storage Region (Excluding Exports and Other)............................................................. 34
   5. Total Gas Demand by Sector ......................................................................................................................................... 34
   6. Power Demand by EIA Storage Region ......................................................................................................................... 35
   7. Winter Heating Degree Days......................................................................................................................................... 35
   8. U.S. Macro Indicators .................................................................................................................................................... 35
   9. Winter Gas Consumption by Sector .............................................................................................................................. 36
   10. Winter Gas Supply by Sector....................................................................................................................................... 36
   11. Winter Gas Production by Type .................................................................................................................................. 36
   12. Industrial Projects by Type and Industry (2019-2023) ................................................................................................ 37
   13. Performance Characteristics of Natural Gas CCGT by Census Region ........................................................................ 37

© 2019 ENERGY VENTURES ANALYSIS                                                                                                                                                            2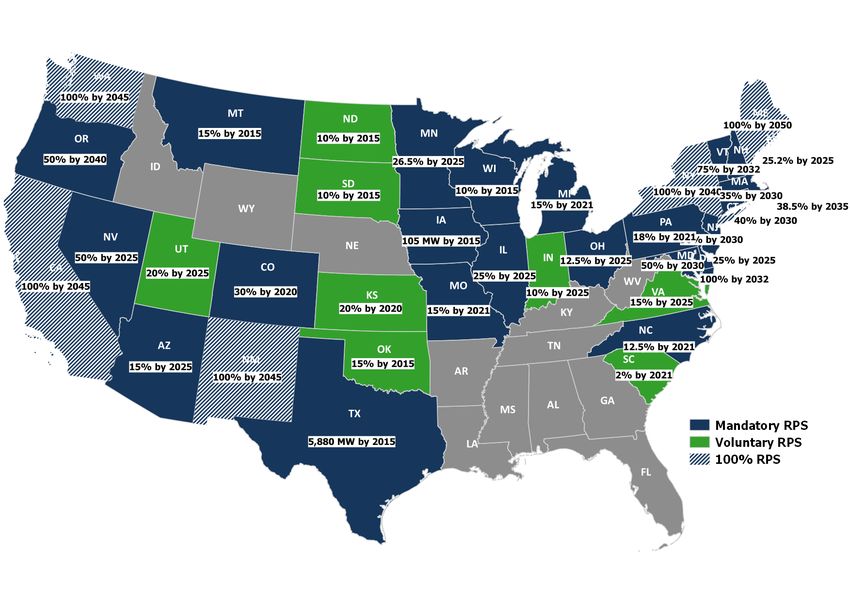
Natural Gas Market 2019-2020 Winter Outlook                                                              2019-2020 Winter

Overview
U.S. natural gas supply and demand for 2019-2020 winter1 are both forecasted to experience substantial growth winter-
over-winter. Total gas production is expected to grow 3.8 BCFD winter-over-winter, while demand components combined
will grow 3.1 BCFD (See Exhibit 1)2. Winter 2019-2020 storage inventories of natural gas are forecasted to start the winter
heating season at 3,712 BCF, near the five-year average level. Assuming a 10-year normal weather for the 2019-2020
winter, gas withdrawals are forecasted to total 1,879 BCF, which is slightly lower than the five-year average. The lower-
than-average withdrawal is due to record-high production outpacing demand growth (Exhibit 2).

Exhibit 2 presents a sector-by-sector look at changes expected this winter compared to last winter. The decline in the
Residential and Commercial sector is the result of expected milder winter weather compared to last winter.

Exhibit 1: Summary of Winter Natural Gas Supply and Demand

                                Winter Natural Gas Supply and Demand Summary
                                                               Winter     Winter
                                            BCFD                                              Difference
                                                              2019-2020  2018-2019
                                Supply
                                Dry Production                      92.0       88.2                   3.8
                                Net Canadian Imports                 4.7        4.7                 (0.0)
                                LNG Imports                          0.2        0.3                 (0.1)
                                Total Supply                        96.9       93.3                   3.7
                                Demand
                                Power Burn                          27.0       25.7                    1.3
                                Industrial                          24.8       24.7                    0.1
                                Residential and Commercial          36.1       39.6                  (3.6)
                                Net Mexico Exports                   5.8        4.8                    1.0
                                LNG Exports                          8.3        4.5                    3.8
                                Other                                7.3        6.9                    0.4
                                Total Demand                       109.3      106.2                    3.1
                                Implied Withdrawals                 12.3       12.9                  (0.6)
                                HDDs                               3,469      3,620                 (151)

Exhibit 2: Natural Gas Supply and Demand, 2019-2020 Winter vs 2018-2019 Winter

1
    For the purpose of this report, winter refers to November to March which is, in general, the gas withdrawal season.
2
    “Gas” is often used as a short form of natural gas in this report.

© 2019 ENERGY VENTURES ANALYSIS                                                                                                 3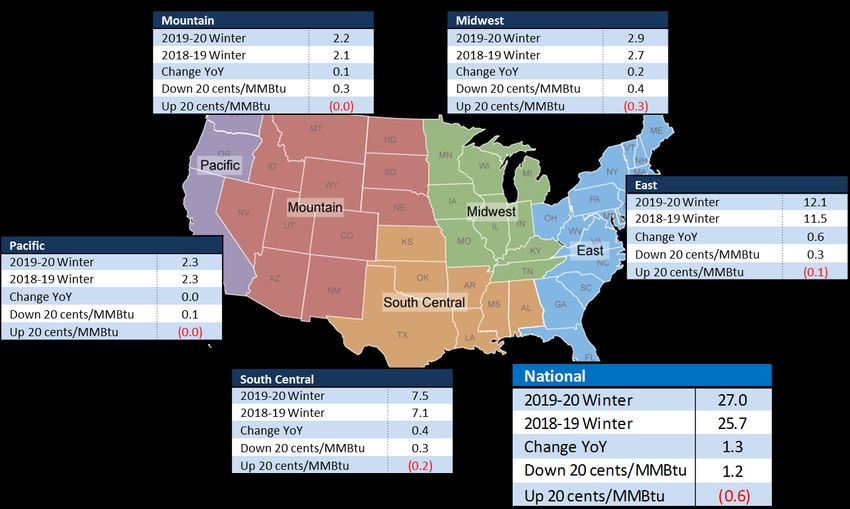
Natural Gas Market 2019-2020 Winter Outlook                                                     2019-2020 Winter

The highlights of the 2019-2020 winter outlook include the following:

  •   Lower-48 production is expected to grow further for the 2019-2020 winter. Dry gas production is forecasted to
      average 92 BCFD this winter, which will represent 3.8 BCFD (~4%) of growth winter-over-winter. This winter,
      associated gas production from the Permian will contribute to the largest gain since production is likely to ramp up
      quickly as the 2-BCFD Gulf Coast Express pipeline and cross-border Mexico export pipelines are currently
      commissioning or recently entered service. Elsewhere, production from the Marcellus, Utica, Haynesville shales will
      grow further to meet regional demand and fill takeaway capacity. The strong growth from these areas will more
      than offset declines from conventional plays.

  •   Power demand will maintain its growth momentum. The strong growth in power demand is the result of low-
      natural gas prices, which encourages the dispatch of gas-fired generation units, as well as structural growth due to
      the addition of new and highly efficient combined cycle gas turbines (CCGTs). Structural growth due to these new
      CCGT additions has increased steadily over time, creating a strong base for power burn growth. On a national level,
      a 20 cent/MMBTU decline in natural gas prices would increase power burn by 1.2 BCFD while a 20 cent/MMBTU
      increase would reduce power burn by only 0.6 BCFD. Thus, there is more potential upside to power burn for this
      coming winter because of the market price sensitivity of demand.

  •   Total natural gas exports—Gas exports via pipeline to Mexico and LNG exports—will lead the demand growth
      this winter. Total natural gas exports are expected to grow by 4.8 BCFD winter-over-winter. The anticipated
      increase in gas flow via the Mexico Sur de Texas-Tuxpan pipeline is expected to increase gas demand in South Texas
      since late September. In terms of LNG, three new trains—Elba Island Phase 2 (0.1 BCFD), Freeport Train 2 (0.7
      BCFD), and Cameron Train 2 (0.7 BCFD)—are expected to start up this winter, bringing total LNG export capacity to
      8.5 BCFD by March 2020.

  •   Based on the near-term supply and demand dynamics, natural gas storage levels are expected to finish the 2019-
      2020 winter withdrawal season at 1,833 BCF, slightly above the five-year average. Production growth is expected
      to respond quickly to demand gains, resulting in lower-than-average storage withdrawals for the coming winter.
      Winter weather plays an important role in Residential and Commercial gas demand. A cold winter scenario can
      result in a below-average end-of-March storage level; however, winter weather is forecasted to be milder this winter
      compared to last.

© 2019 ENERGY VENTURES ANALYSIS                                                                                         4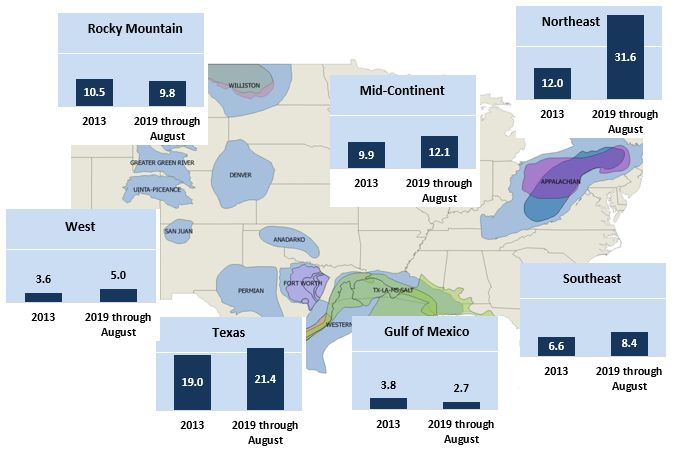
Natural Gas Market 2019-2020 Winter Outlook                                                    2019-2020 Winter

Demand Outlook
Power
Power burn demand has been very strong so far this year, with year-to-date power burn averaging about 1.4 BCFD
stronger year-over-year. The robust power burn is largely driven by new CCGT additions over the past few years, providing
a solid base for power burn growth in a relatively low natural gas price environment. As a result, EVA’s electricity dispatch
model shows that, based on the current resource mix and dispatch economics, power burn is expected to average 27 BCFD
for the 2019-2020 winter, about 1.3 BCFD higher winter-over-winter (See Exhibit 3).

Exhibit 3: Historical and Forecasted Winter Power Burn Demand

Exhibit 4 quantifies the increase in power burn from 2013-2014 winter due to either structural growth or economic fuel
switching. Adjusted for weather, winter power burns have increased since the 2013-2014 winter, primarily due to natural
gas-fired power generation additions that replaced retiring coal-fired power plants. An analysis of historical data shows
that the growth from economic switching is sensitive to natural gas prices. In the 2015-2016 winter, Henry Hub gas prices
averaged just below $2.00/MMBTU, which enabled gas-fired units to dispatch ahead of other fossil fuel-burning units.
Conversely, when natural gas prices increased during the 2016-2017 winter, power generation partially switched back to
coal. As winter forward gas prices are expected to average below the last three-year levels3, economic switching from
coal to natural gas is expected to be robust for the 2019-2020 winter.

Structural growth due to new CCGT additions has increased steadily over time, establishing a strong base for power burn
growth. In 2019-2020 winter, incremental growth from structural additions is expected to be modest due to a slower
pace of CCGT additions (See Exhibit 5). Historically, retiring coal capacity has been almost entirely replaced by new CCGT
capacity. In 2019, another 10.3 GW of coal-fired capacity is scheduled to be retired by year end, but only 5.8 GW of new
CCGT capacity is scheduled to enter service. Wind capacity additions in 2019 will top 11.3 GW and exceed CCGT additions
for the first time due to investment driven primarily by the upcoming expiration of the Production Tax Credit (PTC) for
wind.

3
    Here, the last three-year levels refer to actual Henry Hub cash settlements.

© 2019 ENERGY VENTURES ANALYSIS                                                                                            5
Natural Gas Market 2019-2020 Winter Outlook 2019-2020 Winter
Exhibit 4: Power Burn Increase from 2013-2014 Winter: Structural Growth vs Economic Switching
Exhibit 5: Electricity Generation Capacity Net Change, 2017-2020
Annual Net Change in Electricity Generation Capacity (MW)
Steam - Peak &
Coal CCGT Gas Turbine Nuclear Wind Solar Battery
Gas & Oil Other
2017 (8,446) 7,612 (530) (5,055) 0 316 6,017 4,952 108
2018 (15,754) 16,631 211 (4,692) (610) 352 6,847 4,826 156
2019 E (10,318) 5,815 1,150 (1,111) (1,483) 239 11,323 4,656 143
2020 E (6,820) 6,503 463 (2,299) 2,474 172 5,280 2,773 250
Source: U.S. EIA, Energy Ventures Analysis
Note: Negative numbers mean net retirement
© 2019 ENERGY VENTURES ANALYSIS 6Natural Gas Market 2019-2020 Winter Outlook 2019-2020 Winter
On a regional level, the East region, which accounts for nearly 45% of the country’s power burn, will continue to take the
lead (See Exhibit 6). Power burn in the East region is expected to grow another 0.6 BCFD winter-over-winter to average
12.1 BCFD. The South Central and Midwest regions are also expected to see strong growth, with power burn forecasted
to increase by 0.4 BCFD and 0.2 BCFD winter-over-winter, respectively. The strong growth in those regions is attributed
to the proximity to abundant low-cost natural gas resources and natural gas-fired unit additions over the last few years.
In contrast, Pacific power burn is forecasted to stay flat winter-over-winter as gas-fired capacity additions have been
limited while the region has become more reliant on electricity from renewable sources.
Exhibit 6 shows the power burn sensitivity relative to gas price changes. More specifically, the analysis measures changes
in regional power burn if natural gas prices vary by 20 cents/MMBTU higher or lower from the base case, which shows the
potential of coal-to-gas economic switching. On a national level, a 20 cent/MMBTU lower natural gas price would increase
power burn by 1.2 BCFD while a 20 cent/MMBTU higher gas price would reduce power burn by just 0.6 BCFD, indicating
that there will be more upside potential for power burn during this coming winter. If natural gas prices were to increase,
there is less potential variation in power burn demand due to the recent retirement of coal units, which have left limited
room for coal switching back to gas. On the other hand, a lower natural gas price environment will further reduce the
dispatch cost for gas-fired units, allowing them to compete against low-cost coal-fired units, like those that burn coal from
the Powder River Basin (PRB). Regionally, the East, South Central and Midwest regions are all estimated to have the most
potential in economically-driven fuel switching.
Exhibit 6: 2019-2020 Power Burn Forecast by Region and Gas Price Sensitivity
Source: Energy Ventures Analysis
Between 2010 to 2019, annual average heat rates for CCGT units decreased by 9.5%. Heat rates are calculated based on
the amount of energy (in Btu or MMBTU) used to generate a unit of electricity (in kWh or MWh). Lower heat rates indicate
more efficient generation—in other words, generating the same amount of electricity requires less fuel. One main factor
in the improvement of the CCGT fleet’s heat rate is the growing installation of newer and larger advanced CCGT units,
which led to efficiency gains. According to an Energy Information Administration (EIA) survey, better performance and
© 2019 ENERGY VENTURES ANALYSIS 7Natural Gas Market 2019-2020 Winter Outlook 2019-2020 Winter lower construction costs are likely to substantially increase the share of these advanced CCGT units in future years4. In addition, changes in usage patterns of CCGT plants could also affect their heat rates. Plants that are being operated more continuously—as opposed to being cycled on and off frequently—may consume less fuel to produce electricity5. With natural gas being more accessible and cheaper as well as generating fewer emissions compared to other fossil fuels, CCGT units have been operated at higher utilization rates and in many cases, as baseload capacity. This change in usage pattern will further improve the CCGT fleet’s efficiency. In recent years, higher renewable penetration has brought challenges to the power grid especially during high-demand peak hours when some renewable resources are less available, and may need to be supplemented by natural gas-fired generators or battery storage. For example, a June 2019 heat wave highlighted the potential for the California Independent System Operator (CAISO) to face struggles meeting the extreme peak loads that it had more effectively managed in previous years. On June 11, the grid operator issued a flex alert—a voluntary call for consumers to conserve electricity when extreme heat increases energy demand and CAISO’s available capacity has a hard time meeting peak demand. The challenge came as solar generation dropped sharply in the evening hours even as demand remained high. Not long after, in September 2019, the California Public Utilities Commission proposed delaying the retirement of several gas-fired power plants, in order to address potential power capacity shortages beginning in 20216. Another example occurred in August 2019, when real-time power prices in the Electric Reliability Council of Texas (ERCOT) grid spiked to their administrative price cap of $9,000/MWh amid a record-breaking heat wave. During the high-priced hours, the region’s massive wind fleet performed below average and contributed to extremely tight reserve margins. In fact, market participants such as Calpine and NRG have long recognized this issue and asked ERCOT to revise its shortage pricing formula, or Operating Reserve Demand Curve (ORDC), to provide high enough price incentives to encourage the development of dispatchable generation7. Going forward, ERCOT provides a unique lens to observe how new power market designs and the integration of renewable and gas-fired generation will drive future resource mix and new investments. 4 More new natural gas combined-cycle power plants are using advanced designs: https://www.eia.gov/todayinenergy/detail.php?id=39912 5 Natural gas-fired electricity conversion efficiency grows as coal remains stable: https://www.eia.gov/todayinenergy/detail.php?id=32572 6 California Public Utilities Commission: Decision Requiring Electric System Reliability Procurement For 2021-2023 http://docs.cpuc.ca.gov/SearchRes.aspx?docformat=ALL&docid=312522263 7 NRG, Calpine proposes market fixes to avoid ‘subversion’ of ERCOT model https://www.utilitydive.com/news/nrg-calpine-propose-market-fixes-to-avoid-subversion-of-ercot-model/442530/ © 2019 ENERGY VENTURES ANALYSIS 8
Natural Gas Market 2019-2020 Winter Outlook                                                   2019-2020 Winter

The Development of State Renewable Portfolio Standard (RPS)
States have been very active in recent months revising and expanding their Renewable Portfolio Standards (RPS), which
require a certain percentage of electricity that utilities sell to be generated through renewable, nuclear, or hydro
resources. As of August 2019, 39 states (including Washington D.C.) have established mandatory or voluntary RPS
programs (See Exhibit 7) that include time-bound mandates for procurement of renewable electricity and some states
also include “set-asides” or “carve-outs” for solar PV as well as technology-specific buildout requirement for offshore wind
and/or battery storage.

State-level RPS development in the Northeast, Mid-Atlantic, and West regions has experienced the most active
development. RPS policies are expected to be the key driver for renewable energy development, especially in regions like
the Northeast and Mid-Atlantic where renewable resources are relatively limited and investors will rely upon an additional
revenue stream from selling renewable energy credits (RECs). For regions like Texas and the Midwest, actual renewable
growth far outpaced RPS needs, given favorable wind energy capacity factors8. The southeastern states, apart from the
Carolinas, have minimal RPS development.

Exhibit 7: State RPS as of August 2019

A few states have also advanced and moved towards 100% RPS. Among the lower-48 states, Maine, New York,
Washington D.C., New Mexico, California, and Washington have passed legislation to achieve 100% clean energy. In June
2019, New York passed the country’s most ambitious climate targets—its own version of the “Green New Deal”— that
will not only require 100% carbon free from the electricity sector by 2040 but also economy-wide, net-zero carbon
emission by 2050 (the state allows up to 15% of economy-wide emission being offset or captured). This legislation will

8
 U.S. Renewable Portfolio Standards: 2017 Annual Status Report:
https://emp.lbl.gov/sites/default/files/2017-annual-rps-summary-report.pdf

© 2019 ENERGY VENTURES ANALYSIS                                                                                           9
Natural Gas Market 2019-2020 Winter Outlook                                                      2019-2020 Winter

have a long-term impact on New York State’s natural gas demand as it lays out a plan and incentives to phase out carbon-
emitting fuel from not just the electric sector but also from home and building heating systems. The anticipated reduction
in natural gas demand will also affect future investment in gas infrastructure such as gas-fired power plants and pipelines.
Regulatory uncertainty will likely grow over gas infrastructure such as the Northeast Supply Enhancement Project and
Constitution Pipeline.

© 2019 ENERGY VENTURES ANALYSIS                                                                                          10
Natural Gas Market 2019-2020 Winter Outlook                                                    2019-2020 Winter

Residential and Commercial
Natural gas use in the residential and commercial sector includes space heating, water heating, and cooking. Residential
and commercial consumption for natural gas is therefore strongly correlated with weather during the wintertime. We are
assuming a 10-year normal weather for the 2019-2020 winter. The assumption of normal weather yields 3,469 gas-
weighted heating degree days (gwHDDs)9. Residential and commercial demand is estimated to average 36.1 BCFD for the
winter, about 3.5 BCFD lower winter-over-winter. Note that weather conditions can have a significant impact on
residential and commercial sector demand—historically, winter residential and commercial gas demand has swung from
31.9 BCFD to 41.3 BCFD depending on the weather conditions (See Exhibit 8).

Exhibit 8: Historical and Forecasted Winter Weather and Residential/Commercial Gas Demand

Natural gas demand in the residential sector has remained largely flat over the past few years mainly due to population
shifts and efficiency gains that counterbalance population size and housing growth. According to the EIA’s Residential
Energy Consumption Survey (RECS) data, natural gas furnaces are most commonly used in areas with cold winter
temperatures, while electric heat pumps are gaining popularity in the Southeast, where winters typically are milder. The
U.S. population continued to shift to the South and the West from the Northeast and Midwest, resulting in a shift from
natural gas to electric heating and hence slightly less natural gas heating need during wintertime. Gas use in the
commercial sector is mostly driven by economic growth as well as energy efficiency improvements of heating and building
components. Much of the growth in commercial use is due to business expansion and is mostly offset by continuing
improvements in energy efficiency.

9
 Gas-weighted heating degree days (gwHDDs) are HDDs that are weighted to reflect a combination of population in each area and
the percent of the population in that area that uses natural gas for home heating.

© 2019 ENERGY VENTURES ANALYSIS                                                                                           11
Natural Gas Market 2019-2020 Winter Outlook                                                            2019-2020 Winter

Industrial
Industrial natural gas demand has grown substantially over the past few years, thanks to continuing economic growth and
the availability of low-cost natural gas (Exhibit 9). Similar to the residential and commercial sectors, some of the industrial
gas demand is also closely correlated to weather during wintertime10. Industrial end users consume natural gas as fuel to
generate heat and power or as feedstock. Assuming a 10-year normal weather for 2019-2020 winter, industrial demand
is projected to remain flat compared to last year at 24.8 BCFD.

Exhibit 9: Historical and Forecasted Industrial Gas Demand

Strong growth in energy-intensive industries has contributed to higher industrial gas demand in the last decade. As shown
in Exhibit 10, the industrial sectors’ performance index measured by the U.S. Federal Reserve has increased steadily since
2014. Among the six energy-intensive industries, production indices of nonmetallic mineral mining, food, petroleum and
coal, as well as chemicals have experienced the largest growth over the last five years, contributing to higher gas demand
in the industrial sector.

Exhibit 10: Performance of the Six Energy-Intensive Industries

10
     Industrial demand can swing 3-4 BCFD depending on seasonality, representing 10-15% of industrial gas demand.

© 2019 ENERGY VENTURES ANALYSIS                                                                                             12
Natural Gas Market 2019-2020 Winter Outlook 2019-2020 Winter Manufacturing energy consumption data, conducted by an EIA survey, shows that the U.S. manufacturing sector has increasingly shifted away from coal and petroleum products to natural gas11. The switch was the result of increased availability of natural gas, lower natural gas prices relative to other fuel options, and the ability of manufacturers to comply with environmental regulations when using natural gas. These factors led manufacturers to focus on natural gas use and invest less in fuel-switching flexibility. 2015 to 2018 represents an active period for the development of new industrial facilities (Exhibit 11). A total of 40 projects came online from 2015 through 2018, which are estimated to bring about 1.7 BCFD of gas demand. An additional 47 projects are expected to come online between 2019 and 2023, which could potentially add 2.0 BCFD of incremental gas demand. Among these projects, petrochemical projects will still dominate the new and expansion projects over the next five years. Exhibit 11: Industrial Projects and Estimated Gas Demand 40 projects were completed from 2015-2018, with total gas demand of 1.7 BCFD and total investment of $50 billion 47 projects are expected to come online from 2019-2023, with total gas demand of 2 BCFD and total investment of $82.8 billion These new projects are expected to drive industrial gas demand higher in the short term. As the 25% steel tariff strengthened the domestic steel industry, steelmakers have either announced plans to build new facilities or to restart shuttered steel mills. Nucor, the largest steel manufacturer in the U.S., announced plans to build a new 1.2 million tons per year (mt/y) steel mill in Kentucky by 2022 and to expand capacity at its Gallatin facility in the state by 2021. U.S. Steel has also planned to resume construction on an Alabama mill to take advantage of higher steel prices. In addition, petrochemical plants are being planned and developed to take advantage of low-cost natural gas. Two new methanol plants on the Gulf Coast—the Big Lake 1 and St. James 1 facilities—are expected to enter service in 2019 and 2020, respectively. In addition to Gulf Coast methanol projects, a few methanol plants have been developed in West Virginia. Two smaller methanol-producing facilities—Primus Green Energy and Liberty One—are planned to begin operations in 2020 and 2019, respectively. Their proximity to the Appalachian Basin ensures feedstock natural gas supply at a relatively low cost. 11 U.S. manufacturers’ short-term capability to switch fuels continues to decline: https://www.eia.gov/todayinenergy/detail.php?id=37292 © 2019 ENERGY VENTURES ANALYSIS 13
Natural Gas Market 2019-2020 Winter Outlook                                                        2019-2020 Winter

The ongoing trade war and several rounds of import tariffs are expected to have a mixed impact on U.S. industry in the
medium term. Exhibit 12 shows a timeline of the U.S.-China trade war, with several rounds of tariffs being imposed since
the first quarter of 2018. In March 2018, the U.S. implemented a 25% tariff on imported steel and 10% tariff on imported
aluminum, which led to higher prices for U.S.-made steel and boosted domestic steel production. However, other
industries might struggle amid the ongoing trade war between the U.S. and China. Overall, four phases of tariffs were
imposed by the U.S. on Chinese goods, with the latest round in August 2019 proposing a 10% tariff on an additional $300
billion worth of Chinese products. In response, China imposed retaliatory tariffs against U.S. goods and in June 2019 raised
the tariff on U.S. LNG to 25% from the previous level of 10%. The tariff will increase production costs for industries ranging
from automobiles to petrochemical manufacturers. Business uncertainty and weakening global economy are typically a
drag on the industry.

Exhibit 12: Timeline of U.S.-China Trade War

                                                                              U.S. LNG Included

Source: Energy Ventures Analysis

© 2019 ENERGY VENTURES ANALYSIS                                                                                            14
Natural Gas Market 2019-2020 Winter Outlook 2019-2020 Winter
Export
Pipeline Exports to Mexico
Since 2014, U.S. pipeline exports to Mexico have grown from 2.2 BCFD to 4.8 BCFD thanks to cross-border pipeline
buildouts and declining Mexican gas production (Exhibit 13). To date, Mexico has imported pipeline natural gas from the
U.S. mainly through South Texas, West Texas (Waha), Arizona, and California, with exports from Texas leading the way.
Recent pipeline development has almost tripled the gas exports from Texas to Mexico since 2014. In 2018, a few more
pipelines were placed in service (Exhibit 14), including the 0.5-BCFD Nueva Era pipeline, the 2.6-BCFD Valley Crossing
Pipeline, and the downstream pipelines connecting El Encino westward to Topolobampo and eastward to La Laguna.
Exhibit 13: Historical U.S. Gas Exports to Mexico
Source: U.S. EIA, Energy Venture Analysis
Exhibit 14: Recently constructed and Upcoming Gas Pipelines in Mexico
Pipeline Name Begin Region End Region Developer Name Project Status Online Date Capacity (BCFD)
Valley Crossing Pipeline Nueces Brownsville Spectra Energy Completed Oct-2018 2.60
El Encino - La Laguna El Encino La Laguna Fermaca Completed Mar-2018 1.50
Nueva Era Colombia Escobedo Nueva Era Completed Jul-2018 0.50
El Elcino - Topolobampo El Elcino Topolobampo TransCanada Completed Jun-2018 0.67
La Laguna - Aguascalientes La Laguna Aguascalientes Fermaca Under Construction 2019 1.19
Villa de Reyes - Guadalajara Villa de Reyes Guadalajara Fermaca Under Construction 2019 0.89
Samalayuca - Sasabe Samalayuca Sasabe Carso Gasoducto Norte Under Construction 2019 0.47
Sur de Texas - Tuxpan* Sur de Texas Tuxpan TransCanada - Sempra Completed 2019 2.60
Tuxpan - Tula Tuxpan Tula TransCanada Construction Halted Unknown 0.89
Tula - Villa de Reyes Tula Villa de Reyes TransCanada Construction Halted Unknown 0.89
Salina Cruz - Tapachula Salina Cruz Tapachula TAG Pipelines Comercial Under Construction 2019 0.04
* Sur de Texas - Tuxpan interconnects with Valley Crossing Pipeline.
Source: Energy Ventures Analysis
The completed 2.6 BCFD Sur de Texas-Tuxpan pipeline, which is a marine pipeline running almost entirely under the Gulf
of Mexico (See Exhibit 15), faced additional delays as the state electric utility CFE delayed the issuance of its operating
certificate. CFE previously requested seven international arbitrations, seeking reimbursement for the capacity payment
during pipeline delays. Just recently, in late August 2019, CFE announced that it had resolved the issue and reached an
agreement with pipeline developers, therefore withdrawing the arbitration process. In September 2019, the Sur de Texas-
Tuxpan marine pipeline has begun operating. The increase in natural gas flow via Sur de Texas-Tuxpan is expected to
replace LNG import at the Altamira terminal.
© 2019 ENERGY VENTURES ANALYSIS 15Natural Gas Market 2019-2020 Winter Outlook 2019-2020 Winter Another important export corridor is the Wahalajara system – a collection of Fermaca-built pipelines that connect Waha to the central Mexican market around Guadalajara and Villa de Reyes (See Exhibit 15). The system was previously delayed to mid-2019 but was reported to begin receiving natural gas flow in April 2019. However, the natural gas flow is largely restricted by the uncompleted Wahalajara segments and interconnections further downstream. Upon its completion, the Wahalajara system could ultimately provide takeaway for Permian gas production. EVA estimates that U.S. natural gas pipeline exports to Mexico will average 5.8 BCFD for the 2019-2020 winter, 1.0 BCFD (21%) higher winter-over-winter, driven largely by these pipeline completions. Exhibit 15: Recently Completed and Under Construction Gas Pipelines in Mexico Mapped by Energy Venture Analysis, based on information from SENER LNG Exports Starting in 2016, U.S. LNG exports have increased steadily, with six projects (eleven export trains) totaling 6.8 BCFD of export capacity currently under operation or commissioned (See Exhibit 16). For the 2019 summer, Cameron Train 1 (0.7 BCFD) and Corpus Christi Train 2 (0.7 BCFD) joined the LNG export fleet and entered commercial operation while Elba Island (0.2 BCFD) and Freeport Train 1 (0.7 BCFD) are currently conducting commissioning activities. © 2019 ENERGY VENTURES ANALYSIS 16
Natural Gas Market 2019-2020 Winter Outlook                                                                    2019-2020 Winter

Exhibit 16: U.S. Operating and Commissioning LNG Export Projects
                                                                           Capacity   Capacity
                   Company                     Project        Train                                    Status            ISD
                                                                           (mmtpa)     (BCFD)
            Cheni ere                  Sa bi ne Pa s s         T1             4.7        0.7     Opera ti ng          Feb-16
            Cheni ere                  Sa bi ne Pa s s         T2             4.7        0.7     Opera ti ng          Aug-16
            Cheni ere                  Sa bi ne Pa s s         T3             4.7        0.7     Opera ti ng          Ja n-17
            Cheni ere                  Sa bi ne Pa s s         T4             4.7        0.7     Opera ti ng          Aug-17
            Cheni ere                  Sa bi ne Pa s s         T5             4.7        0.7     Opera ti ng          Ma r-19
            Cheni ere                  Corpus Chri s ti        T1             4.7        0.7     Opera ti ng          Dec-18
            Cheni ere                  Corpus Chri s ti        T2             4.7        0.7     Opera ti ng          Aug-19
            Domi ni on Energy          Cove Poi nt                            5.8        0.8     Opera ti ng          Feb-18
            Ki nder Morga n            El ba Is l a nd      Pha s e 1         1.5        0.2     Commi s s i oni ng   Sep-19
            Sempra                     Ca meron           T1 (Pha s e 1)       4         0.6     Opera ti ng          Ma y-19
            Freeport                   Freeport                T1              5         0.7     Commi s s i oni ng   Sep-19
            Total                                                            49.2        6.8
            Source: Energy Ventures Analysis

Recent supply and demand shifts as well as ongoing trade tensions between U.S. and China have led to rapid changes in
U.S. LNG sales (See Exhibit 17). According to U.S. Department of Energy data, South Korea, Japan, Mexico and Chile are
the top destinations for U.S. LNG overall. Historical data shows that peak demand in South Korea and Japan has generally
occurred during winter heating seasons, while Mexico typically has imported more U.S. LNG for summer cooling demand.
China, the fastest-growing importer of U.S. LNG in 2017, sharply cut U.S. LNG imports starting in the fourth quarter of
2018 as the 10% import tariff (which has recently been lifted to 25%) was imposed between the two countries, leading
Chinese buyers to source LNG elsewhere. The trade tension is expected impact 0.3-0.4 BCFD of U.S. export demand to
China12. Apart from trade tension between the U.S. and China, a warmer-than-normal 2018-2019 winter in Asia also led
to limited growth in U.S. LNG exports to Asia. On the other hand, the shrinking price premium of the Asian and European
natural gas markets have directed U.S. LNG cargoes to European destinations. Since the fourth quarter of 2018, U.S. LNG
exports to Europe nearly tripled, with surging intakes from all U.S. export terminals. Due to the strong inflow of LNG,
natural gas storage levels in many European countries are currently higher than the five-year average ahead of the
upcoming heating season. However, despite storage being more full than usual for this time of year, LNG imports in
Europe remained strong throughout 2019 summer. This summer Spain imported high volumes of LNG as a summer heat
wave drove electric sector natural gas demand higher amid coal-to-gas switching and lower-than-normal hydropower
generation.
Exhibit 17: U.S. LNG Exports by Destinations

12
     This is estimated based on actual export volumes from U.S. to China in 2018 Q1.

© 2019 ENERGY VENTURES ANALYSIS                                                                                                 17
Natural Gas Market 2019-2020 Winter Outlook 2019-2020 Winter For the first two quarters of 2019, about 15% of the U.S. LNG export sales occurred on a spot basis, with Cheniere’s Sabine Pass and Corpus Christi facility showing the greatest flexibility. Globally, spot and short-term13 LNG trade also rose to a new high, indicating growing liquidity in physical LNG trading as the industry moves closer towards commoditization. The rise in spot and short-term trading can also be attributed to the growing volumes of LNG transacted by portfolio traders. Looking ahead to the 2019-2020 winter, three new trains—Elba Island Phase 2 (0.1 BCFD), Freeport Train 2 (0.7 BCFD), and Cameron Train 2 (0.7 BCFD)—are expected to start up this winter, bringing total LNG export capacity to 8.5 BCFD by March 2020 (See Exhibit 18). Assuming normal winter conditions globally, EVA forecasts LNG export demand to average 8.3 BCFD for the 2019-2020 winter. Exhibit 18: U.S. LNG Export Capacity by Train, Historical and Forecasted LNG Feedgas Demand Beyond this coming winter, a few more projects have made progress by reaching positive Final Investment Decisions (FIDs) and joined the second wave of U.S. LNG exports. Cheniere Energy made FIDs to build the third train at its Corpus Christi and the sixth train at the Sabine Pass export facility, raising the company’s total nameplate export capacity to 42.3 mmtpa (~5.9 BCFD). In early 2019, ExxonMobil and Qatar Petroleum jointly announced that they made FID at the 15.6-mmtpa (~2.1 BCFD) Golden Pass export facility and will proceed with construction, with the first of the three trains due for completion in early 2024. Venture Global made official an announcement that its 12-mmtpa (~1.7 BCFD) Calcasieu Pass facility received a positive FID and has already started construction. Assuming all the projects that cleared FIDs will proceed and finish construction on time, U.S. LNG export capacity will reach 14.6 BCFD by the end of 2025. 13 The distinction between “short-term” and “spot” LNG transaction matters. EVA defines ”short-term” as contracts with terms of four years or less, while “spot” is defined as an one-time transaction where delivery takes place 90 days or less from the date of the transaction. © 2019 ENERGY VENTURES ANALYSIS 18
Natural Gas Market 2019-2020 Winter Outlook                                                      2019-2020 Winter

IMO Implications on LNG Demand
Globally, marine vessels are moving more than 80% of global trade volume and more than 70% by value of goods traded.
Finalized in 2018, the International Maritime Organization (IMO) mandates a global 0.50% sulfur cap on vessel emissions
to be implemented on Jan 1, 2020—which is commonly referred as IMO 2020 (See Exhibit 19).

Exhibit 19: IMO Marine Fuel Sulfur Limit

                        (Percent by Weight)
                 5.0%                                   July 2012
                 4.5%                               from 4.5% to 3.5%
                 4.0%
                                                                              January 2020
                 3.5%
                                                                           from 3.5% to 0.5%
                 3.0%
                 2.5%
                 2.0%
                 1.5%
                 1.0%
                 0.5%
                 0.0%
                         2005             2010      2015            2020           2025           2030

Residual oil currently accounts for the largest component of bunker fuel. Vessel operators of marine vessels have several
compliance options for the upcoming IMO regulations. They can switch their fuels to a lower-sulfur fuel and/or blend
with distillate to comply with the new IMO regulations. Another option is to continue to use higher-sulfur fuels but install
scrubbers to remove sulfur from ships’ exhaust. Vessel operators also have the option to move away from petroleum-
based fuels completely and switch to LNG. Compared to other compliance options (e.g. low-sulfur fuel oil, marine gasoil,
scrubber retrofit), LNG is proven to emit only trace amounts of sulfur oxides—well below even the 0.1% fuel-equivalent
threshold in some cases14. LNG also has the capabilities to reduce carbon emissions, which could enable operators to
meet potential carbon regulations in the future. The growing availability of LNG could also give it a cost advantage
compared to fuel alternatives such as marine gasoil (MGO).

U.S. LNG bunkering currently takes place in two locations—Jacksonville, FL, and Port Fourchon, LA—with a third bunkering
facility under development in Tacoma, WA. Jacksonville is the largest LNG bunkering operation in the U.S., with two
bunkering facility—the operating JAX LNG and upcoming Eagle LNG facilities—positioned to serve not only a domestic
fleet but also larger international vessels. At Port Fourchon, LA, Harvey Gulf International Marine (Harvey) operates LNG
bunkering to fuel its small fleet of LNG-powered vessels. At the port of Tacoma, WA, Puget Sound Energy has proposed
an LNG liquefaction and bunkering facility to mainly serve vessel owners who operate along the 200-mile journey between
Washington and Alaska.

Large-scale LNG bunkering requires specialized infrastructure development for LNG supply and a large fleet of LNG-fueled
ships, which usually requires high upfront investment. To date, the number of LNG ports across the U.S. is limited and the
LNG distribution infrastructure remains in its infancy. Although newly built ships were either built with or offered to be
equipped with LNG-burning engines, reconfiguring existing ships appears to be less desirable because of the extra space
required for the larger fuel tanks. As the IMO compliance date draws near, it is still unclear how vessel operators will
choose to optimize their fleets through operational, engineering, and logistical decisions. EVA forecasts that in the near-
term, the use of LNG in marine bunkering will remain limited, due to high upfront investment cost and limited LNG supply
infrastructure. In the medium and long term, increased fuel availability and buildout of infrastructure would allow LNG’s
share of U.S. bunkering to grow more rapidly.

14
  LNG as a Maritime Fuel: Prospects and Policy:
https://fas.org/sgp/crs/misc/R45488.pdf

© 2019 ENERGY VENTURES ANALYSIS                                                                                          19
Natural Gas Market 2019-2020 Winter Outlook 2019-2020 Winter Supply Outlook Production Dry gas production has showed strong momentum so far this year, thanks to more than 12 BCFD of Northeast takeaway pipelines that were placed in service in 2018, as well as strong crude oil-associated production (See Exhibit 20). Year-to- date dry natural gas production climbed to 89.6 BCFD, or 8.9 BCFD (11%) higher than the same period last year. EVA estimates that non-associated and associated natural gas production contributed approximately 43% and 54% of the total year-over-year growth, respectively. Among basins, Marcellus production continued to lead the growth by adding 3.3 BCFD. Driven by higher oil production activity, Permian associated gas jumped 2.2 BCFD (29%) year-over-year. In July 2019, Hurricane Barry hit the Gulf Coast and curtailed nearly 1.5 BCFD (60%) of Gulf of Mexico production. However, the production disruption only lasted about five days and then quickly recovered to the pre-storm level of 2.7 BCFD by late July. Exhibit 20: Production Growth by Basin, 2019 vs. 2018 (through August) EVA expects lower-48 production to grow further during the 2019-2020 winter. Dry natural gas production is forecast to average 92 BCFD this winter, which will represent 3.8 BCFD (~4%) of growth winter-over-winter (See Exhibit 21). This winter, associated gas production from Permian will contribute to the largest gains since production can ramp up quickly as the 2-BCFD Gulf Coast Express pipeline and cross-border Mexico export pipelines enter service by the winter. EVA expects that production from the Permian will account for ~12% of lower-48 production. Elsewhere, production from the Marcellus, Utica, Haynesville will grow further to meet regional demand and fill takeaway capacity. The strong growth from these areas will more than offset declines from conventional plays. © 2019 ENERGY VENTURES ANALYSIS 20
Natural Gas Market 2019-2020 Winter Outlook                                                             2019-2020 Winter

Exhibit 21: Historical and Forecasted Dry Gas Production

However, there are a few factors that could alter the production outlook heading into the winter. The first and probably
the most important variable is natural gas prices. A lower gas price environment could increase the risk for producers,
especially those who do not hedge a significant portion of production volumes. Should natural gas prices fall towards
average breakeven costs, gas plays where breakeven costs are at the margin would have the most production risk,
including the Utica wet gas and Haynesville dry gas. However, associated natural gas production as well as Marcellus and
Utica dry gas present less risk as their breakeven costs are below average. Secondly, a strong supply glut will reach the
Gulf Coast this winter. Production that previously targeted the Gulf Coast area will have to compete with lower cost
Permian production. Finally, production freeze-offs may impact the pace of U.S. production growth. Exhibit 22 reviews
the impacts of historical freeze-off events in Permian and Northeast producing areas. The analysis measures the
production disruption15 when the region’s daily minimum temperatures fell below 32 degrees, the freezing point of water.
Overall, wet gas production in the Permian has a higher likelihood of freeze-offs than dry gas production in the Northeast.
In addition, colder and icier winters like the 2013-2014 and 2014-2015 winters showed higher level of freeze-offs. The
risk of weather-based supply disruption remains especially as Permian production gains momentum.

Exhibit 22: Estimated Production Disruption Due to Freeze-offs

15
  EVA defines a production disruption when daily production dropped below 2% of the monthly average production. In Permian,
historical daily production showed much higher volatility, so we use a 5% threshold for Permian. Total disruption is measured in BCF,
over the entire winter.

© 2019 ENERGY VENTURES ANALYSIS                                                                                                   21
Natural Gas Market 2019-2020 Winter Outlook                                                           2019-2020 Winter

In terms of takeaway capacity, new capacity installations in the Northeast peaked in 2018 at more than 12 BCFD (See
Exhibit 23). This huge wave of new takeaway capacity, along with stronger regional demand, allowed Appalachian gas
production to grow by nearly 8 BCFD. However, while the region appears to have ample spare capacity, the effective
capacity might actually be smaller given downstream pipeline constraints. For example, the Mountaineer Xpress pipeline
has flowed approximately 1.8 BCFD of natural gas, only 70% of the pipeline’s design capacity. Projects which have been
proposed may face further delays due to environmental obstacles. Under the process of seeking all required regulatory
approvals, Mountain Valley Pipeline is still targeting a mid-2020 in-service date. The 1.5-BCFD Atlantic Coast Pipeline has
pushed its full in-service date to early 2021 as a number of permits are currently on hold by the 4 th U.S. Circuit Court of
Appeals.

Exhibit 23: Northeast Production Takeaway Capacity vs. Production Growth

In the Permian, takeaway capacity constraints have put downward pressure on regional gas prices so far this year. Starting
in late March 2019, El Paso Permian and Waha delivered prices traded in the negative territory for a few times as
production growth outpaced takeaway capacity. In addition, the completion of several crude oil takeaway pipelines, which
allowed incremental growth of oil and associated natural gas production, further added to this imbalance. In late April
2019, a producer announced it would curtail gas production in response to low gas prices. However, Permian natural gas
production is still showing strong growth this year, mainly as most of the gas production is associated with oil, and can
even have a negative breakeven cost16, as the investment decision for the well is driven by oil economics. Higher crude
oil prices as well as improvement in drilling efficiency have also led to an increase in Permian’s Drilled but Uncompleted
Wells (DUCs) (See Exhibit 24) due to the infrastructure constraints. As of August 2019, Permian DUCs inventory stands at
3,839 wells, nearly 40% higher year-over-year17. This large backlog of DUCs will add a new wave of supply of up to 5.5
BCFD18 when takeaway pipeline capacity becomes available.

16
   The “negative breakeven cost” here means the economic considerations for Permian associated natural gas production is beyond
the natural gas pricing environment, and the decision to produce is mostly driven by crude oil profitability. Given current market
conditions, Permian crude oil production is still profitable to produce.
17
   EIA Drilling Productivity Report, released on September 16, 2019:
https://www.eia.gov/petroleum/drilling/
18
   This is estimated based on Permian DUCs inventory and an initial gas production of 1,450 MCFD.

© 2019 ENERGY VENTURES ANALYSIS                                                                                                22
Natural Gas Market 2019-2020 Winter Outlook                                                   2019-2020 Winter

Several projects in various stages of development will enable Permian production to grow (See Exhibit 25). The 2-BCFD
Gulf Coast Express will transport Waha gas to South Texas and has entered service in September 2019. In addition, the 2-
BCFD Permian Highway and 2-BCFD Whistler projects have reached positive FIDs and are scheduled to come online in late-
2020 and mid-2021, respectively.

Exhibit 24: Drilled but Uncompleted Wells, 2014 – June 2019

Exhibit 25: Permian Pipeline Takeaway Capacity vs. Production Growth

© 2019 ENERGY VENTURES ANALYSIS                                                                                      23
Natural Gas Market 2019-2020 Winter Outlook                                                                           2019-2020 Winter

The Interconnection of Natural Gas and Crude Oil
Natural gas and crude oil are distinctive forms of energy and often are inseparable in their overall production and use.
Both are produced using largely the same equipment and expertise and are often co-produced from wells drilled in many
geologic formations in the U.S. and around the world. The transportation systems differ to accommodate the physical
form of each commodity, and each commodity has differing, as well as overlapping, end uses.

The co-production of natural gas with crude oil is usually referred to as Associated Dissolved, or AD gas, and is defined by
its comingling with crude oil in a reservoir. AD gas production then is defined as the production of natural gas that occurs
when producing crude oil. The implementation of horizontal drilling and hydraulic fracturing to produce tight oil has also
led to the co-production of natural gas as well as hydrocarbon gas liquids (HGL).

The Exhibit 26 below shows the relative value of crude oil, as measured by WTI prices, as compared to natural gas, as
measured by Henry Hub prices, over several years on a constant energy basis (i.e., where prices for both commodities are
in $/MMBTU) as compared to the percentage of oil-directed rigs as compared to all U.S. rigs deployed. From 2000 to 2005
the oil-to-gas price ratio (OGPR) hovered at, or just above, one signifying that oil and gas were priced at the same level to
each other when measured on an energy-equivalent basis. After 2005 oil prices were seen to rise rather rapidly as
compared to natural gas which boosted the OGPR to nearly 6:1 by 2012. Since that time the OGPR has declined largely as
a result of the significant decrease in crude oil prices. During the past two years the OGPR has hovered at around 3.6:1,
indicating that crude oil remains 3.6 times more valuable than natural gas on an energy-equivalent basis.

Exhibit 26: Higher Crude Oil Prices Relative to Gas Drives Drilling Rig Deployment

                 Annual Ratio of Oil and Gas Prices (Energy Basis) and Oil-Directed Rigs to Total Rigs, through August 2019

                                                                                                              Oil:Gas Price Ratio
               100%                                                                                                                 7
                                    Oil:Total Rigs

                                    Oil:Gas Price Ratio (Right Axis)                                                                6
                80%
                                                                                                                                    5

                60%
                                                                                                                                    4

                                                                                                                                    3
                40%

                                                                                                                                    2
                20%
                                                                                                                                    1

                 0%                                                                                                                 0
                   2000                              2005                2010                       2015
                   Source: EVA, EIA, Baker Hughes.

Balancing supply: Focusing on crude oil production versus natural gas has its limits

The exhibit above also shows how exploration and production companies have endeavored to shift investments toward
oil-directed drilling. The percentage of drilling rigs directed at oil grew from being about 16% of all rigs from 2000 to 2005
to flipping above 70% of all rigs deployed in the U.S. by 2012. The percentage of oil-directed rigs has leveled off at the 80%
level through 2019. Arguably, tracking rigs by what companies say they were drilling for could be problematic analytically.
However, it does indicate how producers have sought more oil and minimize natural gas production in response to market
prices.

© 2019 ENERGY VENTURES ANALYSIS                                                                                                         24
Natural Gas Market 2019-2020 Winter Outlook 2019-2020 Winter
Shale gas and tight oil plays have been the main drivers of the U.S. renaissance in hydrocarbon production. As the Exhibit
27 provided below shows, each of the shale plays can be characterized by how much natural gas is produced as a fraction
of crude oil produced. Some plays, such as the Marcellus, produce almost no crude oil while the Permian basin does
produces significantly higher levels. Indeed, within each of the crude oil-producing plays there exists a variation in how
much natural gas is produced with crude oil.
Exhibit 27: Tight Oil and Gas Plays Produce Natural Gas
Percent Natural Gas to Total Oil and Gas Produced, Energy-Equivalent Basis
(% gas in total)
100%
80%
60%
40%
20%
0%
2000 2005 2010 2015 2020
Permian Eagle Ford Woodford
Bakken Niobrara-Codell Mississippian
Source: EVA analysis of EIA data.
Note: Production from Marcellus, Haynesville and, Barnett is 100% gas; Utica Shale production is also 100% gas since 2008; Fayetteville Shale
production is 100% gas starting 2004.
The reasons why natural gas continues to be produced with crude oil are based on geology and global crude oil prices.
While it is possible to direct drilling into reservoirs that produce almost no natural gas, the technology of production favors
the production of lighter crudes that have shorter hydrocarbon chains making it easier for the molecules to pass through
the cracks in the shales. These shorter-chain molecules are more likely to be collocated with even shorter chain molecules,
such as HGL, and even the shortest chain hydrocarbon of them all, natural gas. With regards to economics, natural gas
provides an assist in producing crude oil, much like a propellant, in that it helps to push the heavier hydrocarbons out into
the borehole. The natural gas-driven crude enhances the rate of production, and hence, the financial return.
Balancing demand: The higher price for crude oil drives demand for natural gas
The continued industrial tug of the potential substitution of crude oil and petroleum products with natural gas has driven
significant investments across a range of technologies, which the industry often refers to as midstream and downstream
investments. Many, if not most, of the industrial capacity expansions discussed in this report, are driven by low natural
gas prices that allow for producing commodities, such as bulk chemicals, that have a higher value based on international
petroleum and natural gas prices, and are more easily transported and consumed than natural gas. An excellent current-
day indicator of investment in capacity to drive the demand for natural gas instead of petroleum is LNG, as discussed
previously in this report. Demand for U.S.-sourced LNG often goes toward heating and power generation that would
otherwise be provided by higher-cost petroleum fuels.
© 2019 ENERGY VENTURES ANALYSIS 25Natural Gas Market 2019-2020 Winter Outlook 2019-2020 Winter
Gas Flaring in Bakken and Permian
High natural gas production and lack of takeaway infrastructure have led to negative pricing and gas flaring in some
regions. As production growth continues to outpace pipeline takeaway capacity, gas flaring and venting in the Permian
basin reached a record high in Q1 2019, averaging 661 MMCFD19, up more than 50% year-over-year (See Exhibit 28). In
Q1 2019, gas flared in the Permian region accounted for nearly 5% of the basin’s gross production. The basin-wide flaring
is expected to ease as soon as the 2-BCFD Gulf Coast Express enters service, providing an outlet for strong production
growth.
Natural gas Production in the Bakken basin reached 500 MMCFD in Q1 2019, more than double the level a year-ago (See
Exhibit 29). As a result, the percentage of gas flared in Bakken reached 20%, surpassing the 12% goal imposed by North
Dakota Industrial Commission in Order No. 24665. In the Bakken basin, climbing oil and associated gas production
combined with a lack of pipeline and processing capacity have resulted in record gas flaring so far this year. The looming
constraints and increasing oil production have provided opportunities for more investment in takeaway capacity and gas
processing facilities, which will consequently reduce gas flaring.
Exhibit 28: Permian Gas Flaring, 2017 – March 2019
16,000 (MMCFD) 6%
14,000
5%
12,000
4%
10,000
8,000 3%
6,000
2%
4,000
1%
2,000
0 0%
Jan-17 Apr-17 Jul-17 Oct-17 Jan-18 Apr-18 Jul-18 Oct-18 Jan-19
Gross Gas Production Percent Flared (Right Axis)
Source: Rystad Energy, U.S. EIA, Energy Ventures Analysis
Exhibit 29: Bakken Gas Flaring, 2017 – May 2019
(MMCFD)
3,000 25%
2,500 20%
2,000
15%
1,500
10%
1,000
500 5%
0 0%
Jan-17 Apr-17 Jul-17 Oct-17 Jan-18 Apr-18 Jul-18 Oct-18 Jan-19 Apr-19
Gross Gas Production Percent Flared (Right Axis) ND State Flare Limit (Right Axis)
Source: Rystad Energy, OPIS PointLogic, Energy Ventures Analysis
19
Permian Natural Gas Flaring and Venting Reaching All-time High:
https://www.rystadenergy.com/newsevents/news/press-releases/Permian-natural-gas-flaring-and-venting-reaching-all-time-high/
© 2019 ENERGY VENTURES ANALYSIS 26You can also read