Transmission Grid Planning in systems with high shares of Renewable Energy - dena-REPORT
←
→
Page content transcription
If your browser does not render page correctly, please read the page content below
dena-REPORT
    Transmission Grid Planning in systems
    with high shares of Renewable Energy
    Planning the future energy system in China.

1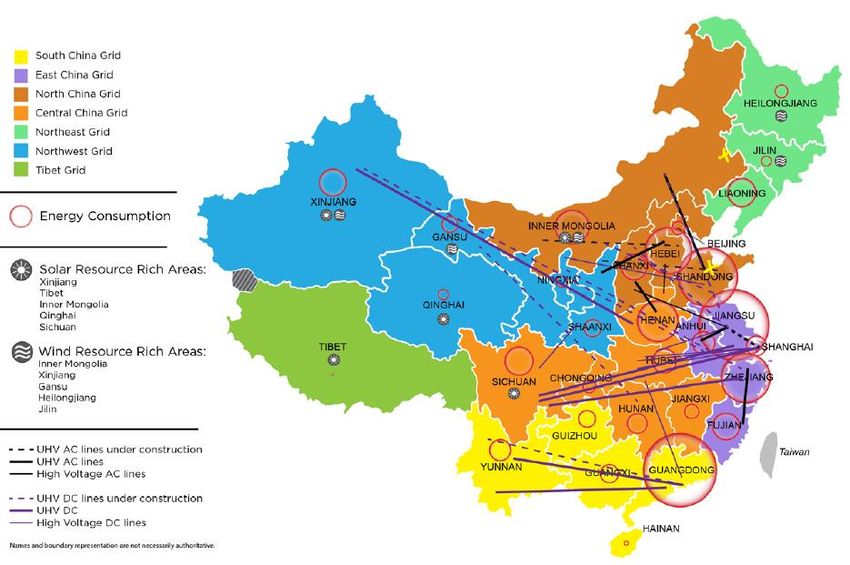
Imprint

    Publisher
    Deutsche Energie-Agentur GmbH (dena)
    German Energy Agency
    Chausseestrasse 128 a
    10115 Berlin, Germany
    Tel: +49 (0)30 66 777 - 0
    Fax: +49 (0)30 66 777 - 699
    E-mail: info@dena.de
    Internet: www.dena.de

    Authors
    Reemt Heuke, dena
    Carolin Schenuit, dena
    Yanan Zheng, China Renewable Energy Center (CNREC)
    Anders Hove, GIZ
    Wang Xinnan, GIZ

    Photo credits cover picture: ©shutterstshutterstock.com/gui jun peng

    Date: 06/2019
    All rights reserved. Any use is subject to consent by dena.

2
Contents

     Imprint ........................................................................................................................... 2

Executive Summary.................................................................................................. 4

1    Transmission Grid Planning in systems with high shares of Renewable Energy (RE) .. 7

     1.1        Grid planning processes in China: managing highly dynamic demand growth and
                parallel RE expansion ................................................................................................. 7

     1.1.1      The current grid planning process ............................................................................. 9

     1.1.2      Elements of Chinese grid planning that enable RE integration .............................. 13

     1.1.3      Elements of Chinese grid planning that hinder integration of RE........................... 13

     1.2        Grid planning processes in the EU: Integrating national plans into one conjoint
                EU-wide plan ............................................................................................................. 14

     1.2.1      The Ten-Year Grid development plan (TYNDP) process ........................................... 14

     1.2.2      Example of a national grid planning methodology: Germany ................................ 18

2    Integrated grid planning as base for an efficient power market in China ................ 20

     2.1        Scenario comparison: demonstrating the advantages of an integrated grid
                planning approach.................................................................................................... 20

     2.1.1      Lower total system cost ............................................................................................ 21

     2.1.2      Higher market efficiency and market participation ................................................ 22

     2.1.3      Higher cost efficiency by reducing curtailment of RE power generation ............... 23

     2.1.4      Higher climate efficiency through quicker CO2 emission reductions...................... 24

     2.1.5      Ensuring security of supply by enabling a robust and cost-efficient system ......... 25

     Excursus: How to achieve a more efficient energy system by establishing a more
            intermeshed grid layout ........................................................................................... 26

3    Planning the future energy system in China: Ideas for process developments ........ 29

     Figures and Tables ......................................................................................................... 31

     Bibliography.................................................................................................................. 33

                                                                                                                                                3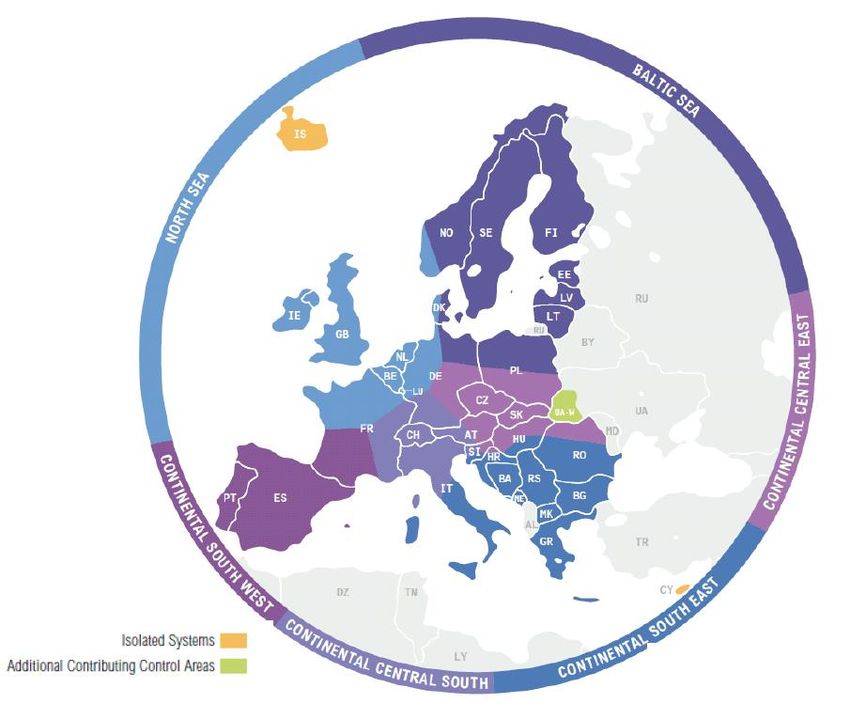
Executive Summary

Power grid planning is an import task in designing and implementing the transformation of energy systems
towards high shares of Renewable Energy (RE). When planning how to integrate RE, it is important to con-
sider various different aspects and interdependencies in power grid planning and focus on the optimisa-
tion of the whole energy system. Energy systems with high shares of RE are increasingly complex, so it is
important to consider several technical and economic aspects and policy goals in the planning process.

China’s current power planning procedure includes three components: demand, generation and transmis-
sion, which correspond to demand forecasting, power source planning, and power grid planning. Over the
past decades, power planning has been continuously improved. China's power planning is divided into na-
tional (including regional) and provincial power planning. National power planning integrates separate pro-
vincial power planning results and is compiled in parallel with provincial planning. The final national power
plan is issued by the National Energy Administration (NEA) after being approved by the National Develop-
ment and Reform Commission (NDRC). The provincial power plan is submitted to NEA and issued by the pro-
vincial government after reaching an agreement with the national plan. The National Electric Power Plan-
ning and Research Centre and other qualified research institutions undertake the planning. After the im-
portant planning topics are completed, the energy authority will have consulting agencies and experts re-
view the document. Environment and water resource topics will be addressed by relevant government au-
thorities.

The first step of China’s grid planning is the power flow analysis and is carried out simultaneously with power
balance simulation. The second step is to conduct economic and technical analyses of proposed transmis-
sion lines to optimize the grid layout. The economic analysis aims at evaluating the lowest cost of line con-
struction. The technical analysis evaluates the impact of a new line on the operational stability of the system,
considered for different regions and voltage levels. Planners conduct both project-specific and annual static
and dynamic measurements of investment needs, aiming to reduce the total annual cost. In addition, de-
tailed environmental and social impact analysis elements are listed in the Planning Principles.

The grid planning approach in Europe is divided into three steps to develop the European Union (EU)-wide
Ten-Year Grid development plan (TYNDP): The first step is the development of scenarios. The potential devel-
opment of the energy system is analysed in order to identify what Europe needs in terms of electricity trans-
mission infrastructure. The scenarios aim to address uncertainties and are no predictions of the future. Vari-
ous stakeholders, like Non-governmental organizations (NGOs), scientists, industry associations represent-
ing transmission grid users (like generators, distribution grid operators, suppliers and traders), market
participants, consumers (including industry), power exchanges and national regulators (where appropriate)
are formally invited to participate in the scenario creation during consultations. The second step is called
planning studies. The TYNDP usually contains four scenarios describing the potential development of the
future power system. There is a scenario with ambitious objectives regarding the utilization of RE, a scenario
that focuses on the effects of a more decentralized power system and a scenario with focus on political con-
siderations, like a strong European legal framework. Using common methodologies like market and grid
modelling, experts from all EU member states look at how power could flow in Europe in 2030 and 2040 with
regard to the different scenarios. This allows them to predict where bottlenecks could occur and how much
transmission capacity is needed at borders to manage these flows. As for the scenarios, the list of projects
and regional investment plans are open to public consultation before being finalized. In the third step, single

                                                                                                                  4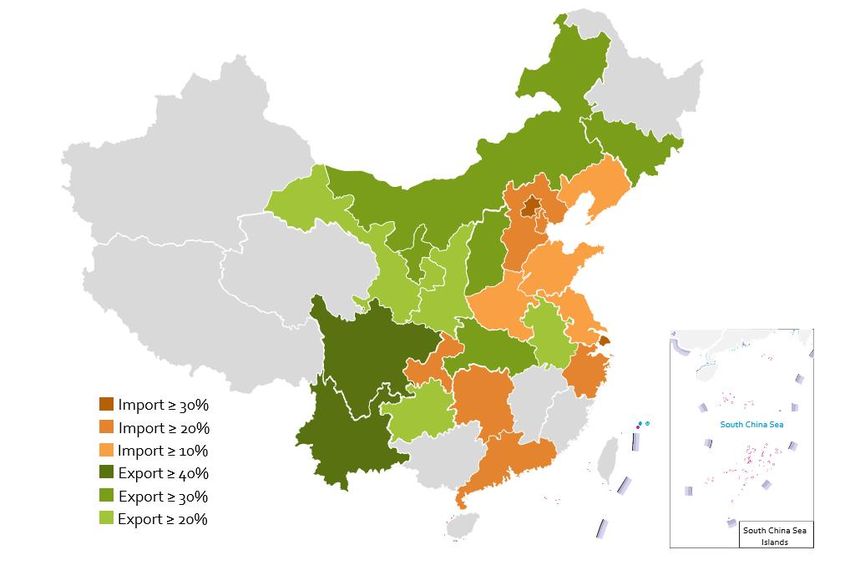
projects are assessed. In this phase, planners assess cost and benefits of projects taking into account how
projects support the environment, social welfare, the security of supply and other criteria with regard to total
societal costs and benefits.
Based on this multi-criteria assessment, the TYNDP report informs about the value of each recommended
infrastructure project. The TYNDP is providing decision-makers with a robust and detailed analysis of trans-
mission infrastructure as base for their decisions. The Agency for the Cooperation of Energy Regulators in Eu-
rope (ACER) checks whether the draft of the TYNDP by the European Network of Transmission System Opera-
tors for Electricity (ENTSO-E) is coherent with the Unions policy goals, regulatory framework and national
plans of the Member countries. ACER decides whether the TYNDP is appropriate before it is send to the Euro-
pean Commission. The European Commission uses the final TYNDP to decide which projects are projects of
common interests (PCI) and hence eligible to obtain funding support for the implementation.
This paper demonstrates the benefits of an advanced multi-criteria grid planning approach based on
scenario modelling results. It compares the stated policy scenario of the China Renewable Energy Outlook
(CREO) 2018 with an optimally planned and expanded electricity grid with a scenario without grid planning
and grid expansion—meaning the grid would remain unchanged from the present grid. The results of the
modelling show that a properly planned electricity grid leads to lower overall system cost, lower emissions,
better integration of renewables and less curtailment, as the figures below show.
System cost (billion Renminbi) CO2 emissions (billion tons)
138 122
121
137,5 120
119
137
118
136,5 117
116
136 115
Stated Policy Frozen Grid Stated Policy Frozen Grid
Scenario Scenario
Figure 1: Cumulated system cost in Renminbi (RMB) and CO2 emissions from 2016 to 2050
Based on the results of the analysis, this report makes the following suggestions for grid planning pro-
cesses in China:
Grid planning methodologies in China should increasingly consider uncertainties of grid planning and
analyse the impacts of different policies and developments on the electricity system. Grid planning can be
used to illustrate the impacts of different policies and resulting developments of the electricity system,
such as new generation capacity, different price levels, and various market designs. Using these uncertain-
ties, different scenarios can be developed and analyses using energy system models to evaluate the need
for electricity grid investments in different scenarios.
For grid planning to achieve its highest value for policymakers, power planning should include two-way
interaction between the grid planners, the political stakeholders and the people (citizens, provinces, com-
panies) who are affected by their decisions. The importance of implementing electricity markets in the
Chinese power planning is expected to increase significantly, and more market-based analysis will inte-
grate the effects of electricity markets like inter-provincial transactions.1
5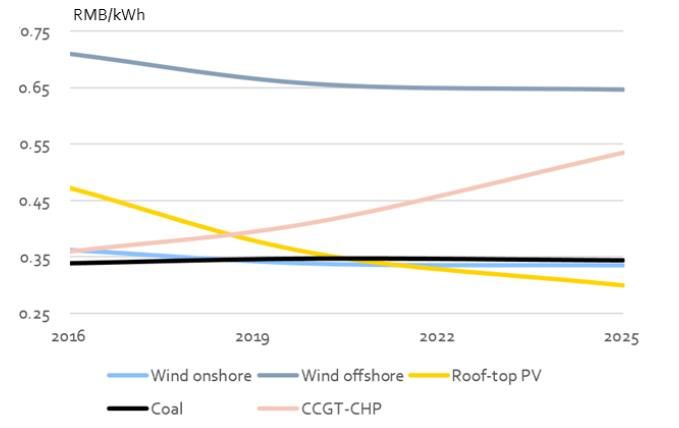
Grid planning processes in China should transition to a system-wide optimization. System-wide optimi-
zation means optimizing overall cost efficiency, electricity flows and system stability in an integrated per-
spective, rather than only considering how to optimize investment in each new transmission line. This
would help to lower overall cost and increase benefits of grid expansion of the electricity system.
In addition to capital cost and tariffs, China should include the assessment of social welfare, emission
reductions and environment into the evaluation of the investment in transmission lines.
For each grid area, it is recommended to include the secured generation capacity of its respective re-
newable portfolio in the grid planning procedures to replace conventional generating capacity. Using
portfolio effects in grid planning (i.e. smoothing renewable generation when looking at a large geograph-
ical generation area) lowers the need for back-up capacity to ensure security of supply.
6
1 Transmission Grid Planning in systems with high
shares of Renewable Energy (RE)
1.1 Grid planning processes in China: managing highly dynamic demand
growth and parallel RE expansion
In the early stage of China’s power grid construction, the main purpose of power grid expansion was to en-
sure the power supply and to expand coverage to areas without power. Since many power generation re-
sources are concentrated in the west and the north, and the electric load centres are concentrated in the
most populated central and eastern coastal areas, the expansion of China’s transmission lines is based on
the West-to-East concept using three main transmission corridors (see Figure 2). The northern path trans-
mits coal power from Inner Mongolia and Shanxi and hydropower in the middle and upper reaches of the Yel-
low River to the Beijing-Tianjin-Hebei region. The middle path connects hydropower bases in Qinghai and in
central and western Sichuan to the east. The southern path sends surplus thermal power and hydropower
from Yunnan and Guizhou to the southern coastal provinces.2 By the end of 2017, the total length of China's
220 kilovolt (kV) and above transmission lines reached 688,000 km, four times that of 2000 (164,000 km). Ex-
tra-High-Voltage (EHV) and Ultra-High-Voltage (UHV) lines of 500 kV and above reached 205,000 km, which
was 7.6 times that of 2000 (27,000 km).3 The total transfer capacity of West-to-East reached 225 GW, 4.5 times
that of 2007 (49.8 GW).4 Currently, there are eight 1,000 kV UHV alternating current (AC) lines and 13 ± 800kV
UHV direct current (DC) lines in operation.5 The nation's power supply and demand situation overall is ade-
quate, and most areas have excess to generation capacity. Some areas may face generation shortages in
summer.6 In 2015 China has achieved a nationwide electricity access rate of 100%.7
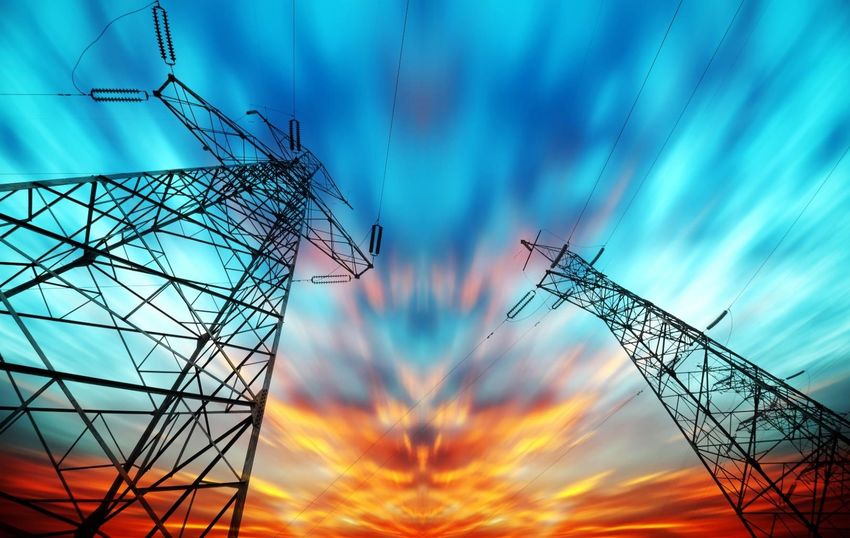
Figure 2: China's power grid regional division and "West-to-East" power flow
7
In the past ten years, China has expanded the proportion of renewable energy in the power mix. Central gov-
ernment policy is pushing to shift system operations from planned dispatch to market-based power transac-
tions. While China continues to build long-distance transmission lines, it also requires a stronger regional
and inter-provincial interconnection capability. At present, China has six regional power grids: Northeast
China, North China, Northwest China, Central China, East China and South China. 8

The three regions of Southwest, Northwest, and Central China have the largest power exports, accounting for
more than three-quarters of the total. In 2017, out of 34 provinces and regions in China, 20 provinces’ net
electricity export exceeded 10 terawatt hour (TWh) (see Figure 4), and 13 provinces’ net electricity imports
exceeded 10 TWh. The Southwest is rich in hydropower: Yunnan and Sichuan provinces have the largest pro-
portion of inter-provincial power export in China, with more than 40% in 2017. Beijing and Shanghai—the
most densely populated cities (except Hong Kong and Macau)—source 63.1% and 43.3% of annual electricity
consumption from external supplies.9 Inter-regional and inter-provincial power transmission is increasing
(see Figure 3).

China’s power grid faces several challenges. For example, many regions have generation overcapacity but
still the peak load regulation is difficult to fulfil due to high shares of inflexible coal power plants and the re-
sulting lack of supply side flexibility. The construction of transmission lines that should help to integrate re-
newables has lagged, leading to serious curtailment of wind and solar energy. Overall China's power grid has
grown rapidly and the current power planning system supported that growth quite efficiently. But China is in
the process of transitioning to a low-carbon energy system, and it will likely have to adjust power planning
approaches to meet the challenges of new developments, policies and technologies.

Figure 3: Interregional power transmission from 2006 to 2017 (TWh) 10

                                                                                                                       8
Figure 4: Provincial percentage of electricity import/export of total consumption/generation in 201711 (Note: only includes
provinces whose net import/export electricity exceeded 10 TWh in 2017).
1.1.1 The current grid planning process
Responsible parties and planning processes
China's power planning is divided into national and provincial power planning. In 2016, the National Energy
Administration (NEA) issued the Measures for the Management of Electric Power Planning, which clarified the
participants and related responsibilities of the two types of power planning. 12 The national power plan is led
by NEA, and the provincial power plan is led by the provincial energy authorities. National power planning
integrates provincial power planning, and is conducted in parallel. NEA issues the final national power plan
after its approval by the National Development and Reform Commission (NDRC). The provincial power plan
is submitted to NEA and issued by provincial governments after harmonization with the national plan.
China’s grid and generation planning (see Figure 5) is carried out with a lead-time of two years. The respon-
sible National Energy Administration (NEA) delegates detailed planning tasks to the National Electric Power
Planning and Research Centre (also known as the Planning Centre), State Grid Beijing Institute of Economics
and Technology and other qualified research institutions. 13 The China Electricity Council (CEC), industry as-
sociations, research institutes, universities, and power companies assist. Energy policy-makers integrate
their opinions and suggestions through special visits, studies, and seminars. Power generation companies
are responsible for providing basic data for planning. After completing important planning tasks, NEA orders
consulting agencies and experts to conduct a review. NEA consults with the relevant government depart-
ments on questions related to the environment and water resources. 14
9Figure 5: Power planning research and preparation workflow 15
Types of planning
China's power planning is a three-level plan under the national economic development plan and energy sec-
tor plan. The goal of power planning is to invest economically in the power sector and provide an optimized
power development program to ensure safe and stable power supply for the entire society at the lowest total
social cost. At the same time, planning should also keep in accordance to national policies and the techno-
logical development trend.16 Especially after the adoption of the Paris Agreement, the goal of energy conser-
vation and emission reduction in power planning is clearer and more ambitious. For example, the govern-
ment has proposed specific targets for coal power phase out and carbon intensity cap of coal-fired power
plants.17
As early as 1997, China adopted the Principles of Power Development Planning (hereinafter referred to as
Planning Principles). The Planning Principles clarify that the schedule of power planning is consistent with the
national economic development plan, and is divided into short-term planning (5 years), medium-term plan-
ning (10-15 years), and long-term (15 years or more) planning. Both the short-term planning and the long-
term planning are revised every five years, and the medium-term planning is revised every three years.18
The short-term plan focuses on solving the existing problems of the power grid, and proposes annual
power grid retrofit and grid expansion plans to meet load growth as well as to improve power supply
quality and reliability.
The medium-term plan is linked to the short-term plan. Feasibility studies are carried out on proposed
power generation projects, transmission channels and substations in the medium-term time horizon.
The long-term plan focuses on the overall strategic deployment of the power system, and proposes the
basic principles and directions for sustainable power development, including the overall power supply
scale and basic layout, as well as the backbone grid framework.19
Power planning includes three parts: demand and load forecasting, power source planning and power grid
planning. At the same time, the government will organize a number of special research topics. In addition to
power topics, it also involves new energy, electricity markets and environmental issues. For example, during
the 13th Five-Year power planning period, the Planning Centre organized the Study on the Joint Transmission
of Wind and Coal Power, Research on Wind Power Participation in Power Balance, Research on Business Model
and Consumption Issue of Photovoltaic Power Generation, the Research on The Development Planning of Elec-
tric Vehicle Charging Facilities and the Research on Environmental Impact Assessment of Planning Schemes.20
10Demand and load forecasting
Load forecasting is the first step in power planning. China adopts a bottom-up approach, from the provincial
to regional to national level, focusing on long-term electricity demand, peak load, load distribution, and load
structure.21 The load forecast will propose three scenarios: high, medium and low. The high scenario mainly
reflects strong economic growth and the load in continuous high temperature weather in summer. The me-
dium-term scenario represents the steady operation of the economy and the slow temperature rise in sum-
mer. The low scenario considers the economic growth slowdown and the summer temperature lower than
the normal level.22 Ultimately, only one load scenario will be recommended as the basis for subsequent
power source planning and grid planning. Although marketization and new energy factors are gradually be-
ing incorporated, the current development of electricity prices, electric vehicles and energy storage has little
effect on the overall load forecast.23
Power source planning
Power source planning will determine the scale and layout of each power source. The plan will provide multi-
ple power source construction plans to determine the newly installed capacity required and their investment
needs.24 Based on the goal of non-fossil energy accounting for more than 15% of primary energy consump-
tion by 2020, power source planning will first develop scenarios for non-fossil power sources.25 In each sce-
nario, according to the regional power balance and local renewable power consumption capability, the scale
of each fossil power source and each peak shaving power source in the region is proposed. Finally, according
to the economic and technical analysis, the regional total installed capacity and power structure will be de-
termined.26 The scenarios will consider different resource conditions and policies to plan for different power
sources. The power balance analysis is based on regional characteristics, using annual, monthly, or typical
weekly and daily load curves.27
Coal, Oil, Gas, Nuclear Renewable Energy Others
• Production capacity, reserves, • Available hydropower capacity • Power grid construction process
import dependence to develop, economic and • Power system reform
• Coal, oil and gas fuel prices technological prospects of • Electricity replacing to fuel
• Natural gas storage and development targets
transportation infrastructure • Wind, solar resources potential • Improved level of smart power
• Coal phase out and fuel and regional consumption consumption
switching from coal to gas restrictions • Energy saving and
targets • Biomass collection, storage and environmental protection
• Nuclear safety consideration transportation capability requirements
Table 1: Factors considered in power source planning 28
Considerations for the optimization of the planning process include constraints and optimization measures
(see Table 1). Constraints are e. g. initial, operational and maintenance cost of the project, supporting grid
construction costs, fuel consumption and waste disposal. The optimization measures consider effects of poli-
cies on power supply, power grid and load, such as coal power flexibility, peak-valley power price mecha-
nisms and electric vehicles participating in peak shaving efforts. Specific policies regarding support and inte-
gration of RE are also key elements of system optimization. 29
Power grid planning
The power grid planning is carried out in parallel with the power source planning. The purpose is to maintain
the stability of the power grid operation and meet the power demand. Power grid planning must also be
11linked to other energy infrastructure construction plans, such as natural gas pipelines, rail transit corridors,
telecommunication networks, electric vehicle infrastructure and key resource protection areas. Power flow
analysis is the first step in grid planning and is carried out simultaneously with power balance simulation.30
The second step is to conduct economic and technical analysis of the transmission line projects to get the
optimal grid layout. Economic analysis aims at lowest possible total cost including both the initial invest-
ment and cost of operation and maintenance. Technical analyses check if the line construction plan can
meet the requirements of stable operation of the system, which is considered in different regions and voltage
levels. Grid planning includes transmission line planning and distribution grid planning. Transmission grid
refers to transmission lines of 220kV (110kV in few regions) and above within the province and across regions
and provinces (see Table 2). Inter-regional grid interconnections are a very important part of maintaining
system stability, and is analysed during grid planning. Safety requirements include power distribution ratio,
the N-1 fault test and secure provision of load peaks.31
Voltage Level AC DC
Ultra-high 1000kV ±800kV, ±1100kV
Transmission Grid Extra-high 330kV, 500kV, 750kV ±500kV, ±660kV
High 110kV, 220kV ±50kV, ±100kV
High 35kV, 66kV, 110kV N/A
Distribution Grid Medium 10kV, 20kV N/A
Low 380/220V N/A
Table 2: Transmission and distribution grid levels in China32
Cost Benefit Analyses (CBA)
In the planning process, project-specific and annual static analyses of the investment and financing needs
are carried out. The goal is to reduce the annual cost and ensure funding.33 For example, investment esti-
mates for grid projects will be based on the cost for equipment, construction and taxes over the past two
years.34 In addition, detailed environmental and social impact analysis (see Table 3) are conducted according
to the Planning Principles. However, a standardized quantitative evaluation system has not been estab-
lished yet.35
Environmental Impact factors Social Impact factors
• Sulfur dioxide emission, smoke emission, waste • Immigration, inundation area, household income,
water discharge, solid waste production, average consumption level, agricultural investment, output
dust removal efficiency of coal-fired power plants, value of township enterprises, culture and
comprehensive utilization efficiency of fly ash, coal education, health, religion, ecological environment,
consumption, water consumption, floor space, lines etc., to avoid major negative impacts on social
and corridors, flooded area of hydropower station development
reservoirs, ecological environment, spent fuel
production of nuclear power plant, clean coal
(including desulfurization) installed capacity,
environmental protection investment and share in
total investment
Table 3: Environmental and social impact factors that need to be considered 36
121.1.2 Elements of Chinese grid planning that enable RE integration
Policy objectives are considered during planning. They are the primary macro factors to consider in power
planning in China. Apart from renewable energy goals, targets of energy storage and electric vehicles devel-
opment are also gradually involved.
The 11th Five-Year Plan for Power Development has set goals for 2020, that non-fossil energy accounts
for 15% of primary energy consumption and 39% of total installed power capacity. Among them, wind and
solar photovoltaic (PV) reaches 210 GW and 110 GW respectively.37
The Clean Energy Consumption Action Plan (2018-2020) aims at the national wind curtailment rate to be
below 12%, 10% and 5% in 2018, 2019 and 2020 respectively. For these three consecutive years, the solar
curtailment rate should be controlled below 5%.38
The Guidelines regarding the Establishment of an Orientation Mechanism for the Development and
Utilization of Renewable Energy by the NEA set a minimum indicator for the non-hydropower renewable
consumption in each province's electricity consumption by 2020. 39
The 13th Five-Year Plan for Renewable Energy Development specifies that energy storage technology
application pilot projects shall be carried out, which combine new energy micro grids and other projects
with distributed energy generation. The goal is to improve the economics of energy storage technology in
the field of renewable energy and promote the realization of commercial applications.40
These policy goals need to be considered during planning and be realised with the help of planning. How-
ever, there are still some elements of grid planning that hinder integration of RE.
Policy objectives are the primary considerations in planning. In recent years, China's energy policy mecha-
nism has been continuously improved, and more and more renewable energy development targets have
been incorporated into power planning. For example, renewable energy installed targets, abandoned wind
and light control targets, and non-hydro renewable energy consumption targets. At the same time, with the
development of new energy technologies on the demand side, planning for the application of energy storage
and electric vehicle technology has also been considered.
1.1.3 Elements of Chinese grid planning that hinder integration of RE
Power planning in China have become quite complex in the overall system. The planning incorporates a large
number of socio-economic and technical evaluation indicators, conducts scenario analysis, and provides
support through various special topics. In the process of energy and industry transformation, China's elec-
tricity use behaviour is quietly changing - the growth rate of high energy consumption is decreasing, and the
service industry is rising.41
In order to encourage the development of new energy sources and accelerate the progress of the electricity
market introduction, China has introduced a series of new policies. This has increased the uncertainty of the
energy and power sector. The current power planning approach considers uncertainties of future develop-
ment to a low extent, therefore it has had an impact on the implementation of power planning. For example,
the government issued new policies in the past few years requiring to slow down the expansion of thermal
coal power plants, so the operating hours of UHV lines now is lower than planned. Ultimately, the actual an-
nual power capacity utilisation of some UHV lines is less than one quarter of the designed capacity. 42
13Although the provincial power planning and the national power planning are interlinked, the provincial
power grid planning is prepared by the provincial power grid companies and approved by the provincial en-
ergy authority. This may result in unsynchronized or uncoordinated construction of provincial and major in-
ter-provincial grid lines or between grids in different provinces. Therefore, it is necessary to strengthen the
coordination of power grid planning on national and regional levels.
China’s power planning also lacks two-way interaction. First, the role of spot power market will be more im-
portant in the near-term power system, and a more market-based analysis could help to activate inter-pro-
vincial transaction-based power flows and thereby facilitate better capacity utilisation and integration of
RE.43 Second, the government has issued a clear guiding direction on involving distributed power sources
into the system, e. g. electric vehicles and off-grid energy storage facilities, while the planning process has
not considered the impacts of such measures specifically.
The Chinese grid planning focuses on specific projects like a certain transmission line or transmission corri-
dor and how these can be used efficiently by balancing power supply at the sending end and demand at the
receiving end. This approach neglects RE since they have low operating hours, but can supply electricity with
low additional cost. It is needed to optimize the overall energy system instead of specific lines, considering
cost efficiency, electricity flows and system stability in an integrated perspective.
China evaluates the investment of transmission lines only with capital cost and tariffs, but makes very rough
assessment to social welfare, emission reductions and environment qualitatively. The capacity factors of RE
like wind and photovoltaic in the Chinese grid and peak load supply planning is quite low, which leads to a
higher assumed need of coal power plants. However, the capacity factors of renewables should be consid-
ered for a certain area not one single power plant, since fluctuating generation of RE are smoothened over
larger balancing areas.
1.2 Grid planning processes in the EU: Integrating national plans into one
conjoint EU-wide plan
In the following chapter the processes and actors of grid planning in Europe and Germany are described.
Grid development is a vital instrument in achieving European energy policy objectives, which are security of
electricity supply across Europe, sustainable development of the energy system with RE integration and af-
fordable energy for European consumers through transnational market integration.
1.2.1 The Ten-Year Grid development plan (TYNDP) process
ENTSO-E was formed according to a European Commission Regulation (EC 714/2009). It consists of 41 trans-
mission system operators (TSOs) from 34 countries. The objective of ENTSO-E is to ensure optimal manage-
ment of the electricity transmission grid which enables trading and supplying electricity across borders in
Europe.
One of the main tasks of ENTSO-E is to elaborate regularly the EU-wide Ten Year Network Development
Plan (TYNDP), which provides the central reference point for European electricity grid development. The
TYNDP 2018 for example explores the possibility of a European power system where 75% of the emissions in
the EU will be cut by 2030 and up to 58% of the demand will be covered by RE. The plan deals among others
14with target capacities, transmission adequacy1 and cost benefit analysis of new transmission lines. The YNDP
is carried out on a regular basis every two years by 41 TSOs from 34 countries (see Figure 6). The process is
managed by ENTSO-E, the European association of transmission system operators. These TSOs serve 525
million citizens with electricity, are responsible for around 310.000 km of transmission lines, ensure the deliv-
ery of 3.300 TWh / year of electricity and supply 400 TWh/year of transnational electricity exchange. The
TYNDP considers challenges in building the necessary infrastructure, security of supply, cost benefit analysis
of new transmission lines, drivers for grid investment, electricity market prices and electricity grid bottle-
necks. The plan identifies the need for optimisation, strengthening or extension of electricity grid infrastruc-
ture for the next ten-years.
Inputs for the TYNDP are the previous version of the TYNDP, the regional and/or national grid development
and investment plans, four scenarios of the development of power generation, supply, consumption, import
and exports and legal national and EU-wide requirements.
Figure 6: ENTSO-E member countries and regions (source: ENTSO-E (2011) Scenario Outlook and System Adequacy Fore-
cast 2011 – 2025)
1
The TYNDP defines so-called target capacities. This correspond to the capacity above which additional capacity development would
not be profitable, i.e. the economic value derived from additional capacity cannot outweigh the corresponding costs.
Transmission Adequacy on the other hand shows how much transmission capacity would be needed in the future electricity system, to
reduce bottlenecks considerably and ensure security of supply.
15The elaboration process of the TYNDP is divided into three steps:
Step 1 – Development of scenarios
The potential development of the energy system is analysed in order to identify what Europe needs in terms
of electricity transmission infrastructure. Some political objectives are set until 2030/2040 on EU and on na-
tional level of the EU Member States, but a lot of uncertainties exist e.g. about generation investments, de-
mand evolution and market developments. The TYNDP scenarios aim to address these uncertainties and
their influence on the future system and are no predictions of the future.
Various stakeholders, like NGOs, scientists, industry associations representing transmission grid users (like
generators, distribution grid operators, suppliers and traders), market participants, consumers (including
industry), power exchanges and national regulators are formally invited to participate in the scenario crea-
tion during consultations.
Step 2 – Planning Studies
The TYNDP usually contains four scenarios analysing the development of the future power system. Some
have ambitious objectives regarding the utilization of RE, some focus on the effects of a more decentralized
power system and some consider the political influences, like a strong European legal framework. Using
common methodologies like market and grid modelling, the experts look at how power could flow in Europe
in 2030/2040, taking into account the different scenarios. This allows them to identify where bottlenecks
could occur and how much transmission capacity is needed at borders to manage these flows.
The results of the planning studies are a series of infrastructure project proposals. These are only one part of
the whole set of TYNDP projects. The other part is constituted of projects that are coming from third party
investors (non-ENTSO-E members) and that meet the criteria for inclusion in the TYNDP set by the European
Commission.
The projects resulting from the planning studies take into account constraints identified in six Regional In-
vestment Plans. The countries belonging to each regional group are shown in Figure 6. In these regional
plans, national electricity grid development plans are considered. The six regional investment plans cover all
of Europe and are focusing at electricity system development issues from a regional perspective. As for the
scenarios, the list of projects and regional investment plans are open to public consultation before being fi-
nalized.
ENTSO-E usually operates three months of consultation period during which industry stakeholders and the
public can hand in opinions and statements about the respective documents. During this time, ENTSO-E usu-
ally organizes stakeholder workshops to offer the opportunity to interact and discuss directly with the crea-
tors of the TYNDP. After the consultation period, ENTSO-E will issue the final version of the TYNDP which con-
tains, upon judgement of ENTSO-E, adjustments and changes according to the feedback of the stakehold-
ers.44
Step 3 – Projects assessments
The last phase of TYNDP creation is the assessment of projects. This is done using a specific pre-determined
methodology to assess the cost and benefits of projects45. This assessment is not a purely economic assess-
ment. It takes into account how projects support the environment, the welfare in Europe, the security of sup-
ply and other criteria with regard to the common welfare. The results of this assessment of projects form the
core part of the TYNDP report.
16The TYNDP report informs about the value of each recommended infrastructure project. The TYNDP is
providing decision-makers with a robust and detailed analysis of transmission infrastructure projects on
which to base their decisions. The Agency for the Cooperation of Energy Regulators in Europe (ACER)46 checks
whether the draft of the TYNDP by ENTSO-E is coherent with the EU’s policy goals, regulatory framework and
national plans of the Member countries. ACER decides whether the TYNDP is appropriate and can be send to
the European commission. The final TYNDP is used by the European Commission to decide which projects
are projects of common interest and are to be handled with special legal priority.
Especially Projects of Common Interests (PCIs) need positive results of the CBA. Projects of common inter-
est are important European infrastructure projects, especially cross-border projects to link energy systems of
EU countries. The aim of identifying PCIs is to support achieving the EU energy policy objectives: affordable
(by boosting competition and markets integration), secure and sustainable (by integrating RE) energy and
decarbonisation of the economy. PCIs benefit from accelerated planning and permit granting, lower adminis-
trative costs due to a more streamlined environmental assessment process, increased public participation
via consultations, and increased visibility to investors. PCIs have the possibility to apply for funding from the
Connecting Europe Facility (CEF).47
ENTSO-E
Elaboration and Finalisation and
Scenario Outlook and
Publication of Consultation Publication of
Adequacy Forecast
draft TYNDP TYNDP
Regional Draft TYNDP TYNPD
Investment Plans Cycle : Every two years Cycle : Every two years
ACER
Assessment of
coherence
TSO
Elaboration of
National Grid Planning
regional Investments
Cycle: Every two years
Plans
Public/Stakeholder
Bring in opinions
Figure 7: Process to elaborate the TYNDP
Cost Benefit Analysis (CBA): validating cost and benefits of each project
All new transmission project proposals in the TYNDP planning process are assessed according to the same
system wide cost-benefit methodology developed according to the ENTSO-E Guideline for Cost Benefit Anal-
ysis of Grid Development Projects 48. The elements analysed in the CBA are 49:
Grid Transfer Capacity (GTC) in MW
Security of supply in EENS (Expected energy not served) or LOLE (Loss of load expectancy)
17 Socio economic welfare (SEW), defined as the sum of producer surplus, consumer surplus and congestion
rents. SEW includes implicitly monetized values for CO2 and renewable energy sources (RES) integration
(e.g. improved value of RES generation by reducing curtailment of wind)
Transmission losses (change in losses for the whole system)
Project cost and changes in other cost incurred by the project (except for losses)
Technical resilience/system safety (ability of the system to withstand extreme system conditions)
Flexibility/robustness (the ability of the proposed reinforcement to be adequate in different possible future
development paths or scenarios)
How this approach fits together with national grid planning approaches and how the national grid planning
approaches work is examined in more detail in the next chapter by way of the example of Germany.
1.2.2 Example of a national grid planning methodology: Germany
Every two years, the four German TSOs create a national grid development plan (Netzentwicklungsplan
(NEP)). The objective of the NEP is to identify appropriate measures for needed optimization, reinforcement
and expansion of the transmission grid in Germany, which will be required over the next ten years to ensure a
secure and reliable grid operation. The procedure is defined by German law (Energiewirtschaftsgesetz) and
concerns in particular the four TSOs and the regulatory authority, the Federal Grid Agency (Bundesnetzagen-
tur (BnetzA)). The procedure for the preparation of the national grid development plan is divided into two
steps: 1. the creation and approval of a scenario framework and 2. the actual development of the grid
development plan. These steps are described in more detail in the following paragraphs.
Step 1: Creation and approval of a scenario framework
The scenario framework has to contain at least three scenarios on the possible range of probable develop-
ments of the German electricity system for the next ten years and correspond to the medium and long-term
energy policy objectives of the Federal Government. One additional scenario has the timeframe of fifteen
years instead of ten years which has the goal to examine the probable further system evolution and possible
consequences for short- and mid-term measures.
The TSOs will send the draft of the scenario framework to BNetzA who publishes the draft and conducts a
public consultation. The public and stakeholders like grid users, distribution system operators (DSOs), NGOs,
associations, academia and public authorities can comment the draft and propose changes. After evaluating
the comments and, if necessary, adjusting the scenario framework, BNetzA approves the scenario framework
as the basis for the further development of the national grid development plan by the TSOs.
Step 2: Development of the National Grid Development Plan
On the basis of the scenario framework approved by the BNetzA, the TSOs are gradually analysing the future
grid expansion requirements. The generation capacity assumptions included in the scenario framework are
regionalized, meaning the capacities are attributed to specific regions, and RE feed-in is simulated for every
hour of the year. A Europe-wide market simulation for all three scenarios will be carried out in order to deter-
mine the optimum power generation per power plant at any time of the year. The market simulation is car-
ried out with a close view on European electricity trading activities and corresponding transnationally traded
and transported volumes of electricity. It takes into account the interconnector capacities available between
the European countries. RE electricity production and electricity production by conventional power plants
18according to the results of the simulations of electricity trading are assigned to each grid node in the Euro-
pean grid for each hour of a simulated year (three years are simulated: five, ten and fifteen years ahead) as a
preparation for the grid analysis. The load flows in the grid infrastructure adopted as the starting point need
to be determined and are based on the timing and regional distribution of the demand. In this way, frequent
transmission bottlenecks can be identified. Further calculations also determine requirements for the system
stability of the power grids and electricity system. To cover the calculated future transmission needs, alterna-
tive approaches (technological, topological) are developed and evaluated in the model in terms of cost and
environmental impact. If a need of optimization or extension is derived, the NOVA–principle is used:
Netzoptimierung/grid optimization (NO): As first step, optimization possibilities of the existing grid have
to be used (e.g. use of electricity temperature monitoring).
Verstärkung/grid enforcement (V): In the second step, existing grids have to be strengthened in case the
possibilities for optimizations are exhausted or insufficient (e.g. adding another line on an existing rack).
Ausbau/grid extension (A): Thirdly, if neither optimization nor strengthening measures are appropriate to
meet future needs, expansion measures of the grid have to be planned.
The national grid development plan is derived as a list of necessary grid expansion projects based on the re-
sults of the process above. The TSOs then publish the draft grid development plan and again execute a public
consultation process. After evaluating the inputs from the consultation process, the TSOs finalize the grid
development plan and send it to BNetzA for approval. BNetzA examines the draft regarding consistency with
the TYNDP, the German offshore grid plan and if needed with distribution grid plans. If required, ACER may
also be involved in the consistency check by BNetzA. Based on the draft grid development plan, BNetzA cre-
ates an environmental impact assessment report that must comply with the requirements of German law2,
publishes the environmental impact assessment report and the draft grid development plan and conducts
another consultation process. After evaluation and consideration of the statements of the public and the af-
fected state authorities, the grid development plan is confirmed by the Federal Grid Agency.
2
§14g of the Environmental Impact Assessment Act
192 Integrated grid planning as base for an efficient
power market in China
In this chapter scenarios and modelling approaches are used to analyse the benefits of grid planning and a
more intermeshed electricity grid layout in China.
A detailed, bottom-up scenario for the development of the Chinese energy system towards 2050 was used:
The stated policies scenario of the Chinese Renewable Energy Outlook 2018. The scenario is represented in
CNREC’s energy system modelling tool, consisting of three interlinked models: EDO, END-USE, and CGE. The
EDO (Electricity and District-heating Optimisation) model is a fundamental model of power and district heat-
ing systems on a provincial level. The END-USE model, based on LEAP (Long-range Energy Alternatives Plan-
ning system), represents bottom-up modelling of end-use demand and how this demand is satisfied. Please
find a detailed description of the scenarios and modelling set up in the CREO 2018, Chapter 250.
2.1 Scenario comparison: demonstrating the advantages of an integrated grid
planning approach
To demonstrate the benefits of system-wide grid planning in China and a more intermeshed electricity grid,
two modelling approaches have been conducted.
The first approach compares the stated policy scenario of CREO 2018 (with an optimally planned and ex-
panded electricity grid) with a scenario without grid planning and grid expansion after 2020. This scenario
is called frozen grid scenario. In the following sections, the stated policy scenario is the reference case
and the figures illustrate the relative difference (mostly: decreased efficiency) of various factors in the fro-
zen grid scenario: total system cost, market efficiency and participation, RE curtailment, emission reduc-
tion and security of supply.
The second approach compares two different electricity grid layouts in China: The current electricity grid
layout with long distance direct current lines based on the stated policy scenario with a much more inter-
meshed electricity grid, which takes the situation in Europe as reference. This scenario is called the highly-
meshed scenario.
In all scenarios, the model forecasts the development of levelized cost of electricity (Figure 8). The figure
shows that due to development of the technologies, photovoltaic and wind are cheaper than coal from 2022
onwards. The model assumes in all approaches that the energy system in China will be increasingly adopting
power market mechanisms until 2050. It also assumes that by 2035, the power market can fully promote effi-
cient utilisation of the system and incentivise the use of RE with low marginal cost. Generation quotas and
inflexible long-term physical contracts are replaced with flexible spot-indexed contracting and/or market
trading hedging products. Spot and balancing markets across the country are interconnected in real-time, or
completely integrated.
20Figure 8: Modelled levelized cost (RMB/kWh) of electricity of various sources in both scenarios
2.1.1 Lower total system cost
The EDO-model was used to compare the stated policy scenario of CREO 2018 with the frozen grid sce-
nario. Already planned transmission lines that will be constructed until 2020 are included in the frozen grid
scenario. However, after 2020 no new transmission lines are constructed per definition51. In the stated policy
scenario, implementation of system-wide grid planning and further expansions of the electricity grid are im-
plemented when the overall system cost are lowered due to new transmission lines. In the stated policy sce-
nario, the EDO-model takes cost (e.g. construction cost) and benefits (e.g. lower curtailment from RE, cost
reduction due to electricity trading and a more flexible electricity system) of new transmission lines into ac-
count. The figures below show the results of the two scenarios. Figure 10 shows the transmission grid
investments in the Chinese provinces of the stated policy scenario. Especially in Western Inner Mongolia and
Shanxi, grid investments have been realised. According to set limits, no grid investments have been
conducted in the frozen grid scenario.
The results of the scenario modelling show that system wide grid planning and grid expansion leads to lower
overall system cost, lower emissions (see Figure 9), better integration of renewables and less curtailment
(see Figure 13). Generation cost and annualized cost of capital of new connection are included in the total
system cost.
138.000.000 122.000.000
CO2 Emissions (kilotons)
137.800.000 121.000.000
system cost (mRMB)
137.600.000 120.000.000
137.400.000
119.000.000
137.200.000
118.000.000
137.000.000
117.000.000
136.800.000
136.600.000 116.000.000
136.400.000 115.000.000
Stated Policies Frozen Grid Stated Policy Frozen Grid
Figure 9: Comparison of total system cost of the scenarios (cumulated from 2016 to 2050) and total emissions (cumulated
from 2016 to 2050)
212.1.2 Higher market efficiency and market participation
A well-expanded and meshed electricity grid is needed to enable an efficient electricity market and trading.
This is why grid investments are conducted in the stated policy scenario in order to allow more electricity
trading between provinces. Figure 10 shows the grid investments in interprovincial transmission capacity in
the stated policy scenario.
3.500.000
Newly invested transmission capacity (MW)
3.000.000
2.500.000
2.000.000
1.500.000
1.000.000
500.000
0
Gansu
Guizhou
Hainan
Hebei
Jiangsu
Tianjin
Zhejiang
Heilongjiang
Jilin
Ningxia
Xinjiang
Xizang
Hubei
Beijing
Sichuan
Yunnan
Fujian
Chongqing
Henan
Qinghai
Shandong
West-InnerMongolia
Anhui
Guangdong
Hunan
Liaoning
Shanxi
East-InnerMongolia
Guangxi
Jiangxi
Shaanxi
Shanghai
A_Stated_policies_9
Anhui Beijing Chongqing East-InnerMongolia Fujian
Gansu Guangdong Guangxi Guizhou Hainan
Hebei Heilongjiang Henan Hubei Hunan
Jiangsu Jiangxi Jilin Liaoning Ningxia
Qinghai Shaanxi Shandong Shanghai Shanxi
Sichuan Tianjin West-InnerMongolia Xinjiang Xizang
Yunnan Zhejiang
Figure 10: Transmission grid investments in inter-provincial interconnections per province in the stated policy scenario
Especially the electricity grid between Shanxi and Inner Mongolia has been expanded in the stated policy
scenario due to the calculated high benefits of trading electricity between these two regions. Inner Mongolia
is exporting a high amount of electricity due to its high energy potential to other provinces in 2050.
Figure 11 shows electricity trading and resulting electricity transport volumes between Chinese provinces in
both scenarios.
Stated policy scenario: It is demonstrated that the stated policy scenario enables electricity trading to a
higher extent compared to the frozen grid scenario. From 2030 to 2050, the interprovincial trade of electricity
increases constantly in the stated policy scenario. Inner Mongolia for example is exporting high amounts of
electricity since it uses its large RE potential to a high extent. Due to the export of electricity, Inner Mongolia
has the opportunity to increase earnings of electricity trading and support economic growth. On the other
22hand, Jiangsu imports high amounts of electricity in 2050. This enables Jiangsu to consume electricity with
lower prices compared to own generation of electricity. Electricity trading leads to lower overall system cost
and lower emissions (see Figure 9 and 2.1.4). Furthermore, electricity trading leads to less needed electricity
generation capacity to ensure security of supply.
Frozen grid scenario: In the frozen grid scenario 3,9% more electricity generation capacity is needed (see
Figure 16).
Stated Policies Frozen Grid
2020 2030 2040 2050 2020 2030 2040 2050
4.000.000
3.000.000
Electricity Flows (GWh)
2.000.000
1.000.000
0
-1.000.000
-2.000.000
-3.000.000
-4.000.000
West-InnerMongolia East-InnerMongolia Yunnan Sichuan Xizang
Hainan Fujian Qinghai Shanxi Hebei
Guangxi Heilongjiang Xinjiang Jilin Shandong
Gesamtergebnis Anhui Ningxia Beijing Shanghai
Jiangxi Tianjin Gansu Liaoning Hubei
Chongqing Guizhou Shaanxi Hunan Henan
Guangdong Zhejiang Jiangsu
Figure 11: Trading deficits and surpluses in the stated policy and frozen grid scenarios (Provinces in the legend are or-
dered according to electricity surpluses or deficits in the stated policy scenario in 2050).
2.1.3 Higher cost efficiency by reducing curtailment of RE power generation
In this section, the results of the two scenarios are compared, to evaluate the overall cost efficiency and RE
curtailment with and without grid extension and system wide grid planning.
Frozen grid scenario: The generation cost of the frozen grid scenario are significantly higher compared to
the stated policy scenario. The additional generation cost outweigh the not conducted grid investments in
the frozen grid scenario, so overall system cost are significantly higher (see Figure 12). This is due to high
curtailments of wind and photovoltaic (see Figure 13) which lead to higher generation by fossil technologies
like coal power plants (see Figure 15), which are becoming more expensive compared to wind and solar (see
Figure 8). For electricity storage, batteries and pumped storage are used to a higher extent. The results of the
analysis show that system-wide electricity grid planning and expansion are important to lower total
generation cost and lower overall system cost (see Figure 12 and Figure 9).
23You can also read