Roadmap for System Integration of Renewables in India's RE rich States - Volume 2. Gujarat Power System Transformation Workshop Report - NET
←
→
Page content transcription
If your browser does not render page correctly, please read the page content below
Roadmap for System Integration of Renewables
            in India’s RE rich States

                       Volume 2.
 Gujarat Power System Transformation Workshop Report
             Report Release Date: February 2021

              Workshop Date: 7th October 2020

              Workshop Venue: virtual webinar
Table of Contents
1.      Workshop background .......................................................................................................................... 2
     1.1 India overview and International Framework for System Integration of Renewables ....................... 3
     1.2 Gujarat state overview........................................................................................................................ 6
2. Outcomes of the Workshop ...................................................................................................................... 8
     2.1 The key RE integration challenges and solutions in Gujarat ............................................................... 8
     2.2 The key takeaways from the Workshop Presentations .................................................................... 10
3.      Results of the IEA and CER power system modelling study ................................................................ 15
     3.1 Modelling background and methodology......................................................................................... 15
     3.2 Changes and challenges in the future Gujarat power system .......................................................... 17
     3.3 Overview of study years.................................................................................................................... 19
     3.4 Technical Solutions: key findings from flexibility scenarios .............................................................. 20
        3.4.1 The demand side is a key source of low cost flexibility for integrating variable renewables in
        Gujarat ................................................................................................................................................ 21
        3.4.2 Power plant flexibility helps to avoid curtailment and reduce operating costs ........................ 22
        3.4.3 Energy storage allows high solar output during the day to be used during peak periods,
        reducing curtailment and avoiding costs from fuel and market purchases ....................................... 22
        3.4.4 A higher share of wind smooths the daily generation profile from variable renewables ......... 23
        3.4.5 Combined flexibility options allow effective integration of renewables in Gujarat .................. 24
4.      Policy, market and regulatory solutions for higher shares of RE ........................................................ 25
     4.1 Demand side policies in Gujarat ...................................................................................................... 25
     4.2 Rooftop solar regulatory innovation for the future system ............................................................. 27
     4.3 Gujarat prices and tariffs in wider India and international context ................................................. 29
     4.3.1 Tariff reforms for the future system .............................................................................................. 30
     4.3 International examples of regulatory and market innovation ......................................................... 31
5.      Solar and Wind Integration Roadmap for Gujarat .............................................................................. 33
Acknowledgements & Preparation of the workshop and report ............................................................... 35
Annex 1. Workshop participants and speakers (speakers underlined) ...................................................... 36
Annex 2. References ................................................................................................................................... 40
Annex 3. Abbreviations, acronyms and units of measure .......................................................................... 42

                                                                                                                                                                 1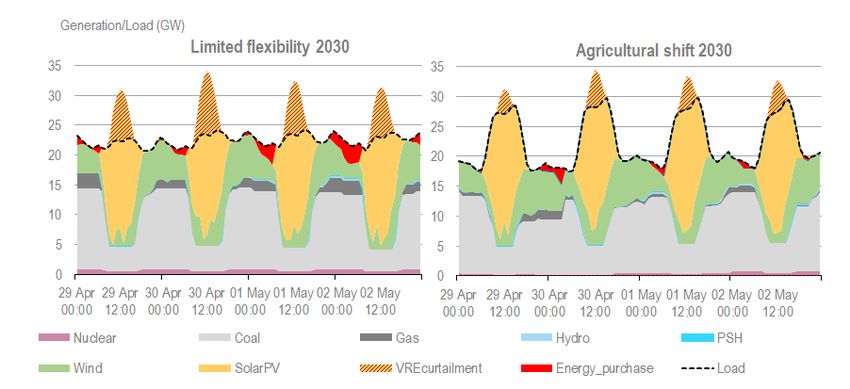
1. Workshop background

Integrating higher shares of variable renewable energy (VRE) technologies, such as wind and solar
PV, in power systems is essential for decarbonizing the power sector while continuing to meet
growing demand for energy. Thanks to sharply falling costs and supportive policies, VRE
deployment has expanded dramatically in recent years. However, the inherent variability of wind
and solar PV power generation raises challenges for a wide range of stakeholders including
system operators and regulators. The International Energy Agency (IEA) is working with
governments globally on how to prioritize different measures to support system flexibility,
identify challenges and implement measures to support the system integration of VRE.

As part of the Clean Energy Transitions Program the IEA has been collaborating with India on
system integration of renewables since 2018. In 2018 the IEA delivered a national workshop in
Delhi with NITI Aayog and the Asian Development Bank, and four regional workshops in Delhi,
Chennai, Pune, and Kolkata. Since 2019 the IEA, with the sponsorship of the British High
Commission and in partnership with NITI Aayog, has been organizing a series of state-level Power
System Transformation Workshops. The objective of the workshops is to help inform the state
governments’ actions for system integration of solar PV and wind. In 2020 two workshops were
held focusing on Maharashtra (February) and Gujarat (October). The third workshop focused on
Karnataka on 19 January 2021.

 State                                Workshop Date        Workshop      Workshop Report Date
                                                            format
 Maharashtra                         18 February 2020      In person          August 2020
 Gujarat                              7 October 2020        virtual          February 2021
 Karnataka                           19 January 2021        virtual      Feb-March 2021 (TBC)
 Tamil Nadu (TBC)                            TBC            virtual                TBC
 Rajasthan (TBC)                             TBC             TBC                   TBC

Table 1: IEA India Renewables Integration work: timeline

Following the completion of all three workshops, an India Power System Transformation report
will be drafted and published on the IEA and NITI Aayog websites in early 2021. Some of the
analysis is also featured in the IEA World Energy Outlook Special report on India, which was
published in February 2021.

                                                                                               2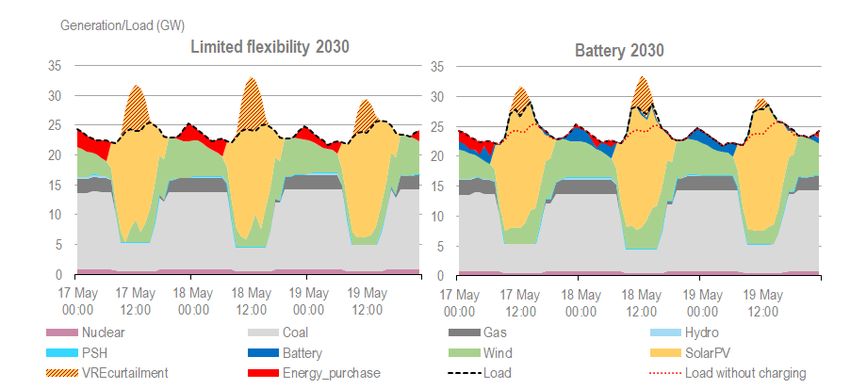
1.1 India overview and International Framework for System Integration of Renewables

The share of solar and wind in India’s ten most renewable-rich states is significantly higher than
the national average of 7.5%, and these states are already redefining how their power systems
are operated. The most significant renewables integration challenges are in Karnataka (where
solar and wind account for around 30% of annual electricity generation), Rajasthan (20%), Tamil
Nadu (19%) and Gujarat (16%) (Figure 2). These states are experiencing system integration
challenges ahead of most countries internationally, and with ambitious targets are set for further
challenges in the future. Therefore, the IEA Clean Energy Transition Program (CETP) focusses on
analysis of the RE integration challenges and opportunities for flexible solutions in these key
states through the State level workshops being organized in the years 2020 and 2021.
Instead of focusing on RE in the broad sense of the word, the following IEA analysis and this
report focusses on wind and solar, referred to as variable renewable energy (VRE) because the
variability in the system is one of the key drivers of renewables integration challenges. The report
also takes into account the impact of other renewables, namely hydro and bio-energy, noting
that these normally impact system integration of renewables positively, as they often are
dispatchable forms of power generation.
The IEA system integration of renewables framework categorizes renewable integration into six
phases, with suggestions on how renewables integration can be successfully managed in each
Phase. Various phase-specific challenges can be identified in the deployment of VRE, and this
framework can be used to prioritize different measures to support system flexibility. These
phases are described in detail (IEA, 2018) and recent examples and insights are highlighted (see
IEA & 21CPP, 2019).

Figure 1: Phases of System Integration of Renewables, Source IEA

                                                                                                  3
As seen in chart below some countries internationally, and few Indian States like Gujarat,
Karnataka and Tamil Nadu are already in phase 3 and fast approaching phase 4; and are already
facing challenges to integrate the high shares of variable renewables. The workshop highlighted
learning for the state of Gujarat from the international experiences of integrating high shares of
VRE, particularly from the UK, Ireland, US States of Texas and California, and South Australia.
These lessons can help Gujarat to leapfrog some of the integration challenges and assist system
transformation process in the state.
Figure 2: Countries and Regions in Phases of Renewables Integration, Source IEA analysis, 2019 data (*indicates
2018 values)
Connecting RE Phases with flexibility resources at different time-scales
The flexibility of a power system refers to the extent to which a power system can modify
electricity production or consumption in response to variability, expected or unforeseen, while
ensuring system security. Flexibility can therefore refer to the capability to change power supply
or demand of the system as a whole or a particular unit. Flexibility can be provided at different
time scales (ramping, startup, demand response etc) highlighted in the table below. According to
the IEA phase assessment framework, different flexibility resource types acting at different time
scales will be more pronounced at different phases of renewables integration.
4Figure 3. Flexibility at different time-scales and Phases, Source: IEA analysis, 2020
In Gujarat, currently in Phase 3, the system operation flexibility need is greatest for the resources
that provide flexibility within minutes to hours, thus helping to overcome very short-term
variability of solar and wind. Greater penetration of solar energy would place greater demand for
flexibility with even faster response time. Later in Phase 4, more focus on ultra-short term
flexibility capabilities will be required in order to provide flexibility within seconds, and additional
focus on flexibility within the days of the week. Then in Phase 5 and 6, more focus can shift
towards flexibility over months to years often referred to as seasonal flexibility.
The type of resources that can typically provide flexibility in identified timeframes across the
Phases of RE integration are included in detail in the table below. These power system flexibility
enablers can be generation, grid, storage assets, demand-side management and sector coupling.
The following chapters of the report address the flexibility enablers that are most relevant for
the state of Gujarat, given their current level of VRE deployment.
5Figure 4. Flexibility solutions offered at different time-scales. Source: IEA, 2018
1.2 Gujarat state overview
Gujarat traditionally has a coal dominated power system, and is now witnessing rapid increase in
the share of renewables. As of November 2020, the total installed electricity generation capacity
of 36 GW includes 16 GW coal, 6.6 GW gas, 0.8 GW of large hydro and, the rest of about 11.8 GW
comprises of renewable energy sources including solar, wind and small hydro.
The increase of renewables is mainly driven by ambitious state-level targets, specified in capacity
terms for 2022 and 2030 (Table 1.). The targeted capacity mix by 2030 would make Gujarat a
solar dominated power system, with the majority of utility scale solar. This is a significant
transformation from the current coal dominated power system.
62020
2021-2022 2029-2030
(as on
Renewables in Gujarat targets targets
30/11/2020)
(MW) (MW)
(MW)
Solar (excluding rooftop) 2772 5661 26660
Rooftop solar 866 2132 6132
Onshore wind 8042 7695 11446
Offshore wind 0 0 1000
Other renewables (excluding large hydro) 144 211 304
Kutch hybrid park for export to other states 0 0 20000
Table 2. Gujarat solar and wind historical data and targets, Source: CEA, MNRE, GUVNL
The increasing annual share of solar and wind energy generation in Gujarat, up from today’s 13%,
will redefine how the state’s power system should be organized, planned and operated in future.
System integration challenges are pronounced when we look at the daily snapshot of power
generation (Figure 4). While solar and wind can meet over 32% of the daily generation today
(maximum recorded was on 15th July 2019 during 2019-20), this number is expected to increase
to 55% by 2022 and to almost 90% by 2030. This means that, by 2030, Gujarat’s power system is
expected to experience challenges that have not been experienced by any Indian state today.
Figure 5. Yearly average and daily maximum solar and wind share in generation in RE rich States of India, Source: IEA
analysis, 2020,
Note: Gujarat target values include Kutch hybrid park capacity for export to other states which is not included in the
power system model
Source of data:
CEA (2019d), actual VRE electricity generation form April 2018-March 2019, MNRE (2019), VRE Installed Capacity
as on 31st March 2019.
Daily max observed VRE: https://eal.iitk.ac.in/
2025 estimate, Maharashtra demand projection: https://mhsec.mahadiscom.in/.
72. Outcomes of the Workshop
2.1 The key RE integration challenges and solutions in Gujarat
The Gujarat workshop was held on 7th October 2020 in partnership with the Gujarat Government,
NITI Aayog and the Centre for Energy Regulation, IIT Kanpur. The Gujarat workshop was a closed-
door virtual event where more than 65 key local stakeholders and more than 10 international
stakeholders shared ideas and identified renewable energy integration related challenges and
opportunities on a single platform. The objective of the workshop was to discuss and deliberate
on the plan for grid integration of high shares of wind and solar in Gujarat, while identifying and
prioritizing deploying flexibility options that could ensure cost effective system planning and
operation. The workshop was organised in three sessions, which included:
1. Opening and high-level context session
2. Gujarat’s Power System in light of high shares of Solar and Wind
3. System flexibility roadmap for an evolving energy mix
Prior to the workshop the IEA has undertaken analysis and consultation with local stakeholders.
Based on these consultations, the agenda was developed that focused on the most important RE
integration questions with relevance to Gujarat State. In line with the identified important topics,
presentations were made by GERC, GUVNL, GETCO, Gujarat SLDC, GSECL (Genco), PGVCL
(DISCOM), NITI Aayog, GERMI, Center for Energy Regulation, ARUP, Ampacimon, World Bank,
India Smart Grid Forum and GIZ. All presentations are available for download at the IEA workshop
webpage (here). The full list of presenters and workshop participants is provided in the Annex 1.
Following each session, the participants responded to interactive polling questions. Based on the
pre-workshop analysis, the workshop presentations and the results of the polling questions, we
have listed below the key institutions, challenges and solutions relevant to the system integration
of renewables in the state.
Firstly, the workshop participants pointed to regulators as the key institutions for transition
towards more renewables, followed by policymakers, the private sector, DISCOMs, the system
operator – SLDC and GETCO.
Secondly it was found that significant challenges exists for reaching the Gujarat 2030 renewables
targets. The most important challenges as seen by Gujarat stakeholders listed in the order of
priority are the forecast of solar and wind, transmission challenges, technical challenges such as
inertia, system strength, frequency and voltage issues, demand forecast, future curtailment of
solar and wind and distributed energy resources. The workshop presentations therefore covered
these topics (Table 3) alongside further in-depth analysis presented in this report.
8Key Gujarat RE integration challenges Covered in workshop by key
identified organisations
From highest priority to lower priority
Forecast of solar and wind Yes, GERC, SLDC presentation
Transmission challenges Yes, GETCO, Ampacimon and IEA presentations
Inertia, system strength Yes, GETCO, SLDC and IEA presentation
Frequency and voltage issues Yes, GETCO, SLDC and IEA presentation
Forecast of demand Yes, GERC, SLDC presentation
Curtailment of solar and wind Yes, GETCO, SLDC and IEA presentation
Distributed energy resources: rooftop solar, EVs... Yes, GIZ presentation
Increasing consumer prices Yes, GERMI presentation
Blackouts, outages Yes, IEA
Table 3. Gujarat solar and wind integration challenges, Source: IEA analysis
Thirdly the workshop and the in-depth IEA analysis (Chapter 3 and 4) concluded that innovative
technical and policy, market and regulatory solutions are available both locally and
internationally to enable system friendly ramp-up of renewables in Gujarat. The most important
solutions in the order of priority are demand response (more specifically agricultural demand
response), regulatory reforms, flexible coal power plants, tariff reforms and energy storage. The
workshop presentations therefore covered these topics ((Table 3)) alongside further in-depth
analysis covered in Chapter 3 and Chapter 4 of this report.
Key Gujarat RE integration solutions Covered in workshop by key organisations
identified
From highest priority to lower priority
Demand Response Yes, PGVCL and IEA presentations
Regulatory reforms Yes, GERC, GETCO and IEA presentations
Flexible coal plants Yes, GSECL and IEA presentation
Tariff reforms Yes, GERC and ISGF presentations
Energy storage incl. batteries Yes, SLDC, IEA and World Bank presentations
New ancillary services Yes, SLDC presentations
Flexible solar and wind Yes, IEA presentation
Flexible gas plants Yes, IEA presentation
9Transmission investment Yes, GETCO and Ampacimon presentations
New technologies: hydrogen, EVs... Yes, IEA presentation, sector coupling
Hydro plants Yes, GSECL and IEA presentations
Table 4. Gujarat solar and wind integration solutions, Source: IEA analysis
2.2 The key takeaways from the Workshop Presentations
Following is a short summary of the key takeaways from the workshop presentations covering
the key topics.
Increasing share of solar and wind in Gujarat driven by RE policies and targets
Gujarat contributes 12% to the national level renewables basket and is one of the front runners
of the “climate efficient initiative”. The state regulator GERC expects Gujarat to meet its targets
of RE capacity of 17% by 2021. In the longer-term Gujarat state targets 65 GW for solar and wind
combined by 2030, which includes 20 GW of capacity in a hybrid solar and wind park designed
for exports to other states. Gujarat is one of the few states in India with financially stable
DISCOMs with timely payments and excellent land availability driven by stable long term policy
directions: (1) Land Allocation Policy for Wind, Solar and Hybrid Parks 2019, (2) Policy for
Development of Small Scale Distributed Solar Projects 2019, and (3) Policy for allocating land, for
development of Solar Projects in the vicinity of existing GETCO substations.(For more details refer
to GUVNL presentation on the workshop webpage).
Forecasting of solar and wind
Forecasting of solar and wind was seen one of the most significant challenges by workshop
participants. SLDC anticipates that 5000MW demand variation and 3500MW wind variation in a
day will be common by 2030. To meet this variation and minimize start/stop of thermal plants,
4000MW of reserves can be required.
SLDC noted that additional flexibility will have to come from both the physical system and the
institutional framework, such as market dispatch decisions closer to real time and better use of
forecasting. The ongoing development of the Renewable Energy Management Center (Figure 6)
10will enable real time review and more accurate forecasting of solar and wind.
Figure 6. Renewable Energy Management Centre: Advance Forecasting Mechanism Support to System Operation
being developed in Gujarat
Curtailment of solar and wind
Today the solar and wind curtailment in Gujarat is zero. However, in the future GETCO expects
increasing system balancing costs associated with keeping the curtailment low, thus zero
curtailment may not be the economically optimal choice in the longer run. In fact in other high
shares of VRE systems some form of curtailment is deemed acceptable.
Arup presented RE integration challenges from the perspective of RE investors in India and
Gujarat. It highlighted that increasing uncertainty of future energy losses (due to curtailment,
outages, and electrical factors) is factored into the developer’s Energy Yield Assessment, and is
an important consideration for financing rates that also impact PPA offers. Arup highlighted that
stable long term policy environment on curtailment and today’s “must-run status” and
improvement of solar and wind site data would have positive impact on future project design
and thus investor confidence.
Transmission challenges and solutions
The GETCO (transmission utility in Gujarat, responsible for planning and operations) highlighted
that currently Gujarat only faces some localized system integration challenges on the power
system. The GETCO transmission expansion plan is designed to facilitate the planned RE
deployment.
Ampacimon presented an innovative smart technology named Dynamic Line Rating (DLR) system
for OHL; directly measuring critical parameters in RT at the conductor like, Sag, Wind speed &
Line load. Computational engine delivers, available Line capacity (reserves) in RT; forecasts in
Short term (30Mts.-4Hrs), Day ahead & D2 Forecasts. Capable of integrating with EMS/SCADA;
hence Load – Generation balancing can be on actual capacity. Capacity gains around 30-50%
experienced by TSOs in Europe, maximizing the use of transmission infrastructure. Similar
11benefits are envisaged for India / Gujarat; based on Ampacimon’s study of conditions prevalent
in India.
DLR can deliver quick relief from congestion woes without any compromise to safety, enabling
optimized usage of existing infrastructure, managing grid with confidence during contingencies
(with RT visibility), support faster deployment of DERs/wind-solar hybrid projects. DLR can also
offer good impetus to offshore wind projects in Gujarat due to its relevance in grid planning,
optimization of evacuation infrastructure, integrating wind farm output and bringing in economic
benefits for deferring the investments costs of additional line infrastructure.
Inertia, system strength, frequency and voltage challenges and solutions
As Gujarat will move from synchronous generation to inverter based generation a number of
system operation tools will diminish including the currently available frequency response
capabilities, inertia, voltage regulation tools, reactive power support highlighted below (Figure
5).
Figure 7. System Operation challenges as defined by GETCO on system strength parameters due to accelerated RE
generation
IEA highlighted that international experience shows that other systems with declining inertia
manage the transition towards higher shares of solar and wind with technical solutions such as
the deployment of synchronous compensators and synthetic inertia provided by grid-forming
converters (further details in IEA workshop on Technical secure integration of large shares of
converter-based power sources, March 2020).
GETCO also highlighted that adoption of new technologies and rapid installation of new power
system management tools will be required including grid ancillary services and grid supporting
12smart technologies, the full use of digitization opportunities for example STATCOM, WAMS and
data analytics. Furthermore, they highlighted the ongoing improvement of Grid Code standards.
Distributed Solar challenges and solutions
The existing Gujarat policies incentivise significant distributed solar deployment. GIZ estimates
that in Gujarat about 75% of the solar rooftop capacity could be integrated without additional
infrastructure cost. GIZ highlighted that the German rooftop experience with its over 1.8 million
rooftop PV systems shows that distributed PV can support the low voltage network and support
the grid with voltage stability and reactive power. In Germany solar PV generated 8.2% of gross
electricity consumption in 2019, share of all RE sources was 43% in total generation. GIZ research
shows that PV inverters available in the Indian market are capable of providing the reactive
power support, and therefore the CEA connectivity regulation changes can unlock this potential
going forward.
Flexibility from demand response
GETCO and SLDC both highlighted that demand side management, including agricultural demand
shifting is already an important grid balancing tool and this is expected to be even more
prominent in the future.
PGVCL highlighted the importance of agricultural demand in Gujarat, which in the PGVCL region
represents 36% of total connected load and 30% of total consumption. PGVCL oversees over
50,000 new agriculture connections every year adding nearly 300 MW load in the system by use
of conventional pump sets. There is also a potential for industrial demand response but it is
significantly smaller.
Flexibility from conventional generation
GSECL (the state-owned generation company) presented its coal power plant flexibility objectives
of shorter start up times, higher ramp rates (1% and 3%) and introduced pilots testing 55%
operating minimums for older and 40% operating minimum for newer plants, which show
significant improvement potential from the current rates of around 75% and 50-65%,
respectively. The presentation also highlighted the importance of compensation for the
investment needed to achieve these technical improvements and losses due to decreased
efficiency and increased O&M costs.
Flexibility from Energy Storage
Gujarat currently has hydro plants that are planned to be converted into pumped hydro
resources in the coming years. The workshop participants highlighted that in Gujarat there is no
13regulatory and tariff framework for storage at the moment, and thus there is a need for
development of this framework.
Some study results were presented that cover the topic of energy storage with the aim to
estimating the optimal amount of storage for Gujarat in the future. ISGF highlighted that its India
storage roadmap’s most ambitious scenario included 2.1 GW of batteries in Gujarat by 2032.
World Bank also presented its ongoing Gujarat battery storage assessment project’s preliminary
results. The World Bank battery capacity estimate was based on the costs and benefits from
Ramping support, Energy Arbitrage, and also includes the benefits from capacity deferral and loss
reduction, the optimization was completed from both DISCOM perspective and
consumer/regulatory perspective.
Ongoing Regulatory and Tariff reforms and Digitalization
RE policy implementation is highly supported by the state regulator GERC and as such it
introduced new regulations designed to help system integration of RE, including:
tariff system to compensate for financial impact of ramp up and down of conventional
plants,
load and forecasting regulations with no penalty for generators,
investment in the transmission sector to promote RE in the remote and coastal areas,
time of use tariff pilots.
The India Smart Grid Forum's (ISGF) ongoing Time of Use tariff study in Gujarat highlighted the
minimum technical requirements: Advanced Metering Infrastructure, Energy Management
Software and smart switches and devices. Furthermore, it emphasized the need for regulatory
changes, the need for informing consumers and the request of consumers to fully understand
the benefits for the tariff including exact impact on bills.
The GERMI annual financial model (presented at the workshop) of regulated electricity tariff in
Gujarat shows that in the aggressive RE deployment scenario of 10 GW solar and 10 GW wind by
2023 the revenue gap would increase (to over 6% from 5%) with significant decrease of thermal
generation (8 GW lower) and a very small 0.02 INR/kWh increase of tariffs.
143. Results of the IEA and CER power system modelling study
3.1 Modelling background and methodology
IEA and CER, IIT Kanpur started to develop the Gujarat power system model in coordination with
Gujarat SLDC in July 2019. Following the data collection and model building phase, the
preliminary results were presented during the Gujarat workshop in October 2020. Based on the
workshop and the subsequent consultation calls as well as the numerous inputs, feedback and
suggestions from local stakeholders – including GUVNL, GETCO, SLDC, GERMI, LBNL and IEX –the
analysis has been finalized and detailed in the following sections.
To evaluate, in more detail, the impact of increasing renewables on the Gujarat power system, a
detailed modelling study was undertaken. The study focuses on two time frames: a short-term
perspective up to 2021-22 (2022) and a medium-term perspective up to 2029-30 (2030). The
financial year 2018-19 (2019) is used as a validation year for the developed modelling framework.
The purpose of the model is to evaluate the contribution of diverse flexibility options to address
renewables integration challenges for Gujarat over the short- and medium-term. The approach
taken uses production cost dispatch modelling for the three target years, with the capacity mix
based on Gujarat government targets.
Variable renewables share in Variable renewables share in
Horizon
capacity generation
Validation (FY2018-19) 29% 12%
Short term (FY2021-22) 42% 20%
Medium term (FY2029-30) 71% 37%
Table 5. Variable renewables generation and capacity share by modelling year.
The modelling effort was undertaken in collaboration with the CER, IIT Kanpur, with separate
models being developed in parallel by IEA and CER. The IEA model is developed in PLEXOS
modelling software, while the CER model is developed in GAMS, allowing for cross-validation
between the modelling approaches and different benefits from the two platforms to be accessed.
CER also assisted with data collection and provided the load forecast. The results presented here
are derived from the IEA PLEXOS model but have been developed in full collaboration with CER.
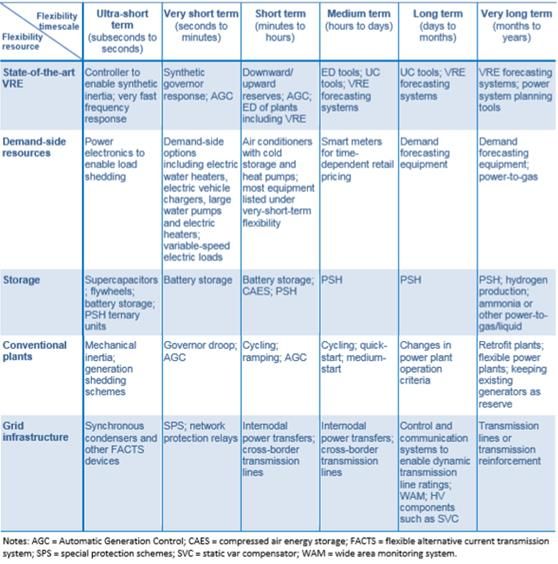
The model includes separate nodes for each DISCOM area in Gujarat (Figure 7), as well as a
separate node for the Kutch region, which is a part of the PGVCL distribution license area, as this
is a particularly renewables rich region that will host much of the renewables capacity in the state
in the coming years. The model takes a ‘contracted capacity’ approach, so that all capacity
contracted by Gujarat is represented in the model both from inter-state and intra-state plants,
and capacity located in Gujarat but contracted by other buyers is excluded from the analysis. The
external nodes connect only plants that are contracted by Gujarat. Short-term market purchases
are also allowed at the external nodes but within the overall limits of transmission capacity.
15Figure 8. Gujarat Model structure
Model assumptions and inputs
The dispatch is performed at hourly resolution, with existing capacity, capacity additions
to 2022 and, plant-wise variable costs based on recent GERC tariff orders.
Renewables deployment is based on Gujarat government targets. Plant retirements are
included based on CEA plans, and plant-level operational parameters such as ramping
limits and start-up time are derived from generic CEA data.
Gas availability is based on historical availability for 2019 and 2022 and expected
allotments for 2030.
The hourly demand profile for all years is based on state-level demand for 2019, with
disaggregation between DISCOM based on the annual DISCOM-wise demand from 2019.
The impact of Covid-19 has been considered for demand forecasting.
Future annual demand for the state up until 2030 is based on projections by the Centre
for Energy Regulation (CER) and Energy Analytics Lab (EAL) at IIT Kanpur, taking into
account the available projections from the state.
All inter-state and intra-state transmission lines at a voltage of 400 kV or higher are
mapped and included in the model.
16 Renewables generation profiles are based on the ERA5 reanalysis dataset (CS3, 2017) and
processed using NREL’s System Advisor Model.
o Maximum coincident generation relative to installed capacity at the DISCOM level
is 76-78% for utility solar, 67-69% for rooftop solar, and 83-90% for wind.
o At the whole Gujarat level in 2030, the overall capacity factors are 17% for solar
and 24% for wind.
3.2 Changes and challenges in the future Gujarat power system
In the coming decade, the Gujarat power system will undergo a profound transformation. While
the highest contribution of solar and wind to meeting hourly demand in 2019 was 39% (at 1 PM
on 14 July), this is expected to rise as high as 80% in 2022, and could reach up to 160% of the
demand during some hours by 2030.
Figure 9. Hourly share of solar and wind generation as % of demand, IEA analysis
Today, the Gujarat system has zero curtailment of variable renewables generation, and this is
expected to remain negligible in 2022. By 2030, in a case where there is no increase in flexibility
and renewable energy is only to be integrated inside Gujarat, this would result in overall
curtailment of around 7%. This highlights the need for an increase in power system flexibility with
rising renewables share, to ensure cost-effective integration of variable renewable energy.
17Figure 10. Curtailment of solar and wind in different years, IEA analysis
In addition, this large increase in variable renewables will result in deep impacts on the operation
of conventional generators, particularly coal-fired generators. From the validation year, the
average capacity factor (or plant load factor) for coal-fired generators drops fairly sharply from
79% in 2019 to 65% in 2022. This is, in large part, due to an increase in coal capacity from plants
which are currently under construction or planned, as well as the must-run status of renewable
energy which displaces conventional generation. The capacity factors of coal-fired generators are
expected to bounce back slightly to 72% in 2030 due to a combination of load growth and no
addition to conventional capacity, which slightly outweighs the impact of higher renewables
contribution. At the same time, this relatively small change in capacity factors masks a dramatic
shift in the operating regime for coal, as in 2030 the coal fleet is expected to spend more time at
very low (e.g. below 50% of maximum fleet output) and very high output levels (e.g. above 90%
of maximum output), resulting in increased operational stress (see Figure 10).
18Figure 11. Capacity factors and coal generation curves in different years, IEA analysis
3.3 Overview of study years
Validation year (2019)
The validation results match closely to the historical Gujarat system with regards to the overall
generation mix and seasonal availability of solar and wind. In today’s system, power plants in
Gujarat already need to operate more flexibly with increased ramping and partial loading to
accommodate variable renewable generation. Some congestion is seen in the model on high
voltage lines from Kutch, but without resulting in curtailment. It is important to note that local
challenges during high VRE periods, such as evacuation of wind and solar from lower voltage
levels or local system strength, are not captured in the modelling approach, which excludes low-
level network.
Short-term horizon (2022)
To 2022, the existing flexibility in the Gujarat system is expected to cope well with the increasing
share of wind and solar PV. With hourly shares as high as 80% of demand, relative to 50% in the
base year, existing flexibility from dispatchable power plants is activated more, with a 43%
increase in ramping from dispatchable technologies from 2019 to 2022. Line congestion from the
Kutch region is similar to that seen in 2019 and curtailment remains close to zero.
Medium-term horizon (2030)
In the medium term, the continuing deployment of variable renewables will bring increased
challenges at the state level. By 2030, VRE generation is expected to exceed electricity demand
in Gujarat during many hours of the year, and system operation will be determined by the
generation pattern of variable renewables.
193.4 Technical Solutions: key findings from flexibility scenarios
Based on the feedback from Gujarat local stakeholders as well as international experience, the
IEA has developed a set of scenarios to illustrate the impact of different individual flexibility
resources on the Gujarat power system in 2030. The key resources considered, in line with the
workshop outcomes, are: demand response (agricultural demand), coal and gas power plant
flexibility, and different storage resources (i.e. pumped hydro and batteries). In addition, a
scenario was considered where some solar capacity is replaced by wind, to give a more even
balance between wind and solar.
In the limited flexibility scenario, no new flexibility measures relative to 2019 are introduced,
exports are not considered, and agricultural demand scheduling follows the existing night-time
pattern. In this case, Gujarat would experience operational challenges including variable
renewables curtailment of around 7%. In practice, there are multiple flexibility options that can
help to integrate VRE generation locally in Gujarat, and of course it will also be possible to export
renewables during certain hours.
The plant flexibility and higher wind share scenarios result in a slightly lower curtailment level
close to 6% and in the agricultural demand shift scenario the curtailment level reduces to below
3%. In addition, three scenarios with either 1, 2 or 4 GW of battery storage (each with storage
duration of 4 hours) were considered. In these scenarios, curtailment declines to as low as 2% for
the case with 4 GW of storage. And finally, when looking at a combined application of the most
promising flexibility resources, curtailment can be shown to be almost completely avoided (see
Section 3.4.5). In the following sub-sections we describe each of these scenarios individually.
Figure 12. Curtailment of solar and wind in different scenarios, Source: IEA analysis
203.4.1 The demand side is a key source of low cost flexibility for integrating variable renewables in
Gujarat
Gujarat’s power demand is dominated by industrial use (around 60%) while agricultural demand
represents around 20%, and residential and commercial demand the remaining 20%. All demand
types can be a useful source of system flexibility, but in Gujarat the most promising demand side
flexibility providers are agricultural users, followed by industrial demand response potential.
Agricultural demand is already an important source of power system flexibility in Gujarat today,
with agricultural pumping loads scheduled in 8-hour windows and concentrated overnight. This
has the combined benefit of ensuring that agricultural pumping coincides minimally with peak
demand, while also supplementing lower overnight demand, allowing conventional plants such
as coal-fired generation to maintain a more stable operation.
By 2030, the overnight scheduling of agricultural demand will no longer be optimal due to the
higher PV generation in Gujarat, however agricultural demand will be able to be shifted to the
daytime to align with high solar output hours (existing schemes to facilitate this in Gujarat are
discussed below). In the agricultural shift scenario, this reduces curtailment to less than 3%
(relative to 7% for limited flexibility), while also reducing unit starts by 39% for the coal and gas
fleet. In addition, this results in around a one-third reduction in market purchases from other
states, for an overall variable cost reduction of nearly 11% (with market purchases priced at $75
USD/MWh). Note that the total system cost, including renewables tariff cost, is not included in
the reported operating cost as the modelling takes an overall social welfare perspective1, and
from this point of view these costs are sunk investment costs.
Figure 13. Impact of agricultural demand shift, Source: IEA analysis and analysis by Khanna, 2020
1
The social welfare perspective focuses on total cost to society rather than financial flows between entities.
213.4.2 Power plant flexibility helps to avoid curtailment and reduce operating costs
Power plant flexibility is another important consideration, and includes faster ramp rates and
lower minimum stable levels. Plant-level ramp rates are predominantly relevant on sub-hourly
scales, so faster ramp capabilities are not a focus for the hourly model presented here. On the
other hand, minimum stable levels are important for allowing power plants to keep operating
while accommodating high variable renewables output in certain hours, particularly for solar in
the middle of the day, and can be captured in the hourly modelling. For the base flexibility case,
the minimum stable level assumed for central coal plants was 55%, in line with the current
requirement in India. New plants were also assumed at 55%, and for state level plants, 75% was
assumed, with 40% for gas CCGT. In the flexible case, central and new plants were reduced to
40% and state level plants to 55%. The impact of the power plant flexibility case in 2030 is a
relatively modest reduction in curtailment (from 7.0 to 6.4%) and reduction in variable operating
costs of 1.2%.
3.4.3 Energy storage allows high solar output during the day to be used during peak periods,
reducing curtailment and avoiding costs from fuel and market purchases
Energy storage, such as batteries and pumped storage hydropower can provide significant
flexibility for integrating renewables, and is particularly relevant in India for allowing high solar
output during the day to be stored for later use to meeting evening demand.
In order to evaluate the impact of pumped storage hydro (PSH) on system with otherwise limited
flexibility resources, a scenario is considered where PSH is included in the limited flexibility case,
from both the Kadana hydro power station (242 MW) and the SSP power station, which has
developments currently ongoing to establish pumped mode (16% of 1200 MW allocated to
Gujarat, and 192 MW capacity modelled). In this case, curtailment is reduced by 0.5%, market
purchases by 4% and variable operating costs by 1%.
Including a 4 GW, 4-hour duration battery into the limited flexibility case has a larger impact due
to both the large battery size and higher efficiency of the battery relative to the pumped storage
plants (81% round trip efficiency for batteries relative to 60% efficiency for Kadana and 75% for
SSP). In the 4 GW battery scenario curtailment is reduced to 2%, market purchases are around
one quarter less and variable operating costs are reduced by around 7% including the cost of
market purchase.
22Figure 14. Impact of batteries, Source: IEA analysis
Further scenarios were also tested with smaller batteries of 1 and 2 GW capacity (4-hour
duration), which when included in the limited flexibility case reduce curtailment to 5.4% and 4.1%
respectively, and reduce variable operating costs including market purchase by 1.9% and 3.7%
respectively.
3.4.4 A higher share of wind smooths the daily generation profile from variable renewables
Due to the falling costs of solar generation and relatively good solar resource in India, solar
growth is expected to dominate renewables deployment in the coming years. At the same time,
as solar generation increases, it does present specific integration challenges due to the
concentration of generation in the middle of the day. For the base case, the proportion of wind
and solar in the Kutch hybrid park2 was set to reflect the balance in the rest of the state, with 7.2
GW of solar capacity and 2.8 GW of wind capacity . In order to explore the potential benefit of a
more balanced mix between wind and solar generation, a higher wind scenario was tested with
5 GW each of solar and wind capacity in the Kutch hybrid park.
This results in a smoothing of average output across the day, with an increased contribution to
the evening hours and a reduction in the sharp output peak seen in the middle of the day in the
base case. On the other hand, the seasonal pattern of variable renewables availability is not
improved by the increased wind generation. In the base case a peak in supply is seen during May-
June-July followed by a fall-off during October-November when load is at its peak, which is not
mitigated in the high wind case. Nonetheless, the increased output of wind and smoother daily
distribution results in reducing curtailment to 5.9%, and a 5% reduction in variable operating
costs including market purchase.
2
The mix of solar and wind to be developed in the Kutch hybrid park has not yet been fixed in government plans.
23Figure 15. Impact of more wind deployment, Source: IEA analysis
3.4.5 Combined flexibility options allow effective integration of renewables in Gujarat
In the above scenarios, each flexibility option has been considered in isolation in order to allow
their relative impacts to be evaluated separately. In addition, several scenarios have been tested
with multiple flexibility options so that their combined contributions can be tested. Agricultural
flexibility is included in all these cases, as it was shown to be one of the most effective flexibility
measures from both a technical and cost perspective. Scenarios including a combination of
agricultural demand response with plant flexibility, higher wind share, and battery deployment,
illustrate that there are multiple pathways to reduce curtailment to 1% or below and provide
further reductions in operating costs.
Figure 16. Curtailment of different combined flexibility scenarios, Source: IEA analysis
244. Policy, market and regulatory solutions for higher shares of RE
There is an agreement across all stakeholders about the importance of the policy, market and
regulatory framework to unlock the technical flexible resources detailed in chapter 2 and
chapter 3. This chapter highlights key elements of the existing Gujarat policy framework and
brings relevant international examples.
Policy,
Policy,market
market and
and regulatory
regulatory Hardware
Hardware and
and infrastructure
infrastructure
Institutions
Institutions and actors (“Who”)
(“Who”)
frameworks (“How”)
frameworks (“How”) (“What”)
(“What”)
Typical decision makers Categories of interventions Asset types
Energy strategies
Power plants Electricity networks
Energy
Energy ministry
ministry Legal frameworks
Policies and programmes
Regulatory frameworks and decisions
Regulatory
Regulatory agency
agency Power sector planning exercises
Energy storage Distributed energy
Retail electricity pricing resources
Power market rules and codes
System
Systemoperator,
operator, electric
electric System operation protocols
utility, standards body
utility, standards body
Connection codes
Figure 17. Power system flexibility embedded in the policy framework, Source: IEA analysis
4.1 Demand side policies in Gujarat
The current policy and regulatory environment in Gujarat is already highly supportive of RE
integration. While Chapter 2 highlights the most important regulatory innovations implemented
by GERC, this chapter focuses on some of the most important demand-side policies to unlock the
deployment of flexible resources in the State of Gujarat. The Jyoti Gram Yojana is an initiative of
the Government of Gujarat started in the year 2003 to ensure 24-hour availability of quality
three-phase power supply to rural areas of the state. This policy enabled rural agricultural
consumers to shift to electricity-based pumping systems, reducing their expensive dependence
on diesel-based pumps. Additionally, the policy enables monitoring, pricing and rationing of
power consumption separately for the agricultural, residential and industrial sectors, making
agricultural demand shifting one of the most important power system balancing tools today.
Gujarat was one of the first states in the country to implement energy efficient pumps in the
agricultural sector. More than 100,000 agricultural electricity connections were involved in the
policy every year since 2016. Agricultural electrification was further supported through the
installation of smart/pre-paid meters in the Integrated Power Development Scheme (IPDS).
25The State policy Ujjwal DISCOM Assurance Yojana (UDAY) with the Government of India was
instrumental in reducing the electricity rates for agricultural consumers and strengthening fuel
security through coal swapping, and reduction in aggregated technical and commercial losses
from the DISCOM side.
The Kisan Suryoday Yojana was launched in October 2020 in Gujarat with the aim of providing 16
hours of power supply to farmers in the state every day. This scheme intends to provide day-time
8-hour long power supply for irrigation between 5:00 AM and 9:00 PM in two shifts. Today 8-
hour power is provided on a rotational basis in day and night hours. The key objectives are to
reduce the night-time power scheduling of agricultural load, to improve life style of farmers and
to reach maximum utilisation of solar power.
Distributed solar initiatives include both agricultural solar pump and rooftop solar policies in
Gujarat. One of the most significant policies, the national KUSUM (Kisan Urja Suraksha evam
Utthaan Mahabhiyan) policy is an important driver of solar of pump deployment and also enables
farmers to sell solar generated electricity to the grid.
The national KUSUM scheme has three components, the Component A involves setting up 10 GW
of decentralized ground-mounted, grid-connected solar projects of up to 2 MW. The Component
B plans to install 1.75 million standalone solar-powered agricultural pumps of individual capacity
up to 7.5 HP. And the Component C, Solarize, plans to install 1 million grid-connected agriculture
pumps of individual capacity up to 7.5 HP. Gujarat state allocated INR 795.8 million (~$11.09
million) for grid-connected solar microgrids for agricultural pump sets.
A critical renewable policy in the agriculture sector is the solar pump set scheme that gives
beneficiaries subsidized solar water pumps sets of 3, 5 and 7.5 HP (horse power). The state
government has approved the budget for installation of 4,000 solar pumps. In 2018 the scheme
was piloted in 33 districts to enable 12,400 farmers to generate solar power and to use that part
of that power for irrigation. The rest of the generated power can be sold as a surplus to the grid
for INR 7 (US$0.10) per unit for seven years and INR 3.50 (US$0.05) per unit for the remaining
years. Under the initiative, farmers contribute 40% of installation costs, while central and state
government will subsidize 60% of costs.
The above schemes have multiple benefits in that they enable farmers to irrigate their fields
during the daytime, provide and additional source of revenue to the farmers and provide farmers
incentives for reducing groundwater consumption (Shah et al., 2014, DSUUSM, 2018). The impact
of solarization of agricultural pumps on the electricity system is uncertain and would depend on
the design of the scheme. For example, if farmers feed electricity into the grid during peak load
hours it could cause a mismatch in demand and supply.
264.2 Rooftop solar regulatory innovation for the future system
This section focusses on international insights on rooftop solar, related integration challenges
and related policies and regulations.
Today, rooftop PV capacity in Gujarat sits under 1 GW, but by 2030 this is planned to increase to
over 6 GW. With this increase, the impact of solar PV at the distribution level will become much
more significant, with implications both for demand forecasting and local grid management.
According to the SLDC there is currently a lack of real time visibility and controllability of
distributed solar resources for both distribution and transmission companies. At present rooftop
solar generation is not monitored in real time, but the distribution company takes into account
rooftop generation as part of demand forecast submitted to SLDC, similarly to captive generation.
In the future the impact of lack of visibility can lead to significant uncertainties of net demand
forecasts illustrated in Figure 17.
Figure 18. Illustration of impact of rooftop solar on Gujarat’s daily demand in 2030 at different times of year,
Source: IEA analysis
IEA analysis envisions significant growth of rooftop solar capacity in Belgium, Germany and
Australia, reaching over 20% of total capacity by 2024 (Figure 18). International experience of
Germany, UK, Australia and US Hawaii suggests that visibility of rooftop PV can be ensured
through connection requirements embedded in DISCOM and/or transmission connection codes.
27Figure 19. Rooftop solar capacities (residential and commercial) for developed countries from 2000 to 2017 and
projected capacities for 2024, Source: IEA analysis
The Australia example highlights how the country manages rooftop solar visibility and forecasting
related challenges and local network issues. More specifically in Australia, with 2.5 million
rooftop solar systems with a combined capacity of over 18.5 GW by the end of 2020, the visibility
of existing installations including their size and their location is managed through use of the DER
registry portal managed by AEMO. This register doesn’t provide real time information. For real
time data on rooftop solar generation smart metering would be a prerequisite. However smart
meter data collected in every household doesn’t directly translate into real time data for
DISCOMs. Even in Queensland, where every household has a smart meter and 40% of all houses
have rooftop solar, real time data is not available to the distribution company. The smart meters
submit data on a 24-hour timeframe basis. This data provides sufficient insight for the
distribution companies for the forecast of rooftop solar, as rooftop solar output has proved to be
fairly predictable depending on known weather patterns.
The other key rooftop solar challenge observed in Australia includes local network congestion,
high local voltage levels (over 245V) and reverse flows to the distribution systems during the day
when demand is low. They experience more reverse flows, particularly as the cost of rooftop PV
has decreased and households are installing larger 6-7 kW systems. One of the solutions being
piloted is the so-called dynamic operating envelope. This software-based solution limits the
export to the distribution system to maximum 10kW per house during system stress. National
rollout and development of detailed rules and regulations are currently ongoing.
In Australia rooftop solar currently receives a fixed (non-dynamic) feed-in tariff. But in the
future moving to 5-minute settlement on wholesale markets will also provide future
opportunities.
28Based on the Australia example the State of Gujarat can consider 2 actions to improve visibility
of rooftop solar in the state, as the first step. GERC could appoint an entity to develop distributed
solar registry platform for all DISCOMs for solar pump and rooftop solar connections, included in
connection requirements. The registry data would ideally be publicly available in an anonymous
format and data should also be made available for SLDC by DISCOMs. In parallel, DISCOMs can
require distributed solar registration from its consumers for future installations in the above-
mentioned platform. DISCOMs to develop a roadmap for distributed solar forecasting and assess
technical requirements and potential policies to support this.
4.3 Gujarat prices and tariffs in wider India and international context
The current electricity pricing and tariff design in Gujarat - and more widely in India - is
significantly influenced by the government’s 100% electrification objective, which provided
access to electricity to most of the communities in India by 2019. Additionally affordability of
electricity is another key objective behind tariff design.
As a result, current household electricity prices in India are lower than the OECD average in
nominal terms. However, when adjusting for purchasing power, which better accounts for
spending on electricity as a share of Indian household income, household prices are amongst the
highest in the world. This is despite the fact that India – like other emerging and developing
economies – has higher end-user prices for more energy-intensive industrial consumers in order
to cross-subsidise the lower tariffs paid by low-income residential and agricultural users.
Industrial electricity prices in India at 99 USD/MWh are significantly higher than residential prices
at 69 USD/MWh (on a nominal basis). The high industrial prices drive large volumes of industrial
users in India to open access contracts with prices that are on average 20% to 30% lower than
utility prices. Prices also vary, not just among end users, but also across states, where consumers
in some states pay five times more for their electricity than their counterparts in neighboring
states.
Gujarat has one of the highest residential prices across India's States, while industrial and
commercial prices in Gujarat are well below the prices in the average Indian state. Prices for
agricultural users are also low compared to other states.
29You can also read