Decision regulatory impact statement - Queensland's statutory voltage limits 27 September 2017 - The Queensland ...
←
→
Page content transcription
If your browser does not render page correctly, please read the page content below
Decision regulatory impact statement
Queensland’s statutory voltage limits

27 September 2017
This publication has been compiled by Energy Industry Policy, Department of Energy and Water Supply

© State of Queensland, 2017

The Queensland Government supports and encourages the dissemination and exchange of its information. The copyright in
this publication is licensed under a Creative Commons Attribution 4.0 International (CC BY 4.0) licence.

Under this licence you are free, without having to seek our permission, to use this publication in accordance with the licence
terms.

You must keep intact the copyright notice and attribute the State of Queensland as the source of the publication.

Note: Some content in this publication may have different licence terms as indicated.

For more information on this licence, visit https://creativecommons.org/licenses/by/4.0/.

The information contained herein is subject to change without notice. The Queensland Government shall not be liable for
technical or other errors or omissions contained herein. The reader/user accepts all risks and responsibility for losses,
damages, costs and other consequences resulting directly or indirectly from using this information.
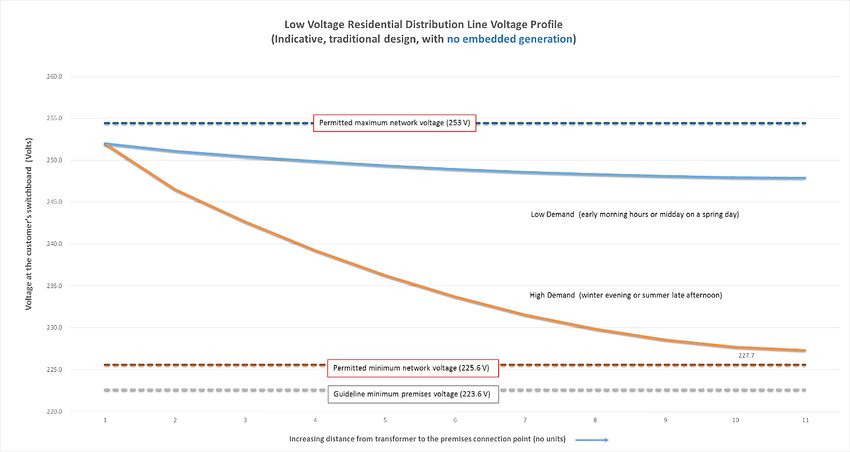
Table of contents
Executive summary .............................................................................................................................. 1
 Impact assessment ............................................................................................................................... 2
   Draft impact assessment .................................................................................................................... 2
   Results of stakeholder consultation .................................................................................................... 4
 Conclusion .......................................................................................................................................... 10
       Background information ............................................................................................................ 10
 1.1. Connection voltage explained ...................................................................................................... 10
 1.2. History of voltage standards ......................................................................................................... 10
   1.2.1             Early voltage standards ................................................................................................. 10
   1.2.2             The evolution of common international voltage standards ........................................... 11
   1.2.3 Network operating voltage ....................................................................................................... 14
   1.2.4 Growth in solar PV in Queensland ........................................................................................... 16
 1.3. The impact of embedded generation on supply voltage .............................................................. 17
   1.3.1             What does supply voltage mean for customers (and appliances)? .............................. 19
   1.3.2             How is network voltage adjusted?................................................................................. 20
       Problem identification ................................................................................................................ 20
 2.1 What if no action is taken? ............................................................................................................ 21
       Objectives of Queensland Government action ....................................................................... 24
       Consideration of options and impact analysis ....................................................................... 24
 4.1 Benefits of ‘voltage optimisation’ .................................................................................................. 26
 4.2 Cost benefit analysis approach .................................................................................................... 27
 4.3 Option 1 – Base case ................................................................................................................... 28
 4.4 Option 2 – adopt the national standards for voltage and power quality, with a 7-year transition to
 full compliance with power quality requirements ................................................................................ 29
   4.4.1             Option 2 – qualitative impacts ....................................................................................... 30
   4.4.2             Option 2 – Net present value ........................................................................................ 31
   4.4.3             Option 2 impacts – distributors...................................................................................... 33
   4.4.4             Option 2 impacts – retailers and generators ................................................................. 35
   4.4.5             Option 2 impacts – electricity customers ...................................................................... 36
   4.4.6             Option 2 impacts – other businesses ............................................................................ 43
   4.4.7             Option 2 impacts – government .................................................................................... 43
   4.4.8             Option 2 impacts - environmental ................................................................................. 44
 4.5 Option 3 – adopt the national standards for voltage and power quality with a 3-year transition to
 full compliance with power quality requirements ................................................................................ 44
   4.5.1             Option 3 – comparative analysis (Part 1) ...................................................................... 45
   4.5.2             Option 3 – comparative analysis (Part 2) ...................................................................... 48

Queensland statutory voltage limits – Decision RIS, Department of Energy and Water Supply, 2017                                                       iii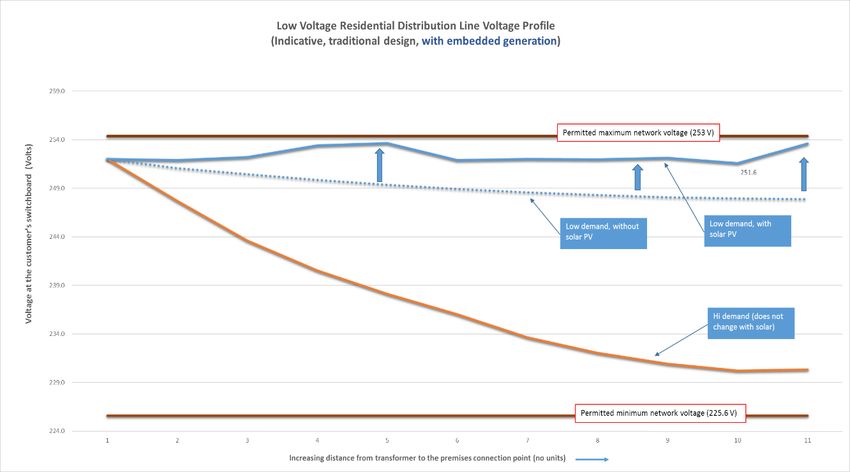
Consultation................................................................................................................................ 52
      Conclusion and recommended option ..................................................................................... 53
      Consistency with fundamental legislative principles ............................................................. 53
      Implementation, compliance support and evaluation strategy ............................................. 54
 8.1. Transitional period for compliance ............................................................................................... 54
 8.2. How would the change be communicated? ................................................................................. 54
 8.3. Performance monitoring ............................................................................................................... 54
      List of abbreviations .................................................................................................................. 55

Queensland statutory voltage limits – Decision RIS, Department of Energy and Water Supply, 2017                                                   iv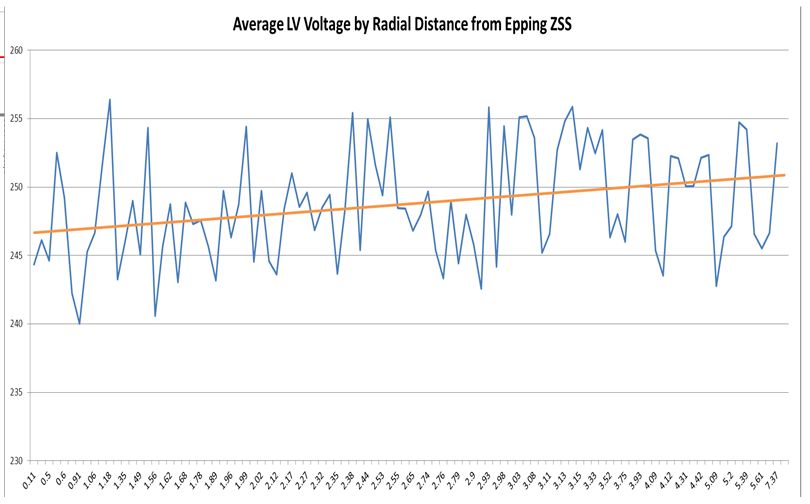
Executive summary
The uptake of embedded solar generation by Queenslanders is one of the highest in the world and
this growth is expected to continue with supportive Queensland Government policies and targets
aimed at increasing solar photovoltaic (PV) and renewable energy deployment across the state. This
prompted the Department of Energy and Water Supply (DEWS) to engage a consultant to examine
and provide technical advice about approaches to balancing greater uptake of solar PV and
renewables with the safe and reliable operation of the electricity network, including the review of
Queensland’s network voltage requirements.
The specification of power supply voltage by legislation is common in Australia, and is intended to
ensure safe and efficient operation of electrical appliances. It is common for legislation to place
maximum and minimum limits on the allowed power supply voltage. In Queensland, Part 2 of the
Electricity Regulation (Qld) 2006 sets the minimum or ‘floor’ at 225.6 volts and the maximum ‘ceiling’
at 254.4 volts. This represents a nominal voltage of 240 volts +/- 6 per cent.
Evidence indicates that this regulated ‘floor’ is too high for modern electrical networks as, in many
instances, it restricts the distribution network service providers’ (distributors) ability to support
renewable generation and address voltage rise more effectively through the simple and cost-effective
mechanism of reducing the power supply voltage. Without widespread access to this option,
distributors will rely on expensive capital investment in network capacity and technical control
systems, or to place restrictions on the connection to the network and operational flexibility of
customer technology such as energy storage and embedded PV generation.
To address these issues, the electricity supply voltage range set under existing legislation could be
reduced by around 10 volts to the international standard of 230 volts +10 per cent / -6 per cent (the
‘international standard’) without risk to the safe operation of electrical appliances. The international
standard is reflected in Australian Standards (AS) 60038:2012 and 61000.3.100 both of which form
the basis of voltage regulation in most other Australian states and many countries.
This Decision Regulatory Impact Statement (RIS) considers five options:
Option 1: Retain existing voltage requirements (base case).
Option 2: Adopt AS60038 (also known as the ‘230-volt standard’) with a one-year transitional
period, and full compliance with AS61000.300.1 in seven years (broadly in line with
distributors standard operation and maintenance (O&M) schedules).
Option 3: Move to 230V standard (AS60038) over a one-year transitional period and full
compliance with AS61000.300.1 over three years (distributors to develop and implement a
dedicated program to fast-track implementation in conjunction with O&M activities).
Option 4: Move to a wider voltage range than specified in the national standard (e.g. 230 V ±
10 per cent).
Option 5: Remove Queensland power supply voltage requirements and use market forces or
other legislation to deliver safe and effective outcomes (non-regulatory approach).
The RIS discounts Option 4 as it is inconsistent with voltage limits in other jurisdictions and does not
reflect current international best practice. Similarly, Option 5 is discounted because there is
insufficient empowerment of customers and market competitive forces to ensure voltage standards
Queensland statutory voltage limits – Decision RIS, Department of Energy and Water Supply, 2017 1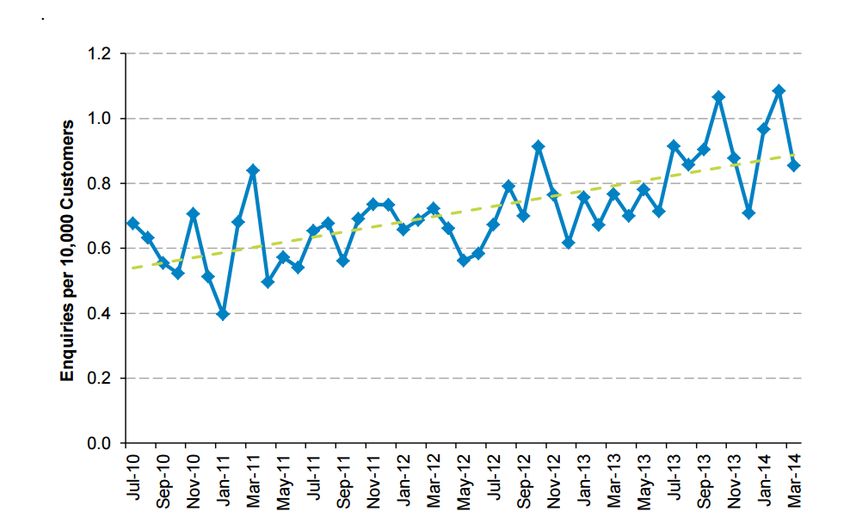
are maintained. As such, the impact of these options on affected stakeholders are not considered in
detail in this RIS.
Impact assessment
Draft impact assessment
Table 1 summarises the costs and benefits of the remaining Options 2 and 3, relative to Option 1 (the
base case). Both Options 2 and 3 ultimately result in best practice voltage management and benefit
the integration of renewable energy into the Queensland electricity grid. The key difference is that
Option 3 is implemented faster than Option 2 and as such allows greater amounts of renewable and
embedded generation to be integrated earlier than Option 2. This is important as it brings forward
benefits such as increased network solar hosting capacity and more flexible connection requirements
for customers in time to support government’s target of 3000 megawatts of installed solar capacity by
2020. It helps the state prepare early for our renewable energy future. As a flow on effect, Option 3
also brings forward environmental and solar industry benefits compared with Option 2.
An economic cost benefit analysis (CBA) of Options 2 and 3 (relative to the Option 1 base case)
indicates both options will bring financial benefits to electricity consumers in Queensland through
energy efficiency savings, noting that energy efficiency outcomes may be variable and a sensitivity
analysis has been conducted to test this variability. Energy efficiency benefits are captured earlier and
are therefore higher under Option 3. The risk to customers of appliance failure/damage from high
voltage also reduces more quickly under Option 3, as does the risk of household solar PV
automatically disconnecting from the network to protect itself in times of high voltage.
The CBA also indicates reduced operating costs for distributors through greater access to lower-cost
network solutions to address voltage rise. These benefits are offset by cost impacts on electricity
retailers and generators. The high-level impacts of Options 2 and 3 (relative to the base case) are
summarised in Table 1.
Table 1 – Summary of financial impacts (draft impact assessment)
Stakeholder Option 1 (base case) Option 2 Option 3
Queensland Regulatory Potential flow-on Supports
Government requirements that effects from government’s 2020
create barriers to the government-owned solar targets and
government’s retailer and investment potential
renewable energy generators. under the RET.
policy objectives.
Potential to either Potential flow on
Divergence from benefit or add cost to effects from
international best the Community government-owned
practice in the operation Service Obligation retailer and
of government assets. payment. generators.
Queensland statutory voltage limits – Decision RIS, Department of Energy and Water Supply, 2017 2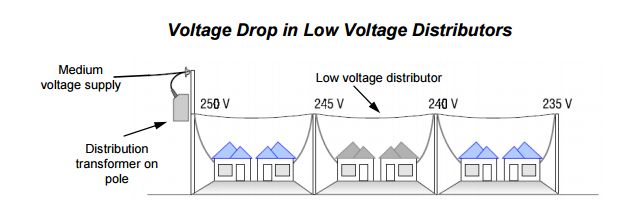
Potential to either
benefit or add cost to
the Community
Service Obligation
payment.
Distributors $109 million in $58 million net $52 million NPV
(Energex and operating costs to present value (NPV) benefit as a result of
Ergon Energy) address voltage rise in benefit as a result of reduced expenditure
the current regulatory reduced expenditure on network
period. on network augmentation and
augmentation and customer complaints.
$2.2 million per year to
customer complaints.
address customer high
voltage complaints.
$60,000 per year in
insurance claims for
appliance damage
associated with voltage
rise.
Retailers Business as usual. $31 million NPV loss $39 million NPV loss
as a result of as a result of
reduced electricity reduced electricity
demand. demand.
Generators Business as usual. $19 million NPV loss $23 million NPV loss
as a result of as a result of
reduced electricity reduced electricity
demand. demand.
Customers Risk of voltage rise $198 million NPV $257 million NPV
(end users) causing appliance benefit as a result of benefit as a result of
failure/damage. increased solar increased solar
uptake and improved uptake and improved
$4 million per year in
energy efficiency. energy efficiency.
reduced appliance life.
Strict technical
assessment thresholds
for solar PV grid
connection in the Ergon
Energy distribution
area.
Continued restriction of
energy feed-in for many
embedded generators.
Queensland statutory voltage limits – Decision RIS, Department of Energy and Water Supply, 2017 3Solar Industry A rapid slow-down in $9 million NPV $9 million NPV
the uptake of rooftop benefit as a result of benefit as a result of
solar. increased solar increased solar
uptake. uptake.
Network capability to
absorb energy feed-in
within regulated limits
will saturate.
Environmental No impact. 1.7 million (tCO2-e) 2 million (tCO2-e)
over 10 years as a over 10 years as a
result of reduced result of reduced
electricity electricity
consumption. consumption.
40MW of additional 40MW of additional
solar capacity by solar capacity by
2020. 2020.
Total NPV
N/A $215 million $256 million
benefit
Results of stakeholder consultation
DEWS released a Consultation RIS for public feedback on 16 March 2017 and received submissions
from 116 individuals and organisations in response, noting that consumer group solar citizens
forwarded 111 submissions on behalf of interested individuals (collected via its website). Other
stakeholders that made a submission include AGL, Origin Energy, Master Electricians Australia, Dr.
Dianna O’Connor and Energy Queensland. All submissions supported adoption of AS60038 and
AS61000.300.1. A summary of stakeholder submissions and the Queensland Government response
is in Table 2.
Queensland statutory voltage limits – Decision RIS, Department of Energy and Water Supply, 2017 4Table 2 – Stakeholder submission summary
Stakeholder Support/Preferred option Submission points Government Response Changes made to the
RIS
AGL Support Option 3. Faster transition and compliance process will Noted. No change to the RIS.
most effectively and efficiently support the
uptake of distributed energy resources
technologies.
The RIS was not clear on the following issues: The Decision RIS considers the No change to the RIS.
issue of accelerated roll-out
the up-front costs to networks to implement
costs for networks to implement
Option 3
Option 3 in section 4.5.2.1.
whether networks would forgo other
See section 4.5.2.1 of
business priorities to meet the Option 3
the RIS for discussion.
timeline and its associated implementation
costs.
Any reduction in voltage appears to only solve Noted. Consideration of non- No change to the RIS.
a short-term problem that is addressing voltage network solutions such as
rise and power quality. storage to support grid voltage
are outside the scope of this
Networks must be directed to consider how to
RIS analysis. However, it
best improve, at least cost, their grid systems
should be noted that networks
for increased bi-directional energy flows over
are already required to consider
the medium to long term. This consideration
a broad range of solutions to
should include the potential for competitively
support growth and reduce
provided non-network solutions (such as
costs. Such solutions include
energy storage systems) that have the
demand management, load
capability to efficiently support long-term grid
control and will increasingly
voltage management issues.
consider storage opportunities.
Queensland statutory voltage limits – Decision RIS, Department of Energy and Water Supply, 2017 5Stakeholder Support/Preferred option Submission points Government Response Changes made to the
RIS
Irrespective of the final option selected by the Performance monitoring of the No change to the RIS.
Queensland Government, a robust proposed recommendation is
implementation plan and ongoing consultation set out in section 8.3 of the
with industry stakeholders will be necessary to Decision RIS.
ensure the forecast benefits are delivered to
Queensland consumers.
Greater transparency at the feeder and Noted. Transparency of No change to the RIS.
transformer level on the distribution networks network information is beyond
could further enhance solar PV penetration in the scope of this analysis.
Queensland. For example, the development of
a community PV tool could be used to identify
available connection capacity.
Energy Support Option 2 or 3. Global trends in solar, batteries and electric Noted. No change to the RIS.
Queensland vehicles (EV’s) continue to indicate a rapidly
increasing pace of change which would favour
the earliest possible deployment of the new
standard.
Energex and Ergon Energy support both
Options 2 and 3, and will work with the DEWS
to effectively transition to the 230V standard
and deliver benefits to customers.
Queensland statutory voltage limits – Decision RIS, Department of Energy and Water Supply, 2017 6Stakeholder Support/Preferred option Submission points Government Response Changes made to the
RIS
Energex and Ergon Energy proposed the Noted. Allowable voltage range No change to the RIS.
following allowable limits relating to higher and steady state limits will align
voltage ranges of 11kV and above: with those inherent in AS60038
and AS61000.3.100.
Voltage Level in kV Steady State LimitsStakeholder Support/Preferred option Submission points Government Response Changes made to the
RIS
Submissions Support Option 3. Solar Citizens forwarded submissions to Noted. The benefits highlighted No change to the RIS.
forwarded on DEWS on behalf of 111 interested individuals. in these submissions largely
behalf of 111 restate those discussed in the
All submissions indicated support for the
individuals by Consultation RIS.
proposal with many pointing to the benefits
Solar Citizens.
highlighted in the Consultation RIS, namely:
Increased ability of the network to absorb
higher solar uptake especially in regional
Queensland, facilitating an estimated 40MW
of additional solar installed by 2020;
Fixing the problem of voltage rise and
associated appliance failure;
Saving $257 million for energy consumers;
Improving energy efficiency;
A reduction of 2 million tonnes of carbon
over ten years through reduced electricity
consumption;
Speeding up the process for solar
connections.
Dr. Diana Support – preferred option The advantages sound excellent on all counts. Noted. No change to the RIS.
O’Connor not specified.
Queensland statutory voltage limits – Decision RIS, Department of Energy and Water Supply, 2017 8Stakeholder Support/Preferred option Submission points Government Response Changes made to the
RIS
Origin Energy Support in principle – The differences in the upper and lower limits The Decision RIS considers the See section 4.4.5.2 of
preferred option not under the two standards (240V vs 230V) will issue of legacy inverters in the RIS for discussion.
specified. mean a large number of solar inverters section 4.4.5.2.
currently installed in Queensland may be
technically non-compliant under the proposed
new 230 volt standard. If the grid voltage is
outside the inverter’s set voltage operating
range, it will error.
The implementation costs and the implications The Decision RIS considers the See section 4.4.5.2 of
for the existing inverter voltage settings comes issue of additional costs to the RIS for discussion.
down to how the networks plan to operate the customers as a result of legacy
grid and enforce compliance with the proposed inverters in section 4.4.5.2.
standard. It is more likely to be an issue in
regional Queensland where the grid operates
around 250 volts today and inverters are also
required to add a 2 per cent voltage rise.
The cost benefit analysis to assess the benefits Noted. The Decision RIS See section 4.4.3.1 of
of lowering the voltage standard must be clarifies the treatment of the RIS for discussion.
consistent with the Australian Energy identified savings from reduced
Regulator’s incentive schemes. Specifically, network augmentation
savings from lowering the voltage standard expenditure in section 4.4.3.1 of
cannot be treated in isolation; they must the RIS under the heading
assess the impact of what they do with these ‘Augmentation expenditure
savings under the conditions set by the savings’.
regulatory framework. If these savings are
Queensland statutory voltage limits – Decision RIS, Department of Energy and Water Supply, 2017 9Stakeholder Support/Preferred option Submission points Government Response Changes made to the
RIS
reallocated to other projects and do not result
in net financial benefit to customers, then that
is the value of the benefit (or additional cost)
that must be used for the purposes of the cost
benefit analysis.
The RIS does not appear to recognise that the Noted. The Decision RIS See section 4.2 of the
reduction in the voltage will increase network clarifies the treatment of RIS for discussion.
losses. Origin believes the cost benefit analysis network losses in section 4.2 of
should be adjusted to recognise these losses the Decision RIS.
and estimates included within the NPV
calculations.
Queensland statutory voltage limits – Decision RIS, Department of Energy and Water Supply, 2017 10Conclusion
DEWS has considered all submissions made in response to the Consultation RIS and clarifies a
number of issues raised, in the analysis. However, the figures in the CBA and conclusion of the RIS
remain unchanged, specifically:
This Decision RIS recommends that resetting the existing voltage settings across the Queensland
electricity distribution network over 3 years (Option 3) to levels in line with international best practice
will better support government policy objectives and provide a greater net benefit overall. This reset
can be undertaken with no net increased cost to distributors (funded through resultant network
savings) and therefore will not add to costs for energy consumers.
Background information
1.1. Connection voltage explained
The term ‘voltage’, measured in ‘volts’, refers to the electromotive force present in a supply of
electrical energy. An analogy is the pressure of water from a tap – the higher the pressure, the greater
the force present. Similarly, the greater the drain on the supply, known as demand, the more the
pressure falls at a given supply point. Power supply behaves a similar way; the greater the demand at
any point in time, the more the voltage falls.
The measured voltage of the mains power supply at premises varies across a permitted range
because of changing energy demand at the premises and other points of electrical demand on the
distribution network. Generally, voltage will be lower during times of high network demand. Appliances
and electrical equipment are designed to operate efficiently within a range of voltage. In Australia, that
range is typically 205 – 253 volts. Different types of equipment are more tolerant of variations in
voltage.
It is a requirement for distributors to design and operate the electricity network so that the variation in
voltage remains within limits under legislation. Distributors manage this through a limit on the number
of and capacity of connections to individual segments of the network and the installation of automatic
control equipment at bulk supply points.
1.2. History of voltage standards
1.2.1 Early voltage standards
In the early days of the electricity industry in Australia and in similar networks around the world (circa
1926–1980), local state-by-state legislation set the allowable voltage range to be observed by the
electricity distributors to ensure the safe and efficient operation of appliances and related electrical
equipment.
Australian Standard AS2926:1987, which commenced life as standard C1 in 1926, was adopted
widely. This standard centred on 240 volts with a range of ± 6 per cent. Western Australia adopted a
250-volt standard reflecting a concern for excessive voltage drop over long rural power lines.
Queensland statutory voltage limits – Decision RIS, Department of Energy and Water Supply, 2017 10Most appliances, including motors, refrigerators and lights were designed and/or manufactured in Australia to meet these standards. ‘240 volts’ became a common descriptor for power supply. Local appliance and equipment manufacturers supplied the local market with ‘240-volt’ equipment. 1.2.2 The evolution of common international voltage standards In 1983, the International Electrotechnical Commission IEC) proposed a common international voltage standard in response to the growing international appliance market, allowing for the specification of consumer electrical equipment for use in many countries. The general requirement currently adopted in Australia of 240 volts ± 6% was merged with the wider international 220-volt requirements, producing a standard known as IEC 60038, which specified a nominal voltage of 230 volts with a permitted range of +10 per cent (max 253 volts) to -6 per cent (216 volts). From 2000, when state and international trade in electrical appliances was commonplace and modern electrical equipment was generally more tolerant of a wider range in supply voltage, jurisdictions in Australia started to adopt the international standard. The last states to adopt the national standard were South Australia around 2000 and New South Wales around 2012. 1.2.2.1 Queensland voltage standard vs the uniform national standard Current Queensland regulation reflects what is commonly known as ‘the 240-volt standard’, where the supply voltage can range between 223 and 254 volts (12 per cent). Queensland statutory voltage limits – Decision RIS, Department of Energy and Water Supply, 2017 11
Electricity Regulation (QLD) 2006

  The allowable range of voltage supply to electricity customers is regulated in Queensland under
  Part 2 of the Electricity Regulation (Qld) 2006.

  Under this part, s9 states:

          “A person who designs, builds, maintains or operates an electric line or works must
          ensure the provisions of this part relevant to the line or works are complied with.
          Maximum penalty—20 penalty units.”

 The predominant sections of this part in relation to electricity supply voltage are:

 s11 (2): The standard voltage for electricity supplied at low voltage from a 3-phase system must
 be:

                   (a) between a phase conductor and the neutral conductor—240V; and
                   (b) between 2 phase conductors—415V.

  s11(3): The standard voltage for electricity supplied at low voltage from a single-phase system
 must be:
                   (c) between a phase conductor and the neutral conductor—240V; or
                   (d) between the phase conductors—480V

 s12: (Permits the voltage of supply to a high voltage customer to be set by negotiation)

 s13: Changes of voltage at customer’s consumers’ terminals

          (1) Supply of electricity by an electricity entity to a customer must be maintained at the
              standard voltage mentioned in section 11 or 12.
          (2) Electricity is taken to be maintained at the standard voltage if the voltage at a
              customer’s consumers’ terminals is within the allowable margin for the voltage.
          (3) The allowable margin is—
                   a. for low voltage—6% more or less than the standard voltage; or
                   b. for high voltage of 22,000V or less—5% more or less than the standard
                        voltage; or
                   c.   for high voltage more than 22,000V—the margin

 A note on voltages specified in the regulation (refer Table 1 of AS60038 – 2012)

 In s11(2), the value of 415 volts is the three-phase equivalent of 240 volts, being the single phase
 value multiplied by the square root of 3. In the national standard, the voltage between any two
 phase conductors is 400 volts, using the same formula.

 For s11(3), the voltage in a single-phase three-wire system becomes 260 volts, being twice the
 single-phase value.

The uniform national standard AS60038:2012, known as ‘the 230-volt standard’ permits a wider 16
per cent range of voltage, with a maximum allowable voltage of 253 volts and a minimum allowable
voltage of 213 volts (Figure 1).

Queensland statutory voltage limits – Decision RIS, Department of Energy and Water Supply, 2017         12
Figure 1 –Voltage ranges of the Queensland and IEC standards (Source: TCA)
Points of difference between the current legislated standard and the national standard include:
1. The allowable maximum network voltage under the national standard is 1 volt (0.4 per cent)
lower than the current level.
2. The IEC standard permits a lower minimum voltage on the grid of 213 volts, resulting in the
minimum voltage of supply at times of maximum demand the premises of 205 volts.
3. The allowable operating range for the network is 37 volts, significantly more than the 28 volts
currently permitted under Queensland regulation (See ‘the tidal range’ analogy below).
4. Both standards permit 5 per cent voltage drop (approx. 11 volts) within the premises (the
yellow bar in the Figure 1 above), consistent with Australian Wiring Rules.
5. The current Queensland requirements ‘fits within’ the IEC standard for the entire voltage
range, except for the top ‘1 volt’.
Queensland statutory voltage limits – Decision RIS, Department of Energy and Water Supply, 2017 13The ‘Tidal Range’ Analogy Low voltage network design relies on an assumption of the electricity demand placed on the network by each customer along the line. This estimate, known collectively as ‘After Diversity Maximum Demand’ or ADMD, leads to a calculation of the highest voltage (at low load time) and lowest voltage (at times of high load) seen at the customer’s connection point. Design principles for many years consider a customer’s load to vary from a low of 0.5 kilowatts in the early morning hours to a maximum of around 4.5 kilowatts at dinner time. This defines an analogous ‘tidal range’ for about 4 kilowatts in demand from highest to lowest. Low voltage networks are designed and operated on the understanding that this 4 kilowatt ‘tidal range’ can exist within the current 12% (± 6%) allowable range of connection point voltage. With many homes now hosting embedded generation however, the power interchange at some connection points within the low voltage network can vary from a peak demand of, say, 4 kilowatts, to a low of minus 4 kilowatts (i.e. feed-in generation). In this case, the ‘tidal range’ of power flow at the connection is now up to 8 kilowatts. Given the roughly linear relationship between the voltage at the connection point and the energy demand, a design voltage range of ± 6%, whilst adequate for areas with no embedded generation, is insufficient to reasonably cater for the doubling of the ‘tidal range’ seen at, in places, more that 30% of the connected premises in the street feeding power into the street. A solution that allows a wider ‘tidal range’, such as the 16% range under the IEC voltage standard is needed. The alternative is significant network augmentation (new conductors, new transformers). 1.2.3 Network operating voltage A fundamental concept with the delivery of electricity is that the voltage along a length of power line will rise or fall as a function of the magnitude and direction of the power flowing through it. There are over 150,000 segments of low voltage distribution line in Queensland, each comprising a distribution transformer and sections of low voltage line (overhead or underground) that supply between one and one hundred premises. Power supply networks have traditionally been set to operate at the ‘top of the allowable voltage range’. For distribution networks, where one-way power flow has been the norm, operating a power distribution network with the source (transformer) set near the upper limit of the permitted voltage range provides assurance that the voltage at connection points (premises) towards the end of the local line do not dip below the minimum permitted level during times of peak demand. Figure 2 demonstrates the concept of voltage drop on low voltage networks. Queensland statutory voltage limits – Decision RIS, Department of Energy and Water Supply, 2017 14
Figure 2 – Voltage drop on low voltage networks

A greater amount of customer load can be supplied through longer lines before the voltage at the far
end of the line falls to a level close to the prescribed low voltage limit of 226 volts (240 – 6%)1. As
power flow has until recently been ‘one-way’, the design is such that the voltage is set high enough so
that will not fall below the permitted minimum at times of maximum network demand, such as a cold
July night or full-load at commercial premises. As is often the case now with significant distributed
embedded generation, power can flow back to the grid, forcing the voltage up above the normal
setting, leading to excess voltage at times of low demand and high feed-in. Figure 3 shows a typical
voltage profile with no embedded generation.

Figure 3 – A typical voltage profile on a local low voltage line, with no embedded generation.
(Source: TCA)

1   Barr, R, Wong P and Baitch, A, New Concepts for Steady State Voltage Standards, 2012.

Queensland statutory voltage limits – Decision RIS, Department of Energy and Water Supply, 2017           15
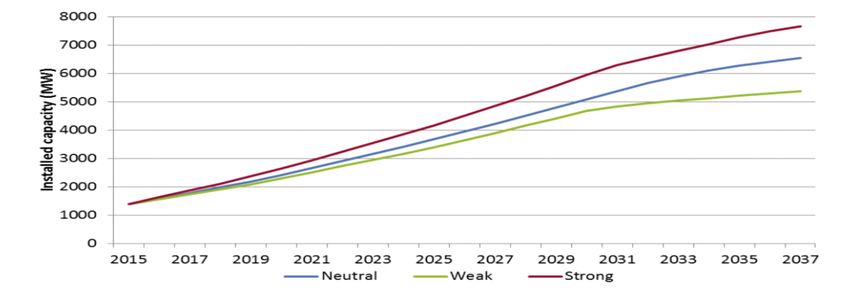
1.2.4 Growth in solar PV in Queensland
Queenslanders have embraced embedded generation, in particular rooftop solar PV, to the point
where in the past Queensland has attained the status of having the highest penetration of embedded
generation in the world.

Installation rates remain strong with data from the Clean Energy Regulator indicating that 21 per cent
(over 1 in 5) of the PV systems in Queensland have been installed since January 2015, well after the
shutdown of the premium feed-in tariff in 2012. Those systems installed in the past two years account
for almost 30 per cent of the installed solar PV capacity.

The average size PV system installed in Queensland continues to climb to over 5.3 kilowatts
reflecting the trend for larger inverters and the growth in the number of small commercial (non-feed-in
tariff (FiT)) systems. The Australian PV Institute data from June 2016 in Figure 4, notes 30.1 per cent
of dwellings in Queensland have PV.

Figure 4 – Penetration of solar PV in Queensland (Source: APVI)

Earlier in 2016, the Australian Energy Market Operator commissioned the Jacobs Group to consider
the future growth of embedded generation and new customer technologies. The report, published in
June 2016, noted strong growth of PV and integrated PV and storage system uptake in the
commercial sector, after a decline in growth in installations in the residential segment expected after
20322.

The total capacity of systems in Queensland at the end of forecast period is 6,552 megawatts (MW),
the highest of all states (Figure 5).

2   Jacobs Group (Australia), Projections of uptake of small-scale solar (AEMO), 2016.

Queensland statutory voltage limits – Decision RIS, Department of Energy and Water Supply, 2017           16
Figure 5 – Queensland rooftop PV and battery storage forecasts (Source: Jacobs / AEMO)

1.3. The impact of embedded generation on supply voltage
Figure 6 shows a typical voltage profile for a connection to residential premises in Queensland. The
impact of voltage rise around midday because of embedded PV generation export is evident, as is
voltage fall coincident with high energy demand in the early evening. Note, the voltage is always in
the upper half of the allowable range reflecting the practice to ‘run the voltage high’ to reduce the risk
of low voltage at times of extreme energy demand.

Figure 6 – Typical connection voltage profile, residential premises with solar PV (Source: TCA)

                                                        Connection voltage
                260                                                                                                       6    Power flow (export / demand) (Watts)
                255                                                                                                       5
                                                                                                                          4
                250                                                                                                       3
                245                                                                                                       2
      Voltage

                                                                                                                          1
                240
                                                                                                                          0
                235                                                                                                       -1
                230                                                                                                       -2
                                                                                                                          -3
                225                                                                                                       -4
                220                                                                                                       -5
                      0:00   2:00    4:00     6:00   8:00   10:00   12:00   14:00   16:00   18:00   20:00     22:10
                                                               Time of Day
                         Connection voltage (LHS)       Max limit (Qld)       Minimum limit (Qld)           power flow (RHS)

High levels of self-consumption and feed-in during daylight hours results in reverse power flow. This
change in power flow is driving network voltages up in a matter not foreseen when they were
designed (Figure 7).

Queensland statutory voltage limits – Decision RIS, Department of Energy and Water Supply, 2017                                                                       17
Figure 7 – Voltage rise along a distribution power line with high embedded generation – noting the horizontal axis denotes the radial distance from the zone sub-station (Source: Ausnet Services smart meter data) In comparison with Figure 3 (no embedded generation), Figure 8 shows the fall in voltage along the line in peak demand conditions remains unchanged, unaffected by the existence of solar PV (brown line). In low load conditions such as a sunny mild weekday however, the impact of embedded generation ‘pushes’ the voltage up towards the maximum allowable limit (blue lines). Figure 8 - Voltage Profile on a Local Low Voltage Line, with Embedded Generation. Note: the higher voltages at the connection points along the low voltage line at times of low load and energy feed-in (solid blue line) (Source: TCA) In extreme cases of high saturation of rooftop solar PV, the blue line can cross and exceed the maximum limit. In this case, inverters can trip off, or electronics in the customer’s premise can fail or suffer damage, leading to quality-of-supply complaints from customers and reduced performance of Queensland statutory voltage limits – Decision RIS, Department of Energy and Water Supply, 2017 18
the PV system. In 2016, Energex and Ergon Energy reported around 1000 customer complaints
related to solar PV and high network voltage.
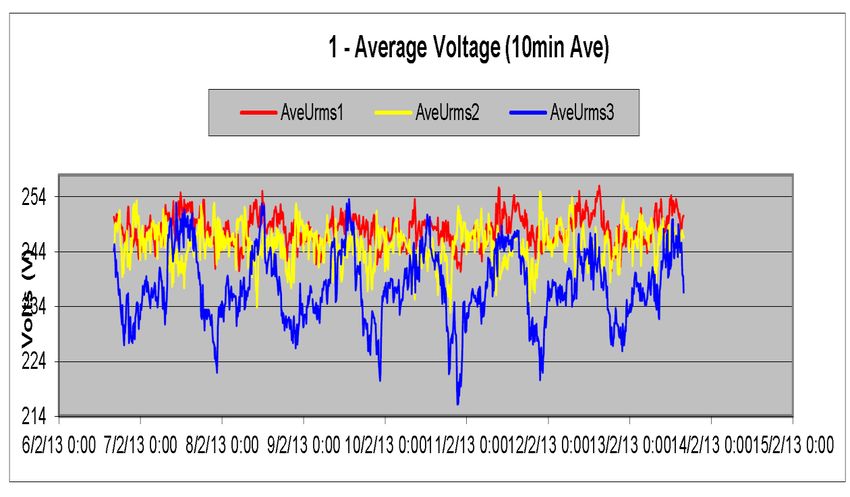
Figure 9 shows voltage measurements at the end of a low voltage line with homes with solar PV, over
a 9-day period in February 2013. The effect of solar feed-in during the middle of some days lifts the
voltage at some premises to a level above 254 volts (the allowable maximum), yet it also falls to 215
volts (minimum permitted is 225 volts) in the evening at nearby homes on the same segment of low
voltage line.
Figure 9 – High level of solar PV - noting the 'AveUrms’ lines represent the 3 phases of a low
voltage power line (Source: Energex Voltage Complaints Process, 2015)
1.3.1 What does supply voltage mean for customers (and appliances)?
The actual voltage of the power supply is essentially ‘invisible’ in itself to all but the more
sophisticated electrical consumers with a high level of monitoring, such as local water utilities or
advanced manufacturers. What is noticeable in relation to supply voltage is the impact of the voltage
range, where:
A supply voltage well over the nominal operating range (e.g. +15 per cent) can result in
immediate damage and failure of equipment, particularly electronics. In extreme cases,
overheating and fire is possible.
Regular exposure to a high supply voltage (e.g. +10 to +15 per cent) can cause
malfunctioning of electronic equipment and the accelerated failure of appliances.
Regular exposure to a low supply voltage (e.g. -15 per cent) can result in poor performance of
appliances and equipment.
Exposure to very low supply voltage (e.g. -20 per cent) can cause overheating of older
equipment, such as motors installed pre-1980, and the accelerated failure of some motors.
Loss of life for electrical equipment is largely related to the degradation of insulation when the
machine is operated at elevated temperatures, which can occur when supplied at the lower range of
rated voltage. This is a slow process and very difficult to define, because actual loss of life generally
Queensland statutory voltage limits – Decision RIS, Department of Energy and Water Supply, 2017 19occurs during a random power supply transient (blackout, lightning strike nearby, frequent switching
on and off) well after the life of the equipment has been reached. With electronic equipment, small
components can have a more rapid loss of life with failure that is much more sensitive to operation at
high voltages rather than lower voltages 3.
1.3.2 How is network voltage adjusted?
For the vast majority of customers connected to the shared low voltage network, the voltage is set by
the ‘transformer tap’ on the distribution transformer that supplies the segment of mains. The
transformer tap essentially adjusts the output voltage of the transformer over a range, generally up to
10 per cent of rated voltage.
The tap is generally changed ‘off line’; that is, power must be interrupted to the customers for up to 30
minutes whilst the change in setting is made. Under the National Electricity Rules, four days’ notice is
required for customers affected by a planned power interruption. Queensland distributors report a cost
of between $250 and $1000 to change a transformer tap.
Problem identification
A characteristic of electricity distribution networks is that high levels of energy feed-in from embedded
generation causes the voltage in the local electricity network to rise. In Queensland, voltage rise is
becoming more prevalent because of the increasing penetration of embedded generation 4. On sunny
days, the power supply to an increasing number of homes and businesses is at risk of exceeding the
254-volt maximum permitted in regulation. This places customer appliances at risk of failure and
damage, reduces their efficiency, and shortens their operating life. The performance of embedded
generators is also reduced as systems automatically disconnect to protect themselves and nearby
electrical equipment from damage.
This concern has become widely evident in the last five years as the amount of embedded generation
in the power distribution network has significantly expanded from 350 megawatts (MW) of installed
capacity at the end of 2011 to over 1600MW at the end of 2016. The resulting two-way flow of
electricity in local networks means local power lines are being used in a way that was never
contemplated in the design of these assets.
A key issue is that existing statutory voltage limits in Queensland place an artificial ‘floor’ on electricity
supply voltage. This limits the ability of distributors to address the impact of voltage rise more simply
and cost-effectively by reducing the average operating voltage of networks that supply electricity to
end consumers. This forces distributors to make significant investment in remediating and upgrading
the network or to operate sections of the network at the upper end of the power supply limit, thereby
increasing the likelihood of customer high voltage issues and complaints.
Queensland’s existing statutory voltage limits of 240 volts ± 6 per cent are no longer appropriate for a
contemporary electricity network where two-way power flows from embedded renewable generators is
increasingly common. The narrow 12 per cent operating range is inconsistent with the more
3 Sweeting, D, Implications of the 230V voltage profile - report to standards committee EL/42, 2011.
4 Energex Power Quality Strategic Plan 2015-20, p11.
Queensland statutory voltage limits – Decision RIS, Department of Energy and Water Supply, 2017 20progressive uniform standard of 230 volts +10 per cent/-6 per cent accepted elsewhere in Australia and overseas, and it’s permitted 16 per cent range. 2.1 What if no action is taken? Taking no action will restrict opportunities for distributors to reduce voltage as a way of managing the network impact of embedded renewable generation, with the following consequences: Distributors will continue to rely on more expensive options to manage voltage rise, such as significant operating and capital investment in the low voltage networks. In its final regulatory determination, the Australian Energy Regulator (AER) allocated Energex and Ergon Energy $24 million5 and $26 million6 respectively to manage voltage rise and maintain power quality on Queensland networks for the 2015 to 2020 regulatory period. Advice from distributors indicated that the actual cost will be in the order $109 million ($59 million for Energex and $50 million for Ergon). This includes expenditure on network augmentation, operating practice changes, addressing customer voltage complaints and installing monitoring equipment on the network to provide early warning of power quality concerns. Distributors will field an increasing number of high voltage complaints from customers. For customers with existing solar PV embedded generators, the occurrence of voltage rise places customer appliances at risk of failure and reduces the performance of embedded generators as they automatically disconnect to protect themselves and adjacent electrical appliances at times of high voltage. In extreme cases, appliances that run at voltage levels well above the median (e.g. +15 per cent) run the risk of overheating and causing fires. At present, the distributors receive about 1000 high voltage complaints per year. Energex and Ergon Energy advise that it costs $2,200 on average to field and investigate each complaint at a total cost of $2.2 million per year. In addition, insurance claims for appliance damage associated with voltage rise cost distributors about $60,000 per year. Data from Energex indicates an increasing trend in the number of customer complaints from high connection voltage since 2010-11 (Figure 10). 5 Australian Energy Regulator, Final Decision Energex Attachment 6 – capital expenditure, p6-36. 6 Australian Energy Regulator, Final Decision Ergon Energy Attachment 6 – capital expenditure, p6-46. Queensland statutory voltage limits – Decision RIS, Department of Energy and Water Supply, 2017 21
Figure 10 – Energex high voltage complaints

Under the current regulatory arrangements, customer high voltage complaints may continue trending
in this direction, causing significant additional cost for distributors to investigate and address them.
These additional costs are ultimately passed through to electricity customers.

Distributors will restrict the connection of embedded generation to the network, limiting the
use of the network to export or trade distributed energy as network hosting capacity is
reached.

Distributors’ connection guidelines place limitations on the network connection of embedded
generation to manage high voltage. This means many solar connection applications go through the
technical assessment process with the effect of adding time (and in some cases cost) to the process
of installing a solar PV system.

Technical assessments may require customers to modify the size (or export capacity) of their chosen
system, restrict the system’s ability to export excess solar generation to the grid or, for larger systems,
pay a capital contribution (of between $10,000 and $60,000) toward the cost of a network upgrade
before the system is installed. This can impact the attractiveness and financial viability of installing
solar PV for some customers, and the renewable energy industry’s ability to grow.

Energex recently identified that almost 1-in-10 distribution transformers were likely to record voltages
greater than that permitted under current regulation, with 11.5 per cent of customers likely to
experience voltage at or above the 99th percentile of permitted voltage7. On this basis, it is considered
likely that 10 per cent of new applications for new rooftop generation (around 200 per month) will
require modification or be refused.

Feedback from industry is that current solar connection processes are challenging the growth of
Queensland’s renewable energy industry. Furthermore, it is expected that as solar PV penetration
increases in Queensland, a point may be reached in the future where customers are locked out of
installing rooftop solar altogether because some sections of the network have limited capacity to

7   Energex Power Quality Strategic Plan 2015-20, p10.

Queensland statutory voltage limits – Decision RIS, Department of Energy and Water Supply, 2017            22
safely host embedded generation. This may result in further restrictions on the grid connection of
exporting solar PV systems in the future, leading to poor outcomes for customers and a potentially
detrimental effect on the Queensland’s renewable energy industry.

Queensland voltage standards are inconsistent with other Australian states and do not reflect
international best practice.

As early as 2004, the Council of Australian Governments (COAG) released Principles and Guidelines
for National Standard Setting by Ministerial Councils. A goal of the guide is to adopt regulatory
measures or standards that are compatible with relevant international or internationally accepted
standards or practices in order to minimise any impediments to trade. Failing to adopt a uniform
standard nationally for voltage is inconsistent with the COAG Energy Council objective to ensure
efficient investment and operation of electricity infrastructure 8.

Queensland Government initiatives for further development of renewable generation and
supporting new market frameworks (such as peer-to-peer energy trading) will proceed at a
higher cost to energy consumers.

The Queensland Government is committed to delivering its Solar Future policy. Included in the
initiative is a target for one million solar rooftops or 3000 megawatts of installed solar capacity in
Queensland by 2020. The aim of this policy target is to help grow the renewable energy industry,
lower electricity costs for families and businesses, create jobs and protect the environment by
reducing greenhouse gas emissions.

A key aim of the government policy is that the development of solar PV does not add to unreasonable
costs for Queenslanders. Should the statutory voltage limits fail to reflect the current trends and
demands of changing customer energy use, distributors will be forced to take a less efficient approach
to managing voltage rise in the future and government’s cost objectives are less likely to be met.

Modern electrical equipment will continue to be operated at the upper end of its operating
voltage parameters, increasing the risk of appliance damage, poor performance and reduced
product life.

With consumer electrical appliances and equipment being manufactured for global markets,
maintaining the current voltage standard means that modern electrical equipment used by households
and small businesses will operate at the higher end of its operating range.

The majority of appliances purchased for consumer use in Queensland since the late 1980s have
been constructed to the international standard of 220 – 240 volts. In areas of high solar PV
penetration, power supply voltages of above 250V are common. International studies have shown that
average energy consumption by common appliances can increase by approximately 0.65 per cent for
every volt above nominal efficient rating. Appliance effective service life before failure is reduced
when operated over nominal voltage9.

With an estimated $4 billion worth of household appliances in Queensland homes, a conservative
estimate of 0.1 per cent would result in reduced appliance life/appliance failure of approximately $4
million per year.

8   COAG Energy Council, Energy Market Transformation, December 2015
9   Linden, K and Segerqvist, I, Modelling of Load Devices (appliances), Chalmers University of Technology, 1992

Queensland statutory voltage limits – Decision RIS, Department of Energy and Water Supply, 2017                23
Objectives of Queensland Government action
The objective of this work is to consider if aligning Queensland’s statutory voltage limits with
Australian and international standards will allow more efficient management of voltage issues caused
by the high penetration of solar PV in Queensland and support greater levels of renewable generation
in line with the Queensland Government’s overarching energy policy objectives of:
delivering stable energy prices
ensuring long-term security of electricity supply
transitioning to a cleaner energy sector
creating new investment and jobs.
Consideration of options and impact analysis
Based on the recent assessment of Queensland’s solar PV connections framework and additional
research, analysis and targeted stakeholder consultation, this RIS identifies five possible approaches
to achieving the stated policy objectives (Table 3).
Table 3 – Options in respect of the regulation of Queensland’s statutory voltage limits
Option Description/Operation
Option 1: Business as usual – No regulatory Description - Maintain existing requirements
change prescribing network voltage as 240 volts of +6/-6
per cent.
Operation - Distributors will act to correct
distribution voltages and upgrade the network to
ensure the electricity supply is within statutory limits
as part of regular operating augmentation
schedules over the next two regulatory periods (7
years).
Option 2: Regulatory change – Adopt the Description - Adopt the national standard for power
national standards for voltage and power supply voltage of 230 volts +10/-6%
quality with a 6 to 8-year transition to full (AS60038:2012) and the standard for Limits of
compliance with the power quality Steady-State Voltage in Public Electricity Systems
requirements. (AS61000.3.100:2011).
Operation - Distributors will act to correct
distribution voltages that exceed (the new)
regulated limits as part of regular operations over
the next two regulatory periods (7 years).
Queensland statutory voltage limits – Decision RIS, Department of Energy and Water Supply, 2017 24You can also read