Businesses at Work powered by 2021 - Okta
←
→
Page content transcription
If your browser does not render page correctly, please read the page content below
Businesses at Work
                 powered by      2021

Okta Inc.
okta.com
press@okta.com
Businesses at Work
Contents 3 Introduction
4 Summary of key findings
6 Methodology: how did Okta create this report?
7 Apps at Work: 2020’s most popular apps
10 The platform effect
11 The fastest growing apps
14 Apps here, there, and everywhere
18 Developers at Work: Okta + Segment
26 Remote Work
35 Security at Work
38 There are many imposters among us
41 Looking forward, moving aheadBusinesses at Work 3 Welcome to the seventh Businesses at Work report, an in-depth look into how organizations and people work today — exploring workforces and customers, and the applications and services they use to be productive. This year, as the pandemic became a global concern, our worlds were flooded with change. We turned to technology to stay afloat. Families scrambled to get equipped, companies rushed to support their remote workforces, and organizations quickly developed new online experiences for customers. And as the pandemic accelerated, tech solutions once preferred only by “early adopters” became survival tools for companies across all industries, and the population as a whole. It’s from this unprecedented lens that we view the data from Okta’s more than 9,400 customers and the Okta Integration Network (OIN), which includes over 6,500 integrations with cloud, mobile and web apps, as well as IT infrastructure providers. A shakeup in our top apps underscores the new necessities of remote work: collaboration, security, employee engagement... and a well-equipped home office. This year we welcome Amazon Business, along with hot collaboration tools such as Miro, Figma, and monday.com, to our fastest growing apps. We also see that organizations are moving quickly to protect remote workers with next-gen security tools, such as Fortinet FortiGate and Palo Alto Networks GlobalProtect. And HR teams are increasingly investing in employee engagement tools such as Culture Amp and Lattice to supplement their existing resources.
Businesses at Workk                                                                       Summary of key findings                        4
powered by

Apps at Work: 2020’s most popular apps                                 largest numbers of customers, while Sprout Social has seen
                                                                       the largest percentage growth post-IPO.
Looking at the most popular apps and services by number of
customers, Amazon Web Services (AWS) has jumped up to                  See more data

claim the #2 spot, and tools enabling collaboration, including
Zoom and DocuSign, have made large gains. We extend a warm             Apps here, there, and everywhere
welcome to two security-focused apps, KnowBe4 and Palo Alto
Networks GlobalProtect, that, for the first time, have earned          With an average of 88 apps per customer, we see some interesting
spots in the top 15 most popular apps.                                 breakdowns:

                                                                       •   Larger customers deploy an average of 175 apps, and smaller
App use varies by region: for example, AWS and the Atlassian
                                                                           companies average 73
Product Suite rank higher in Europe, the Middle East, and
Africa (EMEA) and Asia Pacific (APAC) than in North America.           •   Tech companies deploy the most apps with an average of 155
                                                                           (no surprise there)
And while the number of monthly unique users stalled for most          •   Over the past four years, the government sector has seen the
apps in the first months of the pandemic, Zoom and Palo Alto               largest increase in average app deployment, at 140%, including
Networks GlobalProtect thrived.                                            a 43% jump in the past year alone
See more data
                                                                       Okta’s customers that use Microsoft 365 (referred to in this
                                                                       report as Okta’s Microsoft 365 customers) continue to invest in
The platform effect                                                    top functionality apps. Over the past five years, the number of
                                                                       these customers simultaneously deploying best-of-breed apps
We look at the platform effect, how certain apps which become
                                                                       has increased by seven percentage points. Of Okta’s Microsoft
an integral part of a company's operating technology tend to
                                                                       365 customers, nearly 10% deploy six or more best-of-breed
have long term staying power. Since our first report in 2015,
                                                                       apps. While Microsoft Teams and OneDrive come standard with
Microsost 365, Salesforce, and Google Workspace (formerly
                                                                       the Microsoft 365 Basic Business subscription, Okta’s Microsoft
G Suite) have held three of our top four spots. Network effects
                                                                       365 customers invest in best-of-breed apps as well.
amplify the stickiness of these platforms.

                                                                       42%
See more data
                                                                                                of Okta's Microsoft 365 customers also
                                                                                                deploy Zoom
The fastest growing apps

                                                                       32%
For the first time in the history of our report, 90% of our fastest
growing apps are brand new to the top 10. Companies needed                                      also deploy Slack
to enable remote work, which meant supporting at-home
workspaces and virtual collaboration, and these apps helped

                                                                       26%
them do it. Amazon Business, which enables organizations to
quickly access and purchase from an online store, takes top                                     also deploy Box
billing with an impressive 341% year-over-year growth, followed
by collaboration tools Miro, Figma, and monday.com.

Also for the first time, security tools claim four top spots in the    Meanwhile, these customers also double-bundle: over 36% of
fastest growing category, and an HR-centric tool appears for           Okta’s Microsoft 365 customers now deploy Google Workspace
the first time since 2016. Another first since 2016? Zoom is not       as well.
a global fastest growing app. But it’s the #1 fastest growing app
                                                                       See more data
in EMEA. AWS is the fastest growing app in APAC.

What’s hot? Looking at products from companies that had an
initial public offering (IPO) or direct public offering (DPO) in the
past year, we see Jamf Pro, Asana, and Snowflake claim the
Businesses at Work
ork Summary of key findings 5
powered by
+
our fastest growing security tools, with 50% growth since
Developers at Work: the most popular tools for building the end of February. Looking at people-centric tools, security
digital experiences awareness training tool KnowBe4 has grown 46% since the
This year we are proud to collaborate with Segment, the market- start of 2020. Expanding our lens to include personal app use,
leading customer data platform (CDP) recently acquired by we see that most of our top hotel and lodging apps measured
Twilio, to provide a more in-depth look at the customer journey. growth in the fractions of percentages, or negative
We get a look at where businesses are collecting and gathering numbers. One app was an exception: Airbnb saw nearly 11%
data to drive customer engagement: spoiler alert, JavaScript growth year over year, including 3% growth since the end of
was the most popular data source. Looking at Segment’s data, February.
we see that company size affects the number of apps receiving In the health and wellness space, top exercise apps saw more
customer data across the organization: the average number of growth in January than during the pandemic. And in this difficult
destinations used by larger customers stands at 14, while SMBs year, we’re proud to report that over 930,000 users have been
use a more modest nine. Diving deeper into the types of apps assigned Apps for Good.
being adopted on Segment’s platform, we get an in-depth view
See more data
of how the SaaS market is evolving. Analytics apps remain the
#1 category on the Segment platform, while digital advertising
rose to #2. Security at Work: today’s safety checklist includes masks,
hand sanitizer, and stronger factors
Okta data shows us that regardless of size, companies are
building customer-facing apps at roughly the same pace, at a Compared to traditional brittle forms of authentication (i.e.,
median of four apps. And developers’ most popular SDK tool simple two-factor methods), higher assurance factors are on
is JavaScript, used by 63% of customers using an SDK tool, a the rise. We see that the use of Okta Verify (including Okta
significant jump from 24% last year. Developers need a deep Verify with Push notifications) is growing, from 78% last year
toolbox to build the hottest apps. The Atlassian Product Suite to 82% today. The number of authentications with Okta Verify
tops our developer tools, and we welcome Sentry and Atlassian increased 184% between February and October.
Opsgenie as well.
Once again, we see weaker factors on the decline from two
As our Customer Identity and Access Management (CIAM) years ago: the percentage of Okta customers using SMS has
customers continue to add security protections for their end dropped from 53% to 49%, and the percentage using security
users, easy-to-deploy SMS is the most popular choice, growing questions has dropped from 18% to 15%.
eight percentage points in the past two years. Over the past
See more data
two years, stronger factor Okta Verify (including Okta Verify
with Push Notifications), has increased by 15 percentage points.
There are many imposters among us
See more data
Looking at Okta’s ThreatInsight data we see that, while the
number of authentications has risen steadily over the past
Remote Work: winners and consumer’s choice awards
six months, the overall growth of detected threats shows a
Our remote work stack features the top tools our customers significant increase in the late summer and fall. The most-
overwhelmingly choose for specific needs, such as Smartsheet targeted industries may not be the ones we expect. Of all
for project management, Lucidchart for wireframing, and Miro industries, education has the largest ratio of detected threats
for whiteboarding. Dialing in to video conferencing, top tool Zoom compared to the volume of authentications — more than twice
grew over 45% between March and October. And in HR, we see as many as finance and banking, and more than five times as
employee engagement tools have made especially large gains: many as healthcare and pharmaceuticals.
Culture Amp grew 75% in the past year, and Lattice joined the
See more data
top HR tools for the first time.
Since the pandemic began and companies needed to protect remote
workforces, Palo Alto Networks GlobalProtect has been one ofBusinesses at Work 6
Methodology: how did Okta create
this report?
To create our Businesses at Work reports, we rely on data
from Okta customers. We anonymize Okta customer data
from our network of thousands of companies, applications,
and IT infrastructure integrations, as well as millions of daily
authentications and verifications from countries around the
world. Our customers and their employees, contractors, partners,
and customers use Okta to log in to devices, websites, apps and
services, and leverage security features to protect their sensitive
data. They span every major industry and vary in size, from small
businesses to some of the world’s largest organizations, with
hundreds of thousands of employees or millions of customers.
As you read this report, keep in mind that this data is
representative of Okta’s customers, the applications and
integrations we connect to through the OIN, and the ways
in which users access these tools through our service. The
terms “app” and “tool” are used throughout this report to refer
to applications, services, and integrations that are available
through the OIN. The trends we describe for Okta’s Microsoft
365 customers may differ for those Microsoft 365 customers
who do not use Okta (i.e., those using Azure Active Directory
or other identity platforms that do not provide strong cross app
integration support.)
Each year, we look at app popularity in two different ways: first,
by number of customers with an app deployed, and second by
the number of active unique users, defined as users who have
logged into an app via Okta at least one time in the past 30 days.
We have worked carefully to standardize our data. Unless
otherwise noted, this report presents and analyzes data from
November 1, 2019 to October 31, 2020, which we refer to as
“this year,” “today,” and “in 2020.” Similarly, when we refer to
“last year” or “in 2019,” we are referring to data from November
1, 2018 to October 31, 2019. “2018” refers to the same period
in its respective year. When referring to company size, Okta
uses the term "small" to refer to companies with 1,999 or fewer
employees, and "large" to refer to companies with 2,000 or
more employees.
Unless otherwise specified, the data included in this report is
limited to Okta customers that have deployed at least one app
through the Okta Integration Network. Also, unless otherwise
noted, this report looks at apps deployed for corporate use.Businesses at Work 7
Apps at Work: 2020's most popular apps
Remote work and security tools have the wind in their sails Microsoft 365 continues to hold the top spot, but there has been
a significant shakeup in the ranks overall. With 35% year-over-
We have seen some exciting changes in our top ranks. Cloud
year growth, AWS jumped into the second place spot, which
platform AWS has risen steadily from sixth place five years ago
had previously been held by Salesforce since our first report in
to become this year’s second most popular app by number of
2015. Salesforce now takes third. Google Workspace holds onto
customers. Tools enabling collaboration, including Zoom and
its fourth place position for the fourth year in a row, but in the
DocuSign, have also jumped in the ranks.
lower ranks, the waters are churning.
And we extend a warm welcome to two security-focused tools
With 64% year-over-year growth, driven in part by the global
that have earned spots in the top 15 most popular apps for the
move to remote work, Zoom surged past the steady growth
first time: after three years as a fastest growing app, KnowBe4
of Slack and the Atlassian Product Suite to claim fifth place
graduates to become one of the most popular apps by number
— especially impressive considering this is only Zoom’s third
of customers, and Palo Alto Networks GlobalProtect becomes
year as a most popular app by number of customers. DocuSign
one of the overall most popular apps by active unique users.
jumped three spots to eighth place as people everywhere needed
Congratulations, and welcome aboard!
to sign documents digitally. And KnowBe4, providing security
Customers have been investing in the tools they need to ride awareness training, came on strong, joining the ranks at #14.
out a challenging year. Looking at the most popular apps by
number of customers, tools enabling collaboration and security Note: the Atlassian Product Suite now includes Trello, as well as
Confluence, Jira, and Bitbucket, which are frequently accessed together
have seen the largest gains.
via a subscription to Atlassian Access.
Most Popular
Most Popular Apps byApps
Number by Number of Customers
of Customers
Microsoft 365
AWS
Salesforce
Google Workspace
Zoom
Atlassian Product Suite
Slack
DocuSign
Box
Number of Customers
Cisco Meraki
SAP Concur
GitHub
Zendesk
KnowBe4
Lucidchart
Apr 2016 Oct 2016 Apr 2017 Oct 2017 Apr 2018 Oct 2018 Apr 2019 Oct 2019 Apr 2020 Oct 2020Businesses at Work 8
Apps make the world go ‘round
When we break out our most popular apps by region, we find as Salesforce and Google Workspace. Other examples of higher
some striking differences. At the top of our ranks, we see that rankings in EMEA include Slack (1 spot higher than in North
the new second-place global rank for AWS is driven by its strong America), Zendesk (6 spots higher), and GitHub (4 spots higher).
growth in EMEA and APAC, where it has seen over 25% growth
Some apps that don’t appear in our global rankings make cameo
since April, 2020, compared to 16% growth in North America
appearances in regional breakdowns. Social media giant Twitter
during the same time period.
left our global top apps in 2017, but in EMEA, Twitter still sits
For many apps, their popularity in North America drives their in the top 15. Jamf Pro, our #1 fastest growing app in 2018
rank on the charts. Salesforce and Zoom’s global ranks are and a recurring fastest growing app through 2020, appears
underpinned by their popularity in North America: each ranks in the EMEA top 15. And APAC customers’ deployment puts
two spots lower in APAC and three spots lower in EMEA. ServiceNow (IT service management support), Mimecast (email
security), Xero (small business accounting, headquartered in
But some apps find their sweet spots outside of North America.
Wellington, NZ), and Palo Alto Networks GlobalProtect (network
While the Atlassian Product Suite (headquartered in Sydney,
security) into APAC’s top 15.
Australia) ranks sixth on our global list and in North America, it
ranks third in EMEA and APAC, beating out such popular tools
Most Popular Apps by Number of Customers, by RegionBusinesses at Work 9
As the world changed in April, so did app usage
Popularity by active unique users looks at which apps are being Two tools notably thrived during this period. Zoom, which had
adopted by the most users across organizations. Each year this only joined the top apps by unique users for the first time in 2019,
chart sees seasonal dips around the winter holidays as users log ended this current data period in sixth place. In our Businesses
off, but this year we also see the dramatic impacts of quarantine at Work (from Home) report in April, when we highlighted
and shelter in place orders. Over the span of nine weeks, starting apps that had seen significant growth in numbers of corporate
in mid-March 2020, more than 38 million Americans filed for and personal users in March, Zoom was our fastest growing
unemployment across the country. Employees across industries app by number of unique users. While unique users dipped a
were furloughed or laid off, and app usage data reflects that. bit over summer, by the end of September they were reaching
Looking at our top app, for example, we see that 57% of Okta new highs, likely related to Zoom’s extensive efforts to support
customers with Microsoft 365 had a decrease in unique users distance learning.
in April.
Palo Alto Networks GlobalProtect also thrived. As companies
Many top apps, such as Microsoft 365, Workday, ServiceNow, rushed to protect their remote workers with secure remote
Salesforce, Zscaler, Cornerstone OnDemand, and Slack, showed access, it joined the top ranks by unique users for the first time.
a noticeable dip in user activity after March 31, 2020, all reaching It was the second fastest growing tool by number of unique users
a turning point at the end of May. By the end of July, Microsoft in our supplemental April report: GlobalProtect usage climbed
365, Salesforce, and Cornerstone OnDemand monthly unique over 230% in late March when compared to 28 days prior, and
user levels had rebounded to equal or higher levels of use, and by has only continued to rise.
the end of August, Workday, ServiceNow, and Zscaler rebounded
as well. Slack recovered by the end of September.
Most Popular
Most Popular Apps by Apps byMonthly
Number of Number of Monthly
Active Unique Users Active Unique Users
Microsoft 365
Workday
ServiceNow
Google Workspace
Salesforce
Zoom
Number of Unique Users in the Past 30 Days
ZScaler
Box
Slack
Cornerstone onDemand
Atlassian Product Suite
SAP SuccessFactors
Palo Alto Networks
GlobalProtect
SAP Concur
UltiPro
Apr 2016 Oct 2016 Apr 2017 Oct 2017 Apr 2018 Oct 2018 Apr 2019 Oct 2019 Apr 2020 Oct 2020Businesses at Work 10 The platform effect Apps secure a solid foothold at the top Some of the apps Okta connects to serve as platforms in their own right: moving beyond specific functionality, companies can build on top of these platforms, integrating their functionality into other systems, and even baking the platform’s underlying technology into the company’s own app stack. These platforms become a core, integral part of the company’s operating technology and would be expensive and cumbersome to replace. They have long-term staying power because they are so intertwined with how business gets done. How do platforms rank among our customers’ app usage? Since our first report in 2015, Microsoft 365, Salesforce, and Google Workspace have held three of our top four spots. They may have rebranded once or twice, but they are embedded in our desktops and our work lives. Since 2015, AWS has improved its global rank by number of customers from #6 to #2. And Atlassian, ranked #6 globally by number of customers, has built a pervasive platform for developers. Network effects amplify the staying power of these platforms, making it easier to adopt and integrate new pieces of technology to solve evolving problems.
Businesses at Work 11
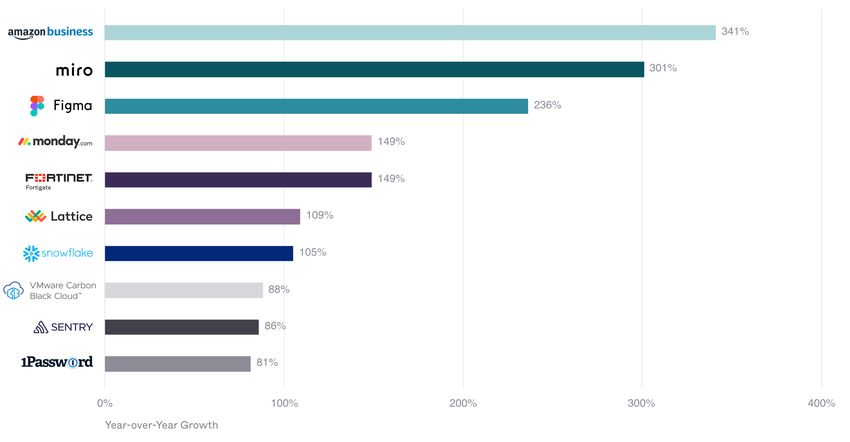
The fastest growing apps
Companies flock to tools that support remote work
This year has been an anomaly for so many reasons, and that’s Congratulations to Amazon Business, our fastest growing app
reflected in the record-setting turnover in our fastest growing and the first shopping-centric tool to ever join the ranks. This
apps and integrations. For the first time, 90% of our fastest spring, as workers around the world collectively discovered that
growing apps are brand new to the top 10. kitchen bar stools don’t make good office chairs, organizations
raced to launch tutorials on ergonomics and build online company
While we always expect frequent turnover — it’s tough to
stores selling stand-up desks and quality webcams. Amazon
maintain explosive rates of growth over multiple years — we see
Business offered an immediate solution to employees who were
a shift in the type of apps that customers are adopting. Last year
already comfortable with shopping on Amazon for personal
we noted that collaboration apps were being replaced by data- or
use. This delivered 341% growth for the Amazon Business app
security-focused tools. This year companies needed to enable
in the past year.
remote work, which meant supporting at-home workspaces
and virtual collaboration, as well as helping employees thrive Three hot collaboration tools share the spotlight with Amazon
as they work apart from one another. Business. Second-place Miro, an app offering whiteboard
functionality for teams, experienced 301% growth; measured
While collaboration tools have rejoined the fastest growing
by unique users, it grew 449% year over year. Third-place Figma
ranks, companies continue to invest in security tools as well: for
is an interface design and prototyping software that has also
the first time, security tools claim four out of the top ten spots.
been adopted by remote workers who need a virtual whiteboard
Fastest Growing AppsBusinesses at Work 12
or presentation tool. In 2019, Figma was named by Forbes people management platform that helps managers develop teams
as one of 25 companies to make the cut for its latest Next and keep employees engaged, from anywhere. It’s noteworthy
Billion-Dollar Startups list. Both Miro and Figma secured $50 that an app supporting employee culture is ranking as a fastest
million in funding in April, 2020, a Series B for Miro and Series growing app. The last time an HR-related tool appeared in this
D for Figma. And in fourth place, project management tool category? BambooHR in 2016.
monday.com gives remote workers a way to collaborate on
And finally we give a friendly “welcome back” to data warehousing
project management.
provider Snowflake, our #1 fastest growing app in 2019. It takes
The fastest growing security tools provide a full range of seventh place in 2020 with 105% year-over-year growth. Good
protection. Our fifth fastest growing app, Fortinet FortiGate, to see you here again!
provides next-generation firewalls. Our eighth fastest growing
Who’s missing? After being the top fastest growing app in 2016
app, VMware Carbon Black, offers cloud-native endpoint and
and maintaining a presence on the list for an unprecedented total
workload protection. In ninth place, Sentry provides application
of four years, Zoom fell off the top 10 list and was “only” our 15th
monitoring. And rounding out our top ten, 1Password helps
fastest growing app this year, with 64% year-over-year growth.
consumers manage their passwords.
(Yep, even with a pandemic it’s hard to sustain the hefty growth
With employees working remotely, HR departments are providing achieved by fastest growing apps!) But broken out by region,
additional support. Our sixth fastest growing app is Lattice, a Zoom still takes the fastest growing prize in EMEA.
Fastest Growing Apps, by RegionBusinesses at Work 13
Innovation’s heart is in San Francisco (and Silicon Valley)
The shift to remote work brings the opportunity to tap into talent The past year brought some hot IPOs, including Jamf, the
around the world — but headquarters aren’t necessarily packing parent company of our 2017 fastest growing app Jamf Pro,
their bags just yet. This year, four of our fastest growing apps are and Snowflake, the fastest growing app of 2019. The nine IPOs
headquartered in San Francisco: we give a home-town shout-out and one DPO, Asana, represent a wide range of tools, including
to Figma, Miro, Lattice, and Sentry. Fortinet and Snowflake are endpoint protection, project management, cloud computing and
nearby Silicon Valley neighbors. Seattle-based Amazon joins us on data analytics, developer tools, cloud-based payments, social
the West Coast, while VMware Carbon Black represents the East media, ecommerce, a business database, and even a medical
Coast from Waltham, Massachusetts. Toronto-based 1Password provider. While the markets may have given some of these tools
and Tel Aviv-based monday.com bring some international flavor. a turbulent ride, they generally had smooth sailing within the
OIN. Sprout Social saw the largest post-IPO growth at 50%.
We like to recognize big moments in our app leader’s journeys.
Bill.com grew its Okta customer base by 19%, Jamf Pro by 10%,
Going public is a milestone that warrants some festivities, but
and Snowflake by 3% since their IPOs. Asana’s DPO and Sumo
in the spirit of the era, we eschew a super-spreader celebration
Logic’s IPO in September were too recent to show measurable
in favor of a socially-distanced shout-out to these apps that
growth.
joined the public markets.
Top Apps from IPO/DPO Companies of the Past Year
Top Apps from IPO/DPO Companies of the Past Year
Jamf Pro
Asana
Snowflake
Sumo Logic
Bill.com
Rackspace
Sprout Social
ZoomInfo
Number of Customers
BigCommerce
One Medical
Apr 2016 Oct 2016 Apr 2017 Oct 2017 Apr 2018 Oct 2018 Apr 2019 Oct 2019 Apr 2020 Oct 2020
Note: Companies had an IPO or DPO between November 1, 2019, and October 31, 2020. Date of IPO or DPO marked by dot.Businesses at Work 14
Apps here, there, and everywhere
App deployment grows across companies and industries with Okta for less than a year adopt an average of 23 apps.
That number increases to 55 apps between one to two years,
The average number of apps deployed per customer has risen
and 101 apps between two to four years. This year we see that
steadily across all industries and company sizes, for a combined
customers who have been with Okta for four years or more deploy
growth of 22% over the past four years. This year, the average
an average of 207 apps, an increase of 9% over the previous
number of apps per customer remains at 88.
year. At the high end of the app deployment scale, 10% of our
We broke that out by customer size and found that our largest customers deploy 199 apps or more.
customers are adopting more apps than our smaller customers.
When we break out app deployment by industry, it makes sense
Our larger customers, with 2,000 or more employees, deploy an
to see technology companies at the high end of the spectrum.
average of 175 apps per customer, while our smaller customers,
These organizations live, breathe, and even build the tools
with 1,999 or fewer employees, deploy an average of 73 apps
they are using. In the past three years, their average number
per customer.
of apps has increased 57% from 99 to 155, with 17% growth in
New customers tend to initially deploy fewer apps through the past year.
the OIN, then add more over time. Customers who have been
Average Number of Apps per Customer, by Industry
Average Number of Apps per Customer, by Industry
Technology 99 122 133 155
Media & Communications 110 114 124 133
Education 107 119 122 126
Retail 76 96 112 120
Professional Services 65 67 85 116
58 67 94 105 2017
Insurance
2018
Finance & Banking 73 88 104
2019
Manufacturing 93 94 96 98
2020
Arts, Entertainment, & 85 87 92 96
Recreation
55 66 81 96
Healthcare &
Pharmaceuticals
Wholesale Trade 61 66 79 90
Construction, Engineering, 63 66 72 83
& Architecture
Government 32 44 54 77
Energy, Mining, Oil, & Gas 41 48 52 54
20 40 60 80 100 120 140 160
Number of Apps Note: Data includes Okta Integration Network (OIN) and non-OIN, personal and corporate apps.
Note: Not all industries are represented.Businesses at Work 15
Other sectors have seen significant growth in app adoption The education sector ranks high in app deployment, with more
as well. Over the past four years, the government sector has tempered growth. While their average app deployment trend line
had the largest increase in average app deployment at 140%, has increased over the past few years, they did see a dip down to
which includes a 43% jump in the past year alone — the largest an average of 119 apps per customer in 2019. However, in 2020
increase in any sector in the past year. Remote work has driven the education sector’s average number of apps rose 6% year over
governments to deploy a wide range of apps and tools that were year, possibly as they ramped up to provide remote learning.
previously a much lower priority, if not completely unnecessary.
Some of the other industries seeing large increases in average app
The U.S. Bureau of Labor Statistics monthly Current Population
adoption this year include professional services (36% increase),
Survey consistently found public-sector employees working
healthcare and pharmaceuticals (19% increase), and finance and
remotely at a higher-than-average rate: 57% of government
banking (18% increase). Retail average app deployment grew
employees worked remotely in May, which dropped steadily
7% in the past year, but 58% over the past four years.
to 34% in September, compared to the entire economy, where
35% worked remotely in May, dropping to 23% in September.Businesses at Work 16
Best of breed rules, incumbents drool
As employees settle into remote work, it’s critical they have the Like the strictly-controlled French designations of “champagne”
best tools to keep them connected and working productively. or “cognac,” “best of breed” is a distinction we don’t take lightly.
When it comes to interacting with co-workers, customers, Best-of-breed apps dominate their category for the stand-
partners, vendors, and others on a common platform, we see that alone functionality they provide. This year, best-of-breed tools
for many companies, a “good enough” solution isn’t actually good Salesforce, AWS, Box, Slack, and Zoom are joined by project
enough. We’re seeing that “one size fits all” is not fitting, at all. management tool Smartsheet and data visualization tool
Tableau, which compete against Microsoft Project and Power
Over the past few years, we have looked at whether companies
BI, respectively.
that invest in the Microsoft 365 suite — the most popular app
in our network — are finding it meets all their needs. We also Microsoft Teams comes standard with the Microsoft 365
wonder if deploying Microsoft 365 means customers commit Business Basic subscription, but during a global shift to video
to an exclusively Microsoft environment. The answer to both meetings, video classes, and video cocktail hours, companies
questions is decisively “no.” While the Microsoft 365 suite offers increasingly dialed in to Zoom. Over 42% of Okta’s Microsoft
basic personal productivity, communication, collaboration, and 365 customers now also deploy Zoom, a jump of more than
content management tools, Okta’s Microsoft 365 customers 10 percentage points over the previous year. (This number
continue to invest in many other best-of-breed apps. And when has increased nearly 35 percentage points in the past four
they need CRM software, project management tools, data years.) And when it comes to chatting, Slack is also part of the
visualization software, or cloud platforms, they look for best- conversation. The rate of increase has slowed, but this year
of-breed options as well. Over the past five years, the number nearly 32% of Okta’s Microsoft 365 customers also deploy
of Okta’s Microsoft 365 customers deploying at least one best- Slack. And, while they most certainly have access to OneDrive,
of-breed app has increased by seven percentage points. a standard feature in even the most basic Microsoft 365 bundle,
26% also deploy Box.
Okta’s Microsoft 365 Customers with Best-of-Breed Apps over TimeBusinesses at Work 17
In April, Goldman Sachs predicted that companies would slash
spending by 33% in 2020. By fall, JP Morgan found that global
corporate profits had “tanked” by 33%. While companies may
splurge on a few best-of-breed apps, we might expect they
would tighten their belts where they see clear redundancy.
However, 36% of Okta’s Microsoft 365 customers now also 36% of Okta’s Microsoft
deploy Google Workspace, the largest jump in the past three
years. Top collaboration tools have never been more important
365 customers now
for productivity. also deploy Google
The concept of a company choosing to lock in as a “Microsoft
shop” continues to fall out of favor, too. 44% of Okta’s Microsoft
Workspace, the largest
365 customers deploy Salesforce, 41% deploy AWS, 15% deploy jump in the past three
Smartsheet, and 14% deploy Tableau.
years.
This year, with eight apps featured, we see that 81% of
organizations are supplementing their Microsoft 365 suite
with one or more best-of-breed tools. Nearly 10% of customers
are deploying six or more. These numbers have grown steadily
year over year. Even in a difficult year — or perhaps specifically
because of it — customers are prioritizing functionality over
established software suites.
Okta Customers with Microsoft 365 and Best-of-Breed Apps
Okta Customers with Microsoft 365 and Best-of-Breed Apps
100%
20% 19%
22%
24%
26%
80%
Percentage of Okta’s Microsoft 365 Customers
19%
21%
22%
24%
26%
60%
Number of
best-of-breed apps
18%
18% 0
19% 1
18%
2
40% 19%
14% 3
13%
4
14%
15%
5
12% 6
14% 12%
20% 7
11%
10% 8
9%
9% 2% 3% 8%
7%
7% 6%
0.3% 0.9% 1% 5% 2% 3%
5% 5%
0.1% 0.2% 0.3% 0.9% 0.9%
0%
10/31/2016 10/31/2017 10/31/2018 10/31/2019 10/31/2020Businesses at Work 18
+
Developers at Work: The most popular
tools for building digital experiences
If the first phase of COVID-related technology adoption was
to support remote work, the second was to accelerate digital
transformation projects and initiatives. Whether consumers
are connecting with loved ones, depositing checks, tracking
workouts, ordering groceries, or shopping, almost every
interaction between consumers and brands is now happening
online. This has driven organizations to invest in building
delightful digital experiences that are frictionless, personalized,
and seamless.
In addition to our workforce identity products, Okta also offers
customer identity and access management (CIAM) solutions to
help organizations build and scale seamless digital experiences
for their customers. This is a growing area of focus for Okta. In
this section, we dig into various aspects of how CIAM powers
modern customer experiences.
This year we are proud to collaborate with Segment, the market-
leading customer data platform (CDP) recently acquired by Twilio,
to provide a more in-depth look at the customer journey. Over
20,000 companies use Segment to collect and unify customer
data from dozens of different customer touchpoints, and send
that data downstream to over 300+ SaaS tools.Businesses at Work 19
Okta and Segment look at two sides of the CIAM coin
On one hand, our tumultuous year is expected to force companies
to tighten their belts and reduce costs. Gartner predicts that,
while application consulting, implementation, and management
services are a $426 billion market, “the long-term CAGR of
5% will be interrupted in 2020 by a dip of -9% caused by the
Okta data shows us
COVID-19 pandemic and ensuing recession.”1 On the other that companies are
hand, Gartner predicts that “through 2024, organizations will
bring forward digital business transformation plans by at least building customer-
five years to survive and get ahead in a post-COVID-19 world
focused on agility and digital touchpoints.”2 We see evidence of
facing apps at roughly
this in the increased investment our customers are making as the same pace,
they build out CIAM apps.
regardless of
company size.
First we wondered, is there a relationship between company
size and the number of apps they’re building? Okta data shows
us that companies are building customer-facing apps at roughly
the same pace, regardless of company size.
Okta’s CIAM customers have built a median of four apps that
are customer facing; when broken out by customer size, this
becomes a median of six apps for our largest customers, and four [1] Gartner “Forecast Analysis: Application Services, Worldwide” by
for our smaller customers. This implies that regardless of size, Colleen Graham, Susan Tan, Neil Barton, Jaideep Thyagarajan,
companies place equal importance on ensuring their customers Susanne Matson, September 8, 2020.
have seamless experiences. If digital transformation has truly
[2] Gartner “Forecast Analysis: Application Services, Worldwide” by
accelerated during this time period, we can expect the median Colleen Graham, Susan Tan, Neil Barton, Jaideep Thyagarajan,
number of apps to rise across all segments in the coming months. Susanne Matson, September 8, 2020.Businesses at Work 20
Next, we dug into the data to understand the technology choices
and ecosystem that powers these customer experiences. While
Okta looks at how organizations build apps for their customers
(i.e., what programming languages and environments are used),
Segment helps us to understand where customer data is coming
from and traveling to as part of the customer experience. Let’s Over 63% of customers
dive in.
using an SDK tool are
Okta’s most popular SDK tools represent the tech stack developers
are using to build applications. These tools are reflective of the now using JavaScript,
broad set of environments and deeper integrations that Okta
supports, and this year JavaScript moved to the top spot. Over
a significant jump from
63% of customers using an SDK tool are now using JavaScript, a 24% last year.
significant jump from 24% last year. Over the past year we saw
the usage of Java, the enterprise king, slip from 27% to 23% in
regards to SDK usage, mirroring an industry-wide trend shifting
more development work to the front-end. Use of Go increased
from 11% last year to nearly 24% this year. And as expected,
many organizations are using Windows and developing on C#.
Okta Customers Using SDK Tools
Okta Customers Using SDK Tools
63%
24%
23%
21%
10%
9%
8%
8%
5%
4%
0% 10% 20% 30% 40% 50% 60% 70%
Percentage of Customers Note: Data limited to customers with at least one SDK event between November 1, 2019, and October 31, 2020.Businesses at Work 21
If we turn our attention to the most popular sources of data
being fed into Segment’s CDP, we can get an inside look at
where businesses are collecting and gathering data to drive
customer engagement.
iOS ranks as the second This year, in addition to Okta ranking JavaScript as the most
popular SDK tool, Segment sees JavaScript as the most popular
most popular data data source. This shouldn’t come as a surprise, given that
source and Android JavaScript tags have become the ubiquitous method for data
collection. iOS comes in at #2, and Android is close behind at
is close behind at #3. #3. Both of these data sources are used to collect in-app user
behavior data. Such high rankings are a reflection of customer
Such high rankings are behavior as the world becomes increasingly mobile-centric,
a reflection of customer with 81% of the adult U.S. population owning a smartphone.
behavior as the world
Finally, it’s worth highlighting that server-side data sources
had a strong showing this year as well. Node.js, Python, and
becomes increasingly Ruby were among the top ten data sources, revealing that
CDPs are used not just to help marketing and product teams
mobile-centric. collect behavioral data client-side, but also for technical work
by development and engineering teams.
Most Popular CDP Sources among Segment Customers
Most Popular CDP Sources among Segment Customers
85%
24%
19%
17%
HTTP API 16%
14%
13%
11%
11%
10%
0% 10% 20% 30% 40% 50% 60% 70% 80% 90%
Percentage of CustomersBusinesses at Work 22
Developers expand their toolboxes to build the best user experiences
Developers are expected to move quickly, and efficiently. And pulled sharply ahead of Application Performance Monitoring
they need a deep toolbox to build the hottest apps. (APM) tool New Relic this year to claim fourth place. We also
see APM tool Splunk — last year’s fourth fastest growing app,
This year we welcome two new developer tools, Sentry and
with 102% year-over-year growth — pull ahead of Atlassian’s
Atlassian Opsgenie, to our top-ranking developer tools. If you’ve
incident communication tool Statuspage to take sixth place.
been paying attention, it should be no surprise that they joined
And deployment of the open source automation server Jenkins
us here: Sentry is our ninth fastest growing app for 2020, with
has grown 51% over the past year.
86% year-over-year growth, and in 2019 Opsgenie was our
second fastest growing app, with 194% year-over-year growth. Turning to Segment’s data, we see that company size affects the
number of apps receiving customer data across the organization.
Our top three developer tools have held their previous spots.
While the rise in data destinations can be seen across customers
The Atlassian Product Suite, whose rank as a developer tool
large and small, the average number of destinations used by
includes customer deployments of Jira, Bitbucket, and Fisheye,
larger customers stands at 14, while SMBs use a more modest
continues to stand firmly in first place. Deployment of these
nine. Given tech stack growth and adoptions of large companies
tools in the Atlassian Product Suite has grown over 283% over
versus small ones, this is a trend that appears to be growing
the past four years. GitHub and PagerDuty have held tight in
year over year.
second and third place, respectively.
However, there is significant movement below the top three.
Upstart Datadog, a monitoring, security and analytics platform,
Most Popular Developer Tools among Okta Customers
Most Popular Developer Tools among Okta Customers
Atlassian Product Suite
GitHub
PagerDuty
Datadog
New Relic
Splunk
Atlassian Statuspage
Jenkins
Sentry
Number of Customers
Atlassian Opsgenie
Apr 2016 Oct 2016 Apr 2017 Oct 2017 Apr 2018 Oct 2018 Apr 2019 Oct 2019 Apr 2020 Oct 2020Businesses at Work 23
Overall, Segment sees that the average number of apps 25%, indicating that many companies are continuing to lean in
businesses are connecting to their CDP has risen to 11, up to digital engagement and transformation efforts, despite the
from eight last year. As businesses further embrace digital uncertain economic circumstances.
operations on the back of COVID-19, their tech stacks are
becoming populated with more and more software. Average Number of Destinations to Which Segment
Customer Data is Being Sent
Diving deeper into the types of apps being adopted on Segment’s
Average destination count 11
customer data platform, we can get an in-depth view of how
the SaaS market is evolving.
Analytics apps remain the #1 category on the Segment platform.
As 2020 drives more customers into digital experiences, it’s
25th percentile count 5
having a second order effect on marketing technology adoption,
driving more and more businesses into analytics apps. Median destination count 5
Meanwhile, digital advertising tools rose to #2 this year, up
from #3 in the same period last year, reinforcing the hypothesis 75th percentile count 15
reported in Segment’s COVID Tech Stacks Report — businesses
are going all in on advertising tools to match consumer behavior.3 Note: Data from November 1, 2019 to October 31, 2020.
Finally, there is growing adoption of what can be broadly
categorized as customer engagement tools. Based on Segment’s
data, customer success, email marketing, and heatmaps/ [3] Segment, “How COVID-19 is Impacting Tech Stacks [According
recording tools all saw increased adoption in the region of 18- to Our Data],” June 10, 2020.
Most Popular Customer Data Destinations among Segment Customers
Most Popular Customer Data Destinations among Segment Customers
Analytics
Advertising
Heatmaps & Recordings
Email Marketing
Customer Success
A/B Testing
Number of Customers
Jan 2020 Apr 2020 Jul 2020 Oct 2020Businesses at Work 24
With security attacks on the rise, CIAM customers turn to easily deployable factors
Forrester reports that after software vulnerabilities and web has grown nine percentage points in the past two years. Looking
applications, the use of stolen logins and encryption keys known at the total volume of MFA authentications, SMS is by far the
as credential stuffing is the top attack vector for applications most popular choice, with eight times more authentications
in 2020, accounting for 27% of external attacks.4 Many of our than second-place Okta Verify. We see a 226% increase in the
CIAM customers add additional security protections for their use of SMS year over year.
end users via Multi-Factor Authentication (MFA).
The second most popular factor for our CIAM customers is Okta
Okta’s CIAM customers have different use cases, which affect Verify (including Okta Verify with Push Notifications), whose
their choice in factors. For B2C relationships, companies typically usage has increased by 15 percentage points over the past two
choose more familiar factors, such as email and SMS, which are years. The total volume of MFA authentications with Okta Verify
inherently weaker factors. On the other hand, B2B relationships (including Okta Verify with Push notifications) has grown by
warrant a higher level of security. 266% year over year. This stronger factor is more popular with
B2B customers.
We see that SMS continues to be the most popular choice
because it is one of the easiest and most familiar factors to
deploy for B2C end users. Across CIAM customers, use of SMS [4] Forrester, “The State of Application Security, 2020,” May 4, 2020.
Okta’s CIAM Customers Deploying Each Factor
Okta’s CIAM Customers Deploying Each Factor
70%
SMS
65% Okta Verify (Includes Push)
Email
60%
Google Authenticator
Voice
Security Question
50%
WebAuthn (FIDO 2.0)
Percentage of Customers
40%
36%
32%
30%
26%
23%
20%
12%
10%
2%
0%
Oct 2018 Apr 2019 Oct 2019 Apr 2020 Oct 2020
Note: Each data point includes MFA authentications within the last 30 days.Businesses at Work 25 We notice an overall increase in the percentage of customers deploying email as an MFA factor. Use of this weaker factor has risen six percentage points from 26% to 32% in the past two years. The most recent rise (eight points between the start of July and the end of November) suggests companies may be deploying email MFA as a way to go passwordless for a better customer experience. Or, companies might be adding email MFA on top of usernames and passwords to add low-friction security. For example, Google Nest is now requiring customers who have not enrolled in two factor authentication to verify their identity via email. Turning to look at the volume of authentications, we do see a dip in authentications via email in May and June, followed by four months of rapid growth. This dip roughly parallels the May/June dip we have observed in detected threats, followed by an overall increase during this same time period. Use of another weaker factor, security questions, has dropped nine percentage points over the past two years, but isn’t dead yet due to its ease of deployment. Looking at the total volume of authentications, we see peak use in August 2019, which has dropped by 82% since then. We hope the trend away from security question usage continues into the future.
Businesses at Work                                                                                                                  26

Remote Work: winners and consumer's choice awards
The most popular apps by category                                    Taking care of business: apps deployed company-wide

The user experience is critical for workforce apps as well. All      As COVID-19 spread rapidly in the spring of 2020 and an
the most popular tools across our categories delivered amazing       unprecedented half of the world’s population, nearly four
digital experiences during the pandemic, and that's why they're      billion people, went into lockdown, companies quickly deployed
winning.                                                             new tools to enable employees to work remotely. Collaboration
                                                                     tools come in every size, color, and flavor, but sometimes having
When we delve into our data, we sort categories in two ways.
                                                                     too many options can be overwhelming. What do our customers
For some workforce-focused categories, such as collaboration
                                                                     choose for specific collaboration needs? These tools easily walk
apps, developer tools, HR platforms, and video conferencing
                                                                     away with top honors for their specific functionality. This year
apps, we look specifically at tools that have been deployed at a
                                                                     gave rise to the latest tech stack everyone needs to support a
company-wide level for corporate use.
                                                                     new way of working.
Increasingly, however, our work lives and our personal lives
intersect. For certain categories, such as travel, health and
wellness, and philanthropic efforts, we expand our lens to include
apps that employees adopt personally through Okta, in addition
to those assigned by their IT teams.

  Remote work stack

Remote Work Stack

 Project Management                                                  Messaging

 File Sharing                                                        Wireframing

 Video Conferencing                                                  Whiteboarding

 Electronic Signatures                                               Note Taking

 Surveying                                                           Employee Engagement
Businesses at Work 27
Highlights of our remote work stack:
• Deployment of project management app Smartsheet has grown
170% over the past three years. It boasts around 1.5 times as
many Okta customers as its nearest competitor, Asana.
• Box is the top file sharing app, with 59% more Okta customers Slack ranks clearly
than its nearest competitor, Dropbox.
as the top messaging
• DocuSign is far and away the most popular option for
electronic signatures. Deployment has grown 208% in the
tool, with nearly 190%
past three years, and nearly 49% in the past year alone as growth in the past
three years. Slack has
digital signatures became critical to completing all kinds of
transactions. DocuSign has more than seven times as many
Okta customers as second-place Adobe Document Cloud.
more than ten times as
• Top surveying tool SurveyMonkey has seen nearly 13% growth
since February 2020, as companies rushed to understand what
many Okta customers
their employees needed to work remotely. SurveyMonkey has as the second most
popular messaging app,
more than three times as many Okta customers as second-
place Typeform.
• Slack ranks clearly as the top messaging tool, with nearly Workplace by Facebook.
190% growth in the past three years. Slack has more than ten
times as many Okta customers as the second most popular
messaging app, Workplace by Facebook.
• Lucidchart is by far the most popular app for diagramming and
wireframing. It has enjoyed 239% growth over the past three
years, and has ranked as one of our top apps by unique users
for the past two years. Lucidchart has nearly three times as
many Okta customers as competitor InVision, and four times
as many as our third fastest growing app, Figma.
• The most popular note taking app, Evernote, has seen a
rise and fall in popularity, and now has the same number of
Okta customers it did three years ago. We’ll keep our eye on
competitor Notion, which is rising rapidly through the ranks.Businesses at Work 28
Within days of pandemic lockdowns around the world, use
of video conferencing apps skyrocketed, as detailed in our
spring supplemental report, Businesses at Work (from Home).
Looking at the number of customers, we see a strong inflection
point between February and March for both Zoom and Cisco
Webex. Deployment of Zoom grew over 45% between March 2020 will be
and October, while Webex grew 15% and RingCentral grew
18% during this same period. But 2020 will be remembered as
remembered as the
the “year Zoom became a household name.” For the first time,
the app became part of many people’s daily lives. Days of Zoom
“year Zoom became a
meetings and Zoom classes were capped by evenings of Zoom household name.” For
cocktail hours and Zoom dinners, until “video conferencing
fatigue” became a thing. the first time, the app
It’s interesting to contrast the number of customers versus the became part of many
number of active unique users of competitive apps. While Zoom
had more customers than Webex as of February 2018, Zoom
people’s daily lives.
had less active unique users than Webex until March 2020, at
which point Zoom’s unique user growth rapidly passed Webex
and remained higher.
Most Popular Video Conferencing Apps
Most Popular Video Conferencing Apps
Zoom
Cisco Webex
RingCentral
GoToMeeting
8x8
BlueJeans
Skype
Fuze
UberConference
Number of Customers
join.me
Apr 2016 Oct 2016 Apr 2017 Oct 2017 Apr 2018 Oct 2018 Apr 2019 Oct 2019 Apr 2020 Oct 2020
Note: Google Meet and Microsoft Teams are not included.Businesses at Work 29
While this year gave remote work a dramatic boost, we think the
future of work is dynamic. This translates to a global workforce,
in widely distributed locations, working wherever, whenever, and
however they want. Gartner predicts "48% of employees at large
enterprises will work remotely at least some of the time after
the pandemic, a significant increase over the 30% of employees Gartner predicts that
who worked remotely at least some of the time prior to the
pandemic.”5 Now more than ever, HR departments need a robust
48% of employees at
set of tools to keep managers and teams connected, support
distributed workers, and ensure every employee feels valued.
large enterprises will
While HR tools have grown again across the board, employee
work remotely at least
engagement tools have made especially large gains. With 75% occasionally after the
growth in the past year, Culture Amp jumped two spots to pass
SAP SuccessFactors and claim fourth place. Lattice, our sixth pandemic.
fastest growing app overall with 109% year-over-year growth,
joined the top HR tools for the first time and rose quickly to
seventh place.
Large, end-to-end human resources tools continue to attract
new customers. Reigning top app Workday has held a solid lead
among HR tools with 23% year-over-year growth. Second-place [5] Gartner, “9 Predictions for the Post-COVID Future of Work,” May
BambooHR has seen more substantial growth, at 38%. 14, 2020.
Most Popular
Most Popular HR AppsHR Tools
Workday
BambooHR
UltiPro
Culture Amp
SAP
SuccessFactors
Paylocity
Lattice
Namely
Number of Customers
Reflektive
15Five
Apr 2016 Oct 2016 Apr 2017 Oct 2017 Apr 2018 Oct 2018 Apr 2019 Oct 2019 Apr 2020 Oct 2020Businesses at Work 30
There's been a rapid rise in the need to accommodate a end of February. Netskope, which provides contextual security
distributed workforce, and we're seeing businesses tackle it and mitigates cloud-enabled threats as part of a modern secure
in a few ways — secure remote access solutions, like Palo Alto access service edge (SASE) architecture, has grown 74% in the
Networks GlobalProtect, VPNs like the many listed here, as past year. AWS Client VPN, which allows companies to easily
well as standalone zero trust network access (ZTNA) solutions deploy a scalable client VPN solution, burst onto our radar in
like Zscaler. As organizations move past the initial “firefighting” May and has quickly passed many tools to take seventh place.
and get into long-term strategy, we’ll be watching to see which And open source option OpenVPN has seen 43% growth in the
wins out next year. past year.
Palo Alto Networks GlobalProtect provides enterprise security Some remote workforces are best served with virtual desktop
protection to mobile users. It has seen consistently strong infrastructure, known as VDI. Desktop environments are hosted
adoption, growing a remarkable 1983% over the past three years. on a central server and desktop images are delivered to end
Since the pandemic began and companies needed to support clients over a network. We also saw a noticeable jump in VDI
remote workforces, GlobalProtect, which provides encrypted tools as workers became remote. Between February 29 and
tunnel access to Palo Alto Networks next-generation firewalls April 30, 2020, our most popular VDI provider, Citrix, saw 11%
and Prisma Access products, has been one of our fastest growing growth. Also during this time, Amazon WorkSpaces grew 33%,
secure remote access applications with 50% growth since the and VMware Horizon View grew 13%.
end of February.
Cisco AnyConnect, which provides secure endpoint access, has
grown 1130% in the past three years, and 46% just since the
Most Popular Network-Centric Security Tools
Most Popular Network-Centric Security Tools
Palo Alto Networks
GlobalProtect
Cisco Umbrella
Cisco AnyConnect
Zscaler
Fortinet FortiGate
Netskope
AWS Client VPN
Number of Customers
OpenVPN
Amazon AppStream
Barracuda Networks
Apr 2016 Oct 2016 Apr 2017 Oct 2017 Apr 2018 Oct 2018 Apr 2019 Oct 2019 Apr 2020 Oct 2020You can also read