30 Year Infrastructure Strategy - Gore District Council
←
→
Page content transcription
If your browser does not render page correctly, please read the page content below
Gore District Council
                  30 Year Infrastructure Strategy
                                            2018 - 2048
NOTE: All Charts are produced from the “Infrastructure Strategy Financial Template”
spreadsheet, provided with this document

                  This template has been provided exclusively for the use of Gore District Council
Quality Record Sheet

                                     Gore District Council
                             30 Year Infrastructure Strategy
                                             2018 - 2048
Issue Information
Issue Purpose                          Final Draft
Issue Date                             12 January 2018
Version Number                         V3
Authorisation
Gore District Council                  Ramesh Sharma
Prepared By                            Sarah Crooks, Fieldwork Ltd using WAUGH Template
Reviewed By                            Ramesh Sharma, Matthew Bayliss & Peter Standring
Date
Reference No.                          Add TRIM Record No.

                Waugh Infrastructure Management Ltd Level 2 18 Woollcombe St PO Box 827 Timaru
                                      Phone 03 686 6994 Fax 03 688 9138
                                             E-mail info@waugh.nz
                                        www.waughinfrastructure.co.nz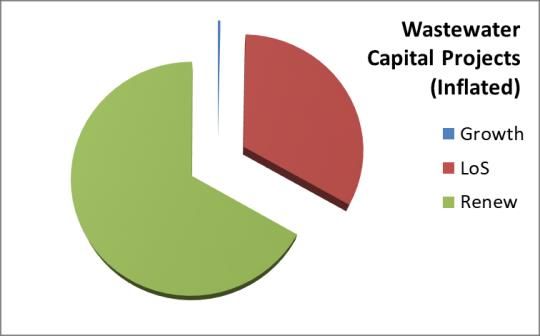
Gore District Council                                     30 Year Infrastructure Strategy 2018-48

TABLE OF CONTENTS                                                                  7.3         Stormwater                                                                                           48
                                                                                   7.4         Transportation                                                                                       52
1.0    EXECUTIVE SUMMARY                                               7           7.5         Summary of Significant Infrastructure Issues                                                         53
2.0    INTRODUCTION                                                    8           8.0         FINANCIAL ESTIMATES                                                                                  54
2.1    Strategy Layout                                                 8           8.1    Water                                                                                             55
2.2    Purpose                                                         9           8.2    Wastewater                                                                                        56
2.3    Gore District Core Infrastructure Assets                       10           8.3    Stormwater                                                                                        57
3.0    GORE DISTRICT                                                  11           8.4    Transportation                                                                                    58
                                                                                   8.5    Total Expenditure                                                                                 59
3.1    Linkage with Other Documents                                   12           8.6    Financial Impacts of the Infrastructure StrategyError!                                      Bookmark
3.2    Gore District Council 2018-2048                                15           not defined.
4.0    CORE INFRASTRUCTURE                                            18           9.0         APPENDIX A                                                                                           60
4.1    Asset Description                                              18
4.2    Assumptions and Risk                                           22
                                                                                   TABLE OF TABLES
5.0    EMERGING ISSUES                                                25
                                                                                   Table 2.1: Strategy Layout ......................................................................... 8
5.1    Demographic Changes                                            25
5.2    New Technologies                                               28           Table 2.2: Gore District Infrastructure Assets ........................................... 10
5.3    Changing Government Priorities and Legislative Environment     29
                                                                                   Table 6.1: Key Data Improvements ......................................................... 38
5.4    Climate Change                                                 30
5.5    Infrastructure Resilience                                      31
5.6    Aging infrastructure                                           31
                                                                                   TABLE OF FIGURES
6.0    THIRTY YEAR STRATEGY                                           33
                                                                                   Figure 1: Location of the Gore District ...................................................... 11
6.1    The Organisations’ Priorities                                  33
6.2    Asset and Service Management Strategy                          33           Figure 2: Linkage between Strategy and other Organisational Documents
6.3    Cost Effective Delivery of Services                            34           .................................................................................................................. 12
6.4    Addressing Resilience                                          36           Figure 3: Degree of Significance ............................................................... 13
6.5    Evidence Base                                                  38
6.6    Significant Decisions Required                                 39           Figure 4: Map of the Gore District ............................................................. 16

7.0    SIGNIFICANT INFRASTRUCTURE ISSUES                              41           Figure 5 Integrated Risk Management Framework................................... 22

7.1    Water                                                          41           Figure 6 Population Growth (Source: Infometrics) .................................... 25
7.2    Wastewater                                                     45

                               January 2018                                Final Draft                                                Page 5 of 81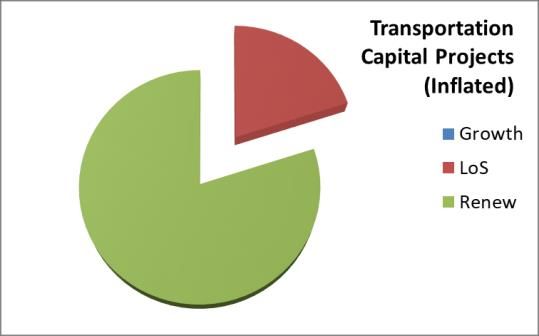
Gore District Council 30 Year Infrastructure Strategy 2018-48
Figure 7 Average Annual GDP Growth (Source: Infometrics) .................. 26
Figure 8 Share of total GDP (Source: Infometrics) ................................... 26
Figure 9 Employment Growth (Source: Infometrics) ................................. 27
Figure 10 Organisational priorities for our D ............................................. 33
Figure 11 Summary of Significant Issues Estimates ................................ 53
Figure 8.1: Projected Capital Expenditure - Water .................................. 55
Figure 8.2: Projected Capital Expenditure - Wastewater ......................... 56
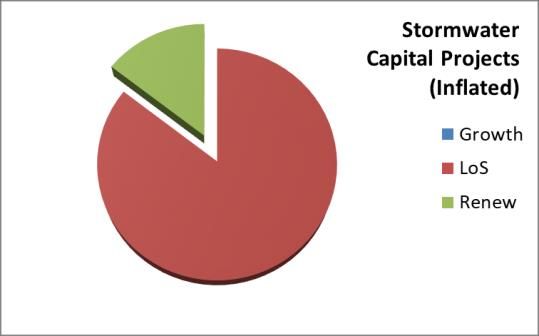
Figure 8.3: Projected Capital Expenditure – Stormwater ......................... 57
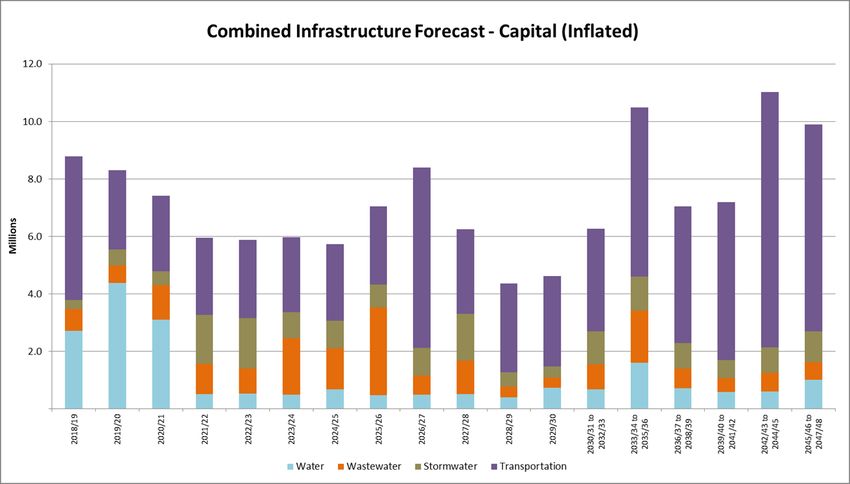
Figure 8.4: Projected Capital Expenditure – Transportation .................... 58
Figure 8.5: Projected Capital Expenditure- Infrastructure Assets ............ 59
Page 6 of 81 Final Draft January 2018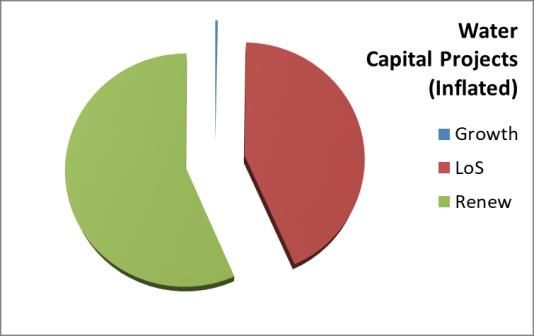
Gore District Council                                            30 Year Infrastructure Strategy 2018-48

1.0       EXECUTIVE SUMMARY
We have developed this strategy for the 2018-28 Long Term Plan. This document aims to set the scene for the provision of infrastructure in our District over
the next 30 years. In this document we discuss our vision for our District over this planning period. We want our residents to have the best quality of life possible
and continue to be an attractive locality for families, visitors and businesses to establish. We have determined our organisations long term priorities and
considered our asset management strategies against these to determine that we are on the right track. Organisational priorities and strategies must align to
allow our District to continue to prosper effectively.
As we have assembled this document, we have discussed the challenges that we face in the long term whilst continuing to provide services. We have considered
our core infrastructure assets of the 3 Waters and Transportation networks and developed assumptions for long term planning within this strategy.
This infrastructure strategy has been compiled alongside a financial strategy. Together these documents provide a strong foundation for our long term planning
and show the community that we are a responsible organisation.
We have considered the trends of emerging issues and how we are already addressing these and we also explain what plans we are making to manage their
effect. Addressing resilience in our infrastructure management and planning is critical for community wellbeing in adverse events. W e participate in many
regional activities including civil defence and lifelines so that we are prepared. We will be affected by the new environmental regulations as part of the proposed
Land and Water Plan and have planned accordingly.
We have several infrastructure challenges associated with 3 Waters and Transportation over the next 30 years. Where a significant decision needs to be made,
we have outlined these issues and the proposed options, identifying our current preferred option and estimates of cost. A full compilation of capital projects is
also included to provide an overview of the significant capital programmes our core infrastructure activities are undertaking. Financial estimates have been
included within this strategy to indicate impacts of our long term capital programme and operational costs.
We have aimed to provide a comprehensive yet informative infrastructure strategy that meets the requirements of legislation and identifies that we are managing
our assets appropriately.

                                 January 2018                                     Final Draft                           Page 7 of 81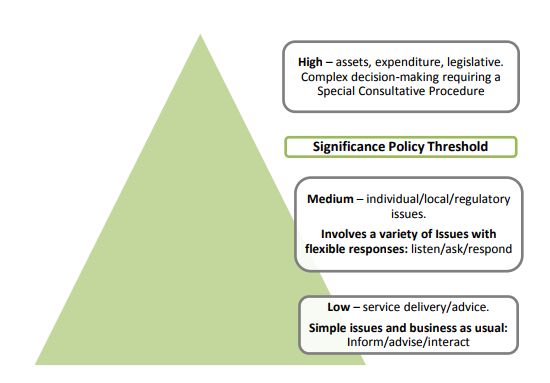
Gore District Council                                            30 Year Infrastructure Strategy 2018-48

2.0       INTRODUCTION
This is our second Infrastructure Strategy. It has been prepared from our 2018 suite of Activity Management Plans and contributes to the Long Term Plan, of
which it forms part.
The issues discussed reflect the current legislative environment and our communities’ priorities across the district.
The financial forecasts are estimates and the reliability of the forecasts decreases beyond ten years and towards the thirty year planning horizon.
2.1       Strategy Layout
The Strategy document sections and corresponding LGA Act sections are tabled below:
Table 2.1: Strategy Layout

                                                                                                                                  LGA 2002
 Strategy Section
                                                                                                                                  (Section 101B)

 1      Executive Summary

 2      Identifies the purpose of the Infrastructure Strategy and the core infrastructure included in this strategy               2(a) and 6

 3      Describe the district/city and illustrate the linkage between strategic documents                                         2(a)

        Describe the core infrastructure, its condition and performance while recording the significant assumptions, risks and
 4                                                                                                                                2, 3(e), 4 (c) & (d)
        mitigation

 5      Discuss the emerging issues that will impact on the core infrastructure assets                                            3 (b) to 3(e)

        Discuss Council’s response to the emerging issues and the significant decisions to be made during the term of this
 6                                                                                                                                2(b), 4(b)
        strategy

 7      Identifies the response options for the significant issues and documents the benefits, cost, when and funding source      2(b); 3(a) to (e) & 4(a) to (c)

 8      Identifies the costs associated with the actions proposed                                                                 4(a)

                                 Page 8 of 81                                     Final Draft                           January 2018
GORE DISTRICT COUNCIL 30 Year Infrastructure Strategy
2.2 Purpose
Section 101B – Infrastructure Strategy states:
(1) A local authority must, as part of its long-term plan, prepare and adopt an infrastructure strategy for a period of at least 30 consecutive financial years.
The stated purpose of the Infrastructure Strategy is to;
a) Identify significant infrastructure issues for the local authority over the period covered by the strategy; and
b) Identify the principal options for managing those issues and the implications of those options.
Section (6) defines infrastructure assets as including:
a) existing or proposed assets to be used to provide services by or on behalf of the local authority in relation to the following groups of activities:
i. water supply:
ii. Wastewater and the treatment and disposal of sewage:
iii. stormwater drainage:
iv. flood protection and control works:
v. the provision of roads and footpaths; and
b) any other assets that the local authority, in its discretion, wishes to include in the strategy.
Page 9 of 81 Draft V2 December 2017Gore District Council 30 Year Infrastructure Strategy 2018-48
2.3 Gore District Core Infrastructure Assets
The core Gore District Infrastructure Assets are tabled with 2016 replacement values below:
Table 2.2: Gore District Infrastructure Assets
Asset Description Replacement Value % of total
Water Water extraction, treatment and distribution $35.1M 7.5%
Wastewater Wastewater collection, treatment and discharge $40.9M 8.7%
Stormwater Stormwater collection and discharge $23.8M 5.1%
Roads (arterial, collectors, local; curbs and gutters), bridges,
Roads and footpaths $369.3M 78.7%
footpaths
TOTAL $469.1M 100%
2.3.1 Other Activities
In time the Parks and Recreation assets and Community Buildings may be added to the above list of core infrastructure as our long term planning for those
activities are further developed.
However, at this time key significant long term issues that the Council wishes to focus on in this strategy are associated with transportation and three waters
activities.
Page 10 of 81 Final Draft January 2018Gore District Council 30 Year Infrastructure Strategy 2018-48
3.0 GORE DISTRICT
Our council is a local authority situated in the South Island of
New Zealand. The Gore District was formed in 1989, as a result
of amalgamation driven by central government.
Our district is located within the Southland region. The District
covers 1,251 km². Our neighbouring councils are Southland
District and Clutha District. The main township of Gore is 50
minutes from Invercargill and 1.5 hours from Queenstown.
The Mataura River runs through the district with both the
townships of Gore and Mataura situated on its banks. The river
is a focus for the district and provides many recreational
opportunities.
The district has a strong agricultural-led economy with
complementary industries established. Our population was
12,033 in the 2013 Census.
We have 3816 rating units in Gore, 800 rating units in Mataura
and 1348 rural rating units. Gore is the largest urban area with
a population of 7350. Mataura has a population of 1509.
Our council is in many ways a typical example of the majority
of its namesakes as a provider of “core” activities. Core
activities are considered to be delivery of roads, water (urban
and rural), wastewater (Wastewater), and stormwater services.
Figure 1: Location of the Gore District
January 2018 Final Draft Page 11 of 81Gore District Council 30 Year Infrastructure Strategy 2018-48
3.1 Linkage with Other Documents
This strategy is a key component of infrastructure management. A number of other strategic,
tactical and operational plans relate to and support the delivery of our infrastructure and are
linked with this strategy. These are highlighted in the following figure. Infrastructure Strategy-
Linkages with other Documents
GORE DISTRICT COUNCIL
(Stakeholders and Organisational Context)
Organisational Plans and
objectives
GDC
Asset Management Policy
GDC Infrastructure Strategy
(30 yrs)
GDC
Asset Management Plan
(10 yrs) Plans for developing Asset
Management System &
relevant support
Implementation of AM Plans Asset Management System
(Lifecycle activities) and relevant support items
Asset Portfolio
Monitoring, Review,
Evaluation and Improvement
Adapted from ISO55000:2014, Figure B1
Figure 2: Linkage between Strategy and other Organisational Documents
January 2018 Final Draft Page 12 of 81Gore District Council 30 Year Infrastructure Strategy 2018-48
3.1.1 Significance and Engagement Policy
The Policy was adopted in 2014 and shows how we will assess importance during a decision-making process, such as its level of significance. The level of
significance is a guide to the degree of community engagement that may be required to gain an understanding of community views and preferences on an
issue.
We want to ensure we have a clear and consistent approach to how we engage with residents, ratepayers and stakeholders. We want to provide accurate
information in a timely manner so they can make informed comment during the decision making process.
The Policy identifies the following Strategic assets:
Water Supply
Community Services
Transportation
Land Drainage
Wastewater
The Significance and Engagement Policy provides a procedure
to determine significance and a community engagement guide.
The decision on a matter’s significance rests with the Council. We
will evaluate significance on a case-by-case basis. We take into
account the impact on or consequences for the District, affected
parties, our community outcomes (Long Term Plan), benefits and
costs, and the view of local iwi. Decisions of low significance,
including some decisions made under delegated authority, may
not explicitly state the degree of significance.
Engagement occurs at all levels of our interaction with the
community, from the provision of services and information
through to special consultation and significant decisions.
What matters is the needs and expectations of the community
are continually delivered in a cost-effective manner, and the level
of engagement is appropriate to the issue in question.
Community services assets are not included within this
infrastructure strategy. In time those strategic assets may be
added as Council’s plans for those activities are developed. At
Figure 3: Degree of Significance
January 2018 Final Draft Page 13 of 81Gore District Council 30 Year Infrastructure Strategy 2018-48
this time key significant long term issues that the Council wishes to focus on in this strategy are associated with transportation and three waters activities.
3.1.2 Financial Strategy
The Infrastructure Strategy and Financial Strategy form the pillars that support the LTP Consultation
document. 2018-2028 CONSULTATION DOCUMENT
Our Financial Strategy sets out how we intend to fund our capital and operational expenditure long term.
The strategy ensures that rates and debt levels are sustainable over the long term.
While initial financial forecasts from AMPs are a key input, the 10-Year Plan needs to balance the
forecasted spending needs with the affordability of our Financial Strategy. This affordability is determined
Infrastructure Strategy
by Council imposed limits on rates and debt levels. It’s usual that not all of the forecasted expenditure
Financial Strategy
requirements for assets can be afforded within funding availability. In these cases, the budgeting process
prioritises expenditure on existing assets rather than creating new ones.
COUNCIL VISION
Page 14 of 81 Final Draft January 2018GORE DISTRICT COUNCIL 30 Year Infrastructure Strategy
3.2 Gore District Council 2018-2048
3.2.1 Where we want to be Open for business
& welcome We
encourage
We have aspirations and goals as a Council to continue economic
tourism
to develop our communities and district to become an development opportunities
even better place to live and work.
We believe by 2048 we can provide our residents with We
the Best Quality of Life in New Zealand. encourage
growth and
We want to encourage more tourism ventures and
attract more visitors. A tourism strategy is to be We improve
By 2048 Our development
developed in the near future. We know we have an
aging population and these residents wish to remain
our residents
quality of life
Residents have
active in society during their retirement, they will expect
different levels of service in the future. We want to the Best
continue to maintain facilities and recreational amenities
that are exceptional for the size of our district whilst Quality of Life
meeting expected levels of service.
in NZ Create
We wish to maximise our opportunities whilst we have employment
a buoyant economy and encourage more industry and opportunities
businesses to establish or grow within our district. This to attract
will create employment opportunities and attract new new
residents. residents
To reach our goal, we need to ensure our core Further
infrastructure is working effectively and efficiently whilst develop our
providing an affordable service that meets the visitor Provide exceptional
expectations of our residents. We want to combine best experiences facilities &
practice infrastructure management with enhancing our
opportunities for
districts liveability.
our size
Page 15 of 81 Draft V2 December 2017Gore District Council 30 Year Infrastructure Strategy 2018-48
3.2.2 Where we have come from
The European history of the District started in 1855 with the arrival of Scottish settlers. After
the Gore town site was surveyed, the provincial superintendent, James Alexander Robertson
Menzies, named the site for his friend, the Governor of New Zealand, Thomas Gore Browne.
The township of Gore was incorporated and became a borough council in 1885.
In the local government reform in 1989, the Gore and Mataura borough councils and parts of
Southland County Council were amalgamated to form Gore District.
Our district has always been focussed on enabling the agriculture sector, we have ridden the
highs and lows of the industry as many of the businesses in our urban areas are connected
to servicing this sector.
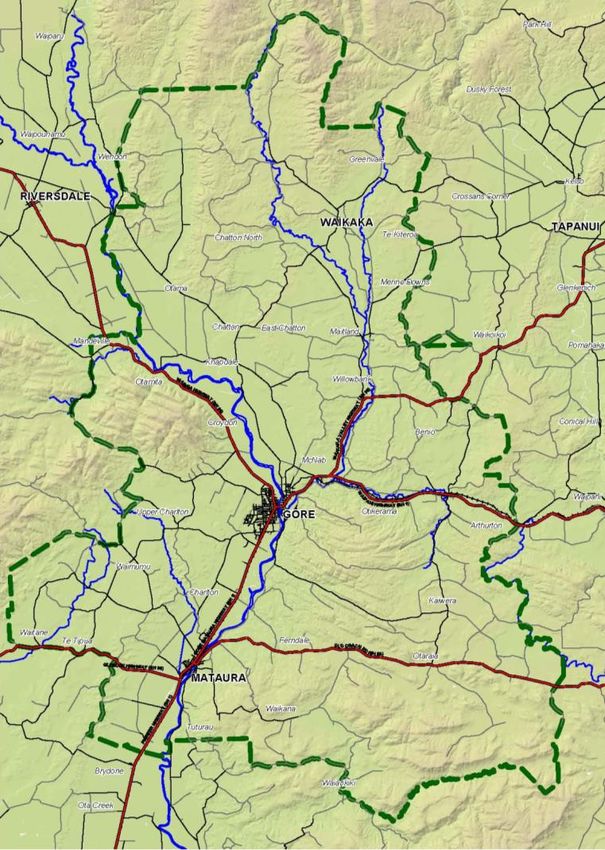
3.2.3 Where are we now?
Our district consists of two prominent urban areas – Gore and Mataura. Gore is a well-
established town and the primary focus of businesses and industries is to service the robust
agricultural sector in the surrounding rural areas.
We are known for the events that take place here such as the Hokonui Fashion Awards,
Southern Field Days and Moonshine Festival. We have many recreational attractions that
appeal to national and overseas visitors. The district is a very safe place to live. It’s family
friendly, we are aware that people return to Gore to start their families due to the facilities and
community vibrancy.
We are committed to prudently investing to create a vibrant and satisfying lifestyle, a place
where people want to live and businesses want to establish.
We are focused on providing our core services to our communities. We are financially
responsible and consider affordability for our residents. We strive to continuously improve
our services for everyone in our district. We are positive towards facilitating appropriate
growth in our district.
Figure 4: Map of the Gore District
Page 16 of 81 Final Draft January 2018GORE DISTRICT COUNCIL 30 Year Infrastructure Strategy
As part of our activity, we provide 3 Waters and Transportation services to the district’s communities. These services are managed and operated by our
Transportation and 3 Water Services teams as the core Infrastructure Asset services group. We aim to provide services that are affordable, integrated,
responsive and sustainable.
We have been making some big decisions recently. We are currently working on generational projects such as water treatment plant replacements and
wastewater treatment facility upgrades. We want to meet drinking water standards and ensure we have appropriate treatment capacity for both water and
wastewater. We are aware that we have capacity issues in our pipe networks for wastewater and stormwater, particularly when it rains. We are working on
strategies to address these matters and improve our performance. We have protected our main water supply intake to reduce contamination risk.
These significant projects come at a cost and the challenge we worked very hard to meet in our last Long Term Plan was how to balance our once-in-a-
generation projects with rates affordability and prudent debt management. Affordability and balance will continue to be our theme for our services.
Overall, economic and social changes are not expected to drive any significant changes in demand for services; however, rates levels are likely to be a key
area of concern for our community.
Page 17 of 81 Draft V2 December 2017Gore District Council 30 Year Infrastructure Strategy 2018-48
4.0 CORE INFRASTRUCTURE
We provide Water, Wastewater, Stormwater (3 Waters) and Transportation services to the district’s communities. These activities are managed and operated
as core “Infrastructure Asset‟ services, as per the Local Government Act 2002 Amendment Bill (No.3); Section 101B. How and where infrastructure is utilised
for human, agricultural, cultural and recreational uses, sustainable management is of considerable importance. Council has consistently regarded the provision
of utility services and transportation assets as vital to maintaining our community’s health and well-being. These assets are fundamental to Council’s statutory
responsibilities and strategies for conserving public wellbeing in pursuit of its mission to enhance the quality of life of residents in the District.
4.1 Asset Description
Provision of 3 waters services and transportation assets is essential for the benefit of residents and businesses throughout the District. Our activities protect
the health, physical environment, safety and wellbeing of the community and also enable the districts economy. These factors are indispensable to a vibrant
district with economic growth and development
Transportation Water Wastewater Stormwater
Asset Description Asset Description Asset Description Asset Description
We provide a sealed and We own and operate two urban We own three wastewater We own five separate stormwater
unsealed road network within the water supply systems in Gore schemes that provide service to systems located in Gore,
urban and rural areas of our and Mataura as well as the Gore, Mataura and Waikaka. Mataura, Mandeville, Pukerau
district. All of our footpaths are Otama Rural Water Supply We manage and operate our and Waikaka.
located within the urban areas. wastewater assets ourselves.
We manage and operate the We manage and operate the
Our roads serve a primary water supplies ourselves, with 40% of our network is a stormwater systems ourselves.
purpose of connectivity between Otama governed through a combined stormwater and
wastewater service. Our stormwater assets are
farm land, processing plants and private scheme committee.
valued at $23.4 million.
ports. Our wastewater assets are
A referendum amongst Otama Stormwater services are provided
Overall there are 896km of residents to determine valued at $40.9 million. We for for approximately 3,858
carriageway, 99km of footpaths, ownership of the Otama Water provide wastewater services to households.
130km of surface drainage, 90 Scheme was completed in 2017. approximately 4,474
households. Network collects stormwater from
bridges and 2675 culvert. Residents voted in favour of
private households and business.
forming a new company with The wastewater network
Our road network spans a This stormwater is discharged to
directors appointed by residents collects untreated wastewater
comparatively large geographic the Mataura River, the Waikaka
to own, govern and manage the from private households and
area for our ratepayer base. Stream and the Pukerau Stream.
scheme. To complete the business. This wastewater is
Page 18 of 81 Final Draft January 2018GORE DISTRICT COUNCIL 30 Year Infrastructure Strategy
Transportation Water Wastewater Stormwater
Asset Description Asset Description Asset Description Asset Description
Our local road network is transfer of ownership from the piped to treatment plants for The disposal of stormwater is
subsidised approximately 50% by Council to residents, the Otama treatment prior to being closely monitored and controlled
the New Zealand Transport Rural Water Scheme Committee discharged to the environment. by discharge consents that are
Agency. must present a Local Members’ managed by Environment
We have agreements with
Bill to parliament. The timing of Southland.
We consider the condition and significant Trade Waste
when this Bill is likely to be
performance of our Road and customers such as Silver Fern Overall there are 48 kilometres of
presented is not known.
Footpath assets overall to be Farms. A tradewaste agreement reticulation, 414 manholes, and 4
good. Our water supply assets are is currently being negotiated pump stations. The reticulation
valued at $35.1 million. We with Mataura Valley Milk to varies from 100mm to 1,500mmm
We have our roads classified
provide potable water to accept, treat and discharge their in diameter.
under ONRC as 24km Primary
approximately 5,101 industrial waste.
collector, 167km Secondary We consider the condition and
households.
collector, 301km Access and The discharge of wastewater is performance of the piped assets
405km Low Volume. Gore & Mataura supplies provide closely monitored and controlled and facilities to be moderate to
water for domestic and industrial by discharge consents that are good.
60% of our roads are unsealed
use with firefighting capabilities; managed by Environment
and 40% are sealed. We have Planned separation of the
while the Otama Rural Water Southland.
annual total journeys of 54 million combined wastewater system will
Supply is a restricted supply
vehicle kilometres. Overall there are 103 kilometres put pressure on the existing
only.
of reticulation, 878 manholes, 14 stormwater assets and is likely to
The water supply network pump stations, 3 treatment require significant upgrades to
collects untreated water from plants. The reticulation varies the stormwater network
rivers and bores, treats it to from 100mm to 1,000mm in
appropriate water supply diameter.
standards and then distributes
We consider the condition and
potable water to private
performance of the piped assets
households and business across
and facilities to be moderate
the two townships.
however there is significant
Consents for water takes are uncertainty associated with this.
managed by Environment
We have become aware that our
Southland and required
wastewater network is under
Page 19 of 81 Draft V2 December 2017Gore District Council 30 Year Infrastructure Strategy 2018-48
Transportation Water Wastewater Stormwater
Asset Description Asset Description Asset Description Asset Description
treatment standards are directed pressure to provide capacity at
by the New Zealand Drinking key points (particularly during
Water Standards. heavy rainfall events) and
suffers from infiltration.
Overall there are 11 operational
water sources/intakes, 18
storage facilities and 16 Pump
Stations. Total length of
reticulation is 387 km that varies
from 15 mm to 300 mm in
diameter
We consider the condition and
performance of the piped assets
and facilities to be moderate
however there is significant
uncertainty associated with this.
To meet the requirements of the
Health Amendment Act 2007,
many facilities or components of
facilities will be upgraded in the
short term.
We are directing more effort and
resources towards water
demand management. Leak
detection surveys have been
successful in reducing water
consumption. Water main
replacements are a priority for
renewal funding in this activity.
Page 20 of 81 Final Draft January 2018GORE DISTRICT COUNCIL 30 Year Infrastructure Strategy
.
Page 21 of 81 Draft V2 December 2017Gore District Council 30 Year Infrastructure Strategy 2018-48
4.2 Assumptions and Risk
4.2.1 Risk Communicate and Consult Risks
We have a comprehensive approach to risk management across all of
our activities. Independent assessments have been completed for our
core infrastructure activities.
The establishment of a risk framework has developed a risk aware culture RISK ASSESSMENT
across our organisation. The framework applies a logical and systematic
way of determining risks, their likely consequences and the most effective
way of managing and monitoring risks to minimise potential loses and
ensure optimal operation of services.
Identify Risks
We are also currently undergoing an organisational review on risk
management to ensure our risk exposure is appropriately managed. We
Treat Risks Establish the Context
also have a designated Council sub-committee that considers risk
associated with our activities.
Analyse Risks
Evaluate Risks
Monitor and Review Risks
Figure 5 Integrated Risk Management Framework
Page 22 of 81 Final Draft January 2018GORE DISTRICT COUNCIL 30 Year Infrastructure Strategy
4.2.2 Significant Assumptions
Level of Level of
Uncertainty Uncertainty Potential Impact/ Consequence if
Assumption Risk Mitigation Measures
Assumption wrong
Year 1-10 Year 11-30
Financial data as provided Financial forecasts for operational and Utilise valuation and known market
in the June 2016 asset capital programmes do not reflect actual rates for construction where
Unit rates do not reflect
valuation, using escalated Med Med market values available for budget planning.
actual market values.
unit rates has been used
for planning purposes.
Cost figures are based Financial forecasts for operational and Utilise valuation and known market
Cost estimates do not
upon the best estimates at capital programmes do not reflect actual rates for construction where
reflect actual market Low Med
the time of preparation of market values. available for budget planning.
values.
the plan
Levels of service within the Unplanned increase or decrease in levels Review of Levels of Service
planning period shall Demand for services may of service expectations. Non-forecast triennially. Annual customer
remain the same. change due to changes in capital or operational expenditure. satisfaction survey to audit asset
Med High
zoning, and new industrial performance from residents point of
activities view. 6 weekly levels of service
performance reporting to Council.
Growth predictions are That population growth is Population increase should be Use of best information available for
based upon Statistics New higher or lower than accommodated within existing system population forecasting. Financial
Zealand Data and projected, putting capacities. Where additional strategy consider affordability
historical data collated by pressure on Council to infrastructure is required this will be a across the long term.
council e.g. consents data. provide appropriate combination of development contributions
Low Med
infrastructure and services and loan funded. Small decreases in
population may not necessarily result in a
lower number of ratepayers as on average
the number of people per house is
decreasing.
Page 23 of 81 Draft V2 December 2017Gore District Council 30 Year Infrastructure Strategy 2018-48
Level of Level of
Uncertainty Uncertainty Potential Impact/ Consequence if
Assumption Risk Mitigation Measures
Assumption wrong
Year 1-10 Year 11-30
A consistent decline in population would
adversely affect the ability of the Council
to set rates at a level that was affordable
to the community
Appropriate customer Insufficient operational funding available Review of Levels of Service
consultation has been to provide service expectation. triennially. Annual customer
undertaken via the LTP satisfaction survey to audit asset
process and recent Annual Unexpected demands on performance from residents point of
Plans and customer levels of service and Low Med view. 6 weekly levels of service
feedback surveys operations. performance reporting to Council.
Annual review of operational
budgets for minor adjustments if
required.
The forecasts and capital That the data and Capital, operational and financial Asset Management
programme are based knowledge is incorrect forecasts are inadequate for actual improvement programmes are
upon the best data and and AM planning is asset requirements. established in all AMPs.
knowledge available at the under or over stated Continuous improvement in this
time of preparation Med High
area is a priority for the
organisation. Auditing of AMPs
by an independent party has
been introduced.
Deficiencies, where That not all deficiencies Insufficient operational funding available Annual review of budgets for minor
identified, have been have been identified. to address unexpected deficiencies. adjustments if required. Ability to
prioritised for on-going AM Med High approach the Council for funding if
and operational deficiency is significant or requires
improvement urgent action.
Page 24 of 81 Final Draft January 2018GORE DISTRICT COUNCIL 30 Year Infrastructure Strategy
5.0 EMERGING ISSUES
Our task of building, operating and maintaining our infrastructure assets in an affordable and sustainable manner is becoming increasingly difficult in view of:
Demographic changes
Environmental impacts
New technologies
Continually changing legislative environment (Central & Regional Government)
Infrastructure resilience
Aging of infrastructure
Increasing demand for a service may generate a requirement for the development of additional infrastructure. Funding needs to be planned for the expenditure
on capital works and associated on-going operational expenditure. Alternately, it may be possible to manage demand within the existing system capacity.
Where a reduced demand is forecast it may be appropriate to renew assets with a lesser capacity, operation expenses may decrease, or an asset may become
surplus to our requirements.
5.1 Demographic Changes
Population: Our population is likely to grow slightly.
Gore doesn’t attract as many “out of town” people as other towns and cities so
it is reasonably dependent upon locals staying in the District or being attracted
back to start families. However, the percentage of people born overseas have
increased in our District statistic. This indicates that Gore is an attractive place
for immigrants. Demand for overall services is likely to remain static with minor
extension of existing services in approved areas.
It is important to note that the Southland Regional Development Strategy
(SoRDS) aims to grow Southlands population by 10,000 over the next ten years.
We are mindful of the goals of this strategy, however we have elected to plan
for our infrastructure based on current information that indicates a slight long
term population and aim to be fluid enough to react to any significant
developments that may be a result of SoRDS.
Figure 6 Population Growth (Source: Infometrics)
Page 25 of 81 Draft V2 December 2017Gore District Council 30 Year Infrastructure Strategy 2018-48
The population growth below shows an increase during 2014 then
stabilising during 2015, with 0.4% population growth during 2016
compared to 2.1% for New Zealand. This is due to net migration rather
than natural increase.
Economic Growth: We want to see our district continue to prosper and
attract residents.
The recent development of the Mataura Valley Milk Plant will provide new
employment opportunities and we expect a complimentary maintenance
and service sector to establish in our district to provide services to the MVM
site. Our district is heavily dependent on the economic success of our
agricultural sectors. Our communities flourish when these sectors are
buoyant. Many of our residents are employed within this sector. We
expect agriculture to remain buoyant for the short term, however we are
aware that these industries experience cyclical highs and lows.
Affordability is regularly considered in our financial planning and reporting.
In 2016 the average annual GDP growth for the district was 2.9%
compared to the national average of 2.5%.
Primary industries (e.g. Agriculture, Forestry) accounted for the largest
Figure 7 Average Annual GDP Growth (Source: Infometrics)
proportion of GDP in the district followed by secondary industries (e.g.
mining, manufacturing).
Household Occupancy and Elderly: We have a lower occupancy rate than
average and we expect our residents will remain active throughout their
retirement.
The household occupancy rates remained the same from 2006 to 2013 at 2.4
compared with the national average of 2.7. The 65+ age group makes up 19% of
the population. It is also important to note that people are generally healthier than
40 years ago and with the predicted wave of baby boomers only starting to retire,
they are more active and likely to travel. This generation are expected to remain
very active in society during retirement and want recreational opportunities.
This could lead to requirements for additional smaller properties (units etc.) and
increases in the number of people living alone. Single person households also Figure 8 Share of total GDP (Source: Infometrics)
Page 26 of 81 Final Draft January 2018GORE DISTRICT COUNCIL 30 Year Infrastructure Strategy
have a higher per capita water consumption as economies of scale are lost. As a result, the wastewater discharge volume is likely to increase. The demand
for connections is likely to increase.
The increasing 65+ age group want to utilise good quality footpaths and road infrastructure with low risk of trip hazards. This generation tend to utilise pedestrian
assets much more and planning for asset upgrades and replacements takes this expectation into account.
Employment: Employment is heavily dependent upon local industries.
If any industry was to close there would be a
corresponding impact upon population. Local
industries are currently buoyant and employment
opportunities are reasonably sound with the
current low unemployment rate.
The Council continues to encourage economic
development within the district to attract new
residents due to the employment opportunities it
creates. The latest major development, Mataura
Valley Milk, is expected to generate jobs within
the milk processing factory and also have a wider
impact on smaller complimentary service
industries that are likely to establish within the
district.
Major industry developments can have a major
impact on our infrastructure so we work closely
with developers to make sure the best outcomes
are found for all parties in an affordable manner.
Employment growth below has recovered well
since 2014 with 2.1% growth in 2016 compared
to the national average of 2.7% for the same
period. Figure 9 Employment Growth (Source: Infometrics)
Page 27 of 81 Draft V2 December 2017Gore District Council 30 Year Infrastructure Strategy 2018-48
5.2 New Technologies
Outlined below are some possible technological advances and trends which could affect the management of our core infrastructure over the next thirty years:
Transportation Water Wastewater Stormwater
o Movement towards regional o Improved construction materials. o Improved construction materials. o Improved construction materials.
management of transportation Cost savings and asset life Cost savings and asset life Cost savings and asset life
networks in New Zealand. extension. extension. extension.
o Change in vehicle technology – o Technological improvements in o Improvements to treatment o Low Impact Design Stormwater
autonomous/driverless vehicles treating raw water. technology resulting in high quality management – mimicking the natural
changing level of service cost efficient wastewater treatment. environment and reducing the impact
expectations o Improved technology in water of stormwater run-off and discharge
monitoring. o Improved technology and techniques on the environment.
o Focus on economic benefits of in pipeline rehabilitation.
transportation networks. o Improved technology for conserving, o Stream restoration and riparian
purifying, recycling, reclaiming and o Alternative wastewater systems (i.e. planting replacing standard,
o Focus on infrastructure resilience - desalinating water. low pressure, vacuum) which stormwater channels.
particularly in dealing with natural eliminate the need for deep pipe
disasters and weather events. o Improved technology in stand-alone systems. o Treatment train systems which use
(private) systems and greater uptake of two or more treatment methods,
o New funding models including user of this. o Improved technology in self- such as ground soakage and riparian
pays systems to fund uptake of new contained private wastewater planting, to improve discharge
technology and road improvements. o Movement towards regulated systems (e.g. composting toilets). quality.
management of potable water
o Public interest in the environmental networks in New Zealand. o Higher environmental standards for o Focus on working with the natural
impact of road use. discharge from wastewater systems environment to provide effective
o Higher standards for drinking water into waterways. stormwater systems, and to lessen
quality and monitoring (as part of
environmental impacts.
national drinking water standards)
o Rising environmental standards for
o Water conservation becoming more
discharge into waterways.
of a focus, and water being used
more efficiently. o Increased interest in private, self-
sufficient stormwater systems.
o Recycling and reuse of water.
o private water systems and storage
o Rainwater harvesting
Page 28 of 81 Final Draft January 2018GORE DISTRICT COUNCIL 30 Year Infrastructure Strategy
Transportation Water Wastewater Stormwater
o Water takes/ usage becoming more o Climate change resulting in more
regulated. inconsistent and extreme weather
patterns
o Climate change resulting in more
inconsistent and extreme weather o Changing customer expectations
patterns regarding level of service
5.3 Changing Government Priorities and Legislative Environment
In providing our core infrastructure services, we keep an eye on the Central Government and Industry direction for the national infrastructure assets and public
service provision. This is done through attending conferences and seminars, studying reports released by Central Government agencies and membership of
industry organisations e.g. IPWEA, Water NZ, etc.
National Infrastructure Plan:
The government's objective under the National Infrastructure Plan 2015 is that, by 2045, New Zealand’s infrastructure should be resilient and coordinated and
contribute to growth and increased quality of life. Although we are a small district, our residents and customers deserve well managed, adequately performing
infrastructure they can rely on with certainty.
We aim to achieve development towards the goals of the government by aligning our asset management planning with the expectations set out below:
We will have a long-term view of our investment requirements to make more informed decisions by completing an infrastructure strategy for a 30-year
period;
We will develop a more sophisticated approach to understanding the condition of our assets, the timing of renewals, and how they are performing in
comparison to similar networks as part of our asset management improvements.
We support the establishment of shared metadata standards across transportation, the three waters, and government built assets.
We will continue to work towards understanding how our networks interact with other infrastructure networks as well as the implications for land use
planning and our customers.
National Policy Statements:
National Policy Statements are issued by the government to provide direction to regional and local government about matters of national significance which
contribute to meeting the purposes of the Resource Management Act 1991.
The National Policy Statement on Urban Development Capacity 2016 (NPS-UDC) sets out the objectives and policies for providing development capacity. The
NPS-UDC requires the Council to ensure that there is “sufficient housing and business development capacity” to meet expected short, medium and long-term
Page 29 of 81 Draft V2 December 2017Gore District Council 30 Year Infrastructure Strategy 2018-48
demand. In the interests of integrated management, and meeting our vision to be “ready for business”, more land is likely to be required for development and
it is appropriate that we, in consultation with the community, to have regard to our alternative futures.
There is a clear benefit in identifying the needs of industry that potentially may wish to locate in the district and ensuring they are provided for both in terms of
sites and appropriate infrastructure. Given the strategic significance of a spatial plan across a number of functions and activities of the Council, it is considered
appropriate to commence the spatial plan project as soon as practical.
The National Policy Statement for Freshwater Management 2014 (NPS-FM) sets out the objectives and policies for freshwater management. This NPS-FM is
part of initiatives developed for the Government’s programme of water reform. The expectations of the NPS-FM flow through respective Environment Southlands
Policy Statements & the proposed Southland Land and Water Plan.
This proposed plan is likely to require significant investment in our 3 Waters infrastructure to meet the proposed rules. We are monitoring the implementation
of this regional plan and are in close contact with Environment Southland to ensure the impact on our communities is considered. Our capital programmes
include funding for improvements to meet the expectations of the plan but depending on the final plan we may need to invest further.
We are also taking part in the Southland Economic Project as part of a Territorial Authority working party which will assist decision making for the limit setting
process.
5.4 Climate Change
The issue of climate change is expected to increase in intensity and evolve in terms of our response to these challenges, over a period of time. Both sustainable
development and climate change will in all probability form key components of our decision making process in the future.
At this stage we are operating under a “watching brief” and will actively monitor weather and climatic changes to determine if there are likely impacts on our
core infrastructure. Our initial responses to climate change include the development of mitigation actions from the Risk Management assessments undertaken
across Council.
We expect that our district will not be physically impacted by coastal erosion or sea level rise; however, the District may gain new residents that are required to
relocate due to the effects of these phenomenon. We expect that rain events may become more frequent and more significant in size, this impact is considered
within our infrastructure design standards. In addition to this we expect to experience longer and more extreme dry periods putting pressure on limited water
supply sources.
We are working closely with other local authorities and the Regional Council to ensure that a co-ordinated approach is taken to assess climate change and
develop an appropriate response, particularly regarding hazard and emergency management.
We are acutely aware of that our district is exposed to flood risk from the Mataura River and its tributaries. The existing flood protection system consists of
flood banks. The flood bank system is maintained by Environment Southland and has contained all flood events since it was installed. A review of the flood
bank system in light of predicted 100 year flood event modelling is underway, being led by Environment Southland.
Page 30 of 81 Final Draft January 2018GORE DISTRICT COUNCIL 30 Year Infrastructure Strategy
5.5 Infrastructure Resilience
Resilience is about the ability to plan and prepare for adverse events, the ability to absorb the impact and recover quickly, and the ability as a community to
adapt to a new environment. Risk management is an important element in the development and management of assets. For our asset management planning
to be robust and sustainable, it must be integrated with other corporate risk management processes. Resilience in our infrastructure underpins economic,
environmental and social resilience our community. Council has a responsibility to manage its assets in a way that provides resilience and protection for the
community. Customers have a high expectation of continuing functionality and service delivery.
Southland Region is prone to seismic activity. Recent events in Christchurch have provided the infrastructure engineering community with significant learning
opportunities. Ensuring critical assets will perform in a seismic event is critical to our district being able to continue to function.
We have resilience challenges in our transportation infrastructure such as increasing numbers of HT trucks using our road network, which will shorten the
economic lives of our assets over time. Weights across bridges can vary greatly particularly when forestry operations are completed nearby, these weights
can dramatically affect bridge condition.
Our ability to manage significant rainfall events in our urban areas needs to be better understood. We are aware we have capacity issues in our piped
stormwater and wastewater networks, particularly when it rains. We need to know what our critical infrastructure is and understand the likely seismic
behaviour for recovery planning purposes.
We discuss how we address resilience in section 6.4.
5.6 Aging infrastructure
The infrastructure is aging and the district is approaching an important period to ensure that its infrastructure assets continue to meet the needs of the community
in the future. Selection criteria for asset renewal uses a combination of customer feedback, condition assessment, modelling results, optimised decision making,
capacity/criticality assessment. This information is then used for prioritising the replacements in accordance with priority ranking.
Failure to maintain an adequate renewal programme will be reflected in a greater decline in the overall standard of the system of assets than would be expected
from the age profile of the asset system.
Our confidence levels in our data and information need to be improved so we can make better decisions about where to invest our community’s funds. To do
this we are investing in better asset management practices and processes for data management, condition and performance assessments over the next few
years. As this information improves we will be able to improve the quality of our renewal decision making.
Given that we intend to review this infrastructure strategy with each renewal of the Long Term Plan we believe that a 30-year term for our strategy is
appropriate. We are aware that parts of our core infrastructure has a life expectancy beyond this horizon.
Page 31 of 81 Draft V2 December 2017Gore District Council 30 Year Infrastructure Strategy 2018-48
5.6.1 Transportation Renewals
A recent review of this activity’s asset management practices has identified that we are managing our assets at a basic level. Previously a lot of decision making
for renewals was based on institutional knowledge of key staff. It is clear there needs to be a re-focus on the fundamentals of asset management for the
transportation activity to ensure renewals programming is adequate.
It appears that the rehabilitation of pavement via Area Wide Treatments and bridge replacements has been underfunded historically. We want to ensure we
have an accurate understanding of the remaining life of these assets. We plan to assess condition and performance of these assets in the short term and
develop our asset management practices to be able to better interpret information for planning purposes.
5.6.2 3 Waters Renewals
Renewal planning for piped assets is a work in progress. We wish to make sure our renewals also compensate for the capacity issues we have so a long term
planning project is underway incorporating capacity improvement planning along with renewal planning. It is intended to develop a more robust and repeatable
method for the identification of 3 Waters assets due for renewal based on optimised decision making (ODM). This will be developed for future revisions of this
strategy.
In the meantime, as we are aware of the need for renewal planning to reduce the impact of a bow wave of pipe renewals we have annual capital expenditure
for replacing pipe that is reaching the end of its economic life. We are also funding significant replacement projects for our treatment sites.
Funding amounts for the renewal programme are likely to be adjusted once the long term project plan is developed and prioritised renewals and upgrades can
be incorporated into it.
Very limited condition assessments of reticulated assets have been completed at this time, but Council have implemented a process whereby the condition of
assets is ascertained when carrying out repairs or renewals. While small amounts of Asbestos cement pipe assets have had condition assessments completed
in the last 10 years this is not believed to be sufficient. In the short term future, a focus will be placed on formal condition assessment of underground assets.
This will assist in the long term planning of asset renewals. These assessments indicated the pipes were in moderate condition. Approximately 42km of AC
pipe will reach the end of its economic life within the 30-year term of this plan.
Page 32 of 81 Final Draft January 2018GORE DISTRICT COUNCIL 30 Year Infrastructure Strategy
6.0 THIRTY YEAR STRATEGY
6.1 The Organisations’ Priorities
Our goal is to shape our district to provide the ‘Best Quality Foster & assist
of Life in NZ’. We wish to continue to encourage the trend economic
of being a family friendly district. We are a place that people development
want to ‘come home to’ and start their families. We also
wish to explore and develop tourism opportunities and
enhance the existing tourism economy, bringing visitors to
our district. To do this we need to provide infrastructure that
is affordable yet also performs appropriately. We want to
continue to ensure our district is ‘A Great Place to Live’ by Ensure Provide &
enhancing the liveability of our urban areas. infrastructure develop excellent
delivers an amenity &
6.2 Asset and Service Management affordable & recreational
appropriate level opportunities for
Strategy of service for the residents &
The most critical enabler of efficient and effective service long term visitors
delivery is the capability of an organisation, its people and
the systems in place. We have established an updated
asset management policy in June 2017. This defines the
appropriate level of asset management planning in line with Figure 10 Organisational priorities for our D
the discussion contained in the International Infrastructure
Management Manual (2015).
The policy definitions are as follows:
Water – Intermediate
Wastewater – Intermediate
Stormwater – Intermediate
Transportation - Intermediate
The objectives of the Asset Management Policy are:
ensure service delivery is optimized to deliver agreed community outcomes and levels of service for both residents, visitors and the environment
optimize expenditure over the life cycle of the assets
ensure risks are managed appropriately
Page 33 of 81 Draft V2 December 2017Gore District Council 30 Year Infrastructure Strategy 2018-48
provide a service delivery that is sustainable
The policy aligns with our strategic goals to:
ensure that the Gore District remains a great place to live
promote economic development
protect our water resources and use them wisely
maintain the quality infrastructure that we have
keep rates and debt affordable
The approach we take to managing our assets reflects in the level of service we provide to our residents and customers. Our principles for asset management
of our infrastructure services are outlined in the table below:
Asset Management
Approach Level of Service Effect
Principle
Component Age and Utilise data in renewal planning for assets and decision Ensures overall performance of networks do not deteriorate and
Condition making for asset upgrades. remain at an appropriate level at all times.
Investigate & resolve customer complaints. Monitor Networks responds appropriately during peak use and during
Network Performance reactive assets. Utilise minimum design standards. average demand. Poor performing assets are identified and
Consider annual customer survey results. remedied.
Monitor assets nearing end of economic life. Fund Renewal of assets occurs just in time before failure.
Deterioration and Renewals renewals via appropriate renewal planning. Consider Rehabilitation options may be more cost effective and affordable
rehabilitation opportunities. without decreasing service provision.
Regular scheduled maintenance of key assets and
Network performs adequately during demand periods.
Maintenance Regime known problem areas in network. In-house services
Operations are completed at a low cost, assisting affordability.
provide low cost service provision.
6.3 Cost Effective Delivery of Services
We are aware that there is a clear requirement to meet the current and future needs of communities with good-quality local infrastructure, local public services,
in a way that is most cost-effective for households and businesses. Our population is expected to have a slight increase in the long term but with a larger
Page 34 of 81 Final Draft January 2018You can also read