Fostering Circular Economy Through the Analysis of Existing Open Access Industrial Symbiosis Databases - MDPI
←
→
Page content transcription
If your browser does not render page correctly, please read the page content below
sustainability

Article
Fostering Circular Economy Through the Analysis of
Existing Open Access Industrial Symbiosis Databases
Daniel Jato-Espino *          and Carmen Ruiz-Puente
 INGEPRO Research Group, Department of Transport and Projects and Processes Technology,
 University of Cantabria, 39005 Santander, Spain; mdelcarmen.ruiz@unican.es
 * Correspondence: jatod@unican.es

 Received: 3 January 2020; Accepted: 23 January 2020; Published: 28 January 2020

 Abstract: Digital evolution underwent great progress in the late 20th century, democratizing the use
 of the Internet and, therefore, access to public sources of information. This technological shift caused
 great impacts on different fields, including Industrial Symbiosis (IS). IS stems from the concept of
 Circular Economy and requires well-structured information to encourage waste reuse. Under these
 premises, this investigation aimed at processing and analyzing existing open-access IS databases from
 several perspectives, including types of business areas, waste and new uses involved. In addition,
 existing IS data were explored with the support of different tools, such as correspondence, network
 and correlation analyses. The application of this methodology to a set of 496 shortlisted IS exchanges
 led to several findings, highlighting the strong relationship between metallurgy and the production
 of cement, the key role played by the electricity production sector both as a donor and a recipient,
 the versatility of the agriculture area due to their capacity for reusing a variety of waste as fertilizers
 and the importance of chemical products and steam and hot water as new uses. Overall, these results
 provide companies with efficient and understandable knowledge to donate or receive materials.

 Keywords: business sector; circular economy; donor company; industrial symbiosis; raw materials;
 recipient company; resource exchange; synergy; waste

1. Introduction
      Industrial activities result in the transformation of raw materials into products, which leads to the
generation of waste or by-products that are potentially harmful to the environment [1]. The reuse of
this waste cannot only avoid their conversion into contaminants, but also reduce the need for industrial
companies to consume virgin raw materials [2]. This idea is one of the main premises of Circular
Economy, a resource utilization system that seeks to minimize the accumulation of waste and fosters
its reincorporation into the production cycle as a substitute for raw materials [3]. This reduces the
magnitude of environmental impacts and production and sales costs, which results in benefits for
companies, users and the environment [4].
      Industrial Symbiosis (IS) is a branch of industrial ecology that emerged to facilitate achieving
these benefits by favoring exchanges between pairs of companies [5], such that the waste
(materials, energy or water) produced by one become the raw materials used by another [6]. Hence,
this approach focuses on achieving a closed loop for materials, which is a key aspect in Circular
Economy [7]. Although companies are aware of the benefits associated with IS, they either struggle to
find out how and with whom to carry out potential exchanges or consider that they lack time and
resources to make it effective [8]. Despite the transient nature of Circular Economy, the durability and
continuity of IS projects must be guaranteed through cooperation and confidence [9].
      Another of the main obstacles hindering the achievement of IS lies in the mistrust of companies in
sharing information [10]. This circumstance is being overcome through the unstoppable growth of the

Sustainability 2020, 12, 952; doi:10.3390/su12030952                       www.mdpi.com/journal/sustainability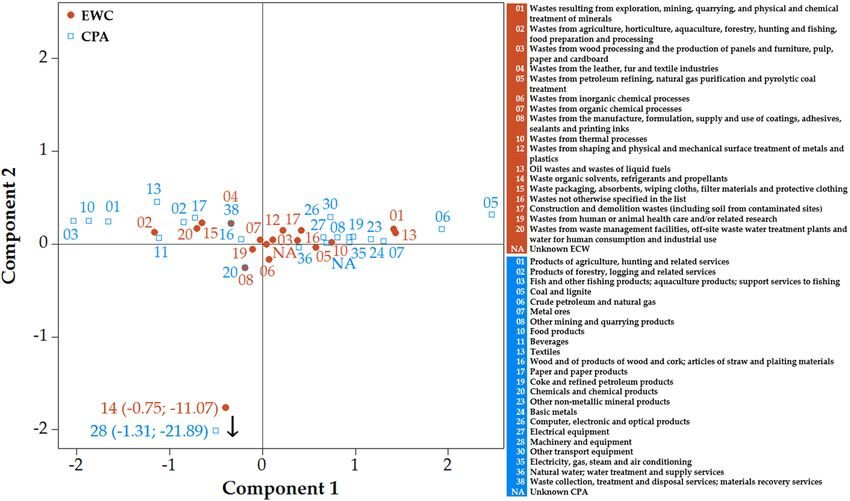
Sustainability 2020, 12, 952                                                                           2 of 24

Internet, which is continuously boosting access to information in a quick and easy manner. Not in
vain, there is a rising trend in the availability of open-access repositories over the years [11]. However,
this increase in information entails a rise in its disorganization, which limits the finding of what is
sought by users. In other words, information needs to be structured to become useful, in order to
facilitate the understanding of the concepts in which users are interested. In this vein, since the creation
of the concept in the 1990s [12], there is a variety of recent initiatives devoted to produce different tools
and databases to facilitate IS between companies.
      For instance, Trokanas et al. (2014) [13] developed a semantic input/output algorithm to facilitate
the creation of IS networks. They considered different aspects such as synergy similarity, CO2 saving,
landfill diversion and virgin materials saved to support the decision-making. In a similar vein,
Lignos et al. (2016) [14] conceived a hybrid approach based on a series of structural and economic
metrics for the evaluation of IS. It is presented as tool to be used by a variety of stakeholders that enables
comparing symbiotic bioenergy networks and producing data to conduct SWOT (Strengths, Weaknesses,
Opportunities and Threats) analyses. Zheng and Jia (2017) [15] designed an agent-based model to
carry out simulations about the knowledge and attitudes in IS processes. Their results indicated that
the coordination of both knowledge and relationships impacted positively on the identification of IS
opportunities. Yazdanpanah et al. (2019) [16] developed a Formal Industrial Symbiosis Opportunity
Filtering method (FISOF) aimed at helping industrial firm evaluate IS opportunities. It consists
of a decision support algorithm that first ranks potential exchanges and then facilitates contract
negotiations with the shortlisted candidates. Shi and Li (2019) [17] developed a life cycle management
approach whereby environmental impacts and sustainable resources use were studied through Life
Cycle Assessment (LCA) and a set of indicators, respectively. The results achieved proved to help
make decisions at different stages and adopt targeted strategies. As a response to the reluctance
of companies to share their information, Cervo et al. (2020) [18] presented a methodology to build
blueprints to facilitate IS. Its application to a petrochemical plant demonstrated its usefulness in
providing a transparent and simple tool for IS opportunities’ identification.
      Apart from these methodological investigations, other authors have focused on the collection
and processing of data to facilitate IS. Ruiz Puente et al. (2015) [19] analyzed the industrial symbiosis
opportunities for Small- and Medium-sized Enterprises (SMEs) in Cantabria, Northern Spain. To this
end, they collected surveys from 104 companies about their characteristics and waste produced, thereby
enabling the proposal of different prioritized synergies. Low et al. (2018) [20] built a database engine
to enable waste-to-resource matching using a classification method for organizing, modeling and
storing of information. Its application to two case studies demonstrated the insights that companies
can obtain regarding conversion of waste into products. Domenech et al. (2019) [21] mapped the
degree of development of IS across Europe. Although they identified different IS networks in a number
of countries, their exchanges were found to be limited by obstacles related to risk, uncertainty and
transactional costs. Neves et al. (2019) [22] evaluated the status of Portugal in terms of IS, finding
that existing networks are small and consist of only two or three members in most cases. Legislative
changes, funds availability or the existence of facilitators were identified as key aspects for improving
the current situation.
      The trend observed in these studies revealed a research gap in what concerns the facilitation of
the access to and understanding of information oriented to promote IS. Although there is a variety
of investigations devoted to evaluate and support IS exchanges, as well as to analyze opportunities
for establishing synergies, companies still struggle to obtain easy-to-interpret information that can
be really helpful in terms of Circular Economy. This is in line with the recent conclusions drawn by
Kosmol (2019) [23], who highlighted the difficulties to integrate current IS-related information and
knowledge into business processes, thus hindering the creation of synergies. Moreover, Yeo et al.
(2019) [24] pointed to the complications associated with extracting useful information from the vast
sources of data and knowledge that are available today.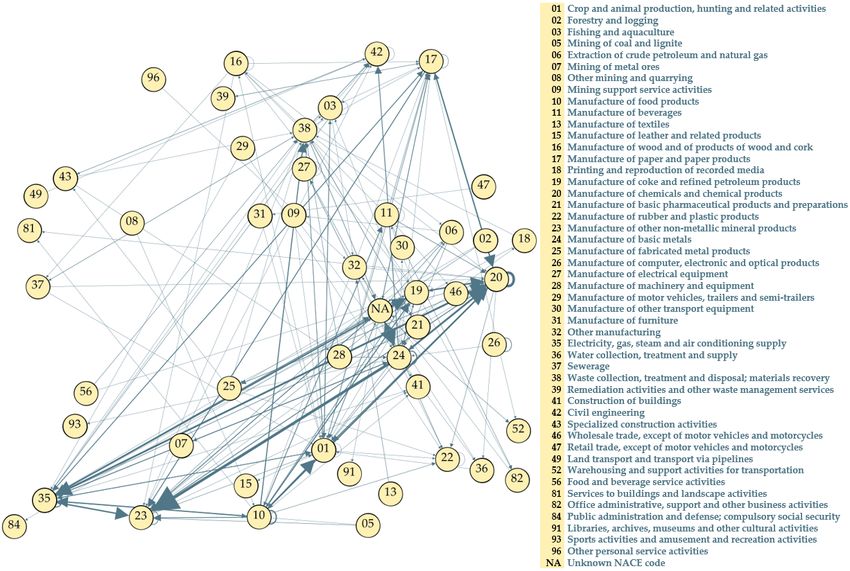
Sustainability 2020, 12, 952 3 of 24
Under these premises, the purpose of this research is to process and analyze existing open-access
IS databases, structuring them and filling their gaps to produce a compilation of reported case studies
to be examined in detail from different points of view, in order to produce knowledge to be exploited
by companies willing to participate in IS exchanges in which they can donate or receive materials.
The initial hypothesis on which the fulfillment of this aim depends is that existing databases reporting
a large number of IS exchanges can be structured and processed with the support of exploratory and
statistical Sustainability
analyses,2020, 12, 952
thus enabling the identification and prioritization of synergies according 3 of 24 to their
frequency andUnder intensity.
these premises, the purpose of this research is to process and analyze existing open-access
In this vein, thestructuring
IS databases, results themachieved demonstrated
and filling the effectiveness
their gaps to produce a compilation ofof the analysis
reported case studiesundertaken
in providingto be companies
examined in detail withfrom different points of view,
easy-to-understand andin order to produce
concise knowledgeregarding
information to be exploited
potential IS
by companies willing to participate in IS exchanges in which they can donate or receive materials.
opportunities through the simplifications of the exchanges reviewed, including aspects such as business
The initial hypothesis on which the fulfillment of this aim depends is that existing databases reporting
sectors involved, the types
a large number of wastecan
of IS exchanges generated andand
be structured their new uses
processed with as
theraw materials,
support all ofand
of exploratory which seeks
to producestatistical
clear and analyses, thus enabling the identification and prioritization of synergies according to their analysis.
concise information through the simplifications of the exchanges under
frequency
The rest of this manuscriptand intensity.
is devoted to dealing with these considerations according to the following
In this vein, the results achieved demonstrated the effectiveness of the analysis undertaken in
structure. Section 2 describes the methodology sought to process existing open-access IS databases,
providing companies with easy-to-understand and concise information regarding potential IS
whilst Section 3 presents
opportunities through and discusses the
the simplifications results
of the stemming
exchanges reviewed,from their
including analysis.
aspects Every table and
such as business
figure included in the manuscript
sectors involved, to support
the types of waste generatedthe
anddescription
their new usesofas both the methodology
raw materials, andtothe results
all of which seeks
produce clear
were self-created. and concise
Finally, information
Section through thethe
4 summarizes simplifications of the exchanges
main conclusions drawn under analysis.
from The
the investigation,
rest of this manuscript is devoted to dealing with these considerations according to the following
highlighting both their implications for the field of IS and potential future actions for giving continuity
structure. Section 2 describes the methodology sought to process existing open-access IS databases, whilst
to this research
section line.
3 presents and discusses the results stemming from their analysis. Every table and figure included
in the manuscript to support the description of both the methodology and the results were self-created.
2. Materials andsection
Finally, Methods
4 summarizes the main conclusions drawn from the investigation, highlighting both their
implications for the field of IS and potential future actions for giving continuity to this research line.
The approach taken aimed at analyzing the information contained in existing IS databases by
following 2.
four sequential
Materials steps as shown in Figure 1. First was the identification of existing databases
and Methods
to enable the compilation of previous
The approach taken aimed at case studies.
analyzing Then, thecontained
the information exchanges contained
in existing in thebyshortlisted
IS databases
databases following
were arranged according
four sequential to shown
steps as different criteria,
in Figure including
1. First type of donor
was the identification and recipient
of existing databases company,
to enable
based on their the compilation of
Nomenclature of previous
Economic caseActivities
studies. Then, the exchanges
(NACE) code,contained
as wellinasthe shortlisted
type and end of use
databases were arranged according to different criteria, including type of donor and recipient
of waste. company,
The third step concerned a verification process of the synergies found by evaluating the
based on their Nomenclature of Economic Activities (NACE) code, as well as type and end
relationship
of use of waste.waste,
between thestep
The third statistical
concernedClassification of Products
a verification process by Activity
of the synergies found by(CPA) and recipient
evaluating
company. the
Next was the identification
relationship between waste, the andstatistical
amendment of errors
Classification of and incomplete
Products by Activityfields
(CPA)in and
the databases
recipient company. Next was the identification and amendment of errors and
selected in the first step. Finally, the results stemming from the previous task were assessed incomplete fields in the through
databases selected in the first step. Finally, the results stemming from the previous task were assessed
exploratory and statistical analyses.
through exploratory and statistical analyses.
Figure 1. Figure 1. Sequential
Sequential approach
approach of the
of the methodology proposed
methodology proposedfor for
processing and analyzing
processing existing existing
and analyzing
Industrial Symbiosis (IS) databases.
Industrial Symbiosis (IS) databases.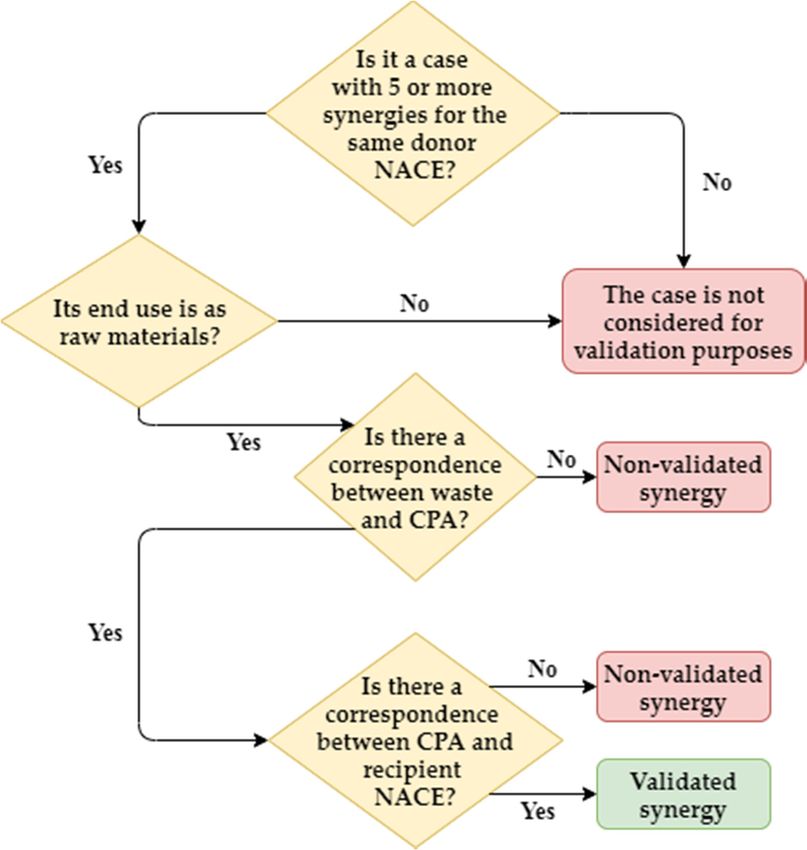
Sustainability 2020, 12, 952                                                                              4 of 24

2.1. Data Compilation
      This step started with the screening of existing databases, in order to select those that best fitted
the requirements for creating concise and easy-to-understand IS information. The design of tools to
support IS has increased a lot during the past decade [25]. However, as pointed out before, most of these
tools focus on providing companies with a computerized means to search for new synergies, lacking
information about previous cases. This absence of shared knowledge prevents any potential contact
with companies capable of shedding light about their past successful experiences. Only three recent
developments are devoted to the compilation of previous exchanges to help companies finding new
opportunities: CIRCULATOR [26], IS-Data [27], MAESTRI [28] and SYNERGie®4.0 [29]. The first one
is limited to describing the experiences of individual companies, thereby lacking complete information
about the exchanges involved. For its part, the data contained in SYNERGie®is not open-access, which
is against one of the main premises of this research.
      As a consequence of these considerations, the databases selected to work with were MAESTRI
and IS-Data. MAESTRI is the result of an EU-funded research project sought to develop an integrated
platform combining different assessment tools, a new management system and a novel approach for
IS implementation [28]. Overall, MAESTRI compiles 424 exchanges from 46 different case studies.
This database provides two filtering systems, whereby users can refine their searches according to the
companies and materials present in the exchanges. As mentioned before, companies and products
are defined through their NACE and CPA codes, respectively. In addition, this database also uses the
European Waste Catalogue (EWC) codes and the Chemical Abstracts Service (CAS) registry numbers,
which enables identifying the composition of waste in those cases in which it is formed of several
substances. Table 1 summarizes the structure and data included in MAESTRI, arranged according to
the companies and materials involved in the exchanges.

      Table 1. Structure and fields included in the MAESTRI database. NACE: Nomenclature of Economic
      Activities; CPA: Classification of Products by Activity; EWC: European Waste Catalogue; CAS: Chemical
      Abstracts Service.

                  Header                                           Fields
        Exchange identification                                  Identifier
                                                       Donor: Name/Business/NACE
          Companies involved
                                                     Recipient: Name/Business/NACE
                                          Entrance: Waste description/EWC/CPA/CAS/Hazardous
         Exchange description
                                         Treatment: Owner/Description/Company/Business/NACE
            Exchange details          End of use of waste/Availability of exchanged materials/Payment
            Exchange status                         Under study/Planned/Implemented

      Like MAESTRI, IS-Data compiles IS experiences across the globe through an open platform.
This platform was created to enable using its data in combination with other open or proprietary
datasets, including a series of tools to help users in achieving their goals and interests [27]. It contains
74 exchanges whose origin in terms of case studies is unknown due to its structure. IS-Data is arranged
according to three sheets, such that the first one includes data about the exchange, identification codes,
title, author, organization, country, summary and year of publication. The second sheet focuses on
the reference of the exchanges. The Australian and New Zealand Standard Industrial Classification
(ANZSIC) is also used to complement the NACE code. Additionally, the materials are described
through the EWC and CPA codes, specifying whether the exchanges are under development or already
implemented. The last sheet indicates the country of origin of the participating parties, the Small-
and Medium-sized Enterprises (SME) involved (if any) and other information related to economic,
environmental and social impacts, transmitted energy etc.
      The data contained in MAESTRI and IS-Data were processed to improve both their completeness
and simplicity, in order to facilitate the identification of the main aspects that can lead companies to find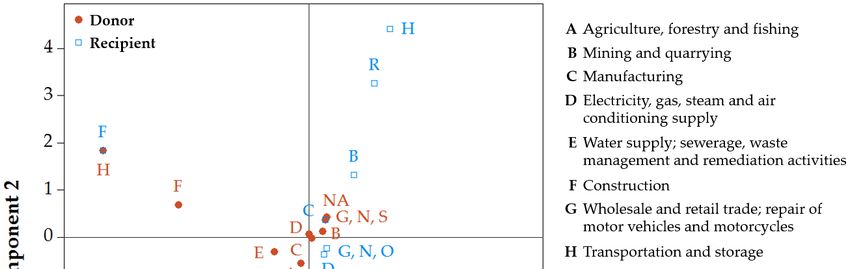
Sustainability 2020, 12, 952                                                                          5 of 24

exchange opportunities, either in the form of raw materials acquisition or waste disposal. Although
the main source used to carry out the tasks needed to achieve this purpose was MAESTRI, IS-Data was
also taken into account as a complement in order to introduce some improvements, such as additional
descriptions, secondary materials, location etc. Consequently, the proposed database amounted to
496 exchanges, 424 from MAESTRI and 76 from IS-Data.

2.2. Exchange Organization
      Data were sorted from large to small, enabling different types of analysis according to the levels
of details established. The first criterion used was the NACE code of donor companies using the four
digits on which it is based. Then, the waste produced by these donor companies was identified as
materials, energy or water, such that each of these groups was further ordered according to the end
use made by the recipient companies. This sequence was repeated using only the first two digits of
the donor NACE code, in order to get an overview of the economic areas involved in the exchanges.
In addition, the whole process was replicated from the point of view of the recipient companies.
      This approach enabled determining which companies were responsible for generating waste with
more changes of exchanging, as well as their business area, the type of waste they generate the most,
the type of waste with more prospects to be used by other companies and their most frequent end use.
A field indicating the location of the exchanges was added too in case there is a need to go deeper into
them. In this line, the inclusion of a link with more information about the practical cases from which
the exchanges stem was addressed in subsequent steps.
      In the first instance, these arrangements must be verified by considering those cases in which
waste performed as raw materials. This was undertaken using the CPA code associated with the waste
involved in the exchanges. In the case of waste generated by donor companies whose CPA code was
known, the aim was to check their correspondence with the products used by the recipient companies.
If the CPA of waste was not specified but the recipient companies were found to use them as raw
materials straightforwardly, the verification consisted of finding their corresponding CPA. Finally,
waste that was not associated with any CPA nor used as raw materials was investigated to determine
its role in the exchanges.

2.3. Sinergy Verification
     To efficiently ensure the coherence of the large amount of data resulting from the merge between
the MAESTRI and IS-Data databases, the correspondence between waste and its associated CPA was
verified by considering only those groups of donor companies with five or more synergies registered.
Within these groups, those cases involving exchanges with a defined end use for waste were discarded,
since the goal at this stage was to validate synergies in which waste performed as raw materials.
This resulted in a total of 137 exchanges to verify.
     A new field indicating the description of the CPA code was added to provide a means to rapidly
check the alignment of waste with the classification according to its activity. Thus, the verification
of synergies was based on identifying a double relationship: (1) waste–CPA and (2) CPA–recipient
company. This line of action revealed that the CPA associated with waste was an indicator of its new
uses. This can be illustrated with a case in which sludge (waste in the donor company) performs
as a fertilizer (end use in the recipient company). The CPA of this exchange would correspond to
“animal or vegetable fertilizers”.
     In addition, recipient companies can make a complete or partial use of waste. For instance,
the former occurs when the type of waste generated is wood, which can be used as a raw material to
obtain heat in diverse areas. On the other hand, an example of partial use of waste is sewage sludge
containing slags, since the latter can perform as raw materials in the manufacturing of construction
products. Moreover, the correspondence between the activity indicated by the CPA and the economic
area of the recipient company was also validated. Thus, the fact the new role played by waste kept a
clear relationship with the type of recipient companies was taken as a confirmation of their suitability for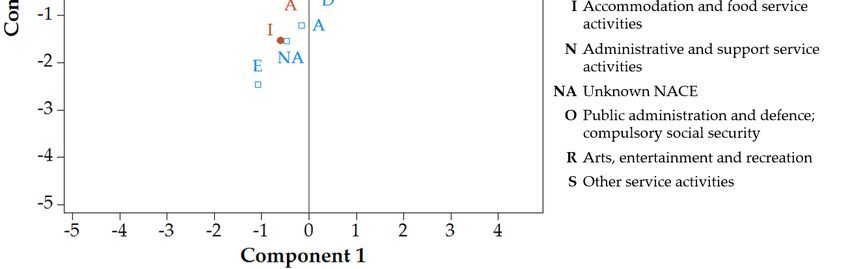
Sustainability 2020, 12, 952 6 of 24
the exchange. This verification process, which can be schematized as represented in Figure 2, enabled
corroborating the relationship between waste, CPA and the end uses allocated by the companies.
Sustainability 2020, 12, 952 6 of 24
Figure
Figure 2.
2. Workflow
Workflow process
process used
used to
to carry
carry out
out the
the verification
verification of
of synergies.
synergies.
2.4. Error
2.4. Error Correction
Correction
This step
This step was
was not
not restricted
restricted only
only to
to representative
representative cases
cases as
as before,
before, but
but extended
extended to
to the
the whole
whole set
set
of exchanges included in MAESTRI and IS-Data. Hence, the errors, conflictive
of exchanges included in MAESTRI and IS-Data. Hence, the errors, conflictive data and data and incongruences
found in the arranged
incongruences found data were
in the processed
arranged according
data to donor and
were processed recipienttocompanies.
according donor andThe type of
recipient
errors found in the databases are listed below:
companies. The type of errors found in the databases are listed below:
• • Inconsistencies
Inconsistencies between thebetween the description
description of companies of and
companies and their
their NACE code.NACE
Thesecode.
errorsThese
refer
errors refer not only to a lack of correspondence between description
not only to a lack of correspondence between description and NACE codes, but also to the cases and NACE
codes,suitable
in which a more but alsoNACE
to thecode
casescan
in which a more
be assigned to suitable NACE code can be assigned to
the companies.
the companies.
• Inconsistencies between waste, CPA codes and recipient companies. This situation concerns those
• Inconsistencies between waste, CPA codes and recipient companies. This situation
exchanges in which there is not a clear linkage between these three aspects, either because the
concerns those exchanges in which there is not a clear linkage between these three
CPA codes associated with the waste allude to unlikely new uses for them or because the new
aspects, either because the CPA codes associated with the waste allude to unlikely
uses of waste have no relationship with the recipient companies.
new uses for them or because the new uses of waste have no relationship with the
This process yieldedcompanies.
recipient 118 contradictory registers, which means 24% of the 496 initial cases.
92 ofThis
theseprocess
errors stemmed from
yielded 118 MAESTRI and
contradictory 36 fromwhich
registers, IS-Data. Three
means 24%groups were
of the 496created to facilitate
initial cases. 92 of
the processing
these of errors
errors stemmed andMAESTRI
from differentiateandbetween
36 fromthose associated
IS-Data. with donor
Three groups werecompanies,
created to recipient
facilitate
companies
the andof
processing CPA codes.
errors andBesides, four new
differentiate fieldsthose
between wereassociated
added to account
with donorfor the followingrecipient
companies, aspects:
companies and CPA codes. Besides, four new fields were added to account for the following aspects:
• Errors in the NACE / CPA code: key aspects that are provoking conflict in the data.
• Errors in the NACE / CPA code: key aspects that are provoking conflict in the data.
• Error description: explanation of the reasons to either make corrections or accept data included in
• Error description: explanation of the reasons to either make corrections or accept data
the databases.
included in the databases.
• Corrected• main business
Corrected / CPA
main code description:
business / CPA code definitive main definitive
description: business ofmain
the companies
business of or the
the
CPA codes after the application of changes.
companies or the CPA codes after the application of changes.
• Corrected NACE
• Corrected/ CPA code:/ definitive
NACE CPA code:NACE or CPA
definitive NACEcodesor after
CPA the application
codes of changes. of
after the application
changes.
Inconsistencies between the description of companies and their NACE codes were accepted in
those cases in which there was an explanation justifying their use. Otherwise, doubtful data in this
sense was considered incorrect and NACE codes more aligned with the description of the companies
were proposed. As for the irregularities between waste, CPA codes and recipient companies, theSustainability 2020, 12, 952 7 of 24
Inconsistencies between the description of companies and their NACE codes were accepted
in those cases in which there was an explanation justifying their use. Otherwise, doubtful data
in this sense was considered incorrect and NACE codes more aligned with the description of the
companies were proposed. As for the irregularities between waste, CPA codes and recipient companies,
the approach taken consisted of using exchanges containing data about waste treatment as references,
since these cases can be very useful in the identification of relationships between waste and its new
uses. As a result, 93 of the 118 conflicting cases were corrected (79%), a figure that amounts to 19% of
the 496 original exchanges.
Apart from the amendment of incorrect data present in MAESTRI and IS-Data, this step also dealt
with the absence of information regarding the description of donor and recipient companies, as well as
the identification through the EWC, CPA and NACE codes. The results of this task were grouped this
time according to donor company, recipient company, CPA and EWC. This code was not considered in
the correction of errors because it was not conflictive in that case. All these groups included a new
field in which the filling proposal was explained.
The hardest fields to complete were the description of companies and their NACE codes.
Those cases in which both fields were unavailable could not be completed unless specific data about
them was found and comparable with other exchanges. In the absence of EWC, the procedure consisted
of assigning the code that best fitted the descriptions available in the databases. The fact that this code
not only represents the type of waste but also its origin was taken into account in the proposal of new
values. Again, if both the EWC code and the waste description were missing, the empty space could
not be filled with rigor.
The situation with the CPA code was more complex, since it depends on its double relationship
with waste and recipient companies. Each CPA empty case was studied individually by analyzing the
companies involved in the exchange and the type of materials they usually work with. Additionally,
the most frequent new uses allocated to waste were also evaluated, in order to collect as much data as
possible to set the most suitable code for each exchange. Moreover, CPA codes were also obtained
through comparison with similar exchanges available in the databases.
Once these flaws were addressed, the information grouped according to donor and recipient
NACE codes was updated by adding the corrections and fields completed in this step. This resulted
in the definitive arrangement of the 496 exchanges included in MAESTRI and IS-Data based on
NACE codes, waste (including CPA and EWC) and new uses assigned by the recipient companies.
Table 2 shows the arrangement of information once this step was completed, including a trio of
examples representing all possible casuistries in what concerns data acquisition and processing.
Table 2. Summary of the refined database produced after processing the MAESTRI and IS-Data records.
Donor Waste Recipient
Waste EWC Waste Main
Main Business NACE Code CPA Code CPA Description NACE Code
Description Code End Use Business
Production
of pellets
Wood and Raw
Agriculture 01.10 150103 02.20.10 Raw wood 16.29 and
paperboard materials
plywood
panels
Other Production
Biomass non-recyclable of coffee
Oil extraction 06.10 050199 38.11.39 Fuel 10.83
fuel non-hazardous and milk
waste drinks
Oils and
Various fats with
Food 10.00 020102 10.41.00 Oils and fats 19.20 Refinery
food waste 30%
triglycerides
Corrected Blanks IS-Data
Validated synergies Maestri cases
errors filled cases
2.5. Exploratory and Statistical Analysis
This whole refinement procedure was required to prepare the data for their analysis in both
exploratory and statistical terms in the final step of the methodology. In the first instance, data wereSustainability 2020, 12, 952 8 of 24
evaluated with the support of a simple correspondence analysis. This technique handles data in the
form of contingency tables by indicating the degree of relationships between rows and columns.
In this case, variables such as donor and recipient areas, waste or new uses performed as the rows and
columns in such tables. Hence, data variability was broken down into dimensions and then associated
with rows and/or columns.
This enabled the creation of graphs to represent row and column points or coordinates that help
examine the structural relationships between the variables under analysis. In the case of plotting
business areas according to their NACE codes, row and column coordinates represent the chi-square
distances between the raw data indicating the frequency of donor and recipient sectors divided by
the number of rows and columns, respectively. There are symmetric and asymmetric plots to display
the coordinates for row and column categories. Symmetric plots display principal coordinates for
both rows and columns, whilst asymmetric row and column plots display principal coordinates
and standardized coordinates for row categories, and vice versa for column categories. Since this
standardization facilitates the interpretation of distances and angles between row and column points,
asymmetric plots were selected for the analysis. Further choice between asymmetric row plots and
asymmetric column plots was made according to visualization criteria with the aim of reducing
points’ overlap.
The degree of association between the variables involved in IS were explored through network
analyses. The exchanges contained in the refined database could be represented through different
networks, with the pairs of either donor–recipient business areas or waste–new uses performing as
nodes, and the intensity between their relationships playing the role of links or edges. Networks can be
characterized through a series of concepts. Centrality refers to the relative importance of each node in
the network. This term is closely related to the connectivity between such nodes, since their relevance
or centrality is given by the number of exchanges in which they participate.
Another important concept is nodal degree, which indicates the number of nodes each node
is connected with. This is strongly associated with the diversity of the nodes, which concerns the
variety of nodes to which they are linked. Taking all these considerations into account, networks can
be divided into centralized, decentralized and distributed. A centralized network contains a single
central node to which all others are related. A decentralized network stems from the union of a series of
centralized networks, such that central nodes can also be linked to other nodes in the general network.
Instead, distributed networks highlight by lacking any central node. Due to the characteristics of IS
data, every network to be obtained throughout the next section was expected to be distributed.
To ensure the statistical validity of the inferences drawn from the aforementioned analyses,
data were also examined using correlation coefficients, which measure the degree of association between
two variables. Positive correlations indicate that both variables increase in the same direction, whilst
negative correlations mean that one variable increases whenever the other decreases. These two types
of coefficients are quantified through intervals ranging from 0 to 1 and −1 to 0, respectively. Statistical
correlations are measured using different coefficients depending on whether data are quantitative,
ordinal or nominal. In this case, data were nominal variables representing business areas, waste and
new uses.
Nominal data must be first dichotomized to enable quantifying any relationship between the
variables through correlation coefficients. Hence, the variables under study were represented with
values of 1 and 0, which indicated whether they were present or absent. For instance, the correlation
between donor NACE 01.10 and recipient NACE 16.29 was approached by creating two columns with
all the exchanges. Hence, the first column included values of 1 when the donor was 01.10, whilst the cells
in the second column were 1 in those cases in which the recipient was 16.29. The remaining cells were
set at 0 in both columns, indicating that the participating donor and recipient areas were neither 01.10
nor 16.29. The validity of correlation coefficients was measured through the p-value, which indicates
the probability of wrongly rejecting the hypothesis whereby there was not enough evidence to concludeSustainability 2020, 12, 952 9 of 24
Sustainability 2020, 12, 952 9 of 24
which indicates the probability of wrongly rejecting the hypothesis whereby there was not enough
evidence to conclude that two variables are correlated. Therefore, a p-value below the significance
that
level,two variables
which areatcorrelated.
was set Therefore,
0.05, suggested a p-value
that there was below the 5%
less than significance level,
probability thatwhich was set at
this hypothesis
0.05, suggested
was correct. that there was less than 5% probability that this hypothesis was correct.
3. Results and
3. Results and Discussion
Discussion
The
The presentation
presentation and and discussion of results
discussion of results was
was carried
carried out
out according
according toto the
the variety
variety of
of levels
levels of
of
detail
detail involved by the different codes used to represent economic areas, types of waste and product
involved by the different codes used to represent economic areas, types of waste and product
uses.
uses. In
In this
this vein,
vein, the
the results
resultsachieved
achievedaccording
accordingtotothe
theNACE
NACEcodecodewere explored
were explored byby
using one,
using two
one, or
two
four digits, involving increasingly narrow clusters to indicate the activity of companies. In
or four digits, involving increasingly narrow clusters to indicate the activity of companies. In the casethe case
of
of the
the EWC
EWC and and CPA
CPA codes,
codes, the
the analysis
analysis tightened
tightened from
from generic
generic to
to specific
specific by
by considering
considering two
two and
and
six digits.
six digits.
3.1. Analysis According to Business Areas (NACE Codes)
3.1. Analysis According to Business Areas (NACE Codes)
As a first step, a simple correspondence analysis was undertaken to examine the interactions
As a first step, a simple correspondence analysis was undertaken to examine the interactions
between donor and recipient companies according to their 1-digit NACE codes. Figure 3 shows the
between donor and recipient companies according to their 1-digit NACE codes. Figure 3 shows the
asymmetric row plot stemming from this analysis, which displays a row of principal coordinates
asymmetric row plot stemming from this analysis, which displays a row of principal coordinates
(donor) and a column of standardized coordinates (recipient). The main information provided by this
(donor) and a column of standardized coordinates (recipient). The main information provided by this
diagram is that the further categories are from the origin, the more distinct they are, and vice versa.
diagram is that the further categories are from the origin, the more distinct they are, and vice versa.
In this case, this means that NACE donor H (transportation and storage) and recipients F (construction),
In this case, this means that NACE donor H (transportation and storage) and recipients F
H and E (water supply) are less likely to participate in exchanges with other sectors. Instead, NACE
(construction), H and E (water supply) are less likely to participate in exchanges with other sectors.
codes like C (manufacturing) and D (electricity gas, steam and air conditioning) are located close to
Instead, NACE codes like C (manufacturing) and D (electricity gas, steam and air conditioning) are
the origin, indicating more chances to create synergies with other businesses. The strength of the
located close to the origin, indicating more chances to create synergies with other businesses. The
relationships between donor and recipient areas increased proportionally to the acuteness of the angles
strength of the relationships between donor and recipient areas increased proportionally to the
between the lines connecting their positions with the origin. Hence, a couple of examples of strong
acuteness of the angles between the lines connecting their positions with the origin. Hence, a couple
relationships were those between donor D (electricity) and recipient C (manufacturing) or donor C
of examples of strong relationships were those between donor D (electricity) and recipient C
and recipient A (agriculture), since the virtual lines connecting their coordinates with the origin of the
(manufacturing) or donor C and recipient A (agriculture), since the virtual lines connecting their
plot were acute.
coordinates with the origin of the plot were acute.
Figure 3.3.Relationships
Relationshipsbetween
between donor
donor and and recipient
recipient NACENACE codes
codes (1 digit)(1
in digit) in ofthe
the form an form of an
asymmetric
asymmetric
row row plot (row—principal
plot (row—principal coordinates
coordinates and and column—standardized
column—standardized coordinates).coordinates).Sustainability 2020, 12, 952 10 of 24
Sustainability 2020, 12, 952 10 of 24
A more detailed arrangement of the data according to the NACE codes is depicted in Figure 4,
A more detailed arrangement of the data according to the NACE codes is depicted in Figure 4,
which represents donor and recipient companies through 2 digits. Thicker links represent the more
which represents donor and recipient companies through 2 digits. Thicker links represent the more
frequent exchanges between the 49 NACE codes included in the 496 cases that formed the processed
frequent exchanges between the 49 NACE codes included in the 496 cases that formed the processed
database.
database. Hence,
Hence, thethe chemical
chemical industry (20) was
industry (20) was found
found to
to participate
participate in
in 26%
26% of
of the
the total
total exchanges,
exchanges,
followed by the supply of electricity, gas, steam and air conditioning (35), the manufacture
followed by the supply of electricity, gas, steam and air conditioning (35), the manufacture of of basic
basic
metals
metals(24),
(24),the
the food
food industry
industry (10)
(10) and
and the
the manufacture
manufacture ofof other non-metallic mineral
other non-metallic mineral products
products(23),
(23),
which amounted to 23%, 20%, 16% and 15% of the synergies considered, respectively.
which amounted to 23%, 20%, 16% and 15% of the synergies considered, respectively.
Figure4.4.Network
Figure Network diagram
diagram of
of the
the frequency
frequency and
and intensity
intensity of the links between donor and recipient
recipient
NACEcodes
NACE codes(2
(2digits).
digits).
As
Asfurther
furtherproof
proofof of their
their importance,
importance, the the exchanges among these 5 economic areas concentrated concentrated
aathird of the registered synergies.
third of the registered synergies. This figure increased up to 75% when taking into account the
into account the
participation
participationofofthese
thesesectors
sectorsininany anyexchange,
exchange,which
whichcorroborates
corroboratestheir great
their greatimportance
importance in in
terms
terms of of
IS
due to the
IS due to type of waste
the type they generate
of waste they generateand their
andhigh
theirreusability. As introduced
high reusability. before, Figure
As introduced before,1Figure
shows
ashows a distributed
distributed network,network,
since there since there isaneither
is neither single nodea single node centralizing
centralizing the relationships
the relationships with
with the others
the aothers
nor nor a decentralized
decentralized tree-shapedtree-shaped structure
structure where where the generation
the generation of exchanges of exchanges is sequential.
is sequential.
As aa consequence of
As ofthetheimpossibility
impossibilityofoffillfill
oror complete
completesome
some thethe
absent data,
absent therethere
data, werewere
42 and 42
23 unknown
and 23 unknown registers involving
registers involving thethe
participating
participating companies
companies (NA),
(NA),which
whichamounts
amountstoto13% 13%of of the
the
exchangesunder
exchanges understudy.
study.Still,
Still,these
these results
results highlighted
highlighted the complexity of the connectivity between between thethe
nodesofofthe
nodes thenetworks,
networks,defined
defined asas
thethe capacity
capacity of the
of the companies
companies of same
of the the same or different
or different economiceconomic
areas
areas
to to communicate
communicate with eachwith other,each
shareother, share information
information and establishand establish
mutually mutually
beneficial beneficial
relationships.
relationships.
The analysis of data from the perspective of donor and recipient companies resulted in some
The analysis
differences of data
with respect from the
to Figure perspective
4, as observed in ofFigure
donor5a,b.
and For
recipient companies
instance, areas 01 resulted
(crop andinanimal
some
differences with
production), respect to Figure
20 (manufacture 4, as observed
of chemicals) and 23 in Figure 5(a) of
(manufacture and (b). non-metallic
other For instance,products)
areas 01 (crop
were
and animal
found production),in20favor
to be unbalanced (manufacture of chemicals)
of their role as recipients, andand
23 vice
(manufacture of other
versa for area non-metallic
24 (manufacture
products)
of were found
basic metals). to beone
On the unbalanced
hand, those in favor
donor of their
areasrole as recipients,
reaching and viceboth
top positions versa infor area 244
Figures
(manufacture
and 5a experiencedof basic metals). in
a decrease Onthethenumber
one hand, those donor
of NACE codes toareas reaching
which top positions
they donate both in
in comparison
Figure
with 4 and
their Figure 5(a) experienced
participations in exchanges,a due decrease
to theinexistence
the number of NACEdonations
of repeated codes to which
to thethey
same donate
areas.
in comparison with their participations in exchanges, due to the existence of repeated donations to
the same areas. For instance, category 24 (metallurgy) donates 67 times to 14 different sectors, among100% diversity in its donations to 6 different areas.
On the other hand, code 20 (manufacture of chemicals) highlighted by being the greatest
recipient in Figure 4; however, Figure (b) indicated that the receptions in this area stemmed only from
14 different sectors, of which 91% related to NACE codes 20 (chemicals), 24 (basic metals), 35
Sustainability 2020, 12, 952 11 of 24
(electricity, gas, steam and air conditioning) and 19 (coke and refined petroleum products). Instead,
the high number of participations of code 01 (agriculture) as a recipient from different donors was
dueFor
to instance,
the variety of sectors
category producing waste
24 (metallurgy) donates that
67 can betoused
times to fertilize
14 different soils.among
sectors, This trend
whichiscode
consistent
23 (other non-metallic mineral products) highlights as a recipient with 21 exchanges.
with many research studies aimed at assessing the suitability of a variety of waste types stemming This fact is
exacerbated
from different in those areas
sources participating
to perform in less synergies,
as fertilizers, such[30],
such as iron as code 16 (wood),
volcanic rockswhich
[31], had a 100%
coffee [32], wine
diversity in its donations
[33] or seaweed and fish [34]. to 6 different areas.
(a)
(b)
Figure 5. (a) Number of different recipient areas per donor NACE code (2 digits) (b) Number of
Figure 5. (a) Number of different recipient areas per donor NACE code (2 digits) (b) Number of
different donor areas per recipient NACE code (2 digits).
different donor areas per recipient NACE code (2 digits).
On the other hand, code 20 (manufacture of chemicals) highlighted by being the greatest recipient
in The validity
Figure of the
4; however, synergies
Figure between
2b indicated donor
that the and recipient
receptions companies
in this area stemmed only wasfrom
further analyzed by
14 different
determining their Phi
sectors, of which 91%correlation coefficients,
related to NACE codes whose values proving
20 (chemicals), 24 (basic to be statistically
metals), significant
35 (electricity, gas, are
compiled
steam andin Table 3. The implications
air conditioning) and 19 (coke of and
these results
refined differedproducts).
petroleum from those of previous
Instead, the highanalyses,
number since
of correlation
high participations of code 01 are
coefficients (agriculture)
associated as with
a recipient from different
exclusivity donors
rather than was due
capacity fortoestablishing
the variety a lot
of sectors producing
of synergies. The greatestwaste that can of
exponents bethis
usedsituation
to fertilize
aresoils. This trend
exchanges 26–26 is (manufacture
consistent withofmanycomputer,
research studies aimed at assessing the suitability of a variety of waste types stemming
electronic and optical products) and 47–31 (Retail trade, except for motor vehicles and motorcycles— from different
sources to perform as fertilizers, such as iron [30], volcanic rocks [31], coffee [32], wine [33] or seaweed
manufacture of furniture), which only favored exchanges with each other and, therefore, resulted in
and fish [34].
the highest possible correlation coefficient. By contrast, donor companies with codes 11 (manufacture
The validity of the synergies between donor and recipient companies was further analyzed by
of beverages) and 24 (manufacture of basic metals) diversified their synergies a lot, thereby leading
determining their Phi correlation coefficients, whose values proving to be statistically significant
to weaker correlations.
are compiled in Table 3.Hence, the resultsofinthese
The implications Table 3 provide
results differedan excellent
from those ofcomplement to the data
previous analyses,
depicted in Figure 3 and Figure 4, since they enable moving from the quantitative
since high correlation coefficients are associated with exclusivity rather than capacity for establishing characteristics of
exchanges to their representativeness.
a lot of synergies. The greatest exponents of this situation are exchanges 26–26 (manufacture of
computer, electronic and optical products) and 47–31 (Retail trade, except for motor vehicles and
motorcycles—manufacture of furniture), which only favored exchanges with each other and, therefore,
resulted in the highest possible correlation coefficient. By contrast, donor companies with codes 11
(manufacture of beverages) and 24 (manufacture of basic metals) diversified their synergies a lot,
thereby leading to weaker correlations. Hence, the results in Table 3 provide an excellent complement
to the data depicted in Figures 3 and 4, since they enable moving from the quantitative characteristics
of exchanges to their representativeness.Sustainability 2020, 12, 952 12 of 24
Table 3. Statistically significant Phi correlation coefficients between donor and recipient NACE codes
(2 digits).
Donor NACE Recipient NACE (Correlation Coefficient)
01 03 (0.149); 15 (0.219); 16 (0.096); 38 (0.110)
03 01 (0.173); 03 (0.143); 32 (0.173); 42 (0.088)
05 23 (0.128)
06 09 (0.351); 10 (0.132)
08 10 (0.214)
09 01 (0.100); 24 (0.103)
10 01 (0.128); 10 (0.183); 11 (0.174); 38 (0.124)
11 10 (0.091); 11 (0.097); 16 (0.126); 46 (0.274); 82 (0.313)
13 32 (0.631)
16 06 (0.229); 16 (0.196); 37 (0.284)
17 20 (0.101); 39 (0.191); 52 (0.098)
18 38 (0.145)
19 20 (0.100*); 35 (0.123); 82 (0.089); 84 (0.177)
20 20 (0.154); 25 (0.178); 35 (0.108)
21 03 (0.120)
22 22 (0.217)
23 18 (0.239); 41 (0.107)
24 07 (0.161); 23 (0.225); 30 (0.114); 42 (0.102); 93 (0.114)
25 22 (0.174); 38 (0.113); 43 (0.405)
26 26 (0.894)
27 22 (0.174); 27 (0.329)
28 24 (0.146); 38 (0.205)
29 22 (0.217)
31 01 (0.154)
32 20 (0.095)
35 19 (0.169)
36 01 (0.154)
37 38 (0.113)
38 16 (0.116); 21 (0.290); 37 (0.175); 42 (0.175)
39 17 (0.209)
42 42 (0.175); 43 (0.498)
43 28 (0.405); 38 (0.113); 42 (0.138)
47 31 (1.000)
49 42 (0.255)
56 19 (0.094); 38 (0.242)
82 32 (0.445)
96 32 (0.445)
Subanalysis Using 4-digit NACE Codes
A more exhaustive breakdown of the data through the 4-digit NACE codes of the companies is
provided in Table 4. This subanalysis revealed that the production of electricity (35.11) appeared in 99
of the 496 exchanges. This is in line with the findings of Rattner and Garimella (2011) [35], who found
that there was sufficient waste heat from power plant outlet streams to satisfy all the USA space
and water heating needs. Other important areas were the manufacture of basic iron and steel and of
ferro-alloys (24.10) with 61 participations, the manufacture of refined petroleum products (19.20) with
56 and the manufacture of cement (23.51) with 46. This contrasts with the results obtained for the
2-digit NACE codes, whereby the chemical industry (20) was in the first place. This singularity was
due to the disaggregation of this economic area into multiple codes, such as 20.11 (industrial gases),
20.12 (dyes and pigments), 20.13 (other inorganic basic chemicals), 20.14 (other organic basic chemicals)
or 20.15 (fertilizers and nitrogen compounds). Instead, the emergence of 19.20 (manufacture of refined
petroleum products) when considering 4 digits was a consequence of the division of the manufactureSustainability 2020, 12, 952 13 of 24
of coke and refined petroleum products (19) into only two categories, which favored the concentration
of cases for this particular code.
Table 4. Ranking of business areas according to their total and interarea frequency as donors
and recipients.
As a Donor As a Recipient
NACE Code
Frequency Interarea Frequency Frequency Interarea Frequency
35.11 59 24 45 17
24.10 42 15 20 6
19.20 30 13 27 13
10.81 21 14 1 1
17.11 13 8 4 4
20.12 13 7 7 5
20.13 12 5 15 7
24.42 12 8 6 5
20.11 11 7 11 7
38.21 11 9 18 17
10.32 10 8 1 1
06.10 8 8 3 3
23.51 8 7 38 11
20.15 9 5 27 16
20.14 5 5 17 10
23.61 10 1 12 7
01.13 1 1 11 6
01.50 1 2 5 5
01.10 1 6 8 8
35.21 4 4 10 8
The predominant trio of areas according to the 4-digit NACE code, namely 35.11 (production of
electricity), 24.10 (manufacture of basic iron and steel and of ferro-alloys) and 19.20 (refined petroleum
products), persisted when exploring the frequency of exchanges per donor, with remarkable
differences with subsequent codes. The main exception to this trend was 10.81 (manufacture of sugar),
which performed as a donor in 21 exchanges addressed to 14 different sectors. In this vein, code 35.11
(production of electricity) highlighted by both its centrality and diversity, since its 59 donations were
distributed across 24 different sectors. By contrast, 24.10 (basic iron and steel) was less diverse due to
the repeated linkages with the same areas, such as its 12 donations to the manufacture of cement.
The business area with the highest number of exchanges as a recipient remained 35.11. However,
the differences between the 2–3 most frequent codes and the remaining ones was not so abrupt as
in the case of exchanges per donor, which is logical due to the versatility of some types of waste in
terms of new uses. Agricultural companies did not highlight when considering the 4-digit NACE
codes, due to their aforementioned distribution across different activities such as 01.13 (vegetables and
melons, roots and tubers) or 01.50 (mixed farming). One of the most striking cases at this stage of the
study was the presence of 38.21 (treatment and disposal of non-hazardous waste), which performed
sixth as the sector with more receptions registered (18) and almost 100% diversity (17 different origins),
as a result of its capacity for admitting both organic and inorganic waste. Another example of diversity
was 01.10 (growing of non-perennial crops), whose 8 exchanges were with 8 different business areas.
These cases illustrate how versatile some areas are when it comes to make new uses of a variety of
types of waste, thereby providing them with different business opportunities to exploit.
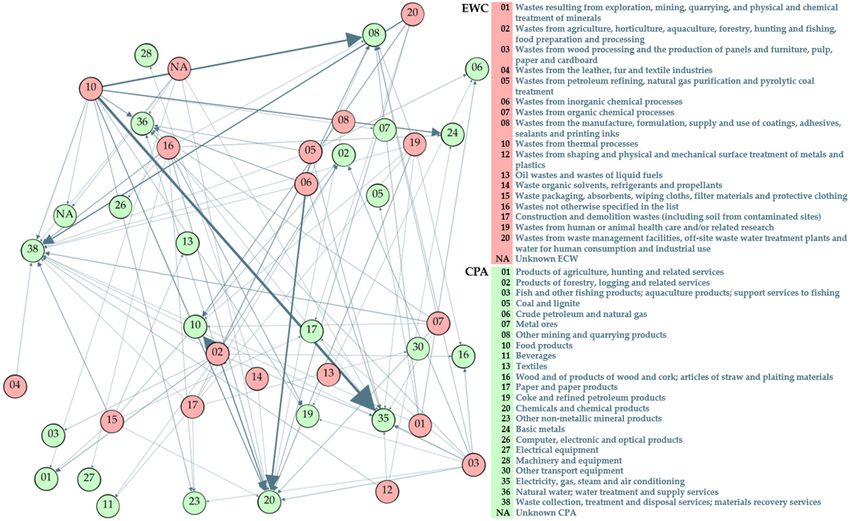
3.2. Analysis According to Material Exchanges (EWC and CPA Codes)
Similarly to the previous subsection, the asymmetric row plot (Figure 6) yielded by a simple
correspondence analysis enabled exploring the relationships between waste (EWC code) and new
uses (CPA code). In this case, EWC 14 (organic solvents, refrigerants and propellants) and CPA 28Sustainability 2020, 12, 952 14 of 24
Sustainability 2020, 12, 952 14 of 24
(machinery and equipment) were very far from the origin of the chart, which indicated their almost
null
null compatibility
compatibility with
withthe
theremaining
remainingwaste
wastetypes
typesand
andnew
newuses.
uses.OnOnthe contrary,
the waste
contrary, types
waste such
types suchas
07 (organic
as 07 chemical
(organic chemicalprocesses) oror1919(human
processes) (humanororanimal
animalhealth
healthcare)
care) highlighted
highlighted by their versatility,
by their versatility,
lacking narrow or specific new uses.
lacking narrow or specific new uses.
Figure 6.
Figure 6. Relationships
Relationshipsbetween
betweendonor
donorand
andrecipient
recipientEWC
EWC and
andCPA
CPAcodes (2 (2
codes digits) in in
digits) thethe
form of an
form of
asymmetric
an rowrow
asymmetric plot (row
plot principal
(row coordinates
principal and
coordinates column
and columnstandardized coordinates).
standardized coordinates).
The sharp angles formed between the origin of Figure 6 with the combos EWC 02 (agriculture)
–CPA 10
–CPA 10 (food
(food products)
products) and and EWC
EWC 10 10 (thermal
(thermal processes)–CPA 35 (electricity, (electricity, gas, steam and air
conditioning) suggested
suggestedthat thatthese
thesewerewere thethestrongest
strongestinteractions
interactionsbetween
betweenwaste and and
waste new new uses. uses.
This
inference
This was was
inference confirmed
confirmed by the thick
by the thickarrows
arrows connecting
connecting these
theseelements
elementsininthe
the network
network diagram
represented in in Figure
Figure7.7.Other
Otherexamples
examples of ofpowerful
powerful links were
links EWC
were EWC10 (thermal processes)
10 (thermal and CPA
processes) and
08 (mining
CPA 08 (miningand andquarrying
quarryingproducts)
products) or or EWC EWC 0606(petroleum
(petroleumrefining,
refining,gasgaspurification
purification and and coal
treatment) and
treatment) andCPA CPA2020(chemicals),
(chemicals),asas shown
shown in in Figure6 6and
Figures and 7. Figure 7. Moreover,
Moreover, theand
the intensity intensity and
frequency
frequency
of the linksof in the
whichlinks
EWC in which EWC
20 (waste 20 (waste management)
management) and CPA 38 (waste and CPA 38 (waste
collection collectionwere
and treatment) and
treatment)was
involved were alsoinvolved
remarkable.was also remarkable.
suggested by
As suggested by Figure
Figure7,7,EWCs
EWCs10 10(thermal
(thermalprocesses)
processes)and and0202(agriculture)
(agriculture)werewerethethetwotwo types
types of
of waste
waste mostmost widely
widely involved
involved in the
in the network,
network, to the
to the extent
extent thatthat
theythey participated
participated in 29%in 29% (144/496)
(144/496) and
and (102/496)
21% 21% (102/496)of theof the exchanges
exchanges registered.
registered. The distribution
The distribution of wasteofaccording
waste according
to donor to and donor and
recipient
recipient NACE codes is explored in Figure 8(a). From the point of view
NACE codes is explored in Figure 8a. From the point of view of donors, the importance of EWC 16 of donors, the importance of
EWC 16not
(waste (waste not otherwise
otherwise specifiedspecified
in the list) inwasthe list) wassince
logical, logical,thissince
codethis code agglutinates
agglutinates every type every type
of waste
of waste
that is notthat is not in
included included in other categories.
other categories. The preponderance
The preponderance of EWC 10
of EWC 10 (thermal (thermalpointed
processes) processes)out
pointed
to out to the of
the importance importance of thermal
thermal processes in processes
the productionin theactivities
production activitiesindustrial
of different of different industrial
sectors, such
sectors,
as such as
extraction, extraction,
chemicals, chemicals,
metal, metal,
electricity, electricity,
paper, wood or paper, wood
cement. or cement.
Next was EWC Next02 was EWC 02
(agricultural
(agricultural
and food waste), and which
food waste), which were
were generated by generated
8 different by donor 8 different donorpresence
areas. Their areas. Their
in thesepresence
terms in
is
these terms is
interesting, interesting,
since sincecompanies
agricultural agricultural companies
were not among were not
the amongdonors
greatest the greatest donors
in Figure in Figure
4. However,
4. However,
the food industrythe food industry
played played an
an important roleimportant
as a donor, role
to asthea extent
donor,oftobeing
the extent of being
responsible forresponsible
61% of the
for 61% of the
exchanges exchanges
in which EWCin 02which EWC 02and
(agricultural (agricultural
food waste) andwas food waste) was involved.
involved.You can also read