What Drives the Covariation of Cryptocurrency Returns? - Amin Shams
←
→
Page content transcription
If your browser does not render page correctly, please read the page content below

What Drives the Covariation of Cryptocurrency Returns?

                                               AMIN SHAMS*
                                               January 3, 2019

                                    Please click here for the latest version

                                                      Abstract
        This paper shows that a single “connectivity” measure proxying for correlated demand shocks
        explains substantial covariation in the cross-section of cryptocurrency returns. I define con-
        nectivity as the degree of overlap in the set of exchanges two cryptocurrencies trade on. Due to
        geographical and other restrictions, these exchanges have distinct investor bases. I show that
        connected currencies exhibit substantial contemporaneous covariation. In addition, currencies
        connected to those that perform well outperform currencies connected to those that perform
        poorly by 71 (214) basis points over the next day (week). Evidence from new exchange list-
        ings and a quasi-natural experiment exploiting the shutdown of Chinese exchanges shows that
        the results cannot be explained by endogenous sorting of currencies into exchanges. Using
        machine learning techniques to analyze social media data, I find that the demand effects are 40
        to 50% larger for currencies that rely more heavily on network externalities of user adoption.
        This amplified effect is consistent with the notion that demand for a cryptocurrency originates
        not only from investment motives but also the user adoption that affects the fundamental value
        of these assets.

   *Iam very grateful for the advice and guidance I have received from members of my dissertation committee:
John M. Griffin (co-chair), Sheridan Titman (co-chair), Carlos Carvalho, Cesare Fracassi, Travis Johnson, and Samuel
Kruger. I would also like to thank Hassan Afrouzi, Aydogan Alti, Tin Dinh, Iman Dolatabadi, Michael Sockin, and
Aleh Tsyvinski for their suggestions and comments. Data for the project were graciously provided by Integra FEC. I
would also like to acknowledge financial support in the form of a doctoral fellowship from the Blockchain Initiative at
McCombs School of Business, partly funded by a generous donation from Ripple Labs Inc.
McCombs School of Business, University of Texas at Austin.
Email: shams@utexas.edu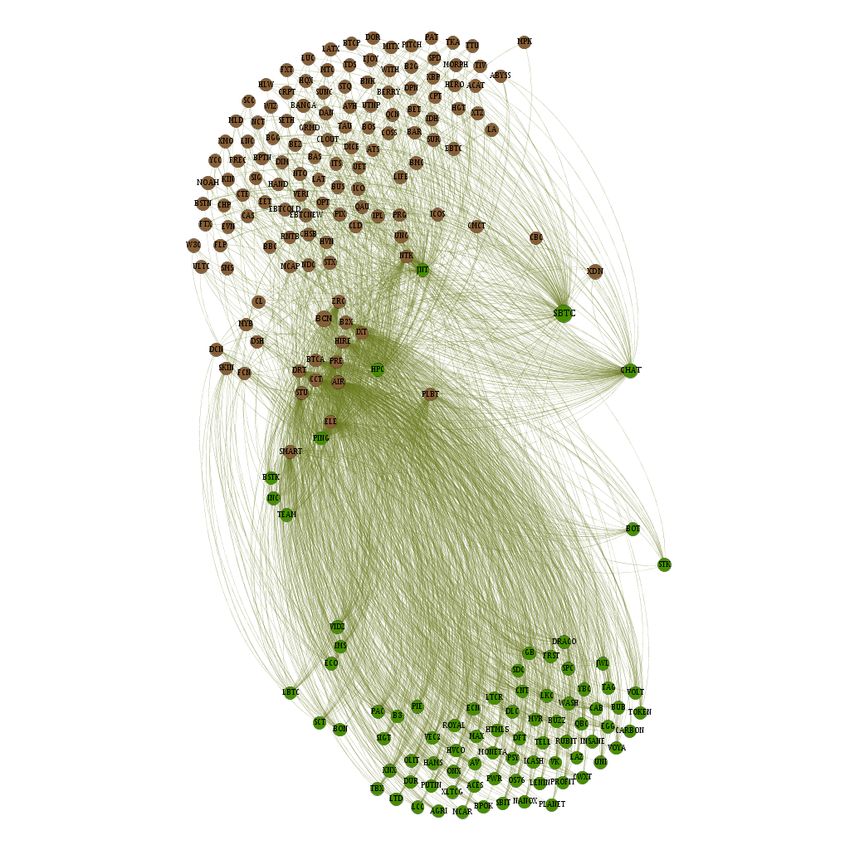
Investment in cryptocurrencies has soared rapidly. Numerous FinTech startups have been funded
using blockchain technology, and major financial institutions have developed a significant interest
in the market. Currently, over 1,600 investable cryptocurrencies trade on more than a hundred
exchanges around the world. Yet, little is known about the return structure of these digital assets.
Importantly, cryptocurrencies exhibit systematic variations in their daily and weekly returns be-
yond what can be explained by a single market factor. The central question of this paper is what
forces explain this return structure.
   I find that overlapping exposure to similar demand shocks creates a strong covariation struc-
ture in cryptocurrency returns that is much larger than the effect of technological characteristics
and supply-side factors. Cryptocurrencies trade on numerous exchanges with different investor
bases, and due to legal restrictions and other frictions between these exchanges, shocks to the in-
vestor base of an exchange are likely to be absorbed by currencies listed on that exchange. For
example, a large swing in the price of Ripple, a large cryptocurrency heavily traded on South
Korean exchanges, can spill over to other currencies listed in Korea by impacting the wealth of
Korean crypto-traders or by changing their sentiment. Consistent with this intuition, using data
on a rich set of cross-listed cryptocurrencies, I find a strong exchange-specific component in cryp-
tocurrencies’ order imbalance; a cryptocurrency’s order imbalance is more related to imbalances
for other currencies on the same exchange than the same currency across other exchanges. This
paper exploits this trading environment to study the implications of such correlated demands for
cryptocurrency returns.
   While the effect of demand pressures on prices exists in traditional asset markets, unique fea-
tures of cryptocurrencies significantly amplify this effect. First, demand shocks can affect the
“fundamental” value of cryptocurrencies. The underlying value of cryptocurrencies depends on
network externalities that are driven by the participation of the user and developer community on
the cryptocurrency platforms [Sockin and Xiong (2018) and Cong, Li, and Wang (2018)]. There-
fore, buying or selling pressures due to a wealth shock can affect the fundamental value of cryp-
tocurrencies if the pressure comes from potential users. Moreover, because using the features of

                                                 1
a cryptocurrency ecosystem often necessitates holding the cryptocurrency, the user base is inher-
ently interwoven with the investor base.1 In this environment, if the market cannot distinguish
between speculator and user demand, even pure speculative demand can have a substantial effect
on prices beyond what is observed in traditional markets, especially given the opaque fundamen-
tals of these assets. Importantly, there is variation in the degree to which different cryptocurrencies
derive value from their user and developer community. If demand shocks are amplified through
this novel channel, currencies that derive more value from their user community should exhibit a
significantly larger comovement when exposed to similar demand shocks.
    I examine these implications using a rich exchange-level trading data on a wide cross-section
of cryptocurrencies merged with technical characteristics and relevant social media content. To
proxy for the degree of overlapping exposure to demand shocks, I create a pairwise “connectivity”
measure based on cryptocurrencies’ trading locations. Cryptocurrencies are often cross-listed on
multiple exchanges. Given the correlated demand on these exchanges, two currencies that trade
heavily on the same set of exchanges (“connected” currencies) are exposed to similar demand
shocks. The measure takes a value between zero and one, where one indicates that the share of
monthly volume of two currencies is perfectly identical across different trading platforms, zero
indicates they trade in entirely different locations, and a value in between indicates the extent of
partial overlap.
    Using the connectivity measure as a proxy for overlapping demand is motivated by three fea-
tures of the cryptocurrencies’ trading environment. First, due to geographical restrictions and
different governance rules, there is heterogeneity in the types of investors sorted into different
exchanges. Second, these exchanges are segregated due to barriers to capital transfer and fric-
tions to register on a large number of exchanges.2 Therefore, demand shocks to an exchange’s
investor base are likely to be absorbed by currencies listed on that exchange. Third, there is wide
1
  For example, to develop decentralized applications on the EOS platform, one of the largest cryptocurrency ecosys-
  tems, participants need to hold EOS tokens.
2
  For example, Makarov and Schoar (2018) and Kroeger and Sarkar (2017) document a sizable cross-exchange arbi-
  trage in cryptocurrency prices and attribute this arbitrage to different investor bases and frictions in moving capital
  across exchanges.

                                                           2
variation in the market share of different cryptocurrencies on different exchanges, which creates
cross-sectional heterogeneity in the exposure of cryptocurrencies to different investor bases and to
other currencies.3
My main set of results examines if the connectivity measure can explain cryptocurrencies’ co-
movements. I estimate a regression of within-month pairwise correlation of market model adjusted
daily returns on lagged connectivity and directly control for similarity in trading volume, number
of exchanges listing the currency, and other characteristics. I find that two cryptocurrencies that
have a one-standard-deviation higher connectivity, exhibit 0.19 standard deviations higher return
correlation. The results are not driven by small and less liquid currencies and hold strongly for
larger currencies. Lagged connectivity alone explains around 18% of the decile spread in the next
month’s realized pairwise correlations.
To formalize the pricing implications of the connectivity, I examine how the price of a cryp-
tocurrency moves in relation to the weighted average returns of its portfolio of connected curren-
cies. Using Fama-MacBeth regressions, I find that cryptocurrencies whose connected portfolio
has one percent higher daily return exhibit 32 basis points higher contemporaneous returns in the
cross-section. The effect increases monotonically with the time horizon. For instance, at a weekly
horizon, the magnitude is 57 basis points.
The observation that the effect increases in time horizon is consistent with investors’ underre-
action to the observed comovement structure. I find that the returns of connected currencies have
strong positive cross-predictability after controlling for currencies’ own lagged returns. A long-
short zero-cost trading strategy that buys currencies in the top decile of the previous day returns of
the connected portfolio, sells those in the lowest decile, and holds the portfolio over the next day,
generates a before-fee daily return of 71bp. The predictability lasts for longer horizons, is robust
to different portfolio constructions, and cannot be explained by non-synchronous trading.
The observed return comovements could alternatively be attributed to supply-side factors. A
3
For example, in the first half of 2018, around 23% of the trade volume of Ripple, the third largest cryptocurrency at
the time of writing, occurred on a South Korean exchange. At the same time, the exchange accounted for only 2%
and 3% of trading volume of Bitcoin and Ether, the first and second largest cryptocurrencies, respectively.
3growing literature ties the intrinsic value of cryptocurrencies to underlying technology and pro-
duction (mining) costs. For example, Pagnotta and Buraschi (2018) relate the price of Bitcoin to
the supply of computing resources.4 Similar to demand shocks, supply-side factors have distinct
testable implications for the comovement of the returns. For example, highly computationally in-
tensive currencies should exhibit a strong comovement due to similar exposure to news about tech-
nical advances in computing power.5 Moreover, legal shocks or changes in people’s perception of
different technologies can create comovement in currencies with similar cryptographic algorithm,
transaction speed, privacy level, legal requirements, and underlying token industry. Importantly,
if these characteristics also determine the sorting of currencies into different exchanges, then a
spurious correlation between connectivity and comovement can arise in the data.
I examine the importance of these characteristics in a similar setting. The results show that
pairs of currencies with similar size comove more. Furthermore, cryptocurrencies can be broadly
divided into two categories: coins and tokens.6 I find that coins comove more with other coins, and
tokens with other tokens. Additionally, coins with the same consensus mechanism and tokens in
the same industry have statistically significantly higher comovement. However, the combination
of trading volume, hashing algorithm, consensus mechanism, token industry, and a host of other
characteristics explains only 8.5% of the decile spread in pairwise correlations, which is less than
half of what can be explained by the connectivity measure.
The endogeneity of the connectivity measure is a potential concern. If cryptocurrencies with
similar unobservable characteristics are more likely to be listed on the same exchanges, then it
could be the underlying fundamentals, and not the demand shocks, driving the relationship between
connectivity and comovement. I address this concern using two tests. First, in a stacked-cohort
4
Hayes (2017) ties the value of Bitcoin to the marginal cost of production, and Garcia et al. (2014) calculate a lower
bound on the fundamental value of Bitcoin by estimating the electricity cost of mining. In contrast, Liu and Tsyvinski
(2018) show that neither proxies for supply factors nor exposures to stocks, currencies, and commodities can explain
the returns of major cryptocurrencies.
5
For example, cryptocurrencies have different “consensus mechanisms.” The proof of work (POW) consensus mecha-
nism requires continually increasing computing power and electricity, but the proof of stake (POS) algorithm requires
significantly less resources. This makes POW currencies more susceptible to news about computing advancements
or electricity prices.
6
Coins are closer to traditional currencies, whereas tokens can provide users with future access to a specific product
or service.
4difference-in-differences analysis, I observe that the comovements of currencies cross-listed on a
new exchange significantly increase with the incumbent currencies relative to a matched sample,
whereas no pre-trend is observed. Second, I use a quasi-natural experiment that exploits an ex-
ogenous shock to the trading locations due to the shutdown of Chinese exchanges by the Chinese
government. Using the pre-event implied changes in the connectivity as an instrument for the
actual post-event changes, I find that as the investor bases of two currencies converge by one stan-
dard deviation, their return correlation goes up by 0.17 standard deviations. These findings suggest
that exogenous variations in trading location cause statistically and economically large changes in
cryptocurrencies return structure.
The question remains as to what extent the network externality effect of the user and developer
community contributes to these sizable effects. Cryptocurrencies vary in the degree to which they
rely on the community of users and developers.7 Buying and selling pressures in the market,
if perceived as coming from the potential user base, should affect the underlying value of more
community-based currencies to a larger extent. Therefore, exposure to overlapping demand shocks
should increase the comovement of community-based currencies to a larger extent.
I use comments on Reddit, a social news website, to divide the cross-section of cryptocur-
rencies into high- and low-community-based. I collect currency-specific comments and classify
them using two methods. The first method relies on features extracted using a machine learn-
ing technique, and the second method uses the frequency of the most important feature extracted
from the first method, “community,” to classify the comments. I show that these measures have
persistent information content and are relatively accurate reflection of the reliance of major cryp-
tocurrencies on the community. Moreover, they conform well with the theoretical characterization
of the community effect in the literature; consistent with the endogenous user adoption effect in
Cong, Li, and Wang (2018), currencies identified as more community-based show significantly
higher volatility. I test if the interaction of being a high-community-based cryptocurrency and the
7
For example, Ethereum provides a platform for its community to develop and use smart contracts. The users, devel-
opers, and investors are largely interwoven on the Ethereum platform and form a “community.” On the other hand,
these stakeholders are not as interlinked for Ripple. Ripple primarily expands through contracted software engineers
and grows revenue by signing contracts directly with large banks as their customers.
5connectivity can explain return comovement. I find that overlapping exposure to demand shocks
increases the comovement of high-community-based cryptocurrencies by near 40% to 50% more
than other currencies depending on which measure to use. This finding suggests that a sizable part
of the results can be attributed to the amplification effect of the novel features of the cryptocurrency
market.
This paper contributes to a fast-growing body of literature on cryptocurrencies. Unique features
of cryptocurrencies suggest that understanding investor/user behavior can be a starting point to
understanding the valuation and price movements of these assets. To the best of my knowledge,
this paper is the first to examine the driving forces behind cryptocurrency comovements and to
document a strong amplifying effect of the externalities of users’/investors’ decisions in the market.
My findings suggest that a connectivity measure summarizing the structure of investor demand
has substantially larger explanatory power for the comovement of cryptocurrency returns than
all other characteristics and technological features combined. My paper also contributes to an
extensive literature on return comovements by showing a new channel in which the demand-driven
comovement can be significantly amplified in an environment where investment decisions involve
network externalities and fundamentals are opaque. The rest of the paper is organized as follows.
Section I discusses the institutional background and the literature. Section II overviews the testable
hypotheses, the empirical design, and data. Section III describes the correlated demand within
different exchanges. Section IV examines the comovement structure of the returns. Section V
addresses the endogeneity concern. Section VI analyzes the network externality effect. Section
VII concludes.
I. Institutional Background and Related Literature
I.A Institutional Background
To motivate the empirical design, this section describes the institutional details of the cryptocur-
rencies’ trading environment based on which I construct the measure of similarity in the investor
6base. First, I highlight variation in governance rules and restrictions that are likely to attract dif-
ferent types of investors to different trading platforms. Second, I discuss capital barriers and other
frictions that lead to segregation of these platforms. Finally, I examine variation in the market
share of different cryptocurrencies on different platforms that is the source of cross-sectional het-
erogeneity in my setting.
I.A.1 Variation in Cryptocurrencies Trading Platforms
Cryptocurrencies trade on more than a hundred non-integrated trading platforms. My sample con-
tains data on 74 of the most liquid ones. Despite their similarity at first glance, these exchanges
differ significantly in many dimensions that may appeal to different types of investors. The main
differences are discussed below.
Geographical Restrictions. Figure 1 shows that there is a wide dispersion in the geographical
distribution of cryptocurrency exchanges. These exchanges are registered in nearly 30 different
countries, with a large number of them in the US, China, UK, Japan, South Korea, and Russia.
Variation in the country of registration is commonly accompanied by restrictions on market par-
ticipants. For example, Bithumb, a South Korean exchange, only accepts South Korean citizens.
The major Hong Kong-based exchange, Bitfinex, terminated relationships with U.S. banks, there-
fore making it much more difficult for U.S. customers to trade on the exchange. OKEX, another
exchange registered in Hong Kong, does not accept customers from certain countries including
the United States and Hong Kong itself. Regulators in Japan and Hong Kong warned investors
against using Binance, an exchange initially registered in China. Restrictions like these apply to
many other exchanges, which can lead to a wide heterogeneity in the home country of investors on
different trading platforms.
Identity Verification Requirements. Different exchanges require different levels of identity
verifications. Some exchanges, usually those registered in locations such as the Republic of Sey-
chelles and Cayman Islands, have minimal legal restrictions. Other exchanges have strict require-
ments. For example, Coinbase, a US-based exchange, agreed to share customers’ information with
7the Internal Revenue Service (IRS) for tax purposes. Gemini, another exchange based in the US,
requires the Social Security Number (SSN) of customers. Different verification requirements can
attract different types of investors. For example, an institutional investor may choose to trade on an
exchange with stricter restrictions to avoid counterparty risk, while a large cryptocurrency whale
who prefers to keep his or her identity secret is likely to use platforms with fewer requirements.
Limitations on Deposits, Withdrawal, and Use of Fiat Currencies. Some platforms allow
trading with fiat currencies, while some only accept digital currencies. Platforms built on fiat-
like digital currencies, such as Tether, might be more appealing to investors facing cross-country
capital restrictions, while as Griffin and Shams (2018) show they might also bear the risk of re-
deeming these currencies into cash. There is also variation in the fiat monies supported by different
exchanges that can further widen the heterogeneity in investor type on different platforms. For ex-
ample, Kraken accepts multiple fiat currencies including CAD, EUR, GBP, JPY, and USD, while
the exchange Zaif only accepts JPY.
Transaction Fees. Exchanges have different deposit, withdrawal, and transaction fees. The fee
structure can organically sort different types of traders into different platforms. For example, low
trading fee exchanges might be more tailored towards large active traders.
I.A.2 Frictions Across Trading Platforms
Frictions for moving capital across crypto exchanges can lead to segregation of these exchanges.
These frictions can arise due to cross-country capital restrictions, fees, and risks associated with
withdrawals and deposits from and to the exchanges as well as slow confirmation of these trans-
actions. Moreover, costs and risks associated with trading on multiple platforms intensify this
segregation. Several platforms are subject to know-your-customer (KYC) regulations, and even
those that are not may require revealing sensitive information such as wallet addresses used for de-
posit or withdrawal. Among other costs associated with trading on multiple exchanges, the more
platforms that have a customer’s sensitive information, the more likely such information could be
compromised. Therefore, traders might prefer to trade on a limited set of exchanges.
8Such frictions create limits to arbitrage that can lead to sizable cross-exchange price differ-
ences. For example, Makarov and Schoar (2018) and Kroeger and Sarkar (2017) document a
sizable price difference between cryptocurrency exchanges. Due to these frictions, shocks to the
investor base in a trading platform are more likely to be absorbed by currencies listed on that
platform, which leads to correlated demand shocks across currencies listed on the same exchange.
I.A.3 Variation in Share of Cryptocurrencies on Different Exchanges
There is a wide dispersion in the market share (by volume) of cryptocurrencies on different trading
platforms. Large currencies such as Bitcoin and Ether trade on almost all major platforms, though
to varying degrees. Other top coins, such as EOS, Bitcoin Cash, and Ripple, trade on several
exchanges but not all. The market share of these currencies on different exchanges varies from 8%
to 100% for Bitcoin, 0% to 49% for Ether, 0% to 36% for EOS, 0% to 22% for Bitcoin Cash, and
0% to 40% for Ripple.
Figure 2 shows that there is large heterogeneity in the volume share of major currencies (as
a percentage of a currency’s total volume) on major exchanges. For example, in the first half of
2018, around 23% of trade volume in Ripple, the third largest cryptocurrency at the time of writing,
occurred on Bithumb, a South Korean Exchange that is only open to South Korean citizens. Dur-
ing the same time, only 2% of Bitcoin and 3% of Ether volume occurred on Bithumb. Similarly,
OKEX, an exchange registered in Hong Kong, accounted for 29% and 43% of two other major
cryptocurrencies, Litecoin and Ethereum Classic respectively. At the same time, the exchange
handled 12%, 12%, and 8% of Bitcoin, Ether, and Ripple respectively.8 There is an even larger
heterogeneity in market share of smaller currencies. This heterogeneity creates cross-sectional
variation in the exposure of different cryptocurrencies to different investor bases formed on dif-
ferent trading locations. I exploit this variation to quantify the similarity in the investor bases of
cryptocurrencies using a pairwise connectivity measure.
8
Figure IA1 shows this variation as a percentage of exchange volume for the 15 largest exchanges in my sample. For
example, a large part of transactions on the two major South Korean exchanges, Bithumb and Coinone, belongs to
Ripple.
9I.B Related Literature
This paper is related to three different strands of literature. First, my paper contributes to a fast-
growing literature on cryptocurrencies. Previous studies in this literature have examined different
aspects of the cryptocurrency market and the blockchain technology including broad economics
of cryptocurrencies [Böhme et al. (2015), Harvey (2016), Raskin and Yermack (2016), Schilling
and Uhlig (2018), and Biais et al. (2018)], empirical asset pricing properties of cryptocurrencies
[Liu and Tsyvinski (2018) and Hu, Parlour, and Rajan (2018)], market manipulation and illegal
activities [Foley, Karlsen, and Putnin, š (2018), Li, Shin, and Wang (2018), Gandal et al. (2018),
and Griffin and Shams (2018)], mining activities and transaction costs [Easley, O’Hara, and Basu
(2018), Cong, He, and Li (2018), and Pagnotta and Buraschi (2018)], and Initial Coin Offerings
[Kostovetsky and Benedetti (2018), Howell, Niessner, and Yermack (2018), Lee, Li, and Shin
(2018), Li and Mann (2018), and Malinova and Park (2017)]. Most related to my paper, Gandal
and Halaburda (2016), Sockin and Xiong (2018), and Cong, Li, and Wang (2018) relate the value of
cryptocurrencies to the network externality effect of users’ participation on the platform. Moreover,
Kroeger and Sarkar (2017) and Makarov and Schoar (2018) show a sizable price difference across
Bitcoin exchanges and attribute that to different investor bases and frictions to move capital. To the
best of my knowledge, my paper is the first to examine the driving forces behind cryptocurrencies’
comovement structure and document a strong amplification effect through the network externalities
of users’/investors’ decisions.
Second, this study is also closely related to the literature on demand-driven comovement. A
broad literature in finance relates such comovement to common ownership and investment habitat
[Barberis, Shleifer, and Wurgler (2005) and Bartram et al. (2015)], wealth effect [Kyle and Xiong
(2001)], correlated liquidity shocks and trading behavior [Greenwood and Thesmar (2011) and
Greenwood (2007)], and portfolio re-balancing [Fleming, Kirby, and Ostdiek (1998) and Kodres
and Pritsker (2002)]. Most related to my paper, Anton and Polk (2014) “connect” stocks through
mutual fund ownership and show that common ownership leads to excess comovement. My paper
contributes to this literature by showing a new channel in which the comovement could be signifi-
10cantly amplified in a market where investment decisions have network externalities and assets have
opaque fundamentals.
Finally, this paper relates to the literature on cross-listing that shows stocks tend to comove
more with other stocks listed in the same location. Froot and Dabora (1999) and De Jong, Rosen-
thal, and Van Dijk (2009) show that dual-listed stocks tend to comove more with local stocks.
Moreover, Chan, Hameed, and Lau (2003) and Brealey, Cooper, and Kaplanis (2009) show that
changes in trading location significantly increases the comovement of a stock with the new market.
Gagnon and Karolyi (2010) show that such an effect can lead to strong price deviations across
markets.
This paper builds on these strands of literature and extend them by characterizing the return
structure of a rich set of cross-listed assets in a fast-growing market. I present empirical evidence
on a novel channel that significantly amplifies the effect of local demand shocks on prices and
creates a strong comovement structure in cryptocurrency returns.
II. Testable Hypotheses, Empirical Framework, and Data
II.A Hypothesis Development
My empirical design is based on the premise that investors trade in a correlated manner across
cryptocurrencies in their investable set. This assumption is informed by a broad literature on co-
movement as discussed above. Among other explanations, this pattern can arise in the cryptocur-
rency market due to country-specific sentiments or wealth and liquidity shocks that trigger trading
across a wide set of cryptocurrencies. For example, a large swing in the price of Ripple can impact
the wealth of South Korean crypto-traders who heavily trade Ripple, which can in turn spill over
to other currencies listed in South Korea. As in Hasbrouck and Seppi (2001), such an effect could
be reflected as commonalities in the order imbalance. My first hypothesis tests this assumption.
Hypothesis 1: If investors have correlated demands across cryptocurrencies in their in-
vestable set, a common component should drive the order imbalance of cryptocurrencies
listed on the same exchange, even after controlling for the imbalance of the same currency
11on other exchanges.
The next hypothesis describes how overlapping exposure to such correlated demand can drive
cryptocurrencies’ comovement. The novel features of cryptocurrencies can cause demand shocks
to have substantial effects on returns. The underlying value of cryptocurrencies depends on the
externality effect of users’ participation on their platform [Sockin and Xiong (2018)]. Impor-
tantly, because using the features of a cryptocurrency ecosystem often necessitates developers and
users to hold tokens, the user base of a cryptocurrency is inherently interwoven with its investor
base. For example, to develop decentralized applications on the EOS platform, one of the largest
cryptocurrency ecosystems, participants need to hold EOS tokens. As theoretically motivated by
Cong, Li, and Wang (2018), agents decide how many cryptocurrencies to hold depending on both
their user motive and investment motive. In this environment, if the market cannot distinguish
between speculator and user demand, even pure speculative demand can have an amplified effect
on prices. Moreover, opaque fundamentals of cryptocurrencies can further magnify the effect of
demand shocks on prices.9 Therefore, overlapping exposure to demand shocks can create a strong
comovement in cryptocurrencies’ returns.
Hypothesis 2: If investors have correlated demand across cryptocurrencies, currencies that
have similar investor bases should exhibit strong comovement in returns over and above
what can be explained by the similarity in their characteristics. Additionally, exogenous
variation in the investor base should cause changes in the comovement.
The next hypothesis examines the effect of technological features on return comovement. Cryp-
tocurrencies with similar technical features might be exposed to similar fundamental shocks. For
example, highly computationally intensive coins might comove because they are susceptible to
similar news about computing advancements. Moreover, changes in people’s perception of differ-
ent technologies, such as the hashing algorithm or consensus mechanism, can cause a comovement
in the price of cryptocurrencies that possess these features. Likewise, utility tokens might comove
with other utility tokens and equity tokens with other equity tokens because they are exposed to
9
Hirshleifer (2001) discusses that behavioral biases are strongest when information about fundamentals is more sparse.
Kumar (2009) shows that individual investors are more prone to behavioral biases when stocks are harder to value.
In a noisy dynamic rational expectations model, Cespa and Vives (2011) show that asset prices can deviate from their
fundamental values when their fundamental is opaque.
12similar legal shocks.10
Hypothesis 3: If supply side factors and technological features are essential drivers of cryp-
tocurrencies’ underlying value, currencies with similar characteristics should exhibit a higher
return comovement.
The last hypothesis directly examines the role of the network externalities from the commu-
nity of users and developers in amplifying demand shocks. Importantly, there is variation in the
extent to which different cryptocurrencies derive value from the network effect of their user and
developer community. For example, Ethereum provides an open source tool for users and devel-
opers to build applications on top of its platform using smart contracts. The underlying value of
Ether, the main token used on the platform, largely depends on the participation of the community
of users and developers. Similarly, the founder of the EOS, a platform for developing decentral-
ized applications, describes holding the token as: “The token represents people’s involvement in
the community. At the end of the day, once you have a token, it is the community that is going
to be responsible for taking this forward.”11 On the other hand, certain cryptocurrencies have an
underlying business that depends less on the community for growth. For example, Ripple primar-
ily expands its technology through contracted software engineers and grows revenue by signing
contracts directly with large banks as their customers. Users, developers, and investors are not as
interwoven for Ripple. If buying and selling pressures in the market are at least partially perceived
to be from the potential users and developers, the price of cryptocurrencies that highly rely on user
and developer community should react more to such demand pressures. This heterogeneity has a
testable implication for the comovement of cryptocurrencies.
Hypothesis 4: If the externality effect of the user and developer community is an essential source
of cryptocurrencies underlying value, "high-community-based" cryptocurrencies should exhibit a
significantly larger comovement when exposed to similar demand shocks.
The next sections lay out the empirical design to test these hypotheses.
10
A full review of cryptocurrencies’ main technological features used in this paper can be found in Table IAI.
11
TV interview with BBC, December 15, 2017.
13II.B Empirical Framework
II.B.1 Constructing the Connectivity Measure
To proxy for exposure to similar demand shocks, I define Connectivityi,j,t as a pairwise index that
has a negative relationship with the Manhattan distance between the share of trading volume of
currencies i and j across different exchanges:
K
1X
Connectivityi,j,t = 1 − |pi,k,t − pj,k,t | (1)
2 k=1
where pi,k,t is the share of trading volume of currency i in month t that occur on exchange k:
Vi,k,t
pi,k,t = PK (2)
n=1 Vi,n,t
and Vi,k,t is the volume of currency i in month t on exchange k, and K is the total number of
exchanges in my sample. The connectivity measure takes a value between zero and one where one
indicates that the share of monthly volume of two currencies is perfectly identical across different
exchanges, zero indicates they trade on entirely different locations, and a number in between indi-
cates the extent of partial overlap. Given the trading environment described in Section I, a higher
connectivity translates to exposure to more similar demand shocks.
My empirical design requires sufficient cross-sectional heterogeneity in this connectivity mea-
sure. As a first pass, the average cross-sectional standard deviation of the measure is 0.34 and the
mean is 0.27. Figure 3 shows that the connectivity measure can be used to divide the cross-section
of cryptocurrencies into multiple clusters of interconnected currencies and perhaps help tame the
"Wild West" of cryptocurrencies. The figure illustrates a network graph where each node repre-
sents a cryptocurrency, and the edges represent the average monthly connectivity of each pair. A
modularity analysis based on the strength of the connectivity between different nodes divides the
cross-section of cryptocurrencies into several connected clusters as plotted with different colors.
Cryptocurrencies in the same cluster are more likely to be traded on the same set of exchanges and
14be exposed to the same demand shocks.
There is also considerable heterogeneity within members of each cluster. Figure 4 zooms in
on two clusters to examine this matter. For clarity, the graph only shows intra-cluster connections.
As shown in both panels, there is a wide variation in the connectivity of members of a cluster with
members of other clusters. This pattern arises because cryptocurrencies are cross-listed on several
different exchanges, and as a result, there is wide variation in the connectivity even among cur-
rencies that share a trading location. My connectivity measure summarizes this complex structure
into a pairwise index.
II.B.2 Relationship Between Return Comovement and Connectivity
The baseline analysis examines how variation in connectivity measure explains cross-sectional
variation in pairwise comovements of cryptocurrencies. I measure comovement using within-
month pairwise correlation of market model return residuals. Cryptocurrency exchanges are open
24/7 and do not have an opening or closing auction. To increase precision and avoid choosing an
ad hoc closing time, market betas, return residuals, and pairwise correlations are calculated using
rolling windows of 24-hour returns that move forward every hour. The calculation proceeds in sev-
eral steps. First, volume-weighted cryptocurrency market return is calculated using the currencies’
previous 24-hour trading volumes as the weights. Second, return residuals of the market model are
estimated using recursive time-series regression of individual currencies’ returns on the market re-
turns. Finally, the comovement is calculated as the within-month correlation of the 24-hour return
residuals for all pairwise combinations. I exclude currency pairs for which the pairwise returns are
missing for more than 50% of the times in a given month.
I estimate a dyadic panel regression of return correlations on one-month lagged connectivity
as reported in Equation (3). Previous studies including Koch, Ruenzi, and Starks (2016), Israelsen
(2016), Anton and Polk (2014), and Kallberg and Pasquariello (2008) have used such a dyadic
setting to examine comovement in stock returns and liquidity. I correct the standard errors with
dyadic clustering approach of Cameron and Miller (2014), which takes into account that error
15terms for i-j pair might be correlated with those of any other currency pair that includes either i or
j. All non-dummy variables are standardized by subtracting the mean and dividing by the standard
deviation. Note that the unit of observation is currency pair per month.
Corri,j,t =β0 + β1 Connectivityi,j,t−1 + β Char Similarityi,j,t−1
Char
+ δt + εi,j,t (3)
Char
Similarityi,j,t is a vector of binary and continuous variables which directly control for sim-
ilarity in characteristics. If both currencies have the same categorical characteristic, the relevant
variable takes the value of one, and zero otherwise. For example, Similarity CoinT oken takes the
value of one if the currencies are either both coins or both tokens. Furthermore, for continuous
characteristics, the similarity variable is defined as the negative of the absolute difference in the
percentile rank-transformed value of that characteristic:
Char Char Char
Similarityi,j,t = −|P ctli,t − P ctlj,t | (4)
where Char is a continuous currency characteristic such as total trading volume. The next section
describes the data for implementing the empirical design.
II.C Data
I construct a comprehensive dataset on cryptocurrencies by combining three types of data. The first
type contains rich exchange-level trading and pricing data on a wide cross-section of cryptocur-
rencies from more than 70 trading platforms around the world. The second data source covers the
main technical features of different cryptocurrencies collected from various online sources. The
third dataset contains more than 12 million crypto-related comments from cryptocurrency-specific
pages on the social news website Reddit. The result is a dataset containing rich information on a
wide cross-section of cryptocurrencies. The number of currencies included in the sample varies
from 50 at the beginning of the sample in January 2017 to more than 500 in June 2018.
16II.C.1 Trading and Price Data
The main pricing data come from two of the most comprehensive data providers in the cryptocur-
rency space: CoinAPI and Kaiko. These vendors collect and aggregate intraday pricing and other
trading data for thousands of cryptocurrencies listed on various trading platforms via the exchange
APIs. To ensure the quality of the data, I merge these two datasets with data on the daily price and
aggregate volume from CoinMarketCap and cross-check these datasets for coding errors and data
problems. The Internet Appendix IA.A describes this procedure as well as the filters applied to the
data.
The CoinAPI data contain a total of more than 18,000 pricing series for different currency pairs
listed on more than 70 exchanges. The listed currencies are either denominated in fiat currencies
(mainly US Dollar (USD), Euro, Chinese Yuan, Japanese Yen, and Korean Won), pegged digital
currencies such as Tether, or other cryptocurrencies, primarily Bitcoin and Ether. For each currency
pair on each exchange, I have access to minute-level open, close, high, and low prices as well as
trading volume and number of trades.
The Kaiko data cover a smaller universe and contain approximately 4,500 pricing series from
26 exchanges. However, it includes the complete tick-level order book data with an indicator that
shows whether a transaction is buyer- or seller-initiated. The data contain transaction IDs and
timestamps of trades in Coordinated Universal Time (UTC), price and signed volume, and the
bid/ask prices and sizes for the entire market depth.
Most cryptocurrencies trade on multiple exchanges, and prices can vary between these ex-
changes. I incorporate all available prices for each currency and calculate an aggregate return
index. The procedure proceeds in several steps. First, prices quoted in fiat currencies other than
USD are converted into USD based on exchange rates obtained from Bloomberg. Second, prices
quoted in other cryptocurrencies such as Bitcoin are converted into USD using an aggregate vol-
ume weighted price index for Bitcoin using all Bitcoin-fiat prices across all exchanges. Next, I
calculate the returns for each pricing series separately and exclude observations in the top and bot-
tom 0.1 percentile. Finally, I calculate a weighted return index using all the return series weighted
17by the past 24-hour trading volume.12 Table I reports the number of currencies with available re-
turns in each month as well as the equal- and value-weighted daily returns for the currencies in my
sample. The market experienced the highest returns in December 2017, with daily value-weighted
returns of 4.7% and the lowest returns in March 2018 with daily -1.22% returns.
II.C.2 Data on Technological Characteristics
Data on technological characteristics of cryptocurrencies are collected and cross-checked from
various online sources. These characteristics include whether a cryptocurrency is a coin or token,
hashing algorithm, consensus mechanism, being forks on the same blockchain, block time, passage
of time from the genesis block, hash rate, token industry, token platform, and an identifier for
whether a token is a utility or equity. Table IAI describes these characteristics and the source of
the data.
II.C.3 Social Media Data
Finally, I collect 12 million cryptocurrency-specific comments from a social news website, Reddit.
Most cryptocurrencies have their own subreddit page, where their members exchange information
and discuss issues related to the currency. I first scrape the subreddit addresses of all cryptocur-
rencies from CoinMarketCap and then obtain all comments in these cryptocurrency-specific pages
from Reddit.
III. Correlated Demand Across Cryptocurrencies
The empirical design of this paper rests on the initial hypothesis that investors have correlated de-
mand across currencies listed on the same trading platform. This section examines this hypothesis
by analyzing the drivers of order imbalance of different currencies listed on the same exchange.
12
Calculating weighted price indices first and then calculating the return index using those single price series produces
virtually the same results.
18III.A Constructing Proxies for Components of the Order Imbalance
To examine Hypothesis 1, I analyze the commonalities in the order imbalance of currencies listed
on the same exchange. The order imbalance is calculated using the exchange reported buyer- and
seller-initiated transactions. Transactions are designated as buyer- (seller-) initiated if the buy (sell)
side of the trade placed the market order. The idea is that market makers or high-frequency trading
bots who make money on both sides of the market make the book by placing limit orders. Liquidity
demanders or privately informed impatient traders who have a desired directional position place
market orders and initiate the trade. Therefore, the commonalities in order imbalance can reflect
correlated directional trading across currencies listed on the same exchange.
The rich set of cross-listed cryptocurrencies allows me to examine this by disentangling the
exchange-specific drivers of the order imbalance from the currency-specific component.13 The
analysis proceeds in several steps. First, I compute two measures of order imbalance for currency i
on exchange k on day t. Similar to Chordia and Subrahmanyam (2004), I define OIBV OL as the
daily buyer-initiated volume less seller-initiated volume scaled by total volume, and OIBN U M
as the daily number of buyer-initiated less the number of seller-initiated transactions scaled by the
total transaction:
BuyV olumei,k,t − SellV olumei,k,t
OIBV OLi,k,t = (5)
BuyV olumei,k,t + SellV olumei,k,t
BuyT ransactionsi,k,t − SellT ransactionsi,k,t
OIBN U Mi,k,t = (6)
BuyT ransactionsi,k,t + SellT ransactionsi,k,t
Second, I construct three proxies for currency-specific, exchange-specific, and market-wide
drivers of the order imbalance. The currency-specific component is the average order imbalance of
Cur
currency i on all exchanges excluding exchange k (OIB i,k,t ). The exchange-specific component
Exch
is the average imbalance of all currencies on exchange k excluding currency i (OIB i,k,t ). The
market component is the average order imbalance of all currencies in the market excluding both
13
A similar setting could be found in international markets with cross-listed stocks through dual-listing, American
Depositary Receipt (ADR), or Global Registered Shares (GRS). First, the cross-listing is pervasive in the cryptocur-
rency market, and uniform order book data are accessible on a rich set of currencies across several trading platforms.
Second, the cross-listed assets are identical and interchangeable, as opposed to dual-listed stocks that can behave
differently because they are not necessarily convertible into each other and the arbitrage positions are risky.
19M kt
currency i and all currencies on exchange k (OIB i,k,t ).
Finally, I estimate a panel regression of the order imbalance at currency-exchange level on the
three proxies for the currency, exchange, and market components:
Cur Exch M kt
OIBi,k,t = β0 + β1 OIB i,k,t + β2 OIB i,k,t + β3 OIB i,k,t + δi,k + εi,k,t (7)
where OIBii,k,t denotes the order imbalance for currency i on exchange k on day t (either OIBV OL
or OIBN U M ) and δi,k is currency-exchange fixed effect. The standard errors are two-way clus-
tered by currency and exchange. I am interested in the coefficient β2 , which captures the investor-
specific effect, controlling for the currency’s own and the market-wide effect.14 Note that all the
three components on the right-hand side exclude the currency on the left-hand side.
III.B The Main Drivers of Order Imbalances
Panel A of Table II reports the results for OIBN U M , which uses the number of trades to calculate
the order imbalance. All variables are standardized so that the coefficients are comparable. Column
(1) shows that the order imbalance increases by 0.13 standard deviations when the currency’s own
imbalance on other exchanges increases by one standard deviation. Column (2) shows that the
order imbalance increases by 0.31 standard deviations when the imbalance of other currencies on
the same exchange increases by one standard deviation. Column (3) reports that the market-wide
effect also has an explanatory power in a univariate regression. The multivariate specification
in Column (4) shows that the exchange effect is economically and statistically significant even
after controlling for currency’s own imbalance and the aggregate market. The coefficient on the
exchange component is 0.30, which is larger than the currency’s own effect. The rest of the market
becomes insignificant after controlling for the exchange and currency effects. Column (5) controls
for the lead and lag currency-specific component and shows that the results cannot be explained by
slower or faster reaction of traders on certain exchanges to the news. Panel B of Table II reports
14
An alternative approach would be to implement a principal component analysis to examine if a common component
drives the order imbalances within an exchange. However, the regression setting here has the advantage of directly
controlling for the currency’s own and market-wide effects.
20qualitatively similar findings for the volume-based order imbalance, OIBV OL.15 The results
in this section support Hypothesis 1, which states that investors have strong correlated demands
across cryptocurrencies listed on the same exchange.
IV. Exposure to Overlapping Demand Shocks and Comovement in Returns
This section examines Hypotheses 2 and 3. I first test the relationship between comovement and the
connectivity measure and other characteristics of cryptocurrencies in a dyadic setting as described
in Section II.B. I then construct a “connected portfolio” return that summarizes the returns of
all currencies connected to any given cryptocurrency to directly examine the implications of the
connectivity for returns.
IV.A Connectivity and Return Comovement
This section estimates the relationship between lagged connectivity and comovement using the
regression in Equation (3). Panel A of Table III reports the baseline results. For a one-standard-
deviation higher connectivity, the next month’s pairwise return correlation is higher by 0.19 stan-
dard deviations. The result is both statistically and economically large. The similarity in trading
volume is also related to comovement. Cryptocurrencies with a one-standard-deviation higher sim-
ilarity in volume comove by an additional 0.07 standard deviations. Moreover, having the same
currency type is also positively related to the comovement. However, the effect of the connectivity
measure is considerably stronger than other variables.
To test if the results hold for larger currencies, I estimate the same regression for the top 100
currencies based on the previous month’s aggregate volume. Columns (4) to (6) show that the
pattern is not just driven by small and less liquid cryptocurrencies and is similarly strong for larger
currencies. Moreover, Panel A of Figure 5 shows that the comovement increases almost monotoni-
cally with connectivity. The figure sorts the cross-section of currencies into deciles of connectivity
15
Table IAII reports similar results for the sample of currencies that are listed on at least five exchanges and exchanges
that operate at least five currencies. The results are qualitatively the same.
21at each point in time, takes the average correlations for each decile, and reports the time-series
mean for each decile.
Finally, Panel B of Table III documents similar results for comovement in order imbalance,
where the comovement is calculated as pairwise correlation of 24-hour volume-based order im-
balance as detailed in Section III. For a one-standard-deviation higher lagged connectivity, the
correlation in order imbalance is 0.13 standard deviations higher.
One concern could be that there is a mechanical component in the relationship between con-
nectivity and comovement. As described in Section II.C.1, I use volume-weighted returns across
all exchanges to calculate comovement. Prices of currencies listed on the same exchange could
be subject to the same exchange-wide noise or measurement errors. For example, noise in the ex-
change rate of Korean Won to USD can cause a spurious comovement in currencies heavily traded
in Korea. One should note that the exchange-wide noise such as noise in FX rates are small rela-
tive to cryptocurrency price movements. Moreover, the results in section IV.D show that the effect
increases with the time horizon, which is inconsistent with the noise explanation.
Nevertheless, I conduct a direct within-exchange analysis that is immune to exchange-wide
noise. Because cryptocurrencies are often cross-listed on multiple exchanges, there is a wide
variation in connectivity even among currencies that are listed on the same exchange. I first sort
cryptocurrencies within each exchange based on their connectivity and then examine the pairwise
correlations that are calculated only using prices on that exchange. Panel B of Figure 5 shows
that more connected currencies comove more even when sorting within the exchange and using
exchange-level prices, and the results are just as strong.16
IV.B Similarity in Characteristics and Return Comovement
This section examines how similarity in currency characteristics relates to return comovements.
As discussed in Hypothesis 3, these characteristics can expose currencies to the same fundamental
shocks. The similarity in these characteristics can also simultaneously determine trading location
16
Table IAIII shows that the magnitude of the effect is virtually unchanged relative to the baseline results.
22and lead to a spurious relationship between connectivity and comovement. Given different techni-
cal features, Table IV examines the effect of these characteristics separately for coins and tokens.
Table IAI provides a detailed description of these characteristics.
The first three columns of Table IV, Panel A, examine digital coins. The dummy variable
Similarity HashAlgo captures whether the pair has the same hashing algorithm, Similarity P roof T ype
captures similarity in consensus mechanisms, and Similarity F ork represents whether the two
coins are forks on the same blockchain. Coins with similar proof type have 0.06 standard de-
viations higher returns correlations, which is marginally significant, but Similarity HashAlgo and
Similarity F ork are statistically indistinguishable from zero. Moreover, the relationship between
connectivity and return correlations holds strongly for the subset of coins and cannot be absorbed
by the underlying technology.
The last three columns conduct a similar analysis for tokens. The variable Similarity P latf orm
shows whether the pair is based on the same platform, Similarity Industry captures whether the pair
belongs to the same industry, and Similarity T okenT ype determines whether the two tokens are both
utility or equity. Column (6) shows that tokens in the same industry have 0.1 standard deviations
higher return comovement. Moreover, the relationship between connectivity and comovement
holds after controlling for these characteristics.
Finally, Panel B of Table IV controls for a more comprehensive set of characteristics available
for 37 major coins, including similarity in block time, hash rate, and maturity (passage of time
from the genesis block). First, most of these characteristics seem unrelated to the return comove-
ment. Moreover, the connectivity measure is strongly related to the return comovement in this
small sample of major coins. Overall, the results in this section suggest that although certain tech-
nological features are related to the returns, the effect of exposure to similar demand shocks bears
the most substantial effect and technological, and other characteristics cannot absorb this effect.
23IV.C Quantitative Magnitude
To gauge quantitative magnitude, this section examines (1) the percentage decile spread in realized
correlations that can be explained by the connectivity and other characteristics and (2) the contri-
bution of each variable to the cross-sectional R2 . To quantify the decile spread, I estimate the fitted
values of the return correlations using Equation (3) with only connectivity index and time fixed
effects included as explanatory variables. Then at each point in time, I sort currency pairs into
deciles of the fitted values and calculate the average actual realized correlations for each decile. I
then take the average values for each decile over time.
Panel A of Table V shows that fitted values using the connectivity alone generate a decile
spread of 0.62 standard deviations in next months’ pairwise correlations. This spread amounts
to almost 18% of the realized spread. In comparison, fitted values estimated in the same fashion
using the combination of all other characteristics including volume, hashing algorithm, consensus
mechanism, token industry, and a host of other features explain only 8.5%.
Panel B of Table V shows the contribution of different sets of variables to the cross-sectional
adjusted R2 . The first row in the left panel shows the average adjusted R2 of monthly cross-
sectional regression of return correlations on lagged connectivity. The first row of the right panel
shows the incremental adjusted R2 of connectivity when all other variables are already included.
Both the univariate and the incremental R2 s show that the explanatory power of the connectivity
measure is much larger than that of other variables. Given that the pairwise correlation of the
market model residuals for individual cryptocurrencies is very noisy, the explanatory power of the
connectivity measure appears quite strong. Overall, both the decile spread and the R2 results show
that the explanatory power of the connectivity measure alone is more than double the combination
of all other characteristics and technological features.
IV.D Pricing Implications of the Connected Portfolio
This section directly investigates the return implications of the observed correlations by examining
how returns of a currency respond to the returns of its “connected portfolio.” To construct the
24You can also read