Australia REAL ESTATE - 2018 ASIA PACIFIC - 2018 CBRE Melbourne
←
→
Page content transcription
If your browser does not render page correctly, please read the page content below

CBRE RESEARCH

2 0 1 8 A S I A PA C I F I C

 R E A L E S TAT E
     MARKET
   O U T LO O K

   Australia

TABLE OF CONTENTS

    04                                                 06
    EXECUTIVE SUMMARY                                  ECONOMIC OUTLOOK

    09                                                 14
    OFFICE SECTOR                                      INDUSTRIAL & LOGISTICS
                                                       SECTOR

    18                                                 23
    RETAIL SECTOR                                      HOTEL SECTOR

    27                                                 32
    RESIDENTIAL SECTOR                                 CAPITAL MARKETS

    37
    RISKS & OPPORTUNITIES

© 2018 CBRE, Inc.   2018 ASIA PACIFIC REAL ESTATE MARKET OUTLOOK | AUSTRALIA   CBRE RESEARCH
                                               3
EXECUTIVE SUMMARY

                    2018 MARKET OUTLOOK – AUSTRALIA

ECONOMY                                                            RETAIL

We expect the economy will continue to grow below long-            The future of retail is shifting towards experience and
run averages in 2018, and with inflation low, stable               convenience with technology driving change. Combined
official interest rates are expected. However, global bond         these create demand for omnichannel retail, with
yields and interest rates may indeed increase further in           retailers requiring a physical and online presence in order
2018, and this has the potential to influence asset pricing        to compete. This, however, can add to retailer operational
more than domestic monetary policy settings.                       costs which in the current retail climate is exacerbated by
                                                                   weak sales growth.
OFFICE
                                                                   Growth in the retail sector in 2018 is expected to be
2018 will see the start of convergence from divergence             slightly weaker than 2017 but much slower than the last
with all markets expected to witness declining vacancy             cyclical peak in 2014. There is a confluence of structural
rates and improving effective rental growth over the year.         and cyclical factors acting as headwinds to the sector: the
2018 will be the cyclical peak for Sydney and Melbourne            housing cycle has peaked; population and income growth
but rental growth rates will slow. The resource-based              are slow; competition is increasing.
markets will begin a gradual recovery with a return to
positive effective rental growth.                                  HOTELS

Technology is becoming an increasingly significant                 Australia's hotel landscape is set to look quite different in
disruptor in the property industry with occupiers and              2018 as markets which have lagged the rest of the country
owners alike now recognising the need to understand the            (in terms of RevPAR growth) turn their fortunes around,
change underway and embark on the journey of                       whilst others are expected to see their strong growth rates
preparation. The traditional real estate premise of                taper off. Off the back of this change, we expect investors
“location, location, location” is no longer everything for         to turn attention to markets that are at, or near, the
business success. Companies are increasingly                       bottom of the cycle, such as Brisbane and Perth.
understanding that better business performance now
starts with understanding how technology could reshape             In 2017 the hotel investment market recorded the lowest
their business.                                                    volume of transactions since 2010. We don’t expect much
                                                                   improvement in 2018, with owners reluctant to sell as
LOGISTICS                                                          there are limited avenues to redeploy capital within the
                                                                   hotel sector.
As retail and industrial operations become increasingly
aligned, omnichannel real estate is emerging as a key
trend for 2018. Supply chain efficiency is key for the
success of the retail sector with customer expectations for
delivery times increasing, resulting in an amplified focus
on streamlining operations.

The e-commerce sector in Australia is still in its infancy
and consumers are not yet demanding immediate
delivery; thus last mile warehousing has yet to be rolled
out extensively across the country. This is expected to
change in 2018 with the entrance of a number of major
multi-national retailers and increased customer
expectations.

© 2018 CBRE, Inc.                   2018 ASIA PACIFIC REAL ESTATE MARKET OUTLOOK | AUSTRALIA                         CBRE RESEARCH
                                                               4
EXECUTIVE SUMMARY

                    2018 MARKET OUTLOOK – AUSTRALIA

RESIDENTIAL                                                       RISKS & OPPORTUNITES

Australia’s key residential markets head into 2018 at             •   Geographic economic convergence continues and this
various stages of the cycle. The apartment development                will filter into shifts in relative value amongst property
cycle has peaked, with Brisbane and Melbourne further                 markets. Countercyclical investment opportunities
advanced than Sydney. Given the extent of market                      are emerging, but timing will determine the
completions to occur in 2018, vacancy is expected to                  effectiveness of such strategies.
increase across most markets, exerting downward
pressure on rent growth. Sydney and Melbourne’s low               •   Alternative asset classes – the multifamily market will
vacancy rate at this present juncture make them best                  continue to evolve over coming years.
placed to withstand new supply.
                                                                  •   Evolution of industry is impacting occupier demand.
Low wages growth, higher borrowing costs and tighter                  Technology and demand preferences will generate
lending conditions will all hamper dwelling price growth              different risks and opportunities for property sectors:
in 2018. In Sydney and Melbourne, where price growth
                                                                             Ø Office - integration of technology in the
has been strong over recent years, prices could fall 5-10%,
                                                                                    workplace providing more flexible working
which is consistent with normal market downswings in
                                                                                    environments
the absence of material supply imbalances.
                                                                             Ø Industrial - high-tech manufacturing
CAPITAL MARKETS                                                                     replacing traditional manufacturing

                                                                             Ø Retail - online retail replacing or
Yields on real assets are at cyclical lows and we see                               supplementing physical retail, encouraging
limited room for further compression in Australian                                  the transition to more food, service and
commercial real estate. This stage of the cycle is probably                         entertainer occupiers and providing
better suited to investors with a long-term hold strategy.                          lifestyle hubs in centres as consumers look
We expect yield softening won’t occur until 2019 and the                            towards experiential retailing
subsequent decompression cycle will be gradual; thus
acting as an ongoing headwind to capital growth and in
                                                                  •   Investors will look to deliver value for office occupiers
stark contrast to the sudden, large price correction that
                                                                      who are placing stronger emphasis on customer
occurred in the GFC.
                                                                      experience. Landlords must provide technology and
                                                                      facilities that will help occupiers save money, improve
In 2017 we observed increased investor enquiry for the
                                                                      productivity and enhance the user experience.
Brisbane market in particular. Brisbane has emerged as a
countercyclical investment opportunity and will remain
                                                                  •   Omnichannel business models evolve. Retailers need
so in 2018 as conditions in commercial property markets
                                                                      to develop omnichannel models, which will come
continue to improve. Canberra and Perth office markets
                                                                      hand in hand with rising demand for logistics space
will increasingly be looked at as countercyclical
                                                                      within proximity to consumers (i.e. last mile
investment plays, although some may deem recovery in
                                                                      logistics).
the latter market still some time away yet.

© 2018 CBRE, Inc.                 2018 ASIA PACIFIC REAL ESTATE MARKET OUTLOOK | AUSTRALIA                           CBRE RESEARCH
                                                              5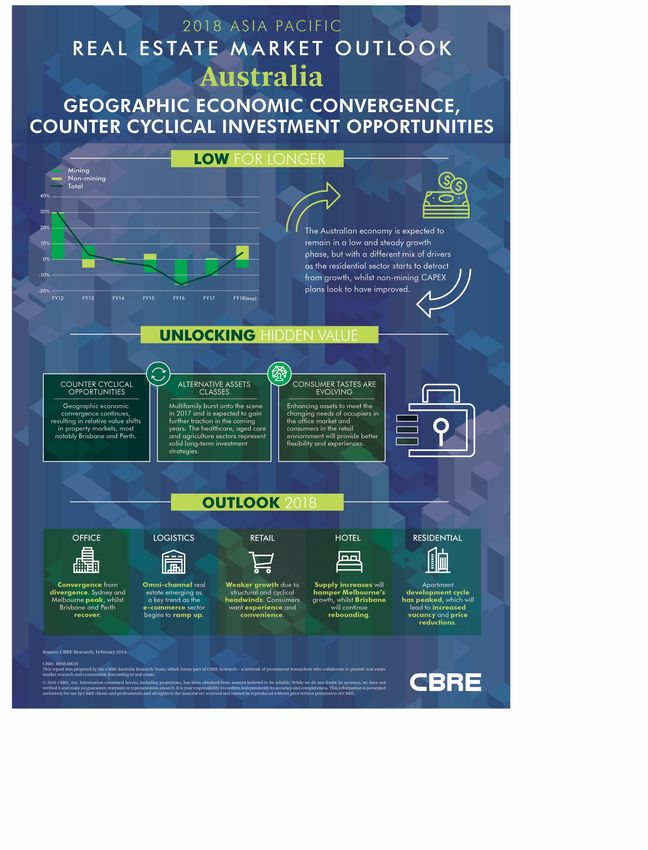
ECONOMIC OUTLOOK

ECONOMIC OUTLOOK

         GROWTH COMPOSITION SHIFTING
         AROUND A STABLE GROWTH PATH

Our 2017 view for Australia - “steady, non-accelerating growth pathway” -
summed up the year’s outcome, and in a “low for longer” environment it is difficult
to see anything breaking the shackles in 2018. Steady, below trend growth in a
low inflation environment typically coincides with steady official interest rates. Of
more interest will be changes in the composition of growth, as this presents
opportunities for market participants.

The Australian economy, based on trends up to Q3 2017,            capita flat, income growth low and pricing power is weak.
looks to have posted growth of around 2 ¼% in 2017, and           The flipside is that services consumption is growing at a
we are likely to see growth in the 2 ¼-½% range in 2018.          relatively healthy pace.
The composition of the economic “portfolio” has been
favourable to these outcomes, with contractionary factors         While not “shooting the lights out”, the business
being offset by expansionary factors. The question is: will       investment outlook appears a little brighter: the
this run come to an end?                                          contractionary drag from mining investment has come to
                                                                  an end; public infrastructure spending is holding up;
Not necessarily, but the growth mix is shifting. Consumer         higher commodity prices suggest some new mining
spending growth is low and slow, housing reached peak             projects might come back online; and, importantly, non-
contribution in 2016 and is likely to detract from growth         mining CAPEX plans have improved moderately. If these
in 2018, but private business investment might improve            plans translate to action, business investment can
in 2018. Consumer spend is disappointing, particularly            provide a welcome offset to the expected decline in
the “traditional” retail component with real sales per            housing activity.

© 2018 CBRE, Inc.               2018 ASIA PACIFIC REAL ESTATE MARKET OUTLOOK | AUSTRALIA                         CBRE RESEARCH
                                                              7
ECONOMIC OUTLOOK

FY18 represents the first expectation for an overall rise in                     evident in inner-city markets across Sydney, Melbourne,
CAPEX since FY13 (figure 1). Most importantly, non-                              Adelaide and Perth. Market rental growth continues in all
mining sectors (manufacturing and services) are driving                          markets due to generally tight vacancy, the outlier being
the increase in activity.                                                        Perth wherein vacancy is 7%.

                                                                                 Given that most markets, while well supplied, remain
 Figure 1: Annual CAPEX Growth by Broad Sector – Annual %
                                                                                 fairly balanced, we expect only a moderate 5-10% fall in
 change
                                                                                 residential prices looking forward – such a move being
                                                                                 consistent with previous downswings in housing activity.
    40%
                                                                                 However, this will have an indirect, wealth impact on
    30%                                                                          households, keeping a lid on consumer spending.

    20%
                                                                                 There will be further convergence of growth across the
    10%                                                                          economies with underlying demand growth already
     0%                                                                          positive in WA and Queensland. On the other hand, states
                                                                                 like NSW and Victoria which have been supported by
  -10%                                                                           housing activity/infrastructure and, in the case of
  -20%                                                                           Victoria, an acceleration in population growth, will come
                 FY03
                 FY04
                 FY05
                 FY06
                 FY07
                 FY08
                 FY09
                 FY10
                 FY11
                 FY12
                 FY13
                FY 14
                 FY15
                 FY16
                 FY17
            FY18 (exp)

                                                                                 back toward the pack in 2018 as upward momentum
                                                                                 flattens out.

              Mining              Non-mining             Total                   All up, we see the economy continuing to grow below
    Source: ABS, CBRE Research, February 2018.
                                                                                 long-run averages and with inflation low, stable official
                                                                                 interest rates are expected in 2018.

Housing construction reached peak contribution to                                However, global bond yields and interest rates will indeed
economic growth in 2016 and was flatter in 2017. 2018 is                         increase further in 2018 and it is this which has potential
likely to mark the first year of significant drag on                             to influence asset pricing more than domestic monetary
economic growth as the level of building work done starts                        policy settings. This will also put pressure on the AUD, as
to fall. Prices are responding, with growth in median                            the RBA may be reluctant to follow global interest rate
house and unit prices slowing across most markets                                trends with the trajectory for Australia’s economy in the
(contracting in H2 2017). Price contraction has been more                        balance.

Figure 2: State Final Demand – Annual % change as at Q3 2017

           10%

            5%

            0%

           -5%

          -10%

          -15%
                            NSW                    VIC              Qld                  SA               WA                ACT

 Source: ABS, CBRE Research, February 2018.                  2016         2017           2018 (f)

© 2018 CBRE, Inc.                             2018 ASIA PACIFIC REAL ESTATE MARKET OUTLOOK | AUSTRALIA                            CBRE RESEARCH
                                                                          8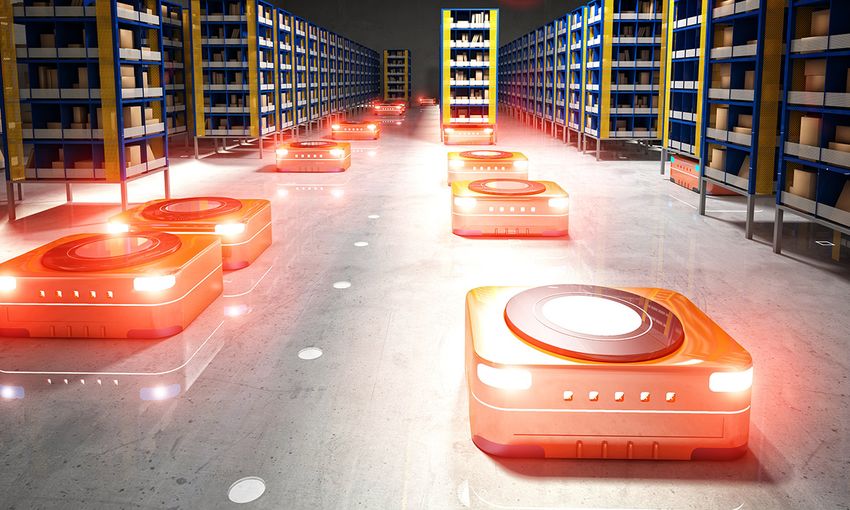
OFFICE SECTOR

OFFICE SECTOR

      CONVERGENCE FROM DIVERGENCE
            TO START IN 2018

The southeast office markets of Australia outperformed again in 2017 and this
will continue in 2018. But we will start to see the movement towards
convergence from divergence as vacancy rates in markets such as Brisbane and
Perth begin to accelerate their decline and the return to effective rental growth
commences.

Australia’s office market in 2017 was dominated by              convergence as vacancy rates decline in other office
another year of strong performance in the southeast             markets, particularly Brisbane and Perth. We expect all
office markets of Sydney and Melbourne. Sydney CBD              CBD office markets will see vacancy decline in 2018
secondary grade outperformed all office markets in terms        (figure 3).
of net effective rent (NER) growth for the second
consecutive year with growth of 19.5%. Melbourne CBD            NEW SUPPLY COMING IN MELBOURNE, ON THE
was the top performing prime office market with 15.9%           WAY IN SYDNEY BUT MARKET WILL SHRINK AGAIN
growth, but a close second was Sydney CBD (14.3%).              IN 2018
These prime markets performed well above their 10-year
averages (1.9% and 3.5% respectively). The Canberra and         Melbourne recorded a substantial reduction in vacancy to
Brisbane markets remained relatively flat over the year         4.6% in 2017 due to healthy demand and limited supply.
whilst Adelaide and Perth experienced further declines.         Demand is expected to be robust in 2018; however, as the
                                                                new supply cycle commences we expect the rate of rental
We forecast that performance will be more balanced in           growth will slow, in comparison to 2017. But we see
2018: lower NER growth in Sydney and Melbourne but              potential upside to rental growth projections given the
improved performance in other markets. 2018 will see the        strong demand outlook and the current low vacancy base.
beginning of the trend away from divergence to
© 2018 CBRE, Inc.                2018 ASIA PACIFIC REAL ESTATE MARKET OUTLOOK | AUSTRALIA                      CBRE RESEARCH
                                                           10
OFFICE SECTOR
The Sydney CBD office market will again shrink in size in Interstate moves to Queensland (15,700) more than
2018, taking net supply to circa -100,000sqm over 2017-18. doubled in the year ending June 2017, reaching a four-
This unique supply dynamic will drive the continued year high. This has helped Brisbane become the second
tightening in the market in 2018, pushing vacancy to fastest growing white collar employment market in the
3.6% in 2018 from 4.6% at end-2017. In the three years country, behind only Melbourne.
ending 2018, the Sydney CBD market will have featured
uncharacteristically high levels of withdrawals including Improving tenant demand and no new supply for the
permanent withdrawals for the new metro rail Brisbane CBD market in 2018 is expected to push vacancy
development and residential or hotel conversion. lower, which we forecast will fall to ~14% by year-end.
Compounding the impact of this withdrawal activity is the Following five consecutive years of negative/flat rental
lack of new supply between cycles, at just 60,000sqm over growth, improving conditions are expected to lead to a
2017-2018, although refurbished supply is helping. return to NER growth, in the order of 6-7% in 2018.
Sydney’s strong NER growth over the past two years (43% We believe the Perth CBD office market has reached the
for prime; 57% for secondary, where many of the stock bottom of the cycle. Vacancy edged down in 2017 and
withdrawals have occurred) will continue in 2018. We rents and incentives stabilised in Q4. Still, NERs in 2017
forecast face rental growth of ~5% and incentives will fall fell by 10.3% for prime and 18.1% for secondary stock.
to an indicative 21% for prime and 18% for secondary Prime will continue to outperform secondary, driven by a
resulting in 9-11% NER growth in 2018. continuation of the trends of flight to centre and quality
which emerged last year. We see vacancy continuing to
BRISBANE, PERTH AND ADELAIDE RECOVERING fall (to ~18% by end-2018) but more so in prime stock
(~14%). The prime market may see a return to NER
We expect the Brisbane CBD prime office market will growth in 2018 driven purely by a marginal reduction in
return to NER growth in 2018, predicated by positive incentives from historical highs as demand improves.
economic indicators, stronger demand and no new
supply. Overall economic growth in Queensland is In Adelaide, strong economic growth relative to other
improving and we forecast growth in 2018 will be above states and improving employment growth are expected to
the national average. Net interstate migration in the past lead to higher absorption in 2018, pushing vacancy down
has been strongly correlated to improved economic to just above 14%. We expect that this will result in a
performance and white-collar employment growth. return to positive, albeit mild, NER growth.
Figure 3: Australia CBD Office Vacancy
25%
Forecast
20%
15%
10%
5%
0%
2011 2012 2013 2014 2015 2016 2017 2018 2019 2020 2021
ACT Adelaide CBD Australia CBD Brisbane CBD Melbourne CBD Perth CBD Sydney CBD
Source: CBRE Research, February 2018.
© 2018 CBRE, Inc. 2018 ASIA PACIFIC REAL ESTATE MARKET OUTLOOK | AUSTRALIA CBRE RESEARCH
11OFFICE SECTOR
TECHNOLOGY REDEFINING THE OFFICE
CANBERRA’S IMPROVEMENT TO CONTINUE Mobility is rewriting office demand - 86% say mobility will
be the biggest tech enablement.
Healthy levels of positive net absorption in 2017 will
continue into 2018, and in conjunction with limited net Technology is placing people at the centre of the workplace -
supply additions, we expect a continuation of the 53% want a customised work environment.
declining vacancy trajectory in the market. Vacancy is
expected to remain sub-10% in prime stock, facilitating Buildings are coming to life - 84% of landlords expect a rise
improving face rents and lower incentives that will result in smart buildings as a result of the impact of technology
in NER growth of ~7% in 2018. Secondary vacancy will on office demand.
remain higher and thus NER growth more muted.
The traditional real estate premise of “location, location,
TECHNOLOGY REDFINING REAL ESTATE location” is no longer everything for business success.
Companies are understanding that better business
Technology is becoming an increasingly significant performance now starts with understanding how
disruptor in the property industry with occupiers and technology could reshape their business. They need to
owners alike now recognising the need to understand the acquire the top talent for the job and provide them with
change underway and embark on the journey of the right technology to perform their jobs seamlessly. As
preparation. In the CBRE 2017 APAC Occupier Survey, the workforce becomes increasingly mobile, it is not
36% of major multinational corporations surveyed across solely about where the business is located but more about
the region identified technology disruption as a rising accessing the right talent for the job (this could be from
concern (up from 21% in 2016). anywhere around the world) and providing the technology
to support mobility and flexibility.
In 2017 CBRE started the WORK_IT project to better
understand the interaction and impact of technology on Smartphones, automation and big data are the major
the workplace and the workforce. CBRE Asia Pacific technologies expected to have the biggest impact on
Research conducted over 90 face-to-face interviews with business in APAC. The biggest change in job function
industry leaders, landlords and occupiers across the headcount was a predicted 35% net decline of back office
region to gain insight into their plans for technological roles as a result of automation and artificial intelligence
change. Four key messages emerged from the survey: replacing process-oriented tasks in the workplace. Jobs
defined as “knowledge work” will be the least susceptible
Location is no longer everything - as we evolve into a more to automation as a result of the higher level of human
knowledge-based economy, human capital and insight and interaction required for this type of work. As
technological innovation are now the key differentiators we head down the path of increasing automation in
for business success. business, what will this mean for the demand for office
Figure 4: Australia CBD Office Prime Net Effective Rental Growth
30%
25%
Annual growth (%)
20%
15%
10%
5%
0%
-5%
-10% 2016 2017 2018
-15%
Perth CBD Adelaide CBD Brisbane CBD ACT Melbourne CBD Sydney CBD
Source: CBRE Research, February 2018.
© 2018 CBRE, Inc. 2018 ASIA PACIFIC REAL ESTATE MARKET OUTLOOK | AUSTRALIA CBRE RESEARCH
12OFFICE SECTOR
space and how will it reshape the type of office space office. The goal is a workplace that more accurately
occupiers are looking for? matches occupants’ needs and is adjustable in a real time
basis.
With knowledge work remaining more immune to
automation, tomorrow’s workforce may come to comprise Technology is expected to impact on office demand in a
a higher proportion of knowledge work industries. The variety of ways. 50% of occupiers expect it will lead to a
traditional format of office space may evolve to support decline in demand for office space compared to just 32%
the development of knowledge industries encompassing of landlords. Technology is also expected to lead to an
space to enhance connection, collaboration and increased use of third party space with 52% of occupiers
community. and 68% of landlords predicting a rise in the use of co-
working space.
Smartphones are expected to have the biggest impact on
business with 86% of respondents noting this. The The area where technology is expected to have the
smartphone is evolving in three key areas including a greatest impact is in the rise of smart buildings with 84%
focus on development of internal customer apps to of landlords surveyed expecting this outcome. A smart
enhance the employee experience; creating a building is a technological ecosystem that links all the
customisable interface for a better client experience; and systems in a building together in a synchronised way. A
tracking access and space utilisation data for better space truly successful smart building will depend upon the
management. partnership of the landlord and occupier to work together
for the best operational outcome of the building. As
While the most important technological advancement in customer experience becomes the key focus, landlords
the workplace is mobile technology, the unknown is must provide technology to help occupiers save money,
understanding how people interact with space after they improve productivity and enhance the user experience.
become mobile. But the occupier must play their part in adhering to
behaviours and targets to meet the building’s operational
The survey revealed that technology applications in the goals. If successful, this partnership approach can
workplace still need to catch up on a better generate benefits to the occupier and develops customer
understanding of space usage via sensors, apps, and/or loyalty to the landlord. It’s about working towards the
wearables and deeper analytics on commercial real estate best outcome for both parties.
strategy via the application of big data. Better, real-time
analytics can assist in developing new solutions for
better, more tailored experiences for people inside the
A truly successful smart building will depend upon the
partnership of the landlord and occupier to work
together for the best operational outcome of the
building. CBRE Tech Survey 2017
© 2018 CBRE, Inc. 2018 ASIA PACIFIC REAL ESTATE MARKET OUTLOOK | AUSTRALIA CBRE RESEARCH
13INDUSTRIAL & LOGISTICS SECTOR
INDUSTRIAL & LOGISTICS SECTOR

   INNOVATION AND TRANSFORMATION

An improving industrial economy in Australia is driving stronger space take up and
rent growth in major markets. The entry of a number of e-commerce groups into
the Australian market is supporting the continued growth of the transport and 3PL
sectors, while a public infrastructure boom is helping to sustain momentum in
construction and engineering.

HIGH-TECH MANUFACTURING EMERGING                                  2017, above the 12-month average of 55.9 and reflective of
                                                                  14 consecutive months of expanding conditions for the
Offshoring and high labour costs domestically over a long         Australian manufacturing industry.
period of time have seen many manufacturers rationalise
operations. Manufacturing GDP comprised 10.3% of                  Continued growth in the manufacturing sector is
Australia’s economy in 1997, a figure which has fallen to         expected in 2018 and will be driven by high-tech
just 6.3% in 2017. However, this decline is arresting with        manufacturing, which has less intensive space
a number of improving indicators in the manufacturing             requirements and requires a skilled workforce. Assets
sector including industrial GDP which grew at 2.6% p.a.           located in close proximity to a highly educated workforce
in Q3 2017, the highest result in 18 quarters.                    (i.e. Melbourne’s South East and Sydney’s Macquarie
Manufacturing contributed 60bps to this growth, its               Park) will be well placed to capitalise on this. Some
strongest contribution since Q1 2012, whereafter it has           prominent transactions have highlighted this trend over
predominantly been a drag on industrial GDP growth.               the last 24 months, most notably the GM Holden
Australian PMI rose by 6.2 points to 57.3 in November             manufacturing facilities in Melbourne and Adelaide.

© 2018 CBRE, Inc.                2018 ASIA PACIFIC REAL ESTATE MARKET OUTLOOK | AUSTRALIA                         CBRE RESEARCH
                                                             15
INDUSTRIAL & LOGISTICS SECTOR
Both of these sites will retain a manufacturing use,
focusing on high-tech manufacturing requiring highly
ECONOMY
skilled workers. The asset in Melbourne was purchased by
2.6%
the Victorian State Government for the use of an
innovation park which will specialise in high-tech
manufacturing. The Adelaide site will be utilised as a hub
for industrial, manufacturing, construction engineering,
Industrial GDP at Q317 automotive and commercial uses.
SOME RELUCTANCE TO IMPLEMENT
CAPITAL MARKET AUTOMATION DUE TO SLOW PAYBACK
6.3%
Despite technology becoming more prevalent and
increasingly advanced, Australian occupiers are not
implementing fully automated solutions for industrial and
logistics assets with many concerned about the cost of
Y-o-Y Super Prime Capital Value Q417
advanced technology. Automation has been implemented
on a smaller scale in a number of assets across Australia
assisting with sorting, picking and packing inventory
RENTAL
particularly in the manufacturing and warehousing
1.3%
sectors. The implementation of these technologies has not
come at the expense of significant staff cuts, with fully
automated ‘lights out’ robot-only facilities still some way
off in the Australian market.
Super Prime Net Face Rents Q417
The slow uptake of advanced automation is partly due to
the high payback costs of implementing this level of
YIELDS technology. Shorter leases make the payback for
6.3%
significant investment less feasible, with a number of
groups in the Australian market nervous to implement new
forms of automation, as the financial payback has not
previously been tested by their competitors in the
Super Prime Q417 Australian market. Furthermore, the standard of
technology is changing so rapidly that there is concern
about making a significant investment into a technology
that may be superseded well before the payback period is
complete. It is anticipated that technology will continue to
be implemented into industrial and logistics assets to
varying degrees in 2018.
© 2018 CBRE, Inc. 2018 ASIA PACIFIC REAL ESTATE MARKET OUTLOOK | AUSTRALIA CBRE RESEARCH
16INDUSTRIAL & LOGISTICS SECTOR
LINES BETWEEN INDUSTRIAL AND RETAIL this purpose. Although much of this space has been
SECTORS BLUR AS E-COMMERCE GROWS repurposed for residential development as the
specifications of these buildings often make them no
As retail and industrial operations become increasingly longer suitable for modern warehousing requirements,
aligned, omnichannel real estate is emerging as a key growth in e-commerce could see the highest and best use
trend for 2018. Supply chain efficiency is key for the for this space become industrial. Secondary asset yields
success of the retail sector, with customer expectations are expected to compress in 2018, partly attributed to the
for delivery times increasing, resulting in an amplified increased demand from repurposing existing warehouses
focus on streamlined operations. The proliferation of for last mile warehousing across Australia’s major
dark stores reflects the growing alignment between the capitals.
retail and industrial sectors. A number of retailers are
opening dark stores to service their online customers and RENT GROWTH EXPECTED IN MOST
their location is chosen so that they are proximate to a MARKETS
retailer’s customer base. Retailers are becoming
increasingly informed when choosing where to locate Growth in the transport and warehousing sector will
their warehousing operations with many choosing a continue to support industrial and logistics rent growth
network of smaller, integrated warehouses that have been in 2018. 2017 saw solid growth in Melbourne and Sydney
selected to better service the customer base. supported by softer levels of supply and sustained
demand across all asset classes. Increased supply in
As the e-commerce sector in Australia is still in its Sydney and Brisbane will see softer rent growth in 2018,
infancy, and consumers are not yet demanding while contraction (albeit at a lower rate than in 2017) is
immediate delivery, last mile warehousing has yet to be expected to continue in Perth in line with a relatively
rolled out extensively across the country. This is expected weak industrial economy. After an extended period of flat
to change with the entrance of a number of major multi- net face rents, Melbourne saw an increase of 4.7% p.a. for
national retailers which will transform customer super prime assets in 2017 - this trend is expected to
expectations over time. repeat in 2018 (figure 5).
Last mile warehouses are located in population centres
and it is anticipated that a number of secondary
warehouse spaces at the CBD fringe will be utilised for
Figure 5: Australia Super Prime Net Face Rent Growth
10.0%
5.0%
0.0%
-5.0%
-10.0%
Sydney Melbourne Brisbane Perth Adelaide Australia
2016 2017 2018F
Source: CBRE Research, February 2018.
© 2018 CBRE, Inc. 2018 ASIA PACIFIC REAL ESTATE MARKET OUTLOOK | AUSTRALIA CBRE RESEARCH
17RETAIL SECTOR
RETAIL SECTOR

    INCREASINGLY COMPETITIVE MARKET
     ASSERTING PRESSURE ON RETAILERS

Growth in the retail sector in 2018 is expected to be slightly weaker than 2017 but
much slower than the last cyclical peak in 2014. There is a confluence of structural
and cyclical factors acting as headwinds to the sector: the housing cycle has
peaked; population and income growth are slow; competition is increasing.
Collectively these factors are taking a toll on incumbent retailers.

There was moderate rent growth across all retail property         replaced by newer ones. The winners are likely those who
types in 2017 but slower than in 2016. However, Sydney            remain on the innovative curve and in pursuit of
CBD prime rents experienced the highest growth (~13%),            omnichannel, despite profitability challenges.
driven by demand spilling over from super prime rent and
the low availability of quality space in the CBD. But we          LACKING STIMULUS FOR THE CONSUMER
believe the best of rent growth is now behind us in this
cycle, with very little rent growth expected in 2018 -            Retail trade growth has been declining over the past three
retailer margin pressures and lack of stimulus for                years, coinciding with weaker population, house price
consumer spending will make it hard for landlords to              and wages growth. As a result, retail trade growth
command higher rents.                                             softened to ~3% in 2017 (on a declining trend since 2016),
                                                                  well below its peak of 5.1% in 2014. Slower sales growth is
Shifting consumer expectations enabled by technology              evident across all categories (all underperformed their
mean that older, sub-optimal retail models are being              long-term trend), particularly department stores.

© 2018 CBRE, Inc.                 2018 ASIA PACIFIC REAL ESTATE MARKET OUTLOOK | AUSTRALIA                         CBRE RESEARCH
                                                            19
RETAIL SECTOR
However, cafes, restaurants and takeaway food performed over the last decade, providing little support for growth in
close to its long-term average and consistently above 4%, disposable income. Many services costs are considered
amid its more defensive nature against online retailing, non-discretionary and consequently reduce retail
as well as innovation in the F&B sector. spending capacity, evidenced by real retail consumption
per capita remaining stagnant for over a decade.
In addition to the structural drag from lower average
income growth and high levels of household debt, there COMPETITIVE RETAIL ENVIRONMENT
are cyclical weaknesses from lower price inflation, FORCES BRAND AND STORE CLOSURES
declining retailer margins and a peak in housing activity.
These factors have seen a trend of slowing sales growth The weaker retail environment, coupled with increased
over the past decade (figure 6). Retail sales in the recent competition from international brand entry, has placed
decade (2008-2017) grew at about half the pace of the margin pressures on many incumbent domestic retailers
previous decade (1998-2007) (3.8% p.a. versus 6.2% p.a.). as sales decline. Since 2010, over 12,000 retail businesses
A rising share of consumer services is taking the place of have closed down, including a number of national brands
traditional retail spending. in 2016 and 2017. We believe there will be more pressure
on domestic and international brands in 2018.
Entering 2018, there is at least evidence of nascent
improvement amongst consumers. Retail sales in October TECHNOLOGY HEAVILY DRIVING
and November marked strong improvement from Q3, and CONSUMER BEHAVIOUR AND
consumer confidence has improved. Continuation of this DISRUPTING TRADITIONAL RETAIL
trend will provide upside to retailers.
Technology is driving the change towards experience and
RISING SHARE OF SERVICES COST EATING convenience retail, with smartphones the main channel
INTO DISPOSABLE INCOME by which consumers search and shop. This is more
prevalent in younger demographics with over 60% of
Increases in healthcare, education, transport, housing purchases made via a smartphone. Advancement in
and communications costs have reduced disposable technology is enabling connectivity and convenience for
income for retail consumption over the past three shoppers (such as online retailing) and is the emerging
decades. On average, services consumption grew at twice force behind how retailers need to do business. Social
the pace of goods consumption over this period (4.1% p.a. media now heavily influences people's desires and
versus 2.1% p.a.). As a result, share of services spend has perception of a brand, product quality and pricing and is
risen from 58% to 69% from 1990 to 2017. More recently thus replacing traditional TV and/or billboard advertising.
coinciding with this, wages growth has been declining
Figure 6 – Retail Sales Growth
10%
Retail sales growth
1998-2007
8% 2008-2017
Annual Growth %
6%
6.2% p.a.
4%
3.8% p.a.
2%
0%
1990
1991
1992
1993
1994
1995
1996
1997
1998
1999
2000
2001
2002
2003
2004
2005
2006
2007
2008
2009
2010
2011
2012
2013
2014
2015
2016
2017
Source: ABS, CBRE Research, February 2018.
© 2018 CBRE, Inc. 2018 ASIA PACIFIC REAL ESTATE MARKET OUTLOOK | AUSTRALIA CBRE RESEARCH
20RETAIL SECTOR
Technology is generating greater expectations for outperforming those that choose to lean on old business
convenience and lower prices, and has enabled the practices.
double-digit growth of online retailing over the past
decade, which now accounts for ~7% of total retail sales. The entry of fast and mid-range fashion international
Online retailing will continue to grow in Australia as retailers has coincided with weaker sales performance of
millennials, generation Z and subsequent generations incumbent department stores and discount department
increasingly contribute to a larger portion of the stores over the past five years. Competition continues to
population. We expect online retailing will reach 15% by intensify as fast fashion retailers expand into suburban
2027. However, physical bricks and mortar remains a and regional locations.
criterial part of retailing and still captures a majority
share of ~93% of the current market and projected to still H&M and TK Maxx, for example, have opened numerous
account for ~85% of the market a decade from now. stores in suburban locations as well as targeting major
regional cities. We expect other fast fashion brands will
INNOVATION AND COMPETITION HAS follow suit over the coming years, absorbing space that
PRODUCED WINNERS AND LOSERS may be vacated by discount department stores and other
retail incumbents. Likewise, entry of new and expansion
Certain retail segments are more clearly affected by of existing international supermarkets have driven down
technology than others. Over the past decade, many new grocery prices and adding pressure on Australian
innovative retail businesses have opened, pushing out supermarkets.
sub-optimal operations. Physical book and music stores
are prime examples of a category being replaced by online IMPLICATIONS AND HOW TO SURVIVE
retailers (figure 7). On the other hand, some retail THE DISRUPTION IN RETAIL
categories are more defensive to online retailing, such as
cafes and restaurants, which had a net entry rate of 13.5% While many retailers are setting up online platforms,
between 2012-16. competing in this environment is more than just having
an online presence. Retailers need to consider the whole
It is also important to note that even amongst those with shopping and purchasing experience, including
positive net entry results, there is still a significant convenience and service levels. There are also challenges
number of business exits. This is partly attributed to of logistics and last mile delivery for online retailing and
innovation in the sector as technology and experience additional costs incurred for returned products, which
drive new concepts, replacing older ones. This is likely to affect profitability.
continue, with those innovating to consumer trends
Figure 7: Net Entry of Australian Retailers (2012-16)
40% Entry Rate Exit Rate Net Rate
% Entry and Exit Rate
30%
20%
10%
0%
-10%
-20%
-30%
Newspaper and Book Retailing
Hardware and Building Supplies
Electrical, Electronic and Gas
Department Stores
Furniture Retailing
Houseware Retailing
Supermarket and Grocery Stores
Non-Store Retailing
Cafes and Restaurants
Clothing Retailing
Appliance Retailing
Retailing
Source: ABS, CBRE Research, February 2018.
© 2018 CBRE, Inc. 2018 ASIA PACIFIC REAL ESTATE MARKET OUTLOOK | AUSTRALIA CBRE RESEARCH
21RETAIL SECTOR
As online retailing has expanded, other parts of the world products, but these stores are for experiences rather than
have seen department store sales struggle or decline, for purchases.
particularly in the U.S.
These experience stores are driving foot traffic into the
Should we expect the same trend in Australia? The same malls and creating “dwell” time. But omnichannel is
forces will impact Australia’s markets but there are some expensive. According to PWC, only one in five companies
mitigating factors in Australia. One such factor is that make a profit in their omnichannel platform. The cost of
Australia has 2.5 times lower retail stock per person than returns, damaged goods and maintenance costs are
in the U.S., implying less of an oversupply of bricks and eroding retailers’ bottom line.
mortar retail. Another factor is Australia’s lower
population density, which makes it more difficult to Younger demographics are driving demand for
achieve rapid delivery times that will increasingly be omnichannel, as these make a higher proportion of
demanded. Despite these factors somewhat limiting the purchases online but also demand more retail experience
eventual critical concentration of online retail, there will when selecting to shop at a mall and/or retailer.
be a need to provide an omnichannel platform. Australians (on average) visit a shopping mall five days
per month to shop and three days per month for reasons
OMNICHANNEL IS IMPORTANT BUT HARD other than shopping; therefore it is important to create
ON BOTTOM LINE destinations that attract them.
Consumers still prefer to shop and make purchases in RENT GROWTH WILL MODERATE IN 2018
physical stores according to CBRE’s millennial and
consumer surveys. This is driving some pure online Considering the challenges faced by retailers operating in
retailers to set up a physical presence (albeit with a Australia, and the fact that occupancy cost ratios edged
smaller footprint), allowing shoppers to touch and feel slightly higher in 2017, we expect rent growth in 2018 to
their products as well as return goods. Consumers are be lower than in 2017. The strongest rent growth has
increasingly wanting a balance between experience and passed in this cycle. By city, Sydney and Melbourne are
online retailing. expected to fare better than others with forecast growth of
2% while the rest of the cities are expected to remain flat.
Omnichannel offers both worlds, and getting the balance By retail property type, CBD prime rents are forecast to
is becoming essential to the success of a retailer, as well grow 1.5% in 2018, slightly slower growth in large format
as capturing “dwell” time. Many retailers like Samsung retail and very little growth in regional shopping centres
have created physical stores showcasing their latest (figure 8).
Figure 8: National Retail Rent Growth
6%
2015 2016 2017 2018
5%
Australian
4% retailers are forced to invest in better online
platforms
3%
as expectation for greater efficiency and
2%
online
1% competition increases
0%
CBD Prime Regional Shopping Centres Large Format Retail
-1%
Source: ABS, CBRE Research, February 2018.
© 2018 CBRE, Inc. 2018 ASIA PACIFIC REAL ESTATE MARKET OUTLOOK | AUSTRALIA CBRE RESEARCH
22HOTEL SECTOR
HOTEL SECTOR

    A YEAR OF CHANGE AHEAD AS POOR
          PERFORMERS REBOUND

Australia's hotel landscape is set to look quite different in 2018 as markets which
have lagged the rest of the country recently turn their fortunes around, whilst
others are expected to see their strong growth rates taper. Off the back of this
change, we expect investors to turn their attention to markets that are at or near
the bottom of the cycle such as Brisbane and Perth.

Figure 9 shows the annual revenue per available room               LEISURE MARKETS HAVE PEAKED
(RevPAR) change for each of the main markets in 2016
and 2017, and how we expect them to perform in 2018.               The last 12 months saw some the leisure markets begin to
                                                                   cool off, in particular the Gold Coast and Hobart. The
The surprising standout performer for 2017 has been                impact of a fatal incident at one of the Gold Coast’s major
Canberra, which has managed to absorb the wave of new              theme parks in 2016 is still being felt as it attracted
supply it experienced over the last couple of years. Stable        negative headlines across the globe. Occupancy levels
supply and strong increases in tourism in 2017 gave                declined; however, increases in room rates were able to
operators the confidence to raise room rates without fear          offset the falls and still post positive RevPAR growth
of occupancy falls. However, historically the nation’s             albeit at a much lower level than 2016. The staging of the
capital is prone to short boom-bust cycles so we can               2018 Commonwealth Games will give a boost to the Gold
expect 2018’s growth to be more measured.                          Coast market but it is unlikely to reach the heights of
                                                                   2016.

© 2018 CBRE, Inc.                2018 ASIA PACIFIC REAL ESTATE MARKET OUTLOOK | AUSTRALIA                            CBRE RESEARCH
                                                              24
HOTEL SECTOR
Hobart is currently suffering from an oversupply of new detrimentally impacting occupancy and room rates.
stock. Such was the success of Hobart in 2015 and 2016 This situation is likely to worsen in 2018 as the
that developers flooded the market, and as a result have development cycle continues to ramp up.
put downward pressure on occupancy and room rates.
The number of hotels is set to grow by over 70% in the However, on a positive note for Perth, the tourism market
next few years, an amount the market will struggle to will receive a boost next year from the direct London-
absorb. Perth route, the new stadium, and Tourism WA’s
investment in promoting the region.
Cairns is the only surviving member of the high-flying
leisure markets club of 2016. Cairns was the best SYDNEY WILL CONTINUE ITS STRONG
performing market in 2017. Although its growth was GROWTH, MELBOURNE WILL TOIL
below the previous year, it was only by a nominal amount,
and 2018 is expected to be another strong year. Sydney RevPAR will continue to grow at 6-7% in 2018,
which has been the trend over the last few years. Strong
POSITIVE SIGNS FOR BRISBANE BUT demand from both the leisure and corporate segments
PERTH STILL STRUGGLES have kept Sydney at near full occupancy for much of 2017
and the same is expected in 2018. The new supply
In 2017 Brisbane recorded a double-digit swing on 2016, entering the market is not expected to have any material
achieving its highest RevPAR growth since September impact on occupancy levels; indeed the quality of new
2012. The signs are there for a strong year in 2018 as hotels may be a drawcard in their own right.
trading conditions become more favourable. The
Queensland economy is starting to rebound, and the wave Melbourne has seen minimal rate growth over the last few
of new supply has been absorbed by the market. years as operators have struggled to push up rates without
sacrificing occupancy levels. The strong occupancy levels
Perth, however, continues to struggle with unfavourable have kept RevPAR growth marginally positive which limits
economic conditions and supply pressure. The heady the ability for operators to raise rates as occupancy is very
days of the mining boom have well and truly passed, and sensitive to rate movement. The city is set to see a further
the sheer volume of supply that has come into the market influx of supply in 2018 and 2019 so this problem will
already (with more expected over the next three years) is persist in the near to medium term.
Figure 9: Annual RevPAR Growth
15%
10%
5%
0%
-5%
-10%
-15%
-20%
Adelaide Brisbane Cairns Canberra Darwin Gold Hobart Melbourne Perth Sydney
and ACT Coast
2016 2017 2018 (Forecast)
Source: CBRE Research, STR, February 2018.
© 2018 CBRE, Inc. 2018 ASIA PACIFIC REAL ESTATE MARKET OUTLOOK | AUSTRALIA CBRE RESEARCH
25HOTEL SECTOR
INVESTMENT MARKET QUIETEST SINCE WILL THIS CONTINUE?
2011
Given where we are in the economic cycle, 2018 is unlikely
The last 12 months saw limited transaction activity which to be too dissimilar to 2017: rather unspectacular. Owners
can be put down to three factors: will remain reticent about selling their assets as there are
limited alternative avenues to reinvest capital.
1. Limited stock;
2. A lack of Chinese investors; Investors who want to break into the hotel market will
find it increasingly difficult to find quality assets in hubs
3. A mismatch between buyer and seller expectations.
such as Sydney and Melbourne so will need to look at
Sydney and Melbourne have traditionally been the markets in different stages of the cycle, such as Brisbane
preferred destinations for hotel investors, particularly and Perth. The former has bottomed-out so represents a
those from overseas. However, a proliferation of sales in good investment opportunity as positive performance is
recent years has resulted in limited availability of on the horizon, whereas the latter will experience further
purchasable assets in these cities, especially Sydney CBD. pressure but represents good value for money.
The situation is not that dissimilar to 2016 when a lack of Other fringe markets – Adelaide and Canberra, for
assets in Sydney and Melbourne forced investors out to example – will appeal to certain investors but are also
more regional locations such as Cairns and the Gold more susceptible to downturns so represent riskier
Coast. However, 2017 is different because towards the investments.
back end of 2016 further restrictions were placed on
Chinese investors’ ability to withdraw funds and invest in Fears of an economy headed towards recession may force
overseas property. owners’ hands, and the end of 2018 could see a spate of
divestments. However, given the economic environment
This lack of Chinese buyers had a further impact due to we are in, holding on to long-term income-generating
the perception that Chinese buyers pay a premium to assets is a defensive play and one that will have a
secure assets. Owners were unable to achieve their mitigating impact on any possible downturn.
preferred price point on several deals so withdrew their
assets from the market.
Figure 10: Hotel Transaction Volumes
$4,000
$3,500
$3,000
$2,500
$2,000
$m
$1,500
$1,000
$500
$0
2007 2008 2009 2010 2011 2012 2013 2014 2015 2016 2017
Domestic Off Shore
Source: CBRE Research, February 2018.
© 2018 CBRE, Inc. 2018 ASIA PACIFIC REAL ESTATE MARKET OUTLOOK | AUSTRALIA CBRE RESEARCH
26RESIDENTIAL SECTOR
RESIDENTIAL SECTOR

                              SUPPLY CYCLE PEAKS

Australia’s key residential markets head into 2018 in various stages of the cycle.
Apartment completion cycles have peaked/are peaking with inner-city apartment
prices, vacancy rates and rents under pressure. The high median house price
growth recorded in Sydney and Melbourne is flattening. Historically, falls of 5-10%
in prices are associated with cyclical housing downswings.

APARTMENT DEVELOPMENT CYCLE HAS                                    prudential measures have tightened lending on “riskier”
PEAKED                                                             borrowing; rising prices have dented affordability in
                                                                   major markets (Sydney and Melbourne); and offshore
A common thread in our outlook series over the past                capital flows have slowed as a result of reduced outflow
three years has been the evolving trends in development            from China (a major source) and higher stamp duty.
activity. Of note was the surge in apartment development,          Supply demand imbalances in some markets (e.g. Perth)
predominantly the amount of stock entering inner-city              have also quelled confidence and set in place slowing
markets, particularly in Brisbane and Melbourne.                   price growth and rent declines.
Conditions supporting this development included
continuing low interest rates, availability of finance from        Nationally, medium/high density approvals peaked in
banks and new capital sources from offshore investors              mid-2016 with an annual total of almost 120,000 units.
and developers. Many of these supportive factors have run          For the first time, the number of medium/high density
their course. Mortgage interest rates have reached their           approvals marginally exceeded the number of house
trough - some rates have increased; APRA driven macro-             approvals.

© 2018 CBRE, Inc.                2018 ASIA PACIFIC REAL ESTATE MARKET OUTLOOK | AUSTRALIA                         CBRE RESEARCH
                                                              28
RESIDENTIAL SECTOR
Since then, medium/high-density approvals have fallen by and outer ring locations such as Parramatta, Ryde and
almost 17%, dipping below 100,000 for the first time Liverpool supporting high levels of development.
since the start of 2015. At the same time, house approvals
are only around 3% lower than their most recent peak VACANCY AND RENTS TO FEEL PRESSURE
(March 2017).
Given the extent of apartment completions, vacancy is
The extremes of the medium/high density approvals expected to increase across most markets in 2018.
peaks and their timing, however, have varied from city to However, the extent of the rise in vacancy is quite
city. Looking at the three east coast capitals: divergent. On the one hand, Sydney and Melbourne have
most recently experienced falling vacancy (to 2.0% and
• Annual approvals peaked in Melbourne as far back as 2.1% respectively) and with Melbourne population growth
October 2015 and are now 24.5% below that level; now the highest in the country it is showing good capacity
to absorb new stock. By contrast, vacancy in Perth has
• Brisbane saw its peak in April 2016, (rising threefold risen to 6.9% and in Brisbane above the 3% perceived
in just three years) but the fall since has been steep, equilibrium level in inner and middle rings.
with annual approvals now almost 54% lower;
Rising pressures are anticipated to continue in inner
• In Sydney, the peak has been more recent (September Brisbane and become more evident in inner Melbourne in
2016) with the drop a more modest 18.3%. 2018, suggesting that the declines in median rents already
being seen will continue. There do appear to be a number
More starkly, inner (5-kilometre radius) metropolitan of apartments entering short-term letting pools, either
approvals in FY14 and FY15 totalled 19,400 in Brisbane through major operators, via developers directly or in
(53% of the metropolitan total) and 23,200 in Melbourne some cases, privately. This may ameliorate some of the
(37% of the metropolitan total). For FY17, while absolute short-term residential vacancy pressures by transferring
numbers dropped, so too did the inner-city share (to 35% stock from the permanent rental supply to the short-term
in Brisbane and albeit more modestly, to 32% in holiday and business rental market.
Melbourne). Interestingly, in Sydney, inner-city approvals
over the past five years have averaged 5,400 per annum,
just an 18% share of the metropolitan total, with middle
Figure 11: Australian Residential Building Approvals – Rolling 12-month approvals
130,000
115,000
100,000
85,000
70,000
55,000
40,000
25,000
10,000
2007 2008 2009 2010 2011 2012 2013 2014 2015 2016 2017
Australia Houses Australia Other
Source: ABS, CBRE Research, February 2018.
© 2018 CBRE, Inc. 2018 ASIA PACIFIC REAL ESTATE MARKET OUTLOOK | AUSTRALIA CBRE RESEARCH
29RESIDENTIAL SECTOR
Other risks, such as settlement risk, remain subdued as The Sydney median house price is now around 45%
alternative finance providers enter the market (offsetting higher than Melbourne and more than twice Brisbane
some of the bank tightening) and solid labour market and Perth’s median. Where price differentials have
conditions remain supportive of borrower capacity. reached these levels in the past, there has been an
accelerated movement of residents away from Sydney.
CAPITAL GROWTH SET FOR MODEST This has typically benefitted Brisbane. More recently, a
CORRECTION strong economy and jobs market has supported record
high population growth in Victoria of over 2%.
Capital growth in recent years has been exceptional in Queensland has been experiencing an improvement in
Sydney, strong in Melbourne but more restrained in other net interstate migration over the last year.
markets. As a result, the price differential between Sydney
(and to a lesser extent Melbourne) and other markets has Apartment prices are expected to come under increased
become more pronounced since 2013-2014. Over the three negative pressure in 2018 - the result of high supply
years to June 2017, for example, median prices: completing in a short time frame and the stricter investor
lending environment. Annual median price growth has
• rose 47% for houses and 33% for units in Sydney; already turned negative in Brisbane and has been
• rose 27% for houses and 22% for units in Melbourne; trending down in Perth for the past three years. In Sydney
• rose 10% for houses and 3% for units in Brisbane; and Melbourne, the latest (September quarter) data
• fell 8% for houses and 11% for units in Perth. showed the first negative quarter since late 2015/early
2016. While the extent of price falls to date have been
The scale of growth witnessed in Sydney and Melbourne modest, further declines are likely in the next 12 months.
is unsustainable. Indeed, the September quarter recorded However, price declines of between 5-10% are usually
the first quarterly drop in Sydney’s median house price associated with normal market downswings in the
since the start of 2016 and a slowing of growth in absence of material supply imbalances.
Melbourne to just 0.7%. We expect this slowing
growth/moderate decline in Sydney and Melbourne will
continue into 2018.
Figure 12: Australian Residential Vacancy Rates
7%
Residential vacancy rate
6%
5%
4%
3%
2%
1%
0%
2007 2008 2009 2010 2011 2012 2013 2014 2015 2016 2017
Sydney Melbourne Brisbane Perth
Source: Real Estate Institute of Australia, February 2018.
© 2018 CBRE, Inc. 2018 ASIA PACIFIC REAL ESTATE MARKET OUTLOOK | AUSTRALIA CBRE RESEARCH
30RESIDENTIAL SECTOR
Figure 13: Australian Median Unit Prices
$800
Median unit price ($'000)
$700
$600
$500
$400
$300
$200
2007
2008
2009
2010
2011
2012
2013
2014
2015
2016
2017
Sydney Melbourne Brisbane Perth
Source: Real Estate Institute of Australia, February 2018.
2019-20 FOR THE NEXT SUPPLY CYCLE long period of subdued activity where undersupply
emerged in most of the capital city markets. While net
New development opportunities will likely emerge during numbers may indicate that supply has been addressed,
2019-20 for either deferred projects to be reactivated or for the strong bias towards medium/high density
new development schemes to be considered. Local development suggests a level of undersupply still exists or
developers (institutional and private) are likely to play a will re-emerge relatively quickly in some detached
greater role as prices paid by many offshore developers housing markets.
for sites, in conjunction with finance constraints, limit
the feasibility of projects. Offshore developers are likely to Over the decade to 2012, for example, detached dwelling
be most focussed on trophy sites in Sydney and, to a approvals nationally averaged 106,800 per annum with
lesser extent Melbourne, with secondary sites and second medium/high density approvals averaging 54,400 per
tier markets presenting less attractive development annum. In the five years since, detached dwelling
parameters. approvals have averaged 114,100 per annum (just 6.8%
higher) with medium/high density approvals averaging
Alternate development schemes are also likely to become 99,300 per annum (82.5% higher).
more evident. Office opportunities are already being
considered in some locations. If not, there is potential for Nonetheless, the pricing differential between detached
greater consideration to be given to schemes in emerging dwellings and units in most markets is at or close to
sectors such as aged care and the multifamily market. record levels and is expected to widen further as
apartment prices ease. This provides less incentive for
In the short term, developer attention appears to be people to trade up from units to houses and, as rentals
turning more towards medium density/townhouse supply also fall, less incentive for first home buyers to leave the
outside the immediate inner ring. Such development unit rental market. This suggests that the house/land
offers opportunities for a more controlled, staged release markets where first home buyers are targeted may also
of stock with lower levels of funding needed, thereby soften for a period, albeit less dramatically than inner
lowering development risk. Development over the city apartment markets.
medium term will need to be more tailored and of higher
quality to maximise the opportunity of success.
The surge in development approvals and activity, which
effectively began in 2012, must be placed into context of a
© 2018 CBRE, Inc. 2018 ASIA PACIFIC REAL ESTATE MARKET OUTLOOK | AUSTRALIA CBRE RESEARCH
31You can also read