An introduction to inequality in Europe - Tackling inequalities in Europe: the role of social investment - the social development bank in Europe
←
→
Page content transcription
If your browser does not render page correctly, please read the page content below
An introduction to inequality
in Europe
Tackling inequalities in Europe: the role of social investment
An introduction to inequalities in Europe

Disclaimer

The findings, interpretations and conclusions expressed here are those of the authors and do not
necessarily reflect those of the Organs of the Council of Europe Development Bank (CEB), who cannot
guarantee the accuracy of the data included in this study.

The designations employed and the presentation of the material in this study do not imply the expression
of any opinion whatsoever on the part of the CEB concerning the legal status of any country, territory,
city or area, or of its authorities, or concerning the delimitation of its frontiers or boundaries.

The study is printed in this form to communicate the result of an analytical work with the objective of
generating further discussions on the issue.

Acknowledgements

This study was drafted by Edo Omic (Economist) under the supervision of Jérôme Halb (Director of
Corporate Responsibility & Studies Department, Deputy Director for European Cooperation & Strategy).

December, 2017
An introduction to inequalities in Europe

                                       Table of contents

Overview of Key Findings                                                                           1

Chapter 1: Inequality across Europe                                                                2
    1.1.      Income inequality is on the rise in Europe                                           2
                  Central-Eastern Europe – A case of economic convergence and rising inequality    3
                  Northern Europe – A region striving to maintain high equality                    6
                  Southern Europe – Stubbornly high and growing inequality                         9
                  Western Europe – A gradual “equality recovery”                                  12
    1.2       Why tackling inequality matters                                                     14
                A national level perspective                                                      14
    1.3       What has driven inequality                                                          15
                Central-Eastern Europe - A historical overview of inequality                      17
                Inequality in the run-up of the 2008 financial crisis                             18

Chapter 2: The Background of Inequality                                                           19
    2.1.      The socio-economic costs to inequality                                              19
    2.2       The challenges of the bottom income groups                                          19
                  Lack of mobility at the bottom                                                  20
                  Financial burdens and socioeconomic costs of the bottom income quintiles        22

Conclusion                                                                                        25

Works Cited                                                                                       26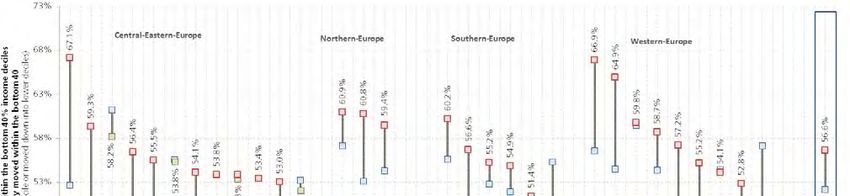
An introduction to inequalities in Europe
Table of graphs
Chapter 1: Inequality across Europe 2
Figure 1 - Gini Coefficient, Regional Averages, 1993, 2000, 2007, 2014 2
Figure 2 - Gini coefficient values, European regional averages (2000, 2008, 2013) 3
Table 1 - Eastern Europe GDP/Real Median Incomes/Gini Coefficient in Europe 5
Figure 3 - Index change in Income Share of Bottom 40%, Middle 50%, and Top 10% (year 2000 = 100) 5
Table 2 - Eastern Europe - Alternative inequality measures - Palma Ratio, 20/80 Ratio, and risk of poverty 6
Table 3 - Northern Europe GDP/Real Median Incomes/Gini Coefficient in Europe 7
Figure 4 - Index change of Income quintiles –Northern Europe averages without Iceland (year 2004 = 100) 7
Table 4 - Northern Europe - Alternative inequality measures - Palma Ratio, 20/80 Ratio, and Risk of poverty 8
Figure 5 - Income share of top 10% since 2004, by country 8
Table 5 - Southern Europe GDP/Real Median Incomes/Gini coefficient in Europe 9
Table 6 - Southern Europe - Alternative inequality measures - Palma Ratio, 20/80 Ratio, and Risk of poverty 10
Figure 6 - Index change of Median Income in Southern Europe (2009 =100) 10
Figure 7 - Index change of different Income quintiles – Southern Europe (year 2004 = 100) 11
Table 7 - Western Europe GDP/Real Median Incomes/Gini coefficient in Europe 12
Table 8 - Western Europe - Alternative inequality measures - Palma Ratio, 20/80 Ratio, and Risk of poverty 13
Chapter 2: The Background of Inequality 19
Figure 8 - Annualised Growth Rate of income group’s distribution of national income from 2008 to 2014 20
Figure 9 - The % of the population in the bottom 40% who have been unable to move out of the bottom
40% within three years 21
Figure 10 - Scatter Plot of '08-'15 average Palma and at risk of poverty rate 21
Figure 11 - Secondary school completion rate of bottom 40% and top 10% 22
Figure 12 - 2008-2015 average housing cost overburden rate, by bottom 20, bottom 20-40, and top 20 23
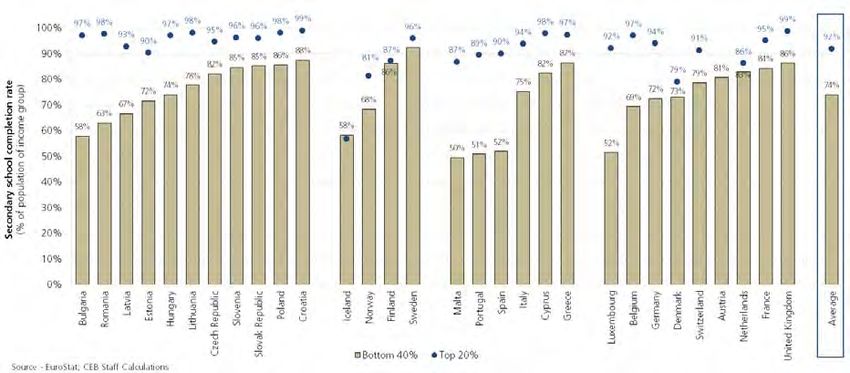
Figure 13 - 2008-2015 average self-reported health status – bad or very bad, bottom 40% and top 20% 24
An introduction to inequalities in Europe

                                                                                                                    1

Overview of Key Findings

The European continent is by far the richest, and on the whole, most equal continents in the world; but
inequality is on the rise. On this diverse continent, there have been many countries and whole regions which are
experiencing surges in inequality; and in many cases starting well before the 2008 financial crisis. Unchecked
increases in inequality will hamper the opportunities of lower-income groups and can threaten the social fabric
of our societies.

Inequality is on the rise in Europe – the continent has been seeing multiple inequality measures on the rise
for the last decade and a half. For instance, in 2014, on average, a person in the top 20% of the income
distribution was likely to have 5 times more than someone in the bottom 20% (as opposed to 4.6 times in
2000).

Southern and Central-Eastern Europe are the most unequal – these regions have experienced large
economic setbacks and are presently the most unequal in Europe. While Central-Eastern Europe has gradually
begun “repairing” some of the surges in inequality in recent years, in Southern Europe inequality measures are
only gaining more speed in their deterioration.

Equality progress is being rolled back or slowed – some regions and countries that have had historically low
levels of inequality (e.g. Nordic countries) are now slowing down the pace in tackling inequality and, in some
highly equal countries, inequality is on a continuous rise.

There is an overall increase in poverty risk for bottom quintiles – in many countries the rise in inequality
has been highly correlated to a sharp increase in the risk-of-poverty rates for lower-income quintiles. Thus
tackling inequality often means addressing the issues faced by the most vulnerable in European societies.

Income mobility is declining across the continent – those in the bottom 40% are today less likely to move
out of their socio-economic group than they were before 2008. The lack of opportunity to escape one’s
economic situation, despite one’s effort, points to a possibility of governments’ underproviding the resources to
facilitate mobility.

Inequalities between income groups persist – the bottom 40 are more likely to report worse health
outcomes than the rich, are less likely to have completed secondary education levels, and find housing costs to
be overwhelming since the 2008 crisis. When countries intervene to ensure these socio-economic disparities are
minimised (e.g. more investment in healthcare and educational access, and provision of social housing/housing
allowances), people in lower-income groups see increases in economic and personal well-being over the course
of their lives.

The reasons for the increase in inequality are different – Central-Eastern European countries have seen
inequality increase since their transition to market economies. Most countries (East, West, South, and North)
have seen income inequality widen because of technological changes (preference for high-skilled labour), labour
regulatory changes and, to a small degree, globalisation.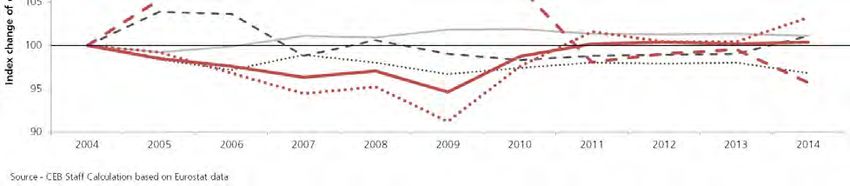
An introduction to inequalities in Europe
2
Chapter 1: Inequality across Europe
This chapter provides a broad quantitative, empirical/theoretical and historical overview of how income inequality
is shaping within Europe.
The chapter is divided into three sections:
Section 1.1 – This section provides various statistics and analyses to show the different measures of
inequality in the various regions of Europe and how they grew or decreased prior to the recession (2000-
2008) and after (2008-2014).
Section 1.2 – This section presents a brief literature review which offers the reader a cursory understanding
of why low inequality helps support economic growth and political stability.
Section 1.3 – The chapter concludes with an empirical and historical perspective of what has driven
inequality in Europe (globalisation, technological change, and policy shifts) over the last few decades – with
sub-sections dedicated to understanding inequality during Central-Eastern Europe’s transition to market-
economies and the run-up to the 2008 financial crisis.
1.1. Income inequality is on the rise in Europe
When looking at income inequality on a global level, there is some room for optimism. Today in many regions
around the world income inequality levels, as measured by the Gini coefficient1, are lower than they were in the
early 1990s (see figure 1). The three most unequal regions in 1993, Oceania, Africa, and the Americas, all saw
income inequality in 2014 well below their 1993 levels – although the trend is recent, in the Americas and Africa
it has begun to reverse. Asia, with its economic gains in recent decades at present has inequality levels lower
than the 1993 levels, but they are slowly sliding back.
Strikingly, the advanced economies of the world (excluding those in Europe) have seen consistently higher levels
of inequality in the last couple of decades, despite a drop just before the 2008 crisis. Europe, which is the
most equal region in the world, has seen inequality gradually but steadily increase since 2000.
Figure 1 - Gini Coefficient, Regional Averages, 1993, 2000, 2007, 2014
1
The Gini index measures the extent to which the distribution of income (or, in some cases, consumption expenditure) among individuals
or households within an economy deviates from a perfectly equal distribution. The Gini index measures the area between the Lorenz
curve and the hypothetical line of absolute equality, expressed as a percentage of the maximum area under the line. A Gini index of 0
represents perfect equality and 1, perfect inequality (i.e. one person holds all the wealth). (ILO 2012)An introduction to inequalities in Europe
3
Given the heterogeneity of countries in Europe, the steady increase in income inequality is not
universal, but 23 out of 39 countries are less equal than they were fourteen years ago. The regional
disparities are stark (see figure 2 below), with Central-Eastern and Southern European countries typically more
unequal than their Western and Northern counterparts. The different country-specific economic, social, political,
and regulatory environments (see section 1.2 for literature on the drivers of recent income inequality in Europe)
affect within-country income inequality.
Overall, inequality in Europe is on the rise. On average, European countries in 2014 had a Gini-coefficient of 30.52,
up from 30.4 in 2008 and 29.56 in 2000 (see Table 1). The increase after the onset of the 2008 financial recession
(between 2008 and 2014) was 0.11 Gini points, a much slower pace relative to the speed of change between
2000 and 2008, when inequality increased by 0.88 points.
Figure 2 - Gini coefficient values, European regional averages (2000, 2008, 2013)
Central-Eastern Europe – A case of economic convergence and rising inequality
Central-Eastern European is a representation of the continent’s diversity, with some countries being among the
most equal countries in Europe and others being the most unequal. The region has the largest concentration of
countries with above average inequality – 11 in total (see figure 2). In Central-Eastern Europe the underlying
reasons for the disparity are various (see section 1.3 for historical overview), but from a purely macroeconomic
perspective a number of arguments emerge that show-case a region enjoying large economic gains prior to
the recession with concurrent increases in inequality – Since the Great Depression, economic growth has
slowed but inequality levels still remain high.
The Pre-Recessionary period (2000 to 2008)
In the pre-recessionary years, inequality in Central-Eastern Europe rose noticeably, with an average Gini coefficient
increasing by 1.88 points from 29.8 in 2000 to 3.14 in 2008 (see Table 1, next page), well above the European
average increase of 0.85 points. In part, this jump in inequality reflects the social changes that occurred as countries
transitioned to market economies and began to economically converge towards “Western2” Europe.
2
Only in this instance, for ease of overall comparison, the term Western includes the countries of Southern, Western, and Northern
Europe (they are divided throughout the rest of the paper).An introduction to inequalities in Europe
4
The average annualised GDP growth rate for the region stood at 4.7% between 2000 and 2008 (well above the
European average of 2.2%). Almost all Central-Eastern European countries saw high growth rates that were often
correlated with a sharp increase in income inequality (with a few exceptions, such as Slovak Republic, Estonia,
Czech Republic, Hungary, and Albania). During this era of high GDP growth, many countries also experienced high
annualised growth rates of real median incomes3. Thus, despite growing income inequality, the overall population
also benefitted with personal economic gains. For instance, Lithuania and Latvia (the two fastest growing
economies in the region) saw real median incomes grow at an annualised rate of 18.9% and 17.5% respectively
(both countries also saw their Gini coefficients increase, by 3.5 and 3.8 points respectively).
Additional indicators of income inequality increased; namely the average Palma ratio4 and the 20/80 ratio5. The
Palma ratio examines the share of the top quintile relative to the bottom four quintiles, and changes in the ratio
explain much of the dynamics of inequality. A ratio above 1 indicates that the top 10% have more income than the
bottom 40%, and are more likely to see larger gains during periods when national income grows – (see footnote
3). The Palma ratio in Central-Eastern Europe consistently stayed above 1.0 in all time periods, and dramatically
increased from 1.169 (2000) to 1.3030 (2008).). While most countries saw surges in the Palma ratio before the
recession, in some countries such as Estonia, Republic of Moldova, Poland, Hungary, Slovak Republic and Slovenia
the ratio declined (the latter two having Palma ratios closer to levels seen in the more equitable Northern region).
The same story emerges when examining the 80/20 ratio – another measure of inequality that looks at the income
distribution ratio between the top 20% and the bottom 20%. On average in Central-Eastern Europe, the ratio
increased from 4.9 (2000) to 5.6 (2008) – indicating that those in the top 20% had incomes that were 5.6 times
larger than those in the bottom 20%.
The sharp increases in inequality measures meant that, while most people saw economic benefits and gains from
higher economic growth (as reflected in increases in real median incomes)6, the top income groups often
benefitted to a much greater extent.
Post-Recessionary period (2008-2014)
The macro-economic picture after the onset of the 2008 financial crisis was starkly different. The annualised GDP
growth rate dropped to 1.6% (2008-2014, see table 1). This positive growth was mostly driven by relatively healthy
GDP growth in Poland (2.9%), Albania (2.3%) and a handful of other moderately growing economies. Almost
every other country either saw noticeable GDP stagnation or, at worst, contractions (Croatia has a contraction rate
of -2.2%).
Real median income growth declined from previously robust levels – growing at a reduced annualised rate of 1.2%
(2008-2014). The drops in real median income growth were dramatic for some countries. In Estonia, Latvia and
Lithuania, between 2004/05 and 2008, one could expect to see median income levels grow annually by 13.8%,
18.9%, and 17.9%, respectively; after the crisis ( between 2008 to 2015) those figures dropped to 4.5%, 1.6%,
and 2.7%.
Inequality measures did not paint an optimistic picture. The average Gini coefficient in the region still increased, by
0.19, from 31.7 (2008) to 31.9(2014). For some countries, such as Bosnia & Herzegovina, Lithuania, “the former
Yugoslav Republic of Macedonia”, Montenegro, Serbia, and Slovenia, this was a continuation of a growing Gini
coefficient since 2000. For the Czech Republic, Estonia, Hungary, and Slovak Republic, all of which had made gains
in decreasing the Gini coefficient, the trend reversed and, in some cases, eliminated any gains made since 2000.
3
When data are available – median income data are not available for many of the Central-Eastern European economies.
4
The Palma ratio is an alternative form of measuring income inequality over the standard and widely used Gini coefficient. The basis for
the Palma ratio is that changes in inequality are typically determined by the richest 10% and the poorest 40% because those within the
50% and 90% (income quintiles 5-9) income levels often have a stable half of a nation’s gross national income, irrespective of country
and time, relative to those in the 40% (bottom 4 quintiles) and the top 10% (top quintile), which have more dynamic changes in income
shares – empirical evidence has shown that inequality is the result of changes in these “tail-ends” of the income distribution. Thus when
the ratio is above 1, it means that inequality is on the rise as the changes in income inequality are being “absorbed” more by the richest
10% of the population.
5
The 80.20 ratio is a measure of the inequality of income distribution. It is calculated as the ratio of total income received by the 20% of
the population with the highest income (the top quintile) to that received by the 20% of the population with the lowest income (the
bottom quintile) – example, if the 80/20 ratio for a country is 4, it means that those in the 80th percentile have incomes that are 4 times
higher than those in the 20th percentile.
6
When data were available for comparison.An introduction to inequalities in Europe
5
Table 1 - Central-Eastern Europe GDP/Real Median Incomes/Gini Coefficient in Europe
Annualised
Annualised Absolute
Growth Rate of
GDP - EUR millions - (in 2010 EUR) Growth Rate of Real Median Income (in 2015 EUR) Gini Coefficient Change in Gini
Real Median
GDP - (2010 EUR) coefficient
Income
2000 2008 2014 '00-'08 '08-'14 2000 2008 2015/16 '00-'08 '08-'16 2000 2008 2014 '00-'08 '08-'14
Central-Eastern Europe (avg-->) 74 450.99 107 758.54 118 405.47 4.7% 1.6% 4 682 5 291 5 824 4.2% 1.2% 29.8 31.7 31.9 1.88 0.19
Albania 5 229.70 8 393.50 9 622.80 6.1% 2.3% - - - - - 31.7 30.0 29.0 -1.8 -1.0
Bosnia and Herzegovina - - - - - - - - - - 29.9 33.1 33.8 3.2 0.8
Bulgaria 24 410.80 39 134.30 39 833.10 6.1% 0.3% - 2 381 3 189 - 3.7% 25.0 35.9 35.4 10.9 -0.5
Croatia 35 287.70 49 433.20 43 215.40 4.3% -2.2% - 6,277 + 5 762 - 1.5% 31.3 33.7 30.2 2.4 -3.5
Czech Republic 114 387.10 160 639.20 161 738.60 4.3% 0.1% 5,193** 6 668 7 784 8.7% 2.0% 27.0 24.7 25.1 -2.3 0.4
Estonia 10 662.00 16 876.40 17 223.20 5.9% 0.3% 3,871* 6 484 8 578 13.8% 3.6% 36.7 30.9 35.6 -5.8 4.7
Hungary 80 466.70 104 521.70 104 581.80 3.3% 0.0% 4,997** 5 358 4 751 2.4% -1.5% 26.0 25.2 28.6 -0.8 3.4
Kosovo - - - - - - - - - - 29.0 30.3 26.7 1.4 -3.6
Latvia 12 275.30 21 582.60 20 626.90 7.3% -0.8% 3,083** 5 187 6 368 18.9% 2.6% 33.7 37.5 35.5 3.8 -2.0
Lithuania 18 320.70 32 371.00 33 061.80 7.4% 0.4% 2,861** 4 687 5 606 17.9% 2.3% 31.0 34.5 35.0 3.5 0.5
Moldova (Republic of) - - - - - - - - - - 39.2 34.4 26.8 -4.8 -7.6
Montenegro - - 3 307 - - - - - - - 30.2 30.5 31.9 0.3 1.4
Poland 246 226.60 339 629.50 404 276.70 4.1% 2.9% 3,155** 4 786 5 917 14.9% 2.7% 30.0 32.0 30.8 2.0 -1.2
Romania 82 976.60 137 482.20 137 564.20 6.5% 0.0% - 2 495 2 474 -0.1% 29.0 35.9 35.0 6.9 -0.9
Serbia 19 310.20 30 545.10 30 084.20 5.9% -0.3% - - 2 521 - - 31.1 32.7 38.6 1.6 5.9
Slovak Republic 41 894.50 68 022.30 73 529.60 6.2% 1.3% 3,463** 5 310 6 985 15.3% 3.5% 26.4 23.7 26.1 -2.7 2.4
Slovenia 27 888.10 38 837.50 36 211.50 4.2% -1.2% 10,835** 11 945 12 346 3.3% 0.4% 22.3 23.4 25.0 1.1 1.6
“the former Yugoslav
5 302.80 6 902.00 7 723.80 3.3% 1.9% - - - - - 27.7 31.5 35.2 3.8 3.7
Republic of Macedonia”
Turkey 392 126.10 562 007.60 771 886.50 4.6% 5.4% - 2 903 3 438 - 2.9% - 43.0 42.1 - -0.9
Northern Europe (avg-->) 193 582.48 230 885.48 237 808.74 2.2% 0.5% 27 596 30 760 27 782 1.4% -1.3% 24.4 25.6 25.0 1.2 -0.6
Southern Europe (avg-->) 466 703.57 541 340.90 492 858.35 1.9% -1.6% 11 419 13 564 12 242 2.2% -1.3% 31.5 31.7 33.1 0.2 1.4
Western Europe (avg-->) 815 242.40 942 750.74 979 608.90 1.8% 0.6% 20 428 23 394 25 916 1.7% 1.3% 28.7 29.5 28.9 0.8 -0.6
Europe Average 352 849.09 419 193.89 417 248.70 2.2% -0.1% 15 072 16 256 15 798 - -0.4% 29.30 30.41 30.52 1.10 0.11
^2001
‡ 2003 > 2.5% (High Growth ) > - 0 Declining
* 2004 1% to 2.5% (Moderate Growth ) Inequality
**2005 +2010 0% to 1% (Stagnation - Low Growth) < + 0 Growing
Source - Eurostat, World Income Inequalities Database, and CEB Staff Calculations < 0% (Contraction ) Inequality
However, the Palma ratio, on average, dropped from 1.303 (2008) to 1.247 (2014), In part this was a reflection of
the fact that the top 10% saw their share of income drop after the recession relative to the bottom 40%, but this
trend has recently begun to reverse (see figure 3 below) – while the middle 50% (quintiles 5-9) have seen slightly
positive but not dramatic deviations from their share of national income since 2000.
Figure 3 - Index change in Income Share of Bottom 40%, Middle 50%, and Top 10% (year 2000 = 100)
The 80/20 ratio also dropped, by 0.11 from 5.6 (2008) to 5.5 (2014). However, similar to the Palma ratio, the drop
in most countries rarely made up for the larger increases prior to the recession – aside from Kosovo, “the former
Yugoslav Republic of Macedonia”. Estonia, Hungary, Slovak Republic, and Slovenia, the trend of reducing the
80/20 ratio reversed and, in some cases, the gains in reducing the ratio have not only been lost, but have surpassed
2000 levels.An introduction to inequalities in Europe
6
Table 2 - Central-Eastern Europe - Alternative inequality measures - Palma Ratio, 20/80 Ratio, and risk of
poverty
Absolute Risk of Poverty Risk of Poverty of
Absolute Change in
Palma Ratio 80/20 Ratio Change in 20/80 bottom 25% income Change 25% to 50% Change
Palma Ratio
Ratio quartile income quartile
2000 2008 2014 '00-'08 '08-'14 2000 2008 2014 '00-'08 '08-'14 2007 2014 '7-'14 2007 2014 '7-'14
Central-Eastern Europe (avg-->) 1.169 1.303 1.247 0.13 -0.06 4.95 5.56 5.45 0.61 -0.11 86.9 91.2 4.25 35.9 34.0 -1.92
Albania 1.22 1.11 1.04 -0.10 -0.07 4.8 4.4 4.3 -0.44 -0.12 - - - - -
Bosnia and Herzegovina 1.12 - 1.33 - - 4.4 5.7 - - - - - - -
Bulgaria 1.15 1.51 1.46 0.36 -0.05 5.0 6.4 6.8 1.42 0.33 100.0 100.0 Maximum 74 51.5 -22.50
Croatia 1.20 1.37 1.07 0.18 -0.30 4.8 5.3 5.1 0.48 -0.23 - 98.6 - 25.3
Czech Republic 0.81 0.86 0.88 0.06 0.02 3.3 3.4 3.5 0.17 0.07 59.0 57.3 -1.70 11 8.5 -2.50
Estonia 1.52 1.15 1.44 -0.37 0.29 6.4 5.0 6.5 -1.41 1.45 97.6 100.0 2.40 7.8 21.3 13.50
Hungary 0.97 0.87 1.04 -0.10 0.17 3.9 3.6 4.4 -0.29 0.78 78.9 87.9 9.00 31 34.6 3.60
Kosovo 1.05 1.21 0.93 0.16 -0.28 4.2 5.0 3.9 0.82 -1.16 0.00 - - -
Latvia 1.44 1.64 1.45 0.20 -0.19 6.0 7.3 6.5 1.37 -0.83 100.0 100.0 0.00 37.1 32.8 -4.30
Lithuania 1.20 1.39 1.41 0.18 0.03 5.1 6.1 6.1 1.09 -0.05 97.2 97.3 0.10 22.2 21.3 -0.90
Moldova (Republic of) 1.54 1.40 0.94 -0.14 -0.46 6.3 5.8 3.8 -0.55 -2.01 - - - - -
Montenegro 1.14 1.24 1.14 0.10 4.7 4.8 4.66 0.13 - - - - -
Poland 1.29 1.23 1.14 -0.06 -0.09 5.2 5.1 4.9 -0.07 -0.22 92.6 88.0 -4.60 35.2 18.6 -16.60
Romania 1.07 1.50 1.38 0.43 -0.12 4.4 7.0 7.3 2.58 0.23 100.0 100.0 Maximum 64.7 52.8 -11.90
Serbia - 1.03 1.70 - 0.67 - - 6.7 - - - 100.0 - 57.6
Slovak Republic 0.83 0.80 0.90 -0.04 0.10 3.4 3.3 3.9 -0.03 0.55 66.8 70.2 3.40 18.6 10.4 -8.20
Slovenia 0.85 0.78 0.84 -0.07 0.06 3.5 3.4 3.7 -0.19 0.36 64.3 77.5 13.20 10.7 13.1 2.40
“the former Yugoslav
- - -
Republic of Macedonia” 1.45 2.29 1.39 0.84 -0.90 8.3 9.3 7.2 0.97 -2.14 100.0 60.1
Turkey - 2.16 2.10 - -0.07 - 9.2 8.8 - -0.41 100.0 100.0 0.00 82.8 68.1 -14.70
Northern Europe (avg-->) 0.860 0.890 0.858 0.030 -0.032 3.56 3.70 3.63 0.13 -0.07 63.8 64.8 1.04 8.4 7.6 -0.78
Southern Europe (avg-->) 1.197 1.205 1.296 0.008 0.091 5.12 5.22 5.79 0.10 0.57 92.3 93.5 1.25 15.4 27.1 11.65
Western Europe (avg-->) 1.015 1.094 1.048 0.08 -0.05 4.20 4.49 4.43 0.29 -0.06 77.3 80.2 2.96 10.84 12.50 1.66
Europe Average 1.10 1.18 1.16 0.09 -0.02 4.61 4.99 5.04 0.38 0.04 81.43 84.82 3.39 20.23 23.21 2.97
Since the recession, the risk of poverty by different income levels has also changed (see table 2). Of those people in
the bottom 25% income quartile in Central-Eastern Europe, 91.2% had an equalised disposable income which was
below the at-risk-of-poverty threshold7 - up 4.3%, from 86.9% in 2007. Encouragingly, for those in the 25% to
50% income quartile, the at-risk-of-poverty rate dropped from 35.9% to 34.0% (down 1.9%). Estonia, Hungary,
and Slovenia were the only countries that saw increases for this quartile group (Estonia being a noticeable outlier,
increasing by 13.5%).
Northern Europe – A region striving to maintain high equality
The Nordic Countries are undoubtedly the most equal nations in Europe and the world. Citizens living near the
Artic can expect to live in a society that scores well on almost all inequality measures – the average Gini coefficient
in 2014 stood at 25 (the European average is 30.52), and the average Palma ratio was 0.86 (well below the 1.0,
indicating that the top 10% do not have a disproportionately large share of a nation’s wealth). However, as was
the case in many parts of Europe, in the run-up to the recession inequality measures did begin to creep up
slightly and the region is now working to rescind those losses.
The Pre-Recessionary period (2000 to 2008)
Before 2008, Northern Europe experienced the healthy economic growth seen throughout the continent and
annualised GDP growth stood at 2.2% (the same as the European average). Citizens of the region saw healthy but
not dramatic increases in real median incomes, with an annualised growth rate of 1.4% (see Table 3). Although
this growth rate was the lowest compared to the other regions, people were comforted knowing they had the
highest real median incomes in all of Europe.
7
The at-risk-of-poverty threshold is set at 60% of the national median equalised disposable income after social transfers. This indicator does
not measure wealth or poverty, but low income in comparison to other residents in that country, which does not necessarily imply a low
standard of living.An introduction to inequalities in Europe
7
Table 3 - Northern Europe GDP/Real Median Incomes/Gini Coefficient in Europe
Annualised Annualised Growth Absolute
GDP - EUR millions - (in 2010 EUR) Growth Rate of Real Median Income (in 2015 EUR) Rate of Real Median Gini Coefficient Change in Gini
GDP - (2010 EUR) Income coefficient
2000 2008 2014 '00-'08 '08-'14 2000 2008 2015/16 '00-'08 '08-'16 2000 2008 2014 '00-'08 '08-'14
Central-Eastern Europe (avg-->) 74 450.99 107 758.54 118 405.47 4.7% 1.6% 4 682 5 291 5 824 4.2% 1.2% 29.8 31.7 31.9 1.88 0.19
Northern Europe (avg-->) 193 582.48 230 885.48 237 808.74 2.2% 0.5% 27 596 30 760 27 782 1.4% -1.3% 24.4 25.6 25.0 1.2 -0.6
Denmark 225 211.40 251 015.50 253 457.00 1.4% 0.2% 25,226‡ 26 485 28 659 1.0% 1.0% 22.0^ 25.1 27.7 3.1 2.6
Finland 158 091.00 198 040.00 186 553.00 2.9% -1.0% 18 502 22 521 23 558 2.5% 0.6% 24.0 26.3 25.6 2.3 -0.7
Iceland 7 773.80 11 152.50 10 995.20 4.6% -0.2% 40,348* 46 797 23 693 3.8% -8.2% 24.1 27.3 22.7 3.2 -4.6
Norway 277 172.50 326 956.20 345 561.60 2.1% 0.9% 33,834‡ 35 837 38 084 1.2% 0.8% 26.0 25.1 23.5 -0.9 -1.6
Sweden 299 663.70 367 263.20 392 476.90 2.6% 1.1% 20,072* 22 162 24 918 2.5% 1.5% 25.7 24.0 25.4 -1.7 1.4
Southern Europe (avg-->) 466 703.57 541 340.90 492 858.35 1.9% -1.6% 11 419 13 564 12 242 2.2% -1.3% 31.5 31.7 33.1 0.2 1.4
Western Europe (avg-->) 815 242.40 942 750.74 979 608.90 1.8% 0.6% 20 428 23 394 25 916 1.7% 1.3% 28.7 29.5 28.9 0.8 -0.6
Europe Average 352 849.09 419 193.89 417 248.70 2.2% -0.1% 15 072 16 256 15 798 - -0.4% 29.30 30.41 30.52 1.10 0.11
^2001
‡ 2003 > 2.5% (High Growth ) > - 0 Declining
* 2004 1% to 2.5% (Moderate Growth ) Inequality
**2005 +2010 0% to 1% (Stagnation - Low Growth) < + 0 Growing
Source - Eurostat, World Income Inequalities Database, and CEB Staff Calculations < 0% (Contraction ) Inequality
However, the healthy macroeconomic conditions did correlate with an increase in inequality measures. The Gini
coefficient increased by 1.2 points in the region – slightly more than the European average of 1.1. The Palma ratio
also crept up slightly to 0.89 (2008) from 0.86 (2000), as did the 80/20 ratio rising to 3.7 (2008) from 3.56 (2000).
The countries that saw the largest increases in inequality indicators in the run-up to the recession were Denmark,
Finland and Iceland. Due to the high growth that Iceland achieved relative to its northern neighbours, it became a
clear outlier. The top 10% share of income in the run-up to the recession exploded relative to the regional average
(see figure 4), as a small group of people accumulated overinflated incomes before 2008 and drove much of the
increases in inequality.
Figure 4 - Index change of Income quintiles –Northern Europe averages without Iceland (year 2004 = 100)An introduction to inequalities in Europe
8
Table 4 - Northern Europe - Alternative inequality measures - Palma Ratio, 20/80 Ratio, and Risk of
poverty
Absolute Risk of Poverty Risk of Poverty of
Absolute Change
Palma Ratio 80/20 Ratio Change in 20/80 bottom 25% income Change 25% to 50% income Change
in Palma Ratio
Ratio quartile quartile
2000 2008 2014 '00-'08 '08-'14 2000 2008 2014 '00-'08 '08-'14 2007 2014 '7-'14 2007 2014 '7-'14
Eastern Europe (avg-->) 1.169 1.303 1.247 0.13 -0.06 4.95 5.56 5.45 0.61 -0.11 86.9 91.2 4.25 35.9 34.0 -1.92
Northern Europe (avg-->) 0.860 0.890 0.858 0.030 -0.032 3.56 3.70 3.63 0.13 -0.07 63.8 64.8 1.04 8.4 7.6 -0.78
Denmark 0.85‡ 0.86 0.99 0.01 0.13 3.58‡ 3.60 4.11 0.02 0.51 66.6 68.9 2.30 11.1 13.8 2.70
Finland 0.80 0.93 0.89 0.13 -0.04 3.40 3.78 3.60 0.38 -0.18 72.9 72.3 -0.60 8.6 8.6 0.00
Iceland 0.83 1.00 0.77 0.16 -0.22 3.41 3.85 3.14 0.44 -0.71 53.9 44.5 -9.40 5.9 8.0 2.10
Norway 0.93 0.86 0.79 -0.07 -0.07 3.73 3.72 3.43 -0.01 -0.29 67.1 60.1 -7.00 10.5 3.9 -6.60
Sweden 0.89 0.80 0.85 -0.08 0.05 3.72 3.54 3.87 -0.19 0.33 58.4 78.3 19.90 6.0 3.9 -2.10
Southern Europe (avg-->) 1.197 1.205 1.296 0.008 0.091 5.12 5.22 5.79 0.10 0.57 92.3 93.5 1.25 15.4 27.1 11.65
Western Europe (avg-->) 1.015 1.094 1.048 0.08 -0.05 4.20 4.49 4.43 0.29 -0.06 77.3 80.2 2.96 10.84 12.50 1.66
Europe Average 1.10 1.18 1.16 0.09 -0.02 4.61 4.99 5.04 0.38 0.04 81.43 84.82 3.39 20.23 23.21 2.97
> - 0 Declining
Inequality
< + 0 Growing
Source - Eurostat, World Income Inequalities Database, and CEB Staff Calculations Inequality
Post-Recessionary period (2008-2014)
The wealthy northern region has not been immune from the effects of the 2008 financial crisis. Macroeconomic
conditions began to deteriorate – annualised GDP growth dropped to an anaemic 0.5%. Real median incomes
shrank by 1.3% annually; although this is exclusively due to Iceland’s dramatic drop in real median incomes (the
remaing Northern countries primarily saw real median income growth stagnate). Although Finland and Iceland both
saw GDP contractions from 2008 to 2014, this only translated to real median incomes dropping for Icelanders
(contracting at an annual rate of 8.2% from 2008 to 2015/16).
Encouragingly, the average regional inequality measures declined. The average Gini coefficient fell 0.6 points to
25.0. However, this did not make up for the 1.2 point increase in the pre-recessionary period (see Table 4). The
Palma ratio also declined to 0.858 (2014), marginally below the 2000 level of 0.86. The 80/20 ratio also dropped
by 0.07 points, but, much like the Gini, did not make up for the 0.13 increase prior to the recession. As of 2014,
those in the top 20% still had 3.63 times more income than those in the bottom 20%8. However, Denmark and
Sweden were regional outliers, Denmark continued to see inequality increase, with all inequality measures (Gini,
Palma, 80/20) surpassing the regional averages in 2014 and being well above their 2000 lows (see Tables 3 and 3).
Figure 5 - Income share of top 10% since 2004, by country
8
It is important to note that these figures are still among the lowest both in Europe and globally.An introduction to inequalities in Europe
9
In part this is a result of the top 10% seeing their share of national income growing at a sustained pace, and
reaching a peak over the last decade (see figure 5 above). On the other hand, during the boom years Sweden
performed exceptionally well, decreasing on all inequality measures. However, since 2008, its Gini coefficient has
increased by 1.4 points; the Palma ratio is slightly up by 0.05, and the 80/20 by 0.33. Although the overall figures
for all three indicators were very low in 2014, the reversal is notable (see Tables 2 and 3).
Both Denmark and Sweden were marked by increases in the proportion of people in the bottom 25% quartile with
disposable incomes below the at-risk-of-poverty threshold – Denmark at 68.9% (up 2.3% since 2007) and Sweden at
78.3% (up an eye watering 19.9%). However, the regional average still stood at a European low of 64.8% in 2014.
Table 5 - Southern Europe GDP/Real Median Incomes/Gini coefficient in Europe
Annualised Annualised Growth Absolute
GDP - EUR millions - (in 2010 EUR) Growth Rate of Real Median Income (in 2015 EUR) Rate of Real Gini Coefficient Change in Gini
GDP - (2010 EUR) Median Income coefficient
2000 2008 2014 '00-'08 '08-'14 2000 2008 2015/16 '00-'08 '08-'16 2000 2008 2014 '00-'08 '08-'14
Central-Eastern Europe (avg-->) 74 450.99 107 758.54 118 405.47 4.7% 1.6% 4 682 5 291 5 824 4.2% 1.2% 29.8 31.7 31.9 1.88 0.19
Northern Europe (avg-->) 193 582.48 230 885.48 237 808.74 2.2% 0.5% 27 596 30 760 27 782 1.4% -1.3% 24.4 25.6 25.0 1.2 -0.6
Southern Europe (avg-->) 466 703.57 541 340.90 492 858.35 1.9% -1.6% 11 419 13 564 12 242 2.2% -1.3% 31.5 31.7 33.1 0.2 1.4
Cyprus 14 314.20 19 392.20 17 363.90 3.9% -1.8% 15,512** 17 314 14 193 3.7% -2.5% 29.0 29.0 34.8 0.0 5.8
Greece 189 901.30 249 880.40 184 873.20 3.5% -4.9% 9 749 11 545 7 503 2.1% -5.2% 33.0 33.4 34.5 0.4 1.1
Italy 1 555 551.00 1 669 421.00 1 542 924.00 0.9% -1.3% 13 434 17 301 15 846 3.2% -1.1% 29.0 31.2 32.4 2.2 1.2
Malta 5 391.60 6 534.60 7 769.90 2.4% 2.9% 10,516** 11 331 13 451 2.5% 2.2% 30.0 28.1 27.7 -1.9 -0.4
Portugal 167 145.30 181 997.20 169 108.10 1.1% -1.2% 7 737 8 786 8 726 1.6% -0.1% 36.0 35.8 34.5 -0.2 -1.3
Spain 867 918.00 1 120 820.00 1 035 111.00 3.2% -1.3% 11 564 15 110 13 732 3.4% -1.2% 32.0 32.4 34.7 0.4 2.3
Western Europe (avg-->) 815 242.40 942 750.74 979 608.90 1.8% 0.6% 20 428 23 394 25 916 1.7% 1.3% 28.7 29.5 28.9 0.8 -0.6
Europe Average 352 849.09 419 193.89 417 248.70 2.2% -0.1% 15 072 16 256 15 798 - -0.4% 29.30 30.41 30.52 1.10 0.11
^2001
‡ 2003 > 2.5% (High Growth ) > - 0 Declining
* 2004 1% to 2.5% (Moderate Growth ) Inequality
**2005 +2010 0% to 1% (Stagnation - Low Growth) < + 0 Growing
Source - Eurostat, World Income Inequalities Database, and CEB Staff Calculations < 0% (Contraction ) Inequality
Southern Europe – Stubbornly high and growing inequality
The Southern European region, on average, is the most unequal part of Europe on all measures of
inequality. The region faced a sharp economic downturn with GDP and real median incomes radically
contracting in many countries after the onset of the 2008 financial crisis. Worryingly, inequality measures
have been continually increasing since 2000, and have only intensified in their speed since 2008. While the risk of
poverty for those in the bottom 25% is on the up in most regions, this has also extended to those in the lower-
middle income categories, i.e bottom 25% to 50% (for all countries). All of this points to a region that is burdened
with severe inequality issues which place pressures on social stability and cohesion.
The Pre-Recessionary period (2000 to 2008)
As was the case throughout Europe, Southern European economies had moderately healthy GDP growth prior to
the recession at an annualised rate of 1.9% (except for Italy, which had a growth rate of 0.9%). Every country saw
real median incomes increase, with a regional annualised growth rate of 2.2%.
The inequality measures all began slowly to edge up. The regional average Gini coefficient stood at 31.7 in
2008), up from 31.5 in 2008 (see Table 5). Greece, Italy, and Spain all saw their Gini coefficient increase (up by
0.4, 2.2, and 0.4 points respectively). Although Malta and Portugal saw declines, in both cases the Gini
coefficient was at a relative high by European standards [especially Portugal, with a Gini coefficient of 36.0
(2000), declining to 35.8 (2008)].
The Palma ratio also crept up slightly, to 1.2 (2008) – see Table 6. The high Palma ratios throughout the region
indicated the disproportionate amount of wealth that the top 10% obtained during the boom years, relative to the
bottom 40%. Portugal and Greece were notable in that their Palma ratios stood at 1.495 and 1.303 respectively by
the time the crisis hit (among the highest Palma ratios throughout Europe). The 80/20 ratio also saw a slight
increase, with a regional average value of 5.22, meaning that the top 20% had over 5 times the wealth of those in
the bottom 20%.An introduction to inequalities in Europe
10
Post-recessionary period (2008 to 2014)
As is now well documented, the Southern European region was the hardest hit by the 2008 financial crisis. The
macroeconomic indicators began to perform poorly from the beginning and the region has yet to recover. The
region had an annualised contraction of -1.6% from 2008 to 2014. Aside from Malta (which did recover quickly
after the recession) all other countries saw sharp GDP contractions (Greece was the worst performing, with an
annualised contraction rate of -4.9%).
Table 6 - Southern Europe - Alternative inequality measures - Palma Ratio, 20/80 Ratio, and Risk of
poverty
Absolute Risk of Poverty Risk of Poverty of
Absolute Change
Palma Ratio 80/20 Ratio Change in 20/80 bottom 25% income Change 25% to 50% income Change
in Palma Ratio
Ratio quartile quartile
2000 2008 2014 '00-'08 '08-'14 2000 2008 2014 '00-'08 '08-'14 2007 2014 '7-'14 2007 2014 '7-'14
Central-Eastern Europe (avg-->) 1.169 1.303 1.247 0.13 -0.06 4.95 5.56 5.45 0.61 -0.11 86.9 91.2 4.25 35.9 34.0 -1.92
Northern Europe (avg-->) 0.860 0.890 0.858 0.030 -0.032 3.56 3.70 3.63 0.13 -0.07 63.8 64.8 1.04 8.4 7.6 -0.78
Southern Europe (avg-->) 1.197 1.205 1.296 0.008 0.091 5.12 5.22 5.79 0.10 0.57 92.3 93.5 1.25 15.4 27.1 11.65
Cyprus 1.116 1.063 1.447 -0.05 0.38 4.4 4.3 5.4 -0.14 1.09 84.2 80.5 -3.70 22.5 28.2 5.70
Greece 1.200 1.303 1.369 0.10 0.07 5.7 5.9 6.4 0.16 0.54 100.0 100.0 Maximum 22.1 46.8 24.70
Italy 1.048 1.161 1.226 0.11 0.07 4.6 5.2 5.8 0.59 0.56 98.2 98.1 -0.10 14.5 20.8 6.30
Malta - 0.986 0.987 - 0.00 - 4.3 4.0 - -0.21 80.4 84.5 4.10 9 18.4 9.40
Portugal 1.421 1.495 1.384 0.07 -0.11 6.0 6.1 6.2 0.13 0.10 92.1 98.0 5.90 16 20.1 4.10
Spain 1.198 1.222 1.365 0.02 0.14 4.8 5.6 6.9 0.75 1.32 98.7 100.0 1.30 8.3 28 19.70
Western Europe (avg-->) 1.015 1.094 1.048 0.08 -0.05 4.20 4.49 4.43 0.29 -0.06 77.3 80.2 2.96 10.84 12.50 1.66
Europe Average 1.10 1.18 1.16 0.09 -0.02 4.61 4.99 5.04 0.38 0.04 81.43 84.82 3.39 20.23 23.21 2.97
> - 0 Declining
Inequality
Source - Eurostat, World Income Inequalities Database, and CEB Staff Calculations < + 0 Growing
Inequality
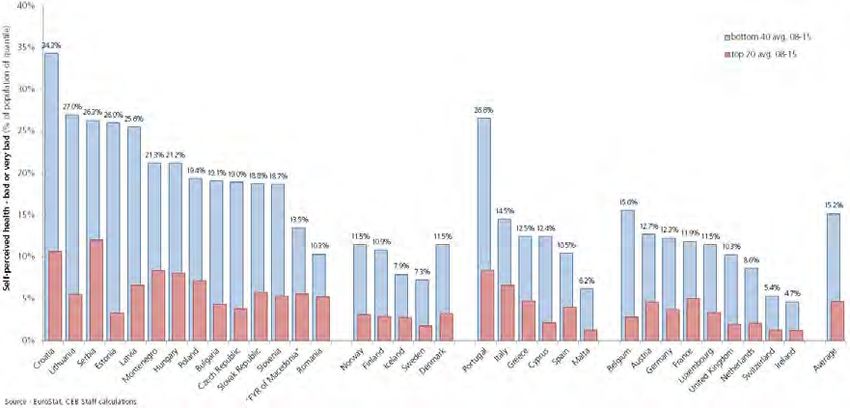
Real median incomes are still below their 2008 peaks in many countries, with the regional real median income
contracting annually by -1.3%. Real median worker incomes in Cyprus, Greece, and Spain remained in negative
growth territory from the recession to 2014, and today appear unlikely to return to pre-recessionary levels any time
soon (see figure 6). Spain initially saw a decline in real median income levels which halted and stagnated soon
afterwards. Portugal and Italy are slowly recovering to their real median income levels achieved in 2008/2009, but
growth has been slow. Only Malta has seen real median income levels grow well above the 2008/2009 levels.
Figure 6 - Index change of Real-Median Income in Southern Europe (2009 =100)An introduction to inequalities in Europe
11
Southern Europe in 2014 had the highest average regional scores on all inequality measures - the Gini
coefficient, the Palma ratio, and the 80/20 ratio (see Tables 5 and 6). The average regional Gini coefficient
increased by 1.4 points from 31.7 (2008) to 33.1 (2014). Likewise, the Palma ratio increased to 1.296 (2014)
from 1.205 (2008), as did the average 80/20 ratio, up 0.57 points to 5.79 (2014) from 5.22 (2008). While
average scores on all inequality measures were already increasing prior the recession, what is remarkable is how
much larger the magnitude of change was from 2008 to 2014, in contrast to the increases from 2000 to 2008 –
see Tables 5 and 6.
Malta was once again the exception with continually declining inequality indicators. Portugal also saw continued
declines in the Gini coefficient (see Table 5), although from a relatively high level in 2000. The Palma ratio in
Portugal declined from 1.495 (2008) to a historical low of 1.384 (2014); on the other hand, the 80/20 ratio
continued to increase; 6.0 (2000) to 6.2 (2014).
The continually high levels of inequality seen in Southern Europe are very much a reflection of the large
variations between the top 10% and the bottom 40% - see Figure 7. The top 10% saw their share of the
national income at levels higher than 2000 right up to 2004, but then the share took a dip just before the
financial crisis as the incomes of the bottom 40% began to increase. From the onset of the crisis, the bottom
40% share of income remained on a persistent downward path, well below 2000 levels. On the other hand, the
top 10% share of wealth only increased, and is now on a trajectory to reach 2002 peaks, contributing to
widening inequality.
Figure 7 - Index change of different Income quintiles – Southern Europe (year 2004 = 100)
Another worrying indicator is the significant increase in the proportion of people with disposable incomes below
the at-risk-of-poverty threshold in both the bottom 25% quartile and the lower-middle quartile (25th to 50th
quartile). The proportion of those in the bottom 25% at risk of poverty stood at 93.5% in 2014 (up by 1.25% from
2007). In both Spain and Greece, every person (100%) of those in the bottom 25% quartile were at risk of poverty
in 2014. Italy and Portugal were close behind at 98.1% and 98%, respectively. However, what is alarming is that
for every country, a quarter of people in the lower-middle income quartile (25% to 50%) are now at risk of
poverty. In Greece that figure stood at 46% and in both Cyprus and Italy at 28.2% and 28% respectively. This
indicates that the harsh economic reality has taken a toll not just on the poorest members of society, but has also
affected those closer to the middle-income levels. No other region in Europe has seen such stark and large changes
that threaten to make large portions of society materially vulnerable.An introduction to inequalities in Europe
12
Western Europe – A gradual “equality recovery”
Western Europe is the wealthiest region on the continent, and has made substantial efforts to keep
inequality relatively low - but in the run-up to the recession those inequality measures were on the
rise. However, the region is also extremely heterogeneous, with economically strong but relatively (to the region)
unequal nations such as the United Kingdom and Germany, and economically smaller but more equal societies
such as Austria, Belgium, and Luxembourg. The region also includes economically volatile countries such as
Ireland. The Western European story is also peculiar in the paths to or from lower equality. Some countries which
saw declines in inequality in the run-up to the recession, saw a reversal after the crash (Germany, Ireland) while
others which were becoming more unequal up to 2008, were now on a more encouraging path (France,
Switzerland, United Kingdom, the Netherlands). However, the regional averages show a picture of inequality
ticking up to 2008, and now slowly but gradually returning towards lower inequality.
Table 7 - Western Europe GDP/Real Median Incomes/Gini coefficient in Europe
Annualised Annualised Growth Absolute
GDP - EUR millions - (in 2010 EUR) Growth Rate of Real Median Income (in 2015 EUR) Rate of Real Median Gini Coefficient Change in Gini
GDP - (2010 EUR) Income coefficient
2000 2008 2014 '00-'08 '08-'14 2000 2008 2015/16 '00-'08 '08-'16 2000 2008 2014 '00-'08 '08-'14
Central-Eastern Europe (avg-->) 74 450.99 107 758.54 118 405.47 4.7% 1.6% 4 682 5 291 5 824 4.2% 1.2% 29.8 31.7 31.9 1.88 0.19
Northern Europe (avg-->) 193 582.48 230 885.48 237 808.74 2.2% 0.5% 27 596 30 760 27 782 1.4% -1.3% 24.4 25.6 25.0 1.2 -0.6
Southern Europe (avg-->) 466 703.57 541 340.90 492 858.35 1.9% -1.6% 11 419 13 564 12 242 2.2% -1.3% 31.5 31.7 33.1 0.2 1.4
Western Europe (avg-->) 815 242.40 942 750.74 979 608.90 1.8% 0.6% 20 428 23 394 25 916 1.7% 1.3% 28.7 29.5 28.9 0.8 -0.6
Austria 253 712.60 300 467.60 307 508.90 2.1% 0.4% 20 149 21 988 23 466 1.1% 0.8% 24.0 27.7 27.6 3.7 -0.1
Belgium 311 462.80 363 833.20 378 068.20 2.0% 0.6% 19 701 19 992 21 905 0.2% 1.1% 30.0 27.5 25.9 -2.5 -1.6
France 1 771 701.00 2 019 351.00 2 068 624.00 1.6% 0.4% 18 021 20 467 21 653 1.6% 0.7% 28.0 29.8 29.2 1.8 -0.6
Germany 2 358 691.00 2 626 501.00 2 743 894.00 1.4% 0.7% 19 319 19 917 21 178 0.4% 0.8% 30.7 30.2 30.7 -0.5 0.5
Ireland 124 653.50 171 628.50 181 164.10 4.1% 0.9% 15 719 23 111 21 689 4.9% -0.8% 30.0 29.9 30.8 -0.1 0.9
Luxembourg 30 789.10 40 059.90 45 093.10 3.3% 2.0% 31 396 34 762 35 270 1.3% 0.2% 26.0 27.7 28.7 1.7 1.0
Netherlands 554 727.40 647 158.80 643 023.70 1.9% -0.1% 17 884 21 614 22 720 2.4% 0.6% 29.0 27.6 26.2 -1.4 -1.4
Switzerland 365 238.20 435 822.70 468 976.10 2.2% 1.2% - 26 544 44 369 - 6.6% 28.5 31.1 29.5 2.6 -1.6
United Kingdom 1 566 206.00 1 879 934.00 1 980 128.00 2.3% 0.9% 21 239 22 156 20 989 0.5% -0.7% 32.0 33.9 31.6 1.9 -2.3
Europe Average 352 849.09 419 193.89 417 248.70 2.2% -0.1% 15 072 16 256 15 798 - -0.4% 29.30 30.41 30.52 1.10 0.11
^2001
‡ 2003 > 2.5% (High Growth ) > - 0 Declining
* 2004 1% to 2.5% (Moderate Growth ) Inequality
**2005 +2010 0% to 1% (Stagnation - Low Growth) < + 0 Growing
Source - Eurostat, World Income Inequalities Database, and CEB Staff Calculations < 0% (Contraction ) Inequality
The pre-recessionary period (2000 to 2008)
Unlike other parts of Europe, the Western region saw the lowest annualised GDP growth rate (1.8%) prior to the
recession. Only Ireland and Luxembourg saw exceptionally high GDP growth rates (see Figure 7). However, the
region did see moderate real median income growth (annually growing at 1.7%). Ireland was once again an
outlier in the region, with real median incomes growing at 4.9% per year. The remaining countries saw either
moderate real median income growth (the Netherlands, Luxembourg, France, and Austria) or stangante growth
(Belgium, Germany, and the United Kingdom).
Inequality as measured by the Gini coefficient, on average, increased in the Western region, from 28.7 (2000) to
29.5 (2015) - the second most equal region in Europe in 2008 behind the North, but in fact much closer to
Southern and Central-Eastern European regional averages. A number of countries strongly influenced the rise in
the Gini coefficient (see table 7). The 2008 Gini coefficients for Austria (27.7) and Switzerland (31.1) saw the
largest increases, up by 3.7 and 2.6 points, respectively. However, the United Kingdom set itself apart with a
2008 Gini coefficient of 33.9 (2008), a level higher than many Southern and Central-Eastern European countries.
The Palma ratio in the region increased slightly – up 0.08 points from 1.015 (2000) to 1.094 (2008). Only
Germany and Belgium saw a decline – with the latter seeing the ratio drop below 1.0 (indicating that the bottom
40% were seeing a large increase in the share of the nation’s income). The 80/20 ratio also increased for many
countries and on average those in the bottom 20% in Western Europe had 4.5 times less than those in the top
20%. The United Kingdom was once again an outlier, with the region’s highest Palma ratio of 1.36 and an
80/20 ratio of 5.06 – much closer to the Central-Eastern and Southern European averages.An introduction to inequalities in Europe
13
Post-recessionary period (2008 to 2014)
Western Europe became economically stagnant after the 2008 financial crisis, with an annualised GDP growth
rate of 0.6% - only Luxembourg and Switzerland saw moderate GDP growth. Every other country for the most
part stood below or well below 1.0%, with the Netherlands contracting. The growth in real median incomes in
many countries stagnated from 2008 – see Table 7. In Ireland and the United Kingdom real median incomes
shrank, contracting annually by -0.8% and -0.7%, respectively.
Table 8 - Western Europe - Alternative inequality measures - Palma Ratio, 20/80 Ratio, and Risk of
poverty
Absolute Risk of Poverty Risk of Poverty of
Absolute Change
Palma Ratio 80/20 Ratio Change in 20/80 bottom 25% income Change 25% to 50% income Change
in Palma Ratio
Ratio quartile quartile
2000 2008 2014 '00-'08 '08-'14 2000 2008 2014 '00-'08 '08-'14 2007 2014 '7-'14 2007 2014 '7-'14
Central-Eastern Europe (avg-->) 1.169 1.303 1.247 0.13 -0.06 4.95 5.56 5.45 0.61 -0.11 86.9 91.2 4.25 35.9 34.0 -1.92
Northern Europe (avg-->) 0.860 0.890 0.858 0.030 -0.032 3.56 3.70 3.63 0.13 -0.07 63.8 64.8 1.04 8.4 7.6 -0.78
Southern Europe (avg-->) 1.197 1.205 1.296 0.008 0.091 5.12 5.22 5.79 0.10 0.57 92.3 93.5 1.25 15.4 27.1 11.65
Western Europe (avg-->) 1.015 1.094 1.048 0.08 -0.05 4.20 4.49 4.43 0.29 -0.06 77.3 80.2 2.96 10.84 12.50 1.66
Austria 0.800 0.974 0.983 0.17 0.01 3.4 4.2 4.1 0.76 -0.04 65.0 75.8 10.80 9.4 10.4 1.00
Belgium 1.136 0.978 0.876 -0.16 -0.10 4.3 4.1 3.8 -0.25 -0.30 83.4 84.0 0.60 15.1 14.7 -0.40
France 1.000 1.125 1.093 0.13 -0.03 4.1 4.4 4.3 0.30 -0.14 72.1 72.6 0.50 10 9.9 -0.10
Germany 1.131 1.125 1.124 -0.01 -0.001 4.9 4.8 5.2 -0.12 0.41 81.3 85.7 4.40 12 10.4 -1.60
Ireland 1.095 1.106 1.150 0.01 0.04 4.8 4.4 4.8 -0.32 0.36 90.9 91.1 0.20 19.7 27.4 7.70
Luxembourg 0.917 1.004 1.018 0.09 0.01 3.6 4.1 4.5 0.53 0.32 70.3 84.3 14.00 4.5 4.3 -0.20
Netherlands 0.840 0.991 0.908 0.15 -0.08 3.5 4.0 3.8 0.50 -0.17 61.6 68.0 6.40 9.7 9.4 -0.30
Switzerland 1.023 1.183 1.095 0.16 -0.09 4.3 4.8 4.4 0.57 -0.39 76.7 71.6 -5.10 6 5.8 -0.20
United Kingdom 1.190 1.360 1.184 0.17 -0.18 5.0 5.6 5.0 0.62 -0.58 94.1 88.9 -5.20 11.2 20.2 9.00
Europe Average 1.10 1.18 1.16 0.09 -0.02 4.61 4.99 5.04 0.38 0.04 81.43 84.82 3.39 20.23 23.21 2.97
> - 0 Declining
Inequality
Source - Eurostat, World Income Inequalities Database, and CEB Staff Calculations < + 0 Growing
Inequality
Encouragingly, inequality has declined from the 2008 highs. The regional average Gini coefficient dropped by
0.6 points to 28.9 (2014) from 29.5 (2008) – not entirely eliminating the increase since 2000, but gradually on a
downward trend. Ireland saw its Gini coefficient increase after the onset of the financail crisis as a result of the
deteriorating position of those in the bottom income brackets. Germany’s Gini coefficient saw no net gain from
2000, to stand at 30.7 (2014), the same level as in 2000. Only Belgium and the Netherlands saw a continuing
decline in the Gini coefficient from 2000, obtaining levels similar to the Northern region. France, Switzerland, the
United Kingdom and Austria all saw declines in their Gini coefficients. However, only the United Kingdom saw a
drop that was enough to negate the increase from 2000 to 2008 - and the United Kingdom in 2014 had a lower
Gini coefficient than in 2000, although it is still the region’s highest.
The regional average Palma ratio also dropped, down 0.05 points from 1.094 (2008) to 1.048 (2014) – still
indicating that the top 10% on average hold more wealth than the total bottom 40%. Only Belgium, the
Netherlands and Austria were below 1.0, although in the Netherlands the ratio is above the 2000 level. Austria,
Ireland and Luxembourg were the three countries that saw their Palma ratios continuously increase from 2000.
The regional average 80/20 ratio also dropped slightly, by 0.06 points from 4.49 (2008) to 4.43 (2014).
However, every country bar Belgium had an 80/20 ratio in 2014 that was either at or above the 2000 level –
with Germany and the United Kingdom being the worst performers, with the top 20% on average having 5
times the income of those in the bottom 20% in 2014.
The share of people in the bottom 25% income quartile with real median incomes below the at-risk-of-poverty
threshold increased by almost 3%, from 77.3% (2000) to 80.2% (2014). Almost every country saw the at-risk-
of-poverty level increase for the bottom 25%, aside from Switzerland and the United Kingdom. However, the
proportion of those in the lower-middle quartile (in the 25% to 50% quartile) that are at risk of poverty on
average increased from 10.84% (2008) to 12.5% (2014). This was primarily led by Austria, Ireland and the
United Kingdom – see Table 8. In the case of Ireland, this increase was the result of the harsh economic realities
that emerged soon after the 2008 financial crisis. However, the United Kingdom is a paradoxical case. While theAn introduction to inequalities in Europe
14
at-risk-of-poverty level dropped for the bottom 25% (albeit from a regional high of 94.1% in 2007 to 88.9% in
2014), the lower middle income quartile increased by 9% points from 11.2% (2007) to 20.2% (2014), once
again showcasing a negative indicator for such a wealthy but relatively unequal society.
1.2 Why tackling inequality matters
In the context of Europe, the stubbornly low GDP growth rates since the onset of the 2008 financial
crisis, and even to some degree prior to the crisis, have placed the inequality debate at centre stage,
especially as peoples’ incomes have stopped growing or shrunk, unemployment levels remain high, and the
economic future of millions is increasingly uncertain. To understand why we need to tackle inequality, it is first
important to understand its effects on a national level.
A national level perspective
As a result of the increasing academic and policy focus on inequality, a great deal of research has emerged
working to understand the effects of inequality on the economic growth of a country.
Some economic studies have argued that inequality can have a positive growth effect by creating more efficient
economies that are not distorted by higher equality-based taxes (Okun 1975, Chaudhuri and Ravallion 2006),
and that the resulting redistribution policies can reduce the incentive to invest and work. The basis of the theory,
which lies in a trade-off between redistributed policies (higher taxes and subsidies for equity) and growth, is
highly controversial. In some instances, government investment policies, e.g. public infrastructure (roads, schools,
etc.), can be considered as equity enhancing and also highly pro-growth (Ostry, Berg and Tsangarides 2014, CEB
2017). However, when inequality becomes too high, it has a negative effect on the health of the
economy; it can deter investment, make an economy less resilient to economic shocks and even bring
about political and social instability (Berg and Ostry 2011). Moreover, theories that advance that inequality
can enhance growth fail to appreciate the social welfare structure of most European economies, in which the
economic gains of a nation work to benefit the whole of society, especially those at the bottom. The rise in
inequality and harsh recent economic realities for many people around the continent require an understanding
of how to halt the negative effects of inequality.
From an economic viewpoint, empirical research has shown the negative effect of inequality on growth9. Both
recent historical and present literature has shown that there is a high and negative correlation between GDP
growth and inequality (Berg and Sachs 1988) and that a high Gini coefficient negatively affected aggregate
growth in countries (where data were available) between 1960-1980 (Pyo 1987). One piece of work attempted
to precisely quantify this relationship, indicated that when a country’s Gini coefficient increased by three points,
GDP dropped by 8.5% over 25 years, i.e. 0.35% a year (OECDb 2014).
Other studies have shown that those countries with greater inequality (either wealth or income) tend to see
higher rates of taxation (as voters become fed up with inequality and demand higher tax rates), which can
negatively affect the business environment, investment levels, and thus in turn economic growth (Alesina and
Rodrik 1994, Alesina and Perotti 1993). In a similar vein, the incentive to accumulate productive factors that lead
to economic growth, diminish in unequal countries where policies are implemented to limit disproportionately
large private acquisition of those factors (Persson and Tabellini 1994).
More recent work has tested the robustness of previous work with more consistent data, and when examining
net incomes (i.e. after re-distribution has been accounted for), there is a significant and negative correlation
between inequality and growth (Knowles 2001). Additionally, research has proven that inequality has a positive
economic effect for those at the top of the income distribution, and a negative effect for those nearer the
bottom of the distribution (Voitchovsky 2005). Other work has examined inequality from a time-series
9
(Duflo and Banerjee 2003) Are not entirely conclusive in their findings, and show that changes in inequality in either direction may have
a negative effect on growth – an inverted U-curve relationship. However, this was a study which was more about examining data
limitations which were addressed in subsequent studies.You can also read