Beyond the Marshall Plan: A Global Structural Transformation Fund
←
→
Page content transcription
If your browser does not render page correctly, please read the page content below
Beyond the Marshall Plan:
     A Global Structural
     Transformation Fund
                              BACKGROUND RESEARCH PAPER

  Justin Yifu Lin and Yan Wang

  Submitted to the
  High Level Panel on the Post-2015
  Development Agenda

  This paper reflects the views of the author and does not represent the views of the Panel.

It is provided as background research for the HLP Report, one of many inputs to the process.

                                                                                May 2013
Beyond the Marshall Plan:

               A Global Structural Transformation Fund

                                Justin Yifu Lin and Yan Wang*

                                 “Make no small plans.

                    They have no magic to stir men’s blood”.

                                                               —Daniel Hudson Burnham (1846– 1912)

                                            Abstract

The world economy is at a critical juncture where a grand scheme in addition to a paradigm shift

is required to propel the “leaderless” economy back to its steady growth path. This paper

addresses infrastructural financing issue from the angle of structural transformation as a growth-

lifting strategy for global recovery. We proposed a win-win global infrastructure initiative -- a

Global Structural Transformation Fund (GSTF) -- that could a) increase aggregate demand so as

to create space for structural reforms in crisis-hit advanced countries and b) support green growth

through investments in bottleneck-releasing transformative infrastructure projects in both

advanced and developing countries. The traditional Keynesian stimulus directs spending toward

                                                                                                 1
the domestic economy where the rate of return is low, while our proposal recommends a globally
coordinated investment initiative directing global savings to where the developmental impact in
terms of employment generation and rates of returns are higher. We propose to go beyond
Keynesianism, go beyond infrastructure, and go beyond the Marshall plan.
JEL Classification Code: O18, O40
Keywords: Infrastructure financing, urban development, green growth
* Respectively, Honorary Dean of the National School of Development, Peking University and former
Chief Economist of the World Bank; and Visiting Professor, George Washington University. The authors
thank Chuan Chen, Vivien Foster, Homi Kharas, Shuilin Wang, Jiajun Xu, and Douglas Zeng for their
comments and input, and Nan Hu for excellent research assistance. The views and analysis in this paper
are entirely those of the authors and do not represent the views of the institutions they are affiliate with.
Comments and suggestions can be sent to correspondent author Yan Wang at yanwang2@gwu.edu
2Table of Content
1. Introduction: The World Needs a Growth-lifting Strategy 4
2. Infrastructure shortfalls are staggering 8
3. For Advanced and Emerging Countries: reducing excess capacity and create jobs 9
4. How to close this funding gap? Need a changing of mindset 12
5. The Proposed GSTF 20
6. Risk management 28
7. Conclusion 33
Annex 1. China financed “Bottleneck-Releasing” Hydropower Projects, updated to 2013.3.7
Annex 2. Special Zones in Africa: Issues beyond infrastructure financing. 46
References 47
31. Introduction: The World Needs a Growth-lifting Strategy
The global economy has experienced the most tumultuous times since the Great Depression.
Despite the coordinated policy response of the G-20 nations for expansionary monetary policy,
the global economy, especially the advanced countries, has not fully recovered. Is the
conventional Keynesian stimulus sufficient to propel this so-called “leaderless” global economy
onto its steady growth path? A short answer is, no. Not only do we need a grand investment
scheme but also a change of the mind-set.
What policies could constitute a win-win solution to avoid a protracted “New Normal” of slow
growth, high unemployment, high volatility and low returns to financial investment? Based on
the intellectual foundation of the New Structural Economics (NSE, thereafter) (Lin 2010, 2011,
2012), this paper addresses infrastructural financing issue from the angle of structural
transformation as a growth-lifting strategy for global recovery. We present motivation and
evidence to support a global infrastructure initiative – a Global Structural Transformation Fund
(GSTF) that could motivate excess savings from the emerging market economies and Sovereign
Wealth Funds, increase aggregate demand to enable structural reforms in advanced countries and
support green growth through investments in bottleneck-releasing infrastructure projects in both
advanced and developing countries.
Unlike traditional Keynesian stimulus, the global infrastructure investment initiative has several
unique features: First, instead of increasing government spending to support consumption or by
4“digging a hole and filling a hole” in advanced economies where the rate of return is low, our
proposal emphasizes that any growth-lifting solution should focus on implementing bottleneck-
releasing investments in developed and developing countries which will not only increase
demand in the short-term but also raise longer term growth prospects. The traditional Keynesian
stimulus directs spending toward the domestic economy, while this proposal recommends a
globally coordinated investment initiative, directing global savings toward where the
developmental impact of employment generation and social rates of return are higher. We
propose to go beyond Keynesianism, go beyond infrastructure, and go beyond the Marshall plan.
Such projects will increase demand and jobs in advanced countries and offset the contractionary
effect when the advanced countries implement the needed structural reforms.
Second, investing in “bottleneck releasing” infrastructure could lead to high social and financial
rates of returns, as well as employment generation and poverty reduction in the long term.
Empirical literature has found supporting evidence for the contribution of infrastructure on long-
run growth and development. Aschauer 1989 found that the stock of public infrastructure capital
is a significant determinant of aggregate TFP in the U.S. and his estimate of the marginal product
of infrastructure capital was as high as 100% per year. The average economic rates of return for
the World Bank projects evaluated over the period of 1983-92 was 11% for electricity projects,
and 29% for road building. Canning and Bennathan 2000 found that the estimated rate of return
to electricity generating capacity could be as high as 100% a year (in 1985, for Bangladesh,
Kenya, Bolivia and China), or as low as 10% or event negative in some countries. “In a limited
number of countries we find evidence of very acute shortage of electricity generating capacity
and paved roads, and large excess returns to infrastructure investment.” “To the extent that such
high rates of return are not detected by a microeconomic cost-benefit analysis they point to
5macroeconomic externalities associated with infrastructure”. (page 31, Canning and Bennathan
2000).
Another strand of recent literature has examined the effect of infrastructure on income inequality.
The rationale is that infrastructure provision may have a disproportionate effect on the income
and welfare of the poor by raising the value of the assets they hold (such as land or human
capital), or by lowering the transaction costs (such as transport and logistic costs) they incur to
access the markets for their inputs and outputs. These effects may occur through a variety of
mechanisms documented in the literature, see for example, Estache, Foster and Wodon 2002,
Estashe 2003, and Calderon and Serven 2008.
Both arguments, macroeconomic externality, and income inequality, point to the need for public
investment in providing certain types of infrastructure, because they represent either non-rival
public goods as in the case of rural roads, or a natural monopoly as in the case of electricity
generation and distribution systems. Without government intervention or public investment, the
critical infrastructure for development would be undersupplied.
Third, investing in infrastructure alone is not sufficient to propel the growth engine and generate
jobs unless it is combined with productive assets and human capital. A common misconception is
that the lack of investment in infrastructure is always to blame where the private sector is not
creating jobs – the causes may be related to inadequate agglomeration and cluster development,
and other productive assets and human capital or capacity. Our new idea is to combine
infrastructural building with green urban development, Eco-industrial parks and structural
transformation to generate employment, revenue, growth and poverty reduction, making the
environment more sustainable and the infrastructure financially viable.
Additionally, when reviewing the history of the Marshall plan, we notice that the Marshall Plan
6had not limited to the reconstruction of the infrastructure only, independent of the industrial
structure and international trade. And it cost only $13 billion dollars, or around 1.1 percent of the
US GDP during that period.1 At the time of the Marshall Plan there was never an attempt to
separate infrastructure from the industrial production and trade. Why do we limit ourselves to
infrastructure only?
Fourth, there is a huge infrastructural funding and capacity gap in developing countries,
especially in the area of renewable energy and green technology. The GSTF can help “crowd-in”
funding and increase utilization of green technology by transforming existing cities into green
cities, and building new clusters of eco-friendly industries. It will attract emerging market
economies such as Brazil, China, India, and Arab countries to invest overseas and relocate some
of their excess production capacity to low-income developing countries where there is a demand.
This will also help the rebalancing or structural upgrading in their domestic economies, and make
the needed restructuring less painful.
Fifth, infrastructure consists a spectrum of public goods, semi-public goods and private goods.
Based on this classification consistent with the NSE, government budget and ODA should be
used to finance the public goods such as drinking water and sanitation. Other Official Financing
(OOF), and PPPI (including FDI) can be utilized for financing the semi-public goods ranging
from electricity, roads, ports, airports and etc. GSTF is a bridge fund aiming to “crowd in” other
official development financing (OOF) from Sovereign Wealth Funds, official entities in emerging
markets and maintaining a positive rate of return. Community-Driven Development (CDD) and
1
“FROM JUNE 1947 to its termination at the end of 1951, the Marshall Plan provided approximately $ 13
billion to finance the recovery and rehabilitation of war-torn and postwar weary Western Europe. In
today’s dollars that sum equals roughly $ 100 billion, and as a comparable share of U.S. Gross National
Product it would be in excess of $ 500 billion.” (Source: Behrman, Greg (2007-08-07). The Most Noble
Adventure (pp. 4-6). Simon & Schuster, Inc.)
7self-discovery should be highly encouraged.
Sections below provide motivation for this global infrastructure initiative, by first examining the
funding gap, then presenting a framework, and a concrete proposal, on the Global Structural
Transformation Fund (GSTF), and last addressing the risk management issues.
2. Infrastructure Shortfalls are Staggering.
Infrastructure shortfalls in the developing world are staggering. Roughly 1.4 billion people have
no access to electricity, about 880 million people still live without safe drinking water, and 2.6
billion without access to basic sanitation. Around 900 million rural dwellers worldwide are
estimated to have no access to all-weather roads within two kilometers (MDG Working Group,
June 2011).
Power shortage is clearly a bottleneck for development in Sub-Saharan Africa. Per capita
electricity consumption in SSA (excluding South Africa) average only 124 kilowatt-hours a year,
hardly enough to power one light bulb per person for six hours a day (See also Annex 1). Lack of
infrastructure does not only impinge on the daily lives of millions of people it also renders firms
less competitive. Power outages and water suspensions occur frequently, hampering productive
activities. Enterprises in Tanzania, for example, face power outages 63 days a year. It is estimated
that between 3 to 10 percent of total sales were lost to electricity outages in developing countries
in recent years. And many economic activities are not even started since the required
infrastructure services are not available. Lack of infrastructure, for example, has been cited as one
major impediment of attracting foreign investment.
Estimates of the growth impact of infrastructure investment in developing countries support this
8notion. Calderon and Servén (2010a) estimate that, on average, annual growth among developing
countries increased by 1.6 percent in 2001-05 relative to 1991-95 as a result of infrastructure
developments. This effect was particularly large in South Asia, reaching 2.7 percent per year.
Calderon and Servén (2010b) find that if low-income countries in Sub-Saharan African were to
develop infrastructure at the same rate as Indonesia, the growth of West African low-income
countries would rise by 1.7 percent per year. An increase in the power generation in India to the
levels in Israel and Hong Kong would enhance growth by 1.7 percentage points. Similarly, if
Latin American countries can have the same level of infrastructure as East Asia’s middle income
countries, their annual growth will increase 2 percentage points (Guash 2010).
3. For Industrial and Emerging Countries: Opportunities to Reduce Excess Capacity and
Create Jobs
Infrastructure investment in developing countries could mitigate some of the post-crisis ills that
advanced countries currently face, and would help create jobs and generate growth in advanced
economies. Most of the capital goods, such as turbines or excavators, required to build electricity,
sewage plants or roads are produced in the United States and Europe. Infrastructure investments
in developing countries would, first, increase demand for manufactured goods in advanced
economies. For every dollar invested in developing countries, imports of capital goods increase
by 50 cents. About 70 percent of traded capital goods from developing countries are sourced
from high-income countries. This implies that a one dollar increase in investment in developing
countries tends to result in a 35 cent increase in exports from high-income countries.
9Second, infrastructure investments can also create jobs and improve competitiveness. 2 For the
U.S., it has been estimated that US$1 billion in new investment spending in transportation,
schools, water systems, and energy could create 18,000 jobs (Heintz, Pollin and Garrett-Peltier,
2009), of which about 40 percent would be in construction and 10 percent in manufacturing, the
two sectors hardest hit by the recession of 2008-09. In addition, sustaining the manufacturing
sector, which has been on a secular decline in the U.S. and several European economies, will be
important to maintain large-scale employment opportunities, particularly in capital-intensive
sectors where labor-productivity levels are consistent with the income levels of advanced
countries. 3 Maintaining infrastructure investment is also important in order to keep advanced
countries competitive and to avoid further external imbalances in the future.
The global infrastructure initiative will help fully utilize the excess capacity as well as the excess
savings in industrial and emerging market economies. In Japan, a huge amount of household
savings is trapped in extremely low interest rates – well below 1 percent for 10 year government
debt. In the US, the yield for 10 year Treasury Bond is close to 2 percent. In China, the nominal
interest rate on 10 year government bond is 3 percent, with the real interest rate close to zero (see
annex figure A1). Some countries have over-invested in infrastructure for the size of their
economies. For example, Japan’s stock of infrastructure is equivalent to nearly 180 percent of its
GDP. Over the past 18 years, growth would have “justified” investment of around 3 percent of
GDP, but Japan spent 5 percent.
Comparatively, investing in the infrastructure of developing countries could have rates of returns
ranging from zero to over 100 percent (Bai et al 2008, Canning and Bennathan 2000, and World
2
Infrastructure in this context could also refer to investments in green technologies, which also have the
potential to create jobs, including in manufacturing.
3
See Spence (2011) for a discussion.
10Bank estimates). Annex Table A1 compares the estimated rates of return from infrastructure,
based on a simple literature review, with the benchmark ten-year bond yields. In the current “low
yields” environment, more and more SWF and government agencies and pension funds are
seeking higher risk adjusted returns, and are more likely to invest in a Global Structural
Transformation Fund (GSTF).
Moreover, as China’s labor cost is rising rapidly, there is an increased pressure for rebalancing
and structural upgrading. The urgent need for reducing excess productive capacity will force
some of the labor-intensive sectors out of business. The government has been encouraging
enterprises to “go global”, and hence China’s outward FDI has been rising rapidly and creating
opportunities for industries relocating elsewhere. According to our estimate, about 85 million
jobs will potentially be relocated in the space of 20 years (see Chandra, Lin and Wang, 2012 on
Leading Dragons).
The World Bank estimates that annual investments of more than $1 trillion – about 7 percent of
developing country GDP - are required to meet basic infrastructure needs in the medium term.
Countries that grew rapidly – such as China, Japan and Korea – invested upwards of 9 percent of
GDP every year for decades. Assuming that infrastructure financing in developing countries
continues at historical trend levels, there remains an infrastructure financing gap of more
than US$500 billion per year over the medium-term.
If the funding gaps were to be closed, the associated demand for capital goods imports world-
wide for infrastructure investment alone would increase by US$250 billion, of which more than
US$175 billion would be sourced from high-income countries. Total capital goods exports from
all high-income countries in 2010 are estimated to amount approximately to US$1.4 trillion.
Capital goods exports from high-income countries would therefore increase by over 12 percent,
11creating much needed jobs in the manufacturing sector of advanced economies, reducing
unemployment and increasing consumption. The jobs created in the manufacturing sector are
likely to be stable and relatively well-paid which would increase the demand for housing. The
reduction in excess capacities in turn would lead to a pick-up in investment. Growth would
recover and fiscal revenues increase, ultimately leading to a decline in public debt burden.
4. How to Close this Funding Gap? Need a New Mind-set
A global infrastructure investment initiative could aim at closing this gap.
However, investing in infrastructure alone is not sufficient to propel the growth engine and
generate jobs unless it is combined with productive assets and human capital. Therefore, we
argue that, based on the New Structural Economics, infrastructure investment needs to be
associated with zone- or urban-development and structural transformation in order for it to
become self-sustainable.
Transforming “what the country has” to “What the country can potentially do well”
The New Structural Economics (NES) postulates that each country at any specific time possesses
given factor endowments consisting of land (natural resources), labor, and capital (both human
and physical), which represent the total available budget that the country can allocate to primary,
secondary, and tertiary industries to produce goods and services. The relative abundance of
endowments in a country are given at any given specific time, but changeable over time. In
addition, infrastructure is a fourth endowment which is fixed at any given specific time and
changeable over time (Lin 2012b, p.21).
12This framework implies that at any given point in time, the structure of a country’s factor
endowments, that is the relative abundance of factors that the country possesses, determines the
relative factor prices and thus the optimal industrial structure (Ju, Lin, and Wang 2011).
Therefore, the optimal industrial structure in a country, which will make the country most
competitive, is endogenously determined by its endowment structure.
Further, economic development as a dynamic process entails structural changes, involving
industrial upgrading and corresponding improvements in “hard” (tangible) and “soft” (intangible)
infrastructure, at each level. Such upgrading and improvements require an inherent coordination,
with large externalities to firms’ transaction costs and returns to capital investment. Thus, in
additional to an effective market mechanism, the government should play an active role in
facilitating structural transformation, diversification and industrial upgrading. (Lin 2012b, p. 14-
15)
From the angle of land-based financing, investment on appropriate infrastructure and industrial
assets would increase the value of land (a commonly acceptable principle). Land-based financing
offers powerful tools that can help pay for urban infrastructure investment. 4 And these options
have been explored during China’s experimentation on Special Economic Zones and the
infrastructure around these zones (Wang Yan 2011).
Therefore, our proposition 1 is that
Other things being equal, a piece of land with proper level of infrastructure is always more
valuable than a piece of land without. Thus it can be well used as collateral for infrastructure
development loans. First, this proposition is confirmed by empirical evidence that infrastructure
4
For legal and typical land-asset based infrastructure financing, see policy note by Peterson, George E.
2008. “Unlocking Land Values to Finance Urban Infrastructure: Land-based financing options for cities.”
Trends and Policy Options Series. Washington DC. PPIAF.
13benefits the poor because it adds value to land or human capital and reduces inequality (Estache,
Foster and Wodon 2002, Estashe 2003, and Calderon and Serven 2008).
Second, since infrastructure is often sector-specific, the “proper” level of infrastructure must be
affordable to the population and be consistent with the country’s existing or latent comparative
advantage. Thus, market mechanism should be relied upon to have the right relative prices and to
determine which infrastructure is “bottleneck releasing”. In addition, the government must
perform the functions of providing information, identifying the comparative advantages and the
associated appropriate infrastructure, and facilitating this process by developing Special
Economic Zones (SEZs) in order to allow the self-discovery by the private sector. On the
Growth Identification and Facilitation Framework see Lin and Monga (2011).
The role of Special Economic Zones has been well accepted and proven by the successful
experiences of emerging markets. In particular, SEZs can 1) provide a bundling of public services
in a geographically concentrated area, 2) improve the efficiency of limited government
funding/budget for infrastructure, 3) facilitate cluster development, or agglomeration of certain
industries, 4) propel urban development and conglomeration of services, and thus 5) they are
conducive to growth, job creation, and income generation.
Therefore, our proposition 2 is that
Transformative infrastructure helps link a country’s endowment structure with its existing and
latent comparative advantages, and translate them into competitive advantages in the global
market. Thus, it can be made financially viable.
14In other words, combining infrastructural building with industrial upgrading, as well as real
estate development, can help make both financially sustainable. Potentially this approach has
high rates of returns.
Based on these two propositions, any low-income country can have the ability to pay for its
appropriate infrastructure in the long term, as long as they develop a strategy that is consistent
with their comparative advantages. In other words, we should focus more on “what these
countries have” rather than “what they do not have” (Lin’s farewell blog). The World Bank, and
other development banks should try to help transform “what these countries have” to “what these
countries can potentially do well”, i.e. to develop their existing or latent comparative advantages
into competitive advantages in the global market. See figure 1.
Figure 1 Transforming “what the country has” to “what the country can potentially do
well” : From Natural Endowment to Productive Assets
100%
80%
60%
40%
20%
0%
-20%
Intangible Capital Net Foreign Assets Produced Capital Natural Capital
15Source: Authors based on World Bank data from Changing Wealth of Nations, 2005. Here
intangible capital includes human and institutional capital.
What these countries need is a bridge fund in the medium to long term for 10-15 years, in order
to build a productive /export base. One example can show how quickly the return can be seen:
Huajian Shoe Manufacturing Company established a large manufacturing facility in Ethiopia,
trained workers and started exporting, all within the time span of 4 months. See also Sheng 2012
on Chinese OFDI in Africa, and World Bank 2012 on China’s FDI in Ethiopia.
Based on the NSE, it is our view that IMF-WB’s Debt Sustainability Framework must be
significantly revised, because it still is a static model focusing on the short term only. This model
has significantly constrained low-income countries’ ability to borrow through nonconcessional
loans backed by natural wealth and asset for larger and longer term infrastructure and industrial
development packages. The demand from developing countries to revise this framework was
made all too clear by the case of Ghana!
In the long term, if a country develops industries (and the specific infrastructure needed for that
particular industry) according to the comparative advantage determined by the endowment
structure, the country will become most competitive, generate the most profits (surplus), have the
largest savings, and have the fastest upgrading of endowment structure, which will in turn build
the foundation for the upgrading and diversification of industries to the more capital-intensive
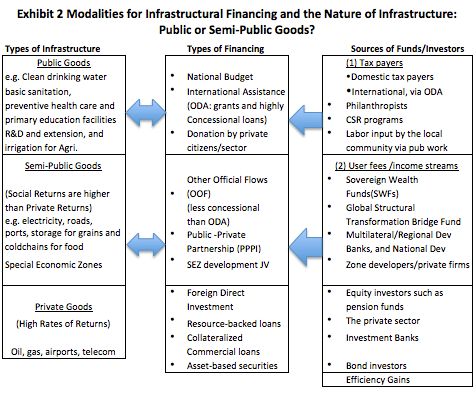
industries. This will become a virtuous cycle and infrastructure can be financially viable (see the
framework below).
16Exhibit 1. A Framework: Investing in transformative infrastructure is financially
sustainable
Source: Authors.
But how could the infrastructure funding gap be closed without putting an additional fiscal
burden on the already cash-strapped governments?
Infrastructure consists a spectrum of public goods, semi-public goods and private goods (see
Exhibit 2). It will require a combination of financing from both traditional and new sources, in
particular the private sector. Infrastructure projects in developing countries are generally financed
by a combination of domestic public financing, loans or grants from multilateral institutions and
bilateral creditors (ODA and OOF), commercial loans including resource based loans (RBLs) and
some limited private sector investment (PPPI).
17First, domestic public financing has been the dominant source of infrastructure financing in
developing countries, providing about two thirds of total infrastructure financing. Maintenance of
existing roads, for example, should be financed by domestic public funding from vehicle taxes or
gasoline surcharges, as is the common practice in middle-income countries. Second, Official
Development Assistance (ODA) from traditional donor countries can be used to leverage other
funding sources. But going forward, it is expected that traditional ODA is going to decline
significantly stabilizing at its pre-crisis trend level. Therefore, the third and most important
source of financing is Other Official Finance (OOF) and Public-Private Partnership in
Infrastructure (PPPI). Depending on the characteristics of specific infrastructure, whether it is
public-, or semi-public or private goods, various funding sources can be used (see Exhibit 2).
18Source: authors.
Based on the above classification consistent with the NSE, pure public goods (such as clean
drinking water, e.g.) can be provided by the public sector and special grant-based funds, and
mass procurement of hand-held water pumps and other inputs. Local community’s participation
and self-development efforts should be highly encouraged (as China’s successful labor-intensive
methods of building water and irrigation in the 1950-60). Governments could use existing
resources to attract additional financing, particularly from the private sector, for infrastructure
development. These resources could include official development assistance (ODA), other
official financing (OOF), and domestic public financing. ODA plays a particularly important role
19in financing investment in low-income countries, representing only about 35 percent of new
capital spending. On the contrary, in many middle-income countries, infrastructure investments
are to a large extent financed by the public sector (Foster and Briceño-Garmendia, 2010).
Other Official Financing (OOF), and PPPI (including FDI) can be utilized for financing the semi-
public goods ranging from electricity, roads, ports, airports and etc. This is an area where the
OOF from emerging market and non-traditional donors can play important roles (see Box 1 and
Annex 1). Here, nontraditional donors have, based on their own development experiences,
utilized several instruments such as export credits, resource-based loans (RBLs), and resource-
for-infrastructural (R4I) packages. In particular, R4I packages have gained acceptance by African
countries with the total value of at least $28 billion in nine African countries. Projects have
included roads, regional railway lines, water supply, hydropower dams and plants, as well as
other electricity power infrastructure. Some considered these as effective project financing and
risk management approaches with the potential of significantly narrowing Africa’s infrastructure
financing gap, others raised concerns regarding the non-transparency of the terms and conditions,
and the environmental and debt sustainability issues.5
5. The Proposed GSTF
Global Structure Transformation Fund (GSTF) that we propose is a bridge fund that belongs
in the category of Other Official Financing (OOF), aimed to “crowd-in” other official
development financing from Sovereign Wealth Funds, Central Banks and Public Pension Funds
of Emerging markets and it should maintain a positive rate of return (higher than the yields of a
5
There is a heated debate on this sensitive issue. A fuller discussion will be found in an on-going World
Bank study on “Resource for Infrastructure Deals”.
20benchmark 10-year treasury bond). It should be invested in
All infrastructural and industrial/service projects that are transformative in nature
by adding values to land and forest (with positive output);
Projects that are bottleneck releasing, and help diversify the economy;
Projects that facilitate cluster development and agglomeration of various industries
and services;
Projects associated with renewable energy, green-technology and Eco-Industrial
Parks (EIPs),6 and
Projects that reduce transaction costs for the enterprises in general (both domestic
and foreign) so that there is a “willingness to pay”. That is, in the long term there is
a positive income stream, i.e. the Net Present Value of the net benefit is positive in
the long term.
Infrastructure in and around the Eco-Industrial Parks and Special Economic Zones
(SEZs) is especially transformative because it can help “bundling public services”
in a geographically concentrated area, and help reducing transaction cost and
facilitate cluster development and scale economy. It can also facilitate urbanization,
and industrial relocation and upgrading.
Governance: This new fund (GSTF) will be governed by the Board of Directors whose voting
shares are determined by the equity shares held by various investors (government agencies as
independent entities, Sovereign Wealth Funds, as well as public pension funds). The largest
6
On details of Eco-Industrial Parks see the case of Ulsan in Yusuf, 2013 “Five Cities Going Green: How
are they doing it?”, The Growth Dialogue. Washington DC. Ulsan, Korea’s 7th largest city, used to be the
most polluted city in Korea in the 1990s. In 2005, Ulsan established the first Eco-Industrial Park (EIP),
aimed to transform the existing industrial complex to reduce environmental damage and eventually
achieve zero emissions. The programs produced significant economic and environmental results with a
240,000-ton reduction in carbon dioxide emissions in the first two stages (page 48-49 in Yusuf 2013).
21shareholder selects the Chairman of the Board (just like in any corporation). And therefore, a
friendly competition could be generated among contributors/investors to this fund. See SWF
Institute for a list of large SWFs as potential investors.
Advisory Groups: The Board will be assisted by the Economic Advisors Group and Investment
Advisors Group. Initially, the International Finance Corporation (IFC) could serve as the advisor
to the Board of Directors, because it has accumulated sufficient experience in running several
global infrastructure funds.
Target: the expected rate of returns from the investment should be no less than the yield for the
benchmark10 Year US Treasury Bond (which is currently less than 2%). The yield for10-year
Japanese government bond is below 1 percent. In this way, it can attract central banks and foreign
exchange administrations as well as Sovereign Wealth Funds to invest in this fund.
For risk diversification and management, the GSTF only provides bridge financing of a
limited proportion of long-term projects. Bridge financing is commonly used when the cash flow
from a sale of an asset is expected after the cash outlay for the investment of an asset. Another
type of bridge financing is used by companies before their initial public offering (IPO) to obtain
funding for the maintenance of operations. This financing is in essence a forwarded payment for
the future sale of the new issue. Bridge financing may also be provided by banks underwriting an
offering of bonds (including infrastructure bonds). For risk management, investment rules should
be designed to prevent GSTF from overly concentrating in certain type of projects, or in certain
countries or regions (see Section 6 on risk management). Official/Institutional investors such as
central banks, foreign exchange administrations and SWFs can invest limited proportion in this
and other types of infrastructural funds in order to diversify their risks.
The Multilateral Investment Guarantee Agency (MIGA) can serve as the insurance provider
22for the political risks. Other risks such as exchange rate risk will be discussed below in section 6.
GSTF helps to attract nontraditional development financiers
The design of GSTF would be attractive to non-traditional development financiers.
Fist, non-traditional bilateral development financiers such as China, India, Arab countries and
Brazil have emerged as major financiers of infrastructure projects in Africa. Overall,
infrastructure resources committed to Africa by these countries jumped from US$1 billion per
year in the early 2000s to over US$10 billion in 2010. China held a portfolio of some $20 billion
in active infrastructure projects in more than 40 African countries. Chinese financing for African
infrastructure structure projects is estimated to have reached a record level of roughly US$5.1
billion in 2009, though it fell to around $2.3 billion in 2010. However, ICA reported that China’s
infrastructure commitments in Africa were $9 billion in 2010. A new study found that China
alone accounts for 34% of all aid to infrastructure in SS Africa, higher than other multilateral and
bilateral donors. (C. Chen 2013)
In particular, China has been working on bottleneck-releasing sectors such as power generation
and transmission. While “Donors have neglected power since the 1990s”, (p.25, in Foster and
Briceño-Garmendia 2010), 50% of China’s commitment on infrastructure was allocated to
Electricity (Box 1). A recent study found that China has contributed, and is contributing, to a total
of 9.024 Gigawatt of electricity generating capacity, including completed, on-going and
committed power projects.7 The impact of this investment is likely to be transformative when one
considers that the entire installed capacity of the 47 Sub-Saharan countries excluding South
Africa countries is 28 Gigawatt.
7
The Hoover Dam in Colorado, by comparison, is a 2 Gigawatt facility, producing on average electricity
for about 390000 US homes. See Chen 2013.
23Box 1. Southern Partners are leading financier of Infrastructure in SSA
A new study ranks the donors/providers of infrastructure in Sub-Saharan Africa for the period
2001-2008 in Sub-Saharan Africa. China is shown to be the largest infrastructure financier
followed by three multilateral organizations, IDA, EC and AFDF. In total there are three
Southern providers in the top ten, China, India and ISDB. (Chen 2013)
China alone accounts for 34% of the total official financing amount on infrastructure in
SSA, higher than any Northern partner. But China accounts for only 3% of the number of aid
projects, indicating that the size of Chinese funded projects is larger. The United States is the 2nd
largest bilateral infrastructure contributor, but its total aid volume during the period is far less
than that of China. Northern donors together contribute 28% of the total aid amount in
infrastructure, but 76% of the number of aid projects, far more than Southern providers and other
donors. (Chen 2013)
It is estimated that as of December 2010, China held a portfolio of some $20 billion in active
infrastructure projects in more than 40 African countries. The amount was estimated at $5.1
billion in 2009 and $2.3 billion in 2010 (Chen 2013). Given that the annual number of projects
fluctuates during the past four years, the average size of Chinese financing commitment per
project has been skyrocketing indicating Chinese financiers’ interest and capacity in financing
large projects. See Box figure 1.
24Box Figure 1: Chinese financing commitment in African Infrastructure, 2001-2010 (million
USD)
6000
5116
5000
4000 3579
2989
3000 2323
1811
2000 1340
1110
1000 474 454 663
0
2001 2002 2003 2004 2005 2006 2007 2008 2009 2010
Source: Chen Chuan, 2013 based on World Bank-PPIAF Chinese Projects Database.
Sectoral Composition. During the period from 2001 to 2010, most of the Chinese financing
commitment went to the electricity, ICT and transport sectors in Africa. Electricity alone
accounts for 50 percent of the database by value, but 30 percent by number, indicating the large
size of these power projects. See Box Figure 2.
25Box Figure 2: Confirmed Chinese infrastructure finance commitments in Sub-Saharan
Africa by Sector 2001-2010
Source: Chen Chuan, 2013 based on World Bank-PPIAF Chinese Projects Database.
Note: For detailed see Annex 1.
Second, these emerging financiers are seeking opportunities to increase their investment and
diversify their portfolio into different types of projects, thereby increase their risk-adjusted
returns. In particular, China has been supporting several Special Economic Zones aimed to
improve investment climate and attract outward investment into these low-income developing
countries if there is a need. While there is widespread suspicion on China’s motivations and
criticisms of its record of following international standards, some studies have shown that the
investment has generated employment opportunities. 8
8
A few studies have found that China’s Outward FDI has contributed to employment generation in both
developing and industrial nations, see for example, Shen 2013, Weisbrod and Whalley 2011, Mlachila and
Takebe 2011, Rosen and Hanemann 2011, and Derek Scissors 2012, and World Bank 2012 on “China’s
FDI in Ethiopia”.
26According to one of the studies by staff of the People’s Bank of China, the estimated outward
investment in infrastructure “will not be less than US$100 billion annually (that is RMB630
billion yuan)” (Jin 2012). “Considering the increased potentials, China could well afford to have
outward investment of RMB600 billion to RMB1000 billion yuan per year. Assume that this
amount consists of 95% in loans and equity investment, and 5% in grant, this means that China’s
Ministry of Finance will need to budget RMB30 billion to 50 billion yuan for international aid.
This number is only about 0.3 % to 0.5% of China’s 2011 fiscal revenue, accounting for less than
0.1 % of GDP, much lower than the fiscal burden of the Marshall Plan (to the US Treasury)”. (Jin
Zhongxia 2012, page 62)
This paper is not going to speculate on the amount of China’s outward investment, but the
potential is huge. Depending on the design of the GSTF, especially the governance structure, it
may attract a substantial proportion of China’s OOF and outward direct investment (OFDI) on
infrastructure and other SWFs, seeking a better risk-adjusted return.
Sovereign Wealth Funds
The potential for mobilizing funding from investors, such as, for example Sovereign Wealth
Funds (SWFs) seems promising. It is estimated that SWFs hold more than US$5.3 trillion in
financial assets as of May 2013 and these assets are expected to grow rapidly in coming years
(Noman 2011). Some SWF are already investing in infrastructure in developing countries. The
China-Africa Development Fund, an equity fund which invests in Chinese enterprises with
operations in Africa, reportedly invested nearly US$540 million in 27 projects in Africa that are
expected to lead to total investments of US$3.6 billion in 2010. And the Qatar Investment
Authority plans to invest US$400 million in infrastructure in South Africa. Still, funds targeted
27towards developing countries are only a fraction of available resources. Since 2007, about 166
infrastructure funds with approximately US$110 billion in commitments were raised globally.
Only 15 percent of the funds raised were targeted towards developing countries.
A key challenge for closing the infrastructure investment gap in developing counties, however,
will be to mobilize private sector financing, in particular through private-public partnerships.
These partnerships are generally established through a long-term contract between government
and a private investor. The investor finances at least part of the investment, in return for future
service fees that are collected from the users plus government subsidies if applicable. Private
participation in infrastructure investments has played an increasingly important role in
developing countries. However, it is concentrated in a handful of large emerging economies, such
as Brazil, China, India, the Russian Federation and Turkey. It is also limited to a few sectors, in
particular telecommunication (Estache 2010).
6. Risk Management
Since infrastructure assets are illiquid, upfront capital financing is large and repayments often
take decades, investing in infrastructure entail significant risks for the investor. These risks
include: higher-than-projected projects costs; shortfalls in projected revenues (for example, if the
demand for the infrastructure services and user-fees are lower than projected); exchange-rate
risks if infrastructure financing is provided in foreign currency and user fees are paid in domestic
currency; force majeure; and political and regulatory risks.
For the GSTF, diversification is a major tool to reduce risks. Investment rules will be
designed to diversify the asset between illiquid and liquid assets in advanced and developing
countries, in “first round” infrastructure projects or securitized infrastructure-backed bonds and
28Exchange Traded Funds ETF and REITs (that are liquid). These rules will also prevent the Fund
from concentrating in a certain type of projects in certain regions or countries. There has to be a
balance between “semi-public goods” with lower returns, and a variety of commercially-viable
projects (with a steady income streams), so that a positive rate of return (higher than a benchmark
US Treasury Bond) can be earned. See table below.
Exhibit 3. An illustrative Balance Sheet for the Fund.
Assets Liabilities
Liquid Assets x% Account payable
Infrastructure ETFs Taxes payable
REITs etc
Other government bonds /local currency bonds
Illiquid Assets x% Equity capital
“First round” transformative infrastructure projects (bridging Paid-in capital
financing aimed to crowd-in other financiers), x%
Equity holdings in Eco-Industrial Parks or Special Economic Zones Retained earnings
(JV for Zone development), x%
Commercial Real Estate with steady income streams, x% Reserves
Equity holdings in toll roads, power stations, airports, sea ports and
railways x%
Equity holdings in National Infrastructure Development Banks x%
Other innovative financial instruments x%
Note: More details will be available in a separate paper on risk management.
Since infrastructure assets are illiquid, upfront capital financing is large and repayments often
take decades, PPPs entail significant risks for the investor. These risks include: higher-than-
projected projects costs; shortfalls in projected revenues (for example, if the demand for the
infrastructure services and user-fees are lower than projected); exchange-rate risks if
29infrastructure financing is provided in foreign currency and user fees are paid in domestic
currency; force majeure; and political and regulatory risks.
Several mechanisms exist that can diversify some of these risks and make investments in
developing countries more attractive. Government guarantees can insure against project-related
risks, such as a shortfall in demand. But they are unlikely to mitigate investors’ perception of
governmental risk, such as policy reversal, regulatory failure, and concerns about the
creditworthiness of the government. Multilateral institutions and donors are likely to be better
positioned to assume these risks. The World Bank has increasingly made use of guarantees to
catalyze private finance by mitigating the risk of default by governments. As of March 2010, it
had approved 36 guarantees, totaling US$3.8 billion in 28 countries (World Bank, 2010). MIGA,
the arm of the World Bank that provides political risk insurance for foreign investments, recently
adapted its products and expanded the potential applications of its guarantees in order to facilitate
the underwriting of infrastructure projects.
Risks for the private sector could be reduced if private sector financing would be combined with
public sector or donor funding. Initiatives in advanced economies, such as the National
Infrastructure Reinvestment Bank in the United States and the new European 2020 Project Bond
Initiative, are good examples.9 The Obama administration, for example, has backed the creation
of a National Infrastructure Reinvestment Bank, 10 which could issue infrastructure bonds,
provide subsidies to qualified infrastructure projects, and issue loan guarantees to state or local
9
The European Commission launches a public consultation on the "Europe 2020 Project Bond Initiative"
which aims at boosting the funding of projects with long-term revenue potential in line with the Europe
2020 policy priorities. Its objective is to help the private project companies to attract capital market
funding from investors such as pension funds and insurance companies. The Europe 2020 Project Bond
initiative has been identified in the Annual Growth Survey as a priority measure to enhance growth.
10
For more information, see http://www.govtrack.us/congress/bill.xpd?bill=h112-3259.
30governments. President Obama suggested that loans made by this bank would be matched by
private sector investments and that each project would generate its own revenues to help ensure
repayment of the loan. 11 Furthermore, Europe is considering the implementation of a new
European 2020 Project Bond Initiative, which would use public guarantees to leverage private
sector financing from non-traditional investors, such as pension funds (European Commission,
2011). This initiative proposes to invest 1.5 trillion euros to 2 trillion euros (approximately US$2
trillion to US$2.7 trillion) in Europe’s infrastructure over the period 2011-20.
Even more promising than guarantees that diversify risks, is the possibility of actually reducing
the risk. This can span a wide range of actions, including improving a country’s regulatory
framework and implementing sound macroeconomic policy. In economies with high country risk,
investors in infrastructure projects are often asking for real returns on equity in the order of 20
percent or more and a country risk premium of up to 5 percent on debt (Klein, 2005). Similarly,
Guasch (2004) shows that regulatory risks to investments in Latin America can add up to 6
percent to the cost of capital. Analyzing credit spreads of infrastructure bonds, Dailami and
Hauswald (2003) find that projects located in host countries with a stronger legal framework have
lower funding costs and tighter spreads. In the end, only sustained macro-economic stability will
earn the desired investment grade rating that is essential to attract the attention of the large
institutional investors at attractive prices. Multilateral institutions and bilateral agencies could
play an important role by building capacity and supporting improvements in this regard.
To attract private lenders to extremely high-risk investments, the International Development
Association (IDA) offers Partial Risk Guarantees (PRGs) that provide a safety net for investors in
case of a government fails to fulfill its obligations under a PPP agreement. PRGs have proven
11
http://www.whitehouse.gov/blog/2011/11/03/five-facts-about-national-infrastructure-bank
31invaluable to the Bujagali and Nam Theun 2 hydropower projects in Uganda and Lao PDR,
respectively. In each case, the provision of the PRG was instrumental in catalyzing long-term
commercial debt and mitigating risk for commercial debt without excessively increasing
government liability. For Nam Theun 2, IDA’s PRG was combined with MIGA and AsDB debt
guarantee instruments to reassure foreign investments, namely the Thai government.
Box 2. Credit Guarantee and Investment Facility (CGIF)
Asian Development Bank recently introduced a credit guarantee and investment facility (CGIF)
as a trust fund with capital contribution of $130 million. The ASEAN+3 governments will
provide a combined $570 million to create the $700 million facility. It will provide guarantees on
local currency denominated bonds issued by companies in the Asian region. Such guarantees will
make it easier for firms to issue local bonds with longer maturities. This measure would help
unlock the region’s vast savings for badly needed investment in infrastructure and other key
investment areas. In addition, the initiative will help reduce the currency and maturity
mismatches which caused the 1997-98 Asian financial crisis and make the regional financial
system more resilient to volatile global capital flows and external shocks. (MDG Working Group
on Infrastructure, 2011)
To reduce exchange rate risks, innovative finance mechanism can be explored under the umbrella
of the GSTF. These may include, but not limited to, the “counterpart fund” as the one developed
during the Marshall Plan, the Dim Sum Bond and other local currency bond, investing in
32infrastructure asset based securities (ABS)12, sub-sovereign bonds (Platz 2009) and investing in
the equity of “infrastructure development banks” in individual countries.
Innovative knowledge hubs which build the required financial and technical capacity of
government officials in developing countries and provide relevant expertise could be scaled up.
In November, 2010, the World Bank Group launched in partnership with the government of
Singapore the Infrastructure Finance Center of Excellence, which aims at building capacity in the
public sector to better manage private-public partnerships.
7. Conclusion
Investing in productivity enhancing infrastructure projects is critical for generating growth and
creating jobs, here and abroad. In the advanced economies, it can be a powerful instrument to
raise growth, create much needed jobs, and enhance future competiveness. For developing
countries, it is a powerful vehicle for transforming their economies, enabling their businesses to
work unimpeded without electricity shortages, communicate freely, expand their markets and,
ultimately climb up the technological ladder. An infrastructure investment initiative to avoid a
protracted “New Normal” with high unemployment and low growth in high-income countries is a
“win-win” for the public and private sector.
In particular, we propose to set up a Global Structural Transformation Fund (GSTF) to
mobilize vast savings from the official entities from emerging market economies, SWFs, public
pension funds as well as the private sector. This design of this Fund is particularly attractive to
the non-traditional official financiers with excess savings as well as excess productive capacity in
12
At a later stage, asset-based securities (ABS) and collateralized debt obligations (CDOs) can be
designed after more thorough analysis and research.
33relevant sectors. In the face of required structural reform, the excess capacity in some emerging
economies is in danger of being forced out of business. The GSTF can help develop
infrastructure and facilitate relocating these industries where there is a need.
A global infrastructure investment initiative that closes the infrastructure financing gap in
developing countries will be a “win-win” for the world as well. It would boost exports and
unemployment in high-income countries while reducing poverty and enhancing growth in
developing countries. Now is the time to develop pragmatic plans that put these ideas into
practice and build the roads, ports, railways, and power plants needed to support jobs and
prosperity in high-income and developing countries for a brighter future of all.
34Annexes
Figure A1: Infrastructure Fund is more attractive in this environment of low yields
Ten-year Government Bond Yields
% 6
5
4
3
2
1
0
Jan-2007
Sep-2007
Jan-2008
Sep-2008
Jan-2009
Sep-2009
Jan-2010
Sep-2010
Jan-2011
Sep-2011
Jan-2012
Sep-2012
Jan-2013
May-2007
May-2008
May-2009
May-2010
May-2011
May-2012
Japan United Kingdom United States
Source: Bloomberg.
Table A1. Rates of Return from Infrastructure vs. Yields from 10-Year Bond
Annual Rate Source: studies
Yields from 10year bonds
Japan 2013 0.9% Bloomberg
U.K. 2013 2.0% Bloomberg
U.S. 10-year bond 1.95% Bloomberg (May 2013)
U.S. 20 year bond 2.77% Bloomberg (May 2013)
U.S. 30 year bond 3.77% Bloomberg (May 2013)
Rates of Return from investing in Infrastructure
Ave. ROR Electricity projects 11% World Bank 1983-92
Ave. ROR Road Building 29% World Bank 1983-92
Estimated ROR Brazil 10%~57% Canning 2000
Estimated ROR China 20%~41% Bai 2008, Canning 2000
35You can also read