Infrastructure Strategy 2018-2048 - Carterton District Council
←
→
Page content transcription
If your browser does not render page correctly, please read the page content below
Carterton District Council

Infrastructure Strategy

      2018–2048

           47252 v9          Consultation draft
TABLE OF CONTENTS

1    PURPOSE OF THIS INFRASTRUCTURE STRATEGY .................................................. 2
2    BACKGROUND ....................................................................................................... 2
     2.1      LEGISLATIVE CONTEXT .............................................................................. 2
     2.2      HISTORICAL CONTEXT—FORMATION OF CARTERTON DISTRICT COUNCIL . 3
     2.3      GEOGRAPHICAL CONTEXT .......................................................................... 3
     2.4      REORGANISATION PROPOSALS ................................................................. 4
3    APPROACH TO MANAGING INFRASTRUCTURE ASSETS .......................................... 4
     3.1      OPERATING AND MAINTENANCE ................................................................ 5
     3.2      RENEWAL OR REPLACEMENT ...................................................................... 6
     3.3      CAPITAL IMPROVEMENTS—PLANNING FOR THE FUTURE ........................... 7
     3.4      HISTORICAL EXPENDITURE ....................................................................... 8
4    DEMOGRAPHIC FACTORS ...................................................................................... 8
     4.1      CURRENT POPULATION .............................................................................. 8
     4.2      GROWTH PROJECTIONS ........................................................................... 11
     4.3      LEVELS OF SERVICE ................................................................................. 16
     4.4      CLIMATE CHANGE..................................................................................... 17
     4.5      RISKS AND RESILIENCE OF INFRASTRUCTURE ........................................ 18
5    SIGNIFICANT INFRASTRUCTURE ISSUES FOR CARTERTON DISTRICT ................. 19
     5.1      GENERAL .................................................................................................. 19
     5.2      CDC WASTEWATER SCHEME ..................................................................... 19
              5.2.1     Wastewater assets .......................................................................... 19
              5.2.2     Asset data confidence ..................................................................... 23
              5.2.3     Asset value .................................................................................... 23
              5.2.4     Levels of service ............................................................................. 24
              5.2.5     Wastewater strategy ....................................................................... 24
              5.2.6     WW infrastructure management issues .............................................. 25
              5.2.7     Funding mechanism ........................................................................ 30
              5.2.8     Disposal of wastewater infrastructure ................................................ 30
     5.3      CDC WATER SUPPLY SCHEMES ................................................................. 30
              5.3.1     Carterton water supply assets .......................................................... 30
              5.3.2     Asset data confidence ..................................................................... 34
              5.3.3     Asset value .................................................................................... 34
              5.3.4     Levels of service ............................................................................. 35
              5.3.5     Water supply strategy ..................................................................... 35
              5.3.6     Infrastructure management issues - Carterton water supply ................. 38
              5.3.7     Water race assets ........................................................................... 43
              5.3.8     Infrastructure management issues – Carterton water races................... 43
              5.3.9     Funding mechanisms....................................................................... 46
5.3.10 Disposal of water supply infrastructure .............................................. 46
5.4 STORMWATER DRAINAGE ........................................................................ 47
5.4.1 Stormwater assets .......................................................................... 47
5.4.2 Asset data confidence ..................................................................... 50
5.4.3 Asset value .................................................................................... 51
5.4.4 Levels of service ............................................................................. 51
5.4.5 Infrastructure management issues .................................................... 52
5.4.6 Funding mechanism ........................................................................ 56
5.4.7 Disposal of stormwater infrastructure ................................................ 56
5.5 ROADS AND FOOTPATHS .......................................................................... 57
5.5.1 Roading assets ............................................................................... 57
5.5.2 Asset data confidence ..................................................................... 59
5.5.3 Asset value .................................................................................... 60
5.5.4 Levels of service ............................................................................. 60
5.5.5 Infrastructure management issues .................................................... 61
5.5.6 Funding mechanism ........................................................................ 64
5.5.7 Disposal of road and footpath infrastructure ....................................... 64
6 INFRASTRUCTURE INVESTMENT PROGRAMME .................................................... 65
6.1 THE MOST LIKELY SCENARIO ................................................................... 65
6.2 TOTAL EXPENDITURE SUMMARY—MOST LIKELY SCENARIO ..................... 70
6.3 SIGNIFICANT CAPITAL WORKS PROGRAMME SUMMARY .......................... 70
6.3.1 Wastewater ................................................................................... 70
6.3.2 Water Supply ................................................................................. 71
6.3.3 Stormwater Drainage ...................................................................... 71
6.3.4 Roading and Footpaths .................................................................... 72
7 ASSUMPTIONS .................................................................................................... 731 PURPOSE OF THIS INFRASTRUCTURE STRATEGY
Infrastructure accounts for over half of the Carterton District Council’s (CDC) annual
operating expenditure and over 80% of Council’s capital expenditure. This infrastructure
provides the foundations on which the Carterton district community is built. It is essential to
the health, safety, and land transport needs of the district and has a significant impact on
the physical environment.
Good quality local infrastructure facilitates social and economic wellbeing. It enables
businesses and communities to flourish. Conversely, poor infrastructure will inhibit the
economic performance of Carterton district. Getting infrastructure spending right is a pre-
requisite to enhancing the quality of life and attracting people to live in the district.
This infrastructure strategy outlines:
• the key wastewater, water supply, stormwater and land transport infrastructural issues
the Carterton district community must address over the next 30 years:
• the options under the most likely scenario for dealing with those issues;
• the cost and service delivery implications for residents and businesses of those options;
and
• the Council’s current preferred scenario for infrastructure provision.
This strategy will help the Council to make informed decisions to deal with the major
decisions and investment opportunities that will occur over the next 30 years.
2 BACKGROUND
2.1 LEGISLATIVE CONTEXT
Section 101B of the Local Government Act 2002 requires all local authorities to prepare and
adopt an infrastructure strategy covering a period of at least 30 years, as part of its Ten Year
Plan. The statutory purpose of an infrastructure strategy is to identify significant
infrastructure issues for the Council over the 30-year period covered by the strategy, and to
identify the principal options for managing those issues.
This strategy addresses the above purpose by outlining how CDC intends to manage its
water supply, wastewater, stormwater, and roads and footpath infrastructure assets.
Inclusion of these asset types in the strategy is mandatory. Other asset types (eg parks,
buildings, etc.) may be included, at the discretion of CDC, but are of a relatively minor scale
and value and do not form part of this Infrastructure Strategy.
The strategy is consistent with and represents a culmination of the strategies underpinning
CDC’s corresponding activity management plans (AMPs). The AMPs are key supporting
information for the Infrastructure Strategy.
CARTERTON DISTRICT COUNCIL |Infrastructure Strategy 2018–2048 47252 v9 Consultation draft 2The Infrastructure Strategy will be reviewed on a three-yearly basis in line with, and as an
important component of, Council’s 3-yearly review of its Ten Year Plan.
2.2 HISTORICAL CONTEXT—FORMATION OF CARTERTON DISTRICT COUNCIL
Carterton District Council was formed in April 1989 from a voluntary amalgamation of the
former Carterton Borough and South Wairarapa County Councils. The Borough Council had
been in existence since 1887 while the County Council’s origins go back to earlier roads
boards in the 1850s.
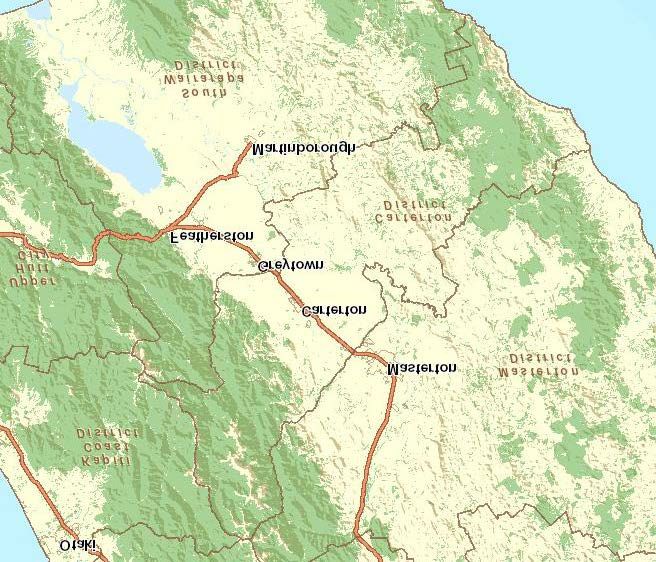
2.3 GEOGRAPHICAL CONTEXT
Carterton district encompasses predominantly rural land on the eastern side of the lower
North Island. The western boundary is the Tararua Ranges with the eastern boundary being
the Pacific Ocean. The District is adjacent to Masterton District to the north, and South
Wairarapa District to the south. Kāpiti Coast District adjoins its western boundary.
Figure 1: Carterton District Boundaries
CARTERTON DISTRICT COUNCIL |Infrastructure Strategy 2018–2048 47252 v9 Consultation draft 3The usually resident population of Carterton district was 8,235 at the 2013 census. The
administrative and main trading centre is Carterton, with over half (57% or 4,686 in 2013
census) of the district’s usually resident population residing in this town.
There are other, smaller, rural settlements located within the district including Gladstone,
Flat Point and Clareville.
The predominant land use in the district is pastoral agriculture, principally beef and sheep
and dairy farming, with a significant amount of forestry in the eastern hill country. The main
employment sectors are agriculture, forestry, and fishing, with all of these sectors highly
dependent on CDC’s roading infrastructure for transport connections. Small pockets of
viticulture and winemaking exist in the Gladstone area.
A moderate scale industrial precinct is located at the northern end of the district
(Waingawa) with water and wastewater infrastructure connected to Masterton District
Council’s networks because of their proximity location. Masterton District Council provides,
by agreement, potable water and treats and disposes of the wastewater and trade waste.
A large and expanding bacon and ham food processing factory is located within Carterton
with water supply mostly sourced from its own bore, but is totally reliant on CDC
infrastructure for wastewater treatment and disposal.
2.4 REORGANISATION PROPOSALS
The Local Government Act 2002 provides processes for initiating and determining the
reorganisation of councils, including amalgamation. A joint reorganisation application
prepared by the three Wairarapa councils and lodged with the Local Government
Commission in May 2013 sought the establishment of a single Wairarapa unitary authority,
separate from the current Wellington region. The Commission subsequently developed its
preferred option comprising the amalgamation of all district and city councils in the region
into a single unitary authority but that was rejected following strong negative responses
from the affected community during the formal consultation procedure.
The Commission then worked with the three Wairarapa councils in developing a new
proposal comprising a separate Wairarapa territorial authority, and retention of the current,
separate, Greater Wellington Regional Council. A poll on that proposal was triggered, closing
12 December 2017. The poll defeated the Commission’s proposal by a vote of 58.76%
against, 41.24% in favour. For planning purposes, that means that the current structure of
local government in Wairarapa will in all likelihood endure over the term of this strategy.
3 APPROACH TO MANAGING INFRASTRUCTURE ASSETS
CDC’s approach to managing its infrastructure assets involves optimisation of the whole of
life costs of its infrastructure. There are three key components of that: operating and
CARTERTON DISTRICT COUNCIL |Infrastructure Strategy 2018–2048 47252 v9 Consultation draft 4maintenance costs, renewal costs and development activities. The three are interrelated,
with the timing of renewals or new capital development impacting on annual maintenance
costs.
The strategy outlines how CDC intends to manage its three-waters and roading
infrastructure assets, taking into account the need to:
• maintain, renew or replace existing assets
• respond to growth or decline in the demand for services reliant on those assets
• allow for any planned changes to levels of service provided through those assets
• maintain or improve public health and environmental outcomes or mitigate adverse
effects on them
• provide for the resilience of infrastructural assets by identifying and managing risks
relating to natural hazards and by making appropriate financial provision for those
risks.
3.1 OPERATING AND MAINTENANCE
Operational activity is work or expenditure which has no direct effect on asset condition but
which is necessary to keep the asset functioning, such as the provision of staff, inspections,
consumable materials (chemicals etc.), resource consent applications and compliance,
monitoring, and investigations.
Maintenance can be defined as the activities that preserve an asset in a condition which
allows it to perform its required function. Maintenance comprises regular servicing and
immediate repairs necessary to keep the asset operational. The ongoing efficiency of routine
maintenance is critical to achieve optimum asset life cycle costs that best suit the desired
levels of service.
Maintenance falls into two categories, planned and reactive, each having quite different
triggering mechanisms but similar objectives.
Planned maintenance comprises routine servicing of assets to maintain day to day
functionality. It often entails scheduled servicing of key asset components on a rotational or
seasonal basis – eg servicing of pumps, flushing of mains, mowing of roadside vegetation,
etc.
Reactive maintenance entails responses to unplanned asset failure such as burst water
mains, roadside slips, sewer overflows, etc.
The strategy is to maintain levels of service through timely and effective maintenance
interventions until the age or condition of the asset makes it uneconomic to continue to
maintain. Within this, striking a balance between the frequency of planned maintenance and
the incidence of reactive maintenance, is key.
CARTERTON DISTRICT COUNCIL |Infrastructure Strategy 2018–2048 47252 v9 Consultation draft 53.2 RENEWAL OR REPLACEMENT
Asset renewal or replacement does not increase the assets’ original design capacity but
restores, rehabilitates, replaces or renews an existing asset to extend its economic life
and/or restore the asset to its original service potential. It is a key driver of CDC’s
infrastructure strategy because of the age profile and condition of some of the assets, and
the need to develop a replacement strategy which is both affordable and sustainable.
CDC’s renewal strategy is, in general, to rehabilitate or replace assets when justified by:
Asset performance: renewal of an asset where it fails to meet the required level of service
due to deterioration of asset condition. Non-performing assets are identified by the
monitoring of asset condition, reliability, capacity, and efficiency during planned
maintenance inspections and operational activity. Indicators of non-performing assets
include:
• structural failure
• repeated asset failure (blockages, mains failure, pavement failure, etc),
• ineffective water or wastewater treatment.
Economics: Renewals are programmed with the objective of achieving:
• the lowest life-cycle cost for the asset (the point at which it is uneconomic to continue
repairing the asset), and
• a sustainable long term cash flow by smoothing spikes and troughs in renewals
programmes based on the estimated economic lives of asset groups, and
• efficiencies, by co-ordinating renewal works with capacity upgrade work or other
planned works in the area.
Risk: The risk of failure and associated financial and social impact justifies action (eg
probable extent of property damage, safety risk).
Renewal works are assessed and prioritised in accordance with the following priority ranking
table, the cost/benefit ratio of each project, Council’s objectives and strategies, and
available funds.
Priority Renewal criteria
1 • Asset failure is imminent or has occurred and renewal is the most cost effective
(High) option
• The asset is a critical asset and asset failure is likely to have major impact on the
environment, public safety or property
• Condition and performance ratings of asset is 4 - 5 (poor or very poor)
• Asset performance is non-compliant with resource consent requirements
CARTERTON DISTRICT COUNCIL |Infrastructure Strategy 2018–2048 47252 v9 Consultation draft 6Priority Renewal criteria
2 • Asset failure is imminent, but failure is likely to have only a moderate impact on
the environment, public safety or property.
• Asset failure is imminent and proactive renovation is justified economically
• The asset is vulnerable to natural hazards and optimised renewal will
improve resilience
• Condition and performance ratings of asset is 4 - 5 (poor or very poor)
• System upgrading scheduled within five financial years as asset is nearing end
of economic life.
• Asset renewal is justified on the basis of benefit cost ratio and deferment would
result in significant additional costs
• The asset has a high criticality rating
3 • Asset failure is imminent, but failure is likely to have a minor impact on the
environment, public safety or property
• Condition and performance ratings of asset is 3 (moderate/average)
• Asset renewal is justified on the basis of life cycle costs, but deferment would
result in minimal additional cost
• The asset has a medium criticality rating
4 • Existing assets have a low level of flexibility and efficiency compared with
replacement alternative
• Condition and performance ratings of asset is 1 - 2 (good to excellent)
• The asset has a low criticality rating
5 (Low) • Existing asset materials or types are such that known problems will develop in
time.
• Condition and performance ratings of asset is 1 (excellent)
Table 1: Renewals strategy
3.3 CAPITAL IMPROVEMENTS—PLANNING FOR THE FUTURE
Growth and demand are the main drivers of new capital development, and include:
• population increase and demographics
• changes to and the incidence of new land use activities
• more stringent regulatory standards and demand for higher levels of service
(eg resource consents)
• community expectations and demand for additional services.
Mitigating the effects of demand can be achieved through demand management strategies,
particularly in respect of the 3-waters. CDC’s capital development strategy entails
maximising the use of existing asset capacity as the first priority over investment in new
infrastructure.
Further consideration of each component of the strategy relative to each of the four
infrastructure asset groups is provided in Section 5.
CARTERTON DISTRICT COUNCIL |Infrastructure Strategy 2018–2048 47252 v9 Consultation draft 73.4 HISTORICAL EXPENDITURE
Whilst operating expenditure (Opex) has trended upwards in line with inflation and
increased loan servicing costs, capital expenditure (Capex) tends to be more ‘lumpy” due to
the specific nature of capital projects (renewals and improvements), as illustrated in Table 2
below.
ACTIVITY 2012 2013 2014 2015 2016 2017
WW Opex 907,428 1,029,795 1,232,833 1,421,826 1,841,568 1,600,437
WW Capex 465,351 3,179,573 657,907 1,609,015 856,935 783,163
Water
1,467,511 1,576,338 1,676,864 1,676,864 1,773,632 2,055,560
Supply Opex
Water
207,906 147,408 613,865 93,911 106,126 397,612
Supply Capex
Stormwater
174,101 165,938 175,722 173,338 165,699 185,585
Opex
SW Capex 16,585 35,898 712 28,123 26,786 559
Roading
3,374,926 3,627,655 3,229,949 3,429,985 3,156,942 3,357,647
opex
Roading
1,945,801 2,284,727 1,908,043 1,701,863 1,729,596 1,572,402
capex
Table 2: Historical operating and capital expenditure 2012-2017
4 DEMOGRAPHIC FACTORS
4.1 CURRENT POPULATION
With data from the latest census on 8 March 2018 not yet available, the most recent census,
held in 2013, has been used as the base for population projection purposes.
CARTERTON DISTRICT COUNCIL |Infrastructure Strategy 2018–2048 47252 v9 Consultation draft 8For statistical purposes, the Carterton district population is distributed across four area
units. The largest area unit population is the urban area of Carterton, and the smallest is
Waingawa.
Area Unit 2001 2006 2013
Waingawa 258 312 480
Mt. Holdsworth 1,092 1,179 1,350
Te Wharau 1,395 1,488 1,722
Carterton 4,104 4,122 4,686
Total 6,849 7,098 8,235
Table 3: Inter-census area unit populations 2001-2013
(Note: The above numbers do not total exactly due to rounding of data)
Figure 2: Inter-census usually resident population by area unit
A comparison between the 2001, 2006, and 2013 census figures (the 2011 census was
cancelled and replaced with the 2013 census due to the 2011 Christchurch earthquake)
shows that the major increase (16%) occurred in the 2006 to 2013 inter-census period, with
nearly 50% of that occurring in the Carterton area unit. Positive growth was also measured
across the remaining area units.
CARTERTON DISTRICT COUNCIL |Infrastructure Strategy 2018–2048 47252 v9 Consultation draft 9Figure 3: Inter-census population change by area unit 2001-2013
The Carterton district, usually resident, population increased from 6,849 in 2001 to 8,235 in
the 2013 census, an overall increase of 20%, and an average annual increase of 1.7% per
annum, distributed across the four area units making up the district as follows:
Figure 4: Inter-census annual population change % by area unit 2001-2013
While most of the population increase, in absolute terms, occurred in Carterton, the highest
annual percentage increase occurred in the Waingawa area unit because of its low
population base (258 people in 2001).
CARTERTON DISTRICT COUNCIL |Infrastructure Strategy 2018–2048 47252 v9 Consultation draft 10Compared with the 2001 and 2006 censuses, the 2013 population decline in the 25–39 years
age bracket was off-set by an increase in population from 40 years and above. More marked
increases in population distribution were represented across the 50–74 years age brackets,
although the variation from 2006 in absolute terms is relatively minor—less than 300 across
the district—and will not impact on the capacity of current infrastructure.
Figure 5: Inter-census population age profile—2001-2013
4.2 GROWTH PROJECTIONS
An indicator of future population growth trends can be drawn from the incidence of new
lots and dwellings:
CARTERTON DISTRICT COUNCIL |Infrastructure Strategy 2018–2048 47252 v9 Consultation draft 11New Subdivision Lots New Dwellings
Year Urban Rural Total Urban Rural Total
2007 80 109 189 47 36 83
2008 35 60 95 31 28 59
2009 21 37 58 21 29 50
2010 51 55 106 25 27 52
2011 14 21 35 24 20 44
2012 8 30 38 42 23 65
2013 41 50 91 50 20 70
2014 42 28 70 47 25 72
2015 32 43 75 27 14 41
2016 33 12 45 7 5 12
Total since
357 445 802 321 227 548
2007
% 45% 55% 59% 41%
1
Table 4: New lots and dwellings 2007 - 2016
On average, 80 new lots per year were created over the 2007-2016 period, with 45% urban
and 55% rural.
Figure 6: New subdivisional lots 2007 - 2016
Similarly, an average of 55 new dwellings were created per year, weighted 59% urban and
41% rural.
1
From Boffa Miskell draft Urban Growth Strategy dated 20 Sept 2017
CARTERTON DISTRICT COUNCIL |Infrastructure Strategy 2018–2048 47252 v9 Consultation draft 12Figure 7: New Dwellings 2007 - 2016
Commencing with the 2013 Census as the base, the Statistics New Zealand projected
population growth scenarios for Carterton district are shown in Table 5 below 2:
Population
Projection
Scenario 2013 3 2018 2023 2028 2033 2038 2043 2048
High 8,490 9,590 10,150 10,650 11,100 11,500 11,850 12,319
Medium 8,490 9,360 9,650 9,900 10,050 10,150 10,200 10,405
Low 8,490 9,130 9,160 9,140 9,030 8,830 8,560 8,567
Table 5: Population projection scenarios for Carterton District 2013-2048
Between 2013 and 2048, Carterton district’s population is projected to increase by 1,915 (up
23%) under the ‘Medium’ population projection. Under the ‘High’ population projection, the
district may potentially increase by 3,829 people (up 45%). Of this projected growth, the 65+
age group proportion of the total population is the only age that increases.
2
Adapted from Boffa Miskell draft Urban Growth Strategy dated 20 Sept 2017 by extending out to 2048.
3
2013 Census usually resident district population was 8,235.
CARTERTON DISTRICT COUNCIL |Infrastructure Strategy 2018–2048 47252 v9 Consultation draft 13Figure 8: Population projections – Carterton District
To calculate the number of houses needed to accommodate the projected additional
population, the average household size for Carterton district of 2.4 persons has been used.
Applying that to the projected population over the next 30 years (ie from 2018-2048), the
projected household growth is for an additional 798 households under the Medium
Projection scenario and 1,595 under the High Projection scenario, over the 2013-48 period.
Added to current household numbers, this means that Carterton District’s households will
grow from 3,294 to 4,092 households (up 24%) between 2013 and 2048 under the Medium
Projection, and to 4,889 under the High Projection. Annualising the growth projections
equates to the need for an additional 27 or 53 houses per year for 30 years (medium and
high projection scenarios respectively).
Of particular relevance to the projected demand on CDC’s water, wastewater and
stormwater infrastructure is the projected number of new urban dwellings over the next 30
years (2018-48). Table 4 above identifies an average annual increase of 32 new urban
dwellings per year over the 2007-16 period. That equates to an additional 1,124 new urban
dwellings on top of the estimated 1,953 dwellings in 2013. The total projected number of
urban dwellings will approach 3,076 by 2048, with an equivalent usually resident urban
population increasing from approximately 4,686 in 2013 to 7,382 by 2048.
In 2017, Boffa Miskell prepared an urban growth strategy for the District, including an
updated assessment of the remaining capacity for future residential parcels within the
Carterton residential zones of the Wairarapa Combined District Plan. That identified that
Carterton Township (ie the residential area) makes up only 0.4% of the total land area of
CARTERTON DISTRICT COUNCIL |Infrastructure Strategy 2018–2048 47252 v9 Consultation draft 14Carterton District and is managed by a residential zone and a low density residential area as
defined in the Wairarapa Combined District Plan. The current remaining areas for the
residential zone and low density area are outlined in Table 6 below.
Zone Total Land Area of Current Remaining Additional
Zone Capacity Housing Capacity
Available
(ha) (ha)
Residential 289.7 41.6 800
Low Density 219.1 51.5 180
Total Residential Zone 508.8 93.1 980
Table 6: Carterton residential zone – remaining capacity
Carterton Township will need to accommodate approximately 1,124 additional houses by
2048, assuming the above growth projection. Boffa Miskell has identified that approximately
180 new houses can be accommodated in the current zoned areas for Carterton, and based
on the minimum lot size of 400m2 plus an additional 30% allowance for roads and reserves,
an additional 800 houses could be accommodated within the existing zoned land. That
would leave a deficit of approximately 7.5 ha (equivalent to 144 houses), as summarised in
Table 7 below.
Zone Remaining Additional Land Required Land Capacity
Residential Housing for Additional Available by
Land Area 2013 Required Housing 2048
(ha) (ha) (ha)
Residential 41.6 944 49.1 -7.5
Low Density 51.5 180 51.5 0
Total 93.1 1124 100.6 -7.5
Residential
Zones
Table 7: Carterton Township Residential Land Capacity by 2048
Table 7 shows that, at the rate of 32 new urban houses per year, the remaining residential
zoned land in Carterton will be fully subscribed by about 2044, ie in 26 years’ time. Beyond
that, CDC will need to plan for future residential development outside the current zoning,
together with the provision of infrastructure to support that development.
CARTERTON DISTRICT COUNCIL |Infrastructure Strategy 2018–2048 47252 v9 Consultation draft 15CDC’s draft Urban Growth Strategy identifies proposed, supplementary residential areas to
the west and east of the current residential zone to accommodate future growth. In both
cases, provision will need to be made for extension of the CDC’s network infrastructure to
service these areas.
In summary, the above demographic trends indicate that there will be a medium increase in
residential demand for urban water, wastewater and stormwater infrastructure at
Carterton. For the past few years, Council has been working on improving the condition of
its core infrastructure assets, particularly the water supply and wastewater activity areas, in
order to support public health outcomes and to meet its resource consent requirements.
The demographic growth trend supports an approach involving maintenance, renewal and
capital improvements to the existing infrastructure to maintain current levels of service,
alongside moderate increase in new capacity for water and wastewater treatment and
storage.
The water, wastewater, and stormwater infrastructure in particular is principally designed
for residential use in the urban area, with industrial access to these services secondary and
dependent on availability of capacity within current consent limitations, and appropriate
on-site pre-treatment. Similarly, any additional reticulation capacity required within the
respective pipe networks would need to be funded by developers.
4.3 LEVELS OF SERVICE
Current levels of service provided by CDC’s three-waters infrastructure (water supply,
wastewater, and stormwater) are likely to continue to be dominated by minimum regulatory
requirements such as drinking water standards, the regional policy statement, and resource
consents.
Wellington Regional Council’s Proposed Natural Resources Plan (PNRP) has been notified
and submissions are currently and sequentially being heard across multiple hearing streams.
It is expected the PNRP will impact on minimum levels of service across each of the three
waters because of the higher environmental standards and the need to mitigate the effects
of rural and urban land use activities on natural resources. Retaining current levels of service
will likely require greater attention to efficient water management and environmental
impacts, for all systems—see asset specific discussion of this under Section 5.
For the roading infrastructure, a move to standardised, national, customer levels of service
for each of the new road classifications could potentially result in reduced customer levels of
service for rural access roads. Many of CDC’s roads are in this category. This could manifest
in the form of a reduced incidence of routine maintenance, and in some cases, increased
reactive maintenance response times. Overall, the effects of ONRC on current levels of
service for the CDC roading network are expected to be no more than minor, if any.
The processes required to finalise these core, regulatory, levels of service planning processes
are still some way off. In the case of the Proposed Natural Resources Plan, completion of
CARTERTON DISTRICT COUNCIL |Infrastructure Strategy 2018–2048 47252 v9 Consultation draft 16hearings is expected to extend well into 2018, and some aspects may be contested through
the Environment Court. For the roading infrastructure, the proposed new levels of service
associated with One Network Roading Classification project will take effect from 1 July 2018,
but are not likely to have significant impact on the current levels of service for CDC’s road
and footpath networks.
Either way, financial provision for mandatory changes to levels of service as a result of
regulatory planning processes or external funding criteria, will be phased in to CDC’s
budgetary provisions through future annual and long-term planning processes, once they
are finalised.
In all cases, the capital costs relate to maintaining levels of service. There is no growth-
related expenditure relating to additional asset capacity over the term of the plan. It has
been assumed that any new infrastructure required as a result of the projected population
growth will be funded by developers and downstream asset capacity will be sufficient to
accommodate the projected growth.
The Council assesses financial contributions under the Resource Management Act 1991.The
legislation has changed and financial contributions will cease in April 2021. A review of the
contributions policy is planned, with a view to replace financial contributions with
development contributions under the Local Government Act, at a similar level of revenue.
This will be done in conjunction with a review of the District Plan.
4.4 CLIMATE CHANGE
Climate change projections 4 for Wairarapa are there will be significant impacts to the
Wellington Region by 2090 if global emissions are not significantly reduced. They include:
• warmer temperatures (+30 C)
• significant increase in the number of hot days (>250 C) from 24 days now to 94 days
• frosts in the high elevations of the Tararua Ranges are likely to disappear
• spring rainfall will reduce by up to 10% on eastern areas
• the risk of drought will increase in Wairarapa
• more extreme rainfall events.
These impacts will require Council to consider the capacity and resilience of Carterton’s
water supply, stormwater drainage and wastewater systems.
More frequent droughts may affect the security of the Carterton water supply. Currently the
supply relies on adequate water flows from the Kaipaitangata River and Lincoln Road well-
4
Greater Wellington Regional Council’s Climate Change Report (June 2017)
CARTERTON DISTRICT COUNCIL |Infrastructure Strategy 2018–2048 47252 v9 Consultation draft 17field to maintain a supply throughout the year and has limited storage capacity for a
sustained drought. The impact of that is further considered under clauses 5.3.4 and 5.3.5.
Conversely, more frequent, high intensity rainfall will challenge the existing capacity of the
urban stormwater drainage network and downstream drainage channels. Similarly,
increased inflow and infiltration to the sewerage network is likely to be a consequence of
higher rainfall events.
Equally, the roading network can be expected to be exposed to harsher environmental
conditions, impacting on roadside bank stability and drainage.
4.5 RISKS AND RESILIENCE OF INFRASTRUCTURE
The main risks to CDC’s infrastructure from natural hazards are major earthquakes,
droughts, and flooding. Climate change variability in rainfall patterns and hence
groundwater and surface flows, is a potential risk for all water utilities and associated
changes to environmental effects.
Parts of Carterton district are built on old flood plains that could be subject to liquefaction in
a major earthquake. Part of the Council’s reticulation renewals programme will involve using
different construction methods and materials to provide greater earthquake resilience in
pipelines. Council does not consider this risk is so great that it should bring forward its
renewals programme. Instead it will address resilience at the time pipes are replaced.
Previous risk mitigation measures include the installation of baffles in the town water
reservoirs to reduce water “surge” during a major seismic event, bore-field development to
provide an auxiliary supply in the event of drought or trunk main failure from the
Kaipaitangata supply, and incorporation of seismic design in the construction of all bridge
structures.
Risk mitigation and resilience measures are incorporated in CDC’s renewals strategy as a
means of prioritising replacement work, and include the replacement of brittle pipe
materials with modern, flexible materials and jointing systems. The funding of these
measures is built into forecast asset renewal and capital works programmes, with funding
from depreciation reserves, contributions, or loans.
Additional assessment of the likelihood and consequence of the above risks, followed by
intervention and mitigation strategies to improve resilience of CDC’s critical assets, is an on-
going process. This work has been developed and costed in CDC’s asset management plans.
Financial provision for any necessary risk mitigation measure identified has been included in
the 2018 review of the Infrastructure Strategy.
Risk mitigation measures will be maintained, funded from forecast programmes, to ensure
CDC’s critical assets including bridges, treatment plants, storage reservoirs and trunk mains
CARTERTON DISTRICT COUNCIL |Infrastructure Strategy 2018–2048 47252 v9 Consultation draft 18are designed and routinely inspected, assessed, and strengthened to improve resilience to
natural hazards. Critical assets are defined as those that would have the greatest
consequence in the event of failure.
Flood protection of the district is the responsibility of GWRC and is therefore not addressed
in this strategy.
5 SIGNIFICANT INFRASTRUCTURE ISSUES FOR CARTERTON DISTRICT
5.1 GENERAL
This strategy relates to Carterton District Council’s (CDC’s) wastewater, water supply
(including water races), stormwater drainage, and road and footpath infrastructure. The
tables on the following pages summarise the significant infrastructure issues facing CDC, the
proposed response to those issues, and the implications of taking or not taking the action
proposed by the response. In many instances, the same principal response option is capable
of addressing several infrastructure issues.
5.2 CDC WASTEWATER SCHEME
5.2.1 Wastewater assets
CDC owns and manages a single community wastewater scheme in the district, at Carterton.
The scheme comprises approximately 43 km of sewer pipe ranging in size from 63mm to
380mm diameter. 70% of the network is 150mm diameter, reflecting the relatively small
catchment and easy ground contours. Pipe lengths do not include the private wastewater
laterals that amount to approximately 19.4km.
CARTERTON DISTRICT COUNCIL |Infrastructure Strategy 2018–2048 47252 v9 Consultation draft 19Figure 9: Pipe size distribution - Wastewater 5
Thirty-six percent of the pipe material comprises earthenware pipes. The bulk of the
reminder is PVC (36%) and concrete (23%).
Figure 10: Pipe material type distribution - wastewater
5
All WW asset data from CDC WW AMP 2018–21
CARTERTON DISTRICT COUNCIL |Infrastructure Strategy 2018–2048 47252 v9 Consultation draft 20Earthenware and asbestos cement pipe types tend to be brittle and a large proportion is
approaching the end of their useful lives—a factor in the wastewater renewals profile.
Pipe condition assessments are used to inform renewal planning, noting that the timing of
pipe replacements is usually influenced by deterioration in serviceability of the network as
distinct from structural capacity. Poor condition sewer pipes located above groundwater will
continue to provide relatively high serviceability compared with the same condition pipes
located below groundwater.
Pipe condition data suggests 56% of the wastewater network is in average condition. 36% of
pipes are rated as good or poor condition, as illustrated below:
Figure 11: Current Wastewater Condition (ex CDC’s AssetFinda AMIS data base )
Figure 12 below shows pipe length grouped by asset age. The majority of the 43km of
wastewater pipes are 40-70 years old. Within that, approximately 25.0km are 60-70 years
old. There is a high proportion of pipes in the reticulation network that are older than the
generally expected average lifespan of 60 years. Pipe age is however only an indicator of
actual pipe longevity, with some pipes lasting longer or shorter than the nominal life. Pipe
condition is monitored using CCTV to assess remaining useful life and replacement
programming, taking account of pipe serviceability factors—pipe condition does not always
impact on serviceability.
CARTERTON DISTRICT COUNCIL |Infrastructure Strategy 2018–2048 47252 v9 Consultation draft 21Figure 12: Average age of sewer pipes
Converting pipe age and condition into remaining life produces the following indicative
profile: (excludes private wastewater laterals)
Figure 13: Estimated remaining life of sewer pipes
CDC has established an annual replacement programme to address deterioration of its older
wastewater infrastructure and to maintain current levels of service. A long-run programme
has been developed to smooth the peaks and troughs of the indicative programme based on
remaining useful life and historical demand. Approximately 4.6km of sewerage pipes have
been replaced since 2008 through implementation of this programme.
CARTERTON DISTRICT COUNCIL |Infrastructure Strategy 2018–2048 47252 v9 Consultation draft 22In addition to the pipe reticulation, the Carterton wastewater infrastructure assets include
15 pump stations and a three stage wastewater treatment plant with tertiary effluent
irrigated to a 65.6ha CDC owned property.
5.2.2 Asset data confidence
Asset data confidence is reliable for inventory, capacity, and historical expenditure, but is
low for data condition as summarised in Table 8. Part of CDC’s asset management
improvement programme involves progressive capture of asset condition data using CCTV
pipe surveys and data logging during repair work.
Very Highly
Attribute uncertain Uncertain Reliable reliable
Physical Parameters X
Asset Capacity X
Asset Condition X
Valuations X
Historical Expenditures X
Design Standards X
Table 8: Wastewater asset data confidence levels
5.2.3 Asset value
6
The wastewater infrastructure had an optimised depreciated replacement value in 2016 of
$6,179,470, as summarised in Figure 14:
Optimised Replacement Optimised Depreciated
Asset Type
Cost Replacement Cost
Pipe Reticulation $9,099,296 $3,110,762
Reticulation fittings $2,013,240 $853,886
Pump Stations $590,578 $391,927
Treatment Plant $3,046,747 $1,374,234
Wastewater upgrade $1,024,544 $448,661
Total $15,774,404 $6,179,470
6
CDC asset revaluations for the 3-waters infrastructure are completed every three years. The most recent valuation of the
waters was in 2016.
CARTERTON DISTRICT COUNCIL |Infrastructure Strategy 2018–2048 47252 v9 Consultation draft 23Figure 14: Wastewater asset valuation summary 2016
5.2.4 Levels of service
The key levels of service to be met through the wastewater infrastructure are both customer
based and technical, but are dominated by the latter—essentially, compliance with the
operative resource consents for the discharge of treated effluent and associated activities.
Customer levels of service relate to odour management, incidence of overflows,
responsiveness to service requests etc.
New discharge consent applications and a notice of requirement for designation of the
entire wastewater treatment and irrigation site were made in April 2017. The new consents
were issued effective from 19 January 2018 for a period of 35 years, expiring 2053.
5.2.5 Wastewater Treatment Plant Upgrade
The Council has a long-term vision of ultimately removing the discharge of effluent to
Mangatārere Stream all year round, except in exceptional circumstances. The Council is
currently upgrading its wastewater treatment systems to meet that vision. The key
components of the upgrade are:
Stage 1:
• Inflow & infiltration investigation, condition assessment, rehabilitation/replacement,
and control (on-going)
• Manage trade wastes (on-going. New trade waste consent required for Premier Beehive)
• Upgrade UV disinfection plant to 10,000m3/day capacity (2014)
• Obtain and implement consent for Stage 1 irrigation on Daleton Farm (completed 2014)
• Operate, monitor and record effects of irrigation on soil, groundwater and air
• Use trial results to inform 2017 consent applications (completed).
Stage 2:
• Apply for and obtain new resource consents for the discharges associated with the
activity and a land use designation for the site (completed April 2017)
• Construct earthworks on the site in preparation for new irrigator (2017/18)
• Provide 200,000m3 on-site storage on Daleton Farm (2018/19)
• Relocate riverine discharge to the lower reaches of Mangatārere Stream, just above the
confluence with Waiohine River (2019/20)
• Extend irrigation on Daleton Farm (2020/21)
• Discharge to stream only at stream flows greater than three times median
• Construct new trunk sewer to the east of Carterton to accommodate projected urban
expansion.
Stage 3:
• Investigate options for supplementary, off site bulk storage of effluent
• Develop supplementary, off-site, bulk storage (800,000m3)
• Extend irrigation off Daleton Farm.
CARTERTON DISTRICT COUNCIL |Infrastructure Strategy 2018–2048 47252 v9 Consultation draft 24The scheme has been designed for a projected population of 8,500 by the end of the new
35-year consent period (ie by 2052). Critical to that will be careful management and control
of trade waste discharges, in particular that from the major Carterton industry, being
Premier Beehive NZ. Premier’s current organic load is significant—equivalent to
approximately 50% of the total load discharged to the WWTP.
Figure 15: Premier Beehive trade waste discharge load as a proportion of total load
The corresponding action under Stage 1 of the strategy will be fundamental to managing
trade waste discharges to the Carterton WWTP.
5.2.6 WW infrastructure management issues
Infrastructure management issues include:
CARTERTON DISTRICT COUNCIL |Infrastructure Strategy 2018–2048 47252 v9 Consultation draft 25Table 9: Summary of issues - Carterton Wastewater Scheme
Issue Description Options Implications
Asset Renewal or High infiltration rates entering pipe network. Preferred option
Replacements Proactive programme of condition assessment of
entire pipe network, including visual inspection, Assessment work to be undertaken in years 1
CCTV, and recording findings during and 2 of 10YP to understand where the
maintenance work. This will be used to identify infiltration is occurring, at a cost of $270,000.
priority repairs and renewals in line with the
Pipe Repair Manual and following the optimised Repairing or replacing pipes to stop
decision making process codified in NAMS. infiltration will result in less wastewater
needing to be treated and discharged
This will be followed by programmed repairs and from the wastewater treatment plant.
renewals. There will also be ongoing reactive
repairs and renewals.
A repeat condition assessment is planned in
20 years’ time.
Other options
Continue current approach of reactive, ad hoc Being unplanned and ad hoc is likely to be at a
renewals as issues arise. higher unit cost. Failures will be likely which
will result in an unacceptable level of service,
including increased wastewater requiring
treatment.
Response to Demand Future demand includes increased residential Preferred option
growth projection beyond capacity of current Treatment plant and disposal capacity is being Forecast cost of treatment plant upgrade is
residential zoning. Projected population upgraded in line with current and projected approximately $19.5 million over the 30-year
growth could see the current urban demand. planning period. Loan servicing and
population in Carterton township increase by associated operating costs have been
CARTERTON DISTRICT COUNCIL |Infrastructure Strategy 2018–2048 47252 v9 Consultation draft 26Issue Description Options Implications
605 over the 2018–48 planning period. Application of trade waste by-law to provide provided for in the Ten Year Plan.
mechanism for controlling trade waste
discharges and recovering costs from industrial
users proportional to volume and concentration
of discharge. The by-law is currently being
reviewed. This is expected to be completed in
2018/19, and any changes will need to be
subsequently implemented.
An additional trunk main is planned for 2012/24
at a cost of $855,000 to the east of Carterton
township to accommodate projected residential
growth in the north-east of town in line with the
Urban Growth Strategy.
Other options
There are no other viable options. “Do-nothing”
is not a viable option as the current
infrastructure would not meet future demand
and would likely result in failures, loss of service
levels and adverse impacts on the environment.
Levels of Service (LoS) LoS focus is on reliability of service, capacity, Preferred option
public health, and environmental protection. Environmental protection will be enhanced Current levels of service, as improved through
through implementing the planned treatment replacement and upgrades of main
There is potential for higher environmental and disposal upgrade in line with the new components of scheme, will be increased and
standards in the next 30 years. resource consents, which take into account the then maintained through the period. This is
expected implications of the GWRC’s proposed part of the overall treatment plant upgrade
Natural Resources Plan. project (see immediately above).
Other options
There are no other viable options. “Do-nothing”
is not a viable option as the current
CARTERTON DISTRICT COUNCIL |Infrastructure Strategy 2018–2048 47252 v9 Consultation draft 27Issue Description Options Implications
infrastructure would not meet future demand
and would likely result in failures which would
adversely affect the environment and potentially
on public health.
Public Health and The operative resource consents provide the Preferred option
Environment legal right to operate the Carterton sewage Ongoing monitoring of the treatment plant to The financial impacts of the recent and future
treatment plant and to ensure any adverse ensure it complies with the new discharge treatment plant and effluent disposal
effects of the activity on the environment are consent conditions. upgrades have been included in the 2018–
avoided or mitigated. 2028 Ten Year Plan.
There is provision in years 11–30 of the 10YP to
Operational practices mean there are no expand the treatment and disposal to full The cost of expanding the land discharge in
public health issues. discharge to land. years 11-30 is $23.1 million.
Any unanticipated requirements from the
proposed Natural Resources Plan could be dealt
with as part of this expansion.
Other options
Do not move towards total land discharge of The expectation of the community is that the
treated wastewater Council will ultimately remove all treated
wastewater from natural waterways for
environmental and cultural reasons.
Monitoring the impacts of the upgraded
treatment and disposal system currently
being installed will confirm and quantify any
impacts of the new discharge regime. The
benefits and affordability of total land
discharge will be tested prior to a final
commitment to the preferred option.
Risk and Resilience Gradual ground movement or more sudden Preferred option
and significant ground movement caused by a Wastewater service continuity and Current risk mitigation measures will be
CARTERTON DISTRICT COUNCIL |Infrastructure Strategy 2018–2048 47252 v9 Consultation draft 28Issue Description Options Implications
seismic event. environmental and public health is threatened maintained through the strategy period and
by breakage or leaks. Network components will no additional cost.
have specific vulnerability to risk according to
materials. The design and materials used for Condition assessment and subsequent
renewals will take into account earthquake rehabilitation/replacement programming,
resilience. commencing with critical assets, will be given
a high priority. The assessment is planned for
The proposed 200,000m3 effluent storage years 1 and 2 in the 10YP at a cost of
reservoir will be designed to protect against $270,000.
potential liquefaction of the foundations or
embankment failure due to a large seismic
event.
Other options
There are no other viable options.
Climate change is likely to cause increased Preferred option
intensity storm events, including flooding. The additional 200,000m3 storage capacity will If the reservoir capacity is inadequate, there is
act as a buffer in high rainfall events when the the potential to breach the land discharge
Conversely, drought conditions are more farm soil conditions prevent land discharge. consents and contaminate surrounding
likely and will cause low flows in the receiving Should that be inadequate, treated effluent can groundwater with untreated waste. The
waterways, limiting the opportunity to be discharged to the river, provided it is in high probability of this risk occurring is considered
discharge treated wastewater. flow. to be low within the term of this strategy but
the potential consequences are high.
Long periods of low flow in Mangatārere River
will also be buffered by the storage capacity,
along with the ability to irrigate.
Other options
There is no viable alternative option.
CARTERTON DISTRICT COUNCIL |Infrastructure Strategy 2018–2048 47252 v9 Consultation draft 295.2.7 Funding mechanism
The CDC wastewater scheme is funded using a combination of rates and user charges (trade waste
charges). The rate component is split between a targeted rate (90%) and general rates (10%).
5.2.8 Disposal of wastewater infrastructure
There are no disposal issues in respect of CDC’s wastewater assets.
5.3 CDC WATER SUPPLY SCHEMES
CDC owns and manages a municipal water supply scheme for Carterton township, and two
rural water race schemes – Carrington and Taratahi.
5.3.1 Carterton water supply assets
The Carterton urban supply comprises a dam and two storage reservoirs totalling 1500 m3 at
the Kaipaitangata intake, supplemented by a four-bore well-field and 500 m3 storage in
Lincoln Road. Only two of the bores are used for production, with Bore 1 disused since 2015
and Bore 4 unstable, producing high turbidity on start-up. The well-field details are
summarised in Table 10 below:
2016
Depth Long
Daily
Bore GWRC Date Consent to top Screen Term
Aquifer Yield Status
No. Category drilled expiry of length Yield
(m3/
screen m3/d
d)
Disused
since 2015
1 C 2 1991 2034 25.9 1.5 1,555 1382
due to e-coli
presence
Current
2 B 1 1988 2034 14.0 6.6 1,814 1123 production
bore
Current
3 B 1 2005 2034 13.3 4.0 2,160 1382 production
bore
Unstable –
high
4 C 2 2006 2034 26.0 2.0 518 518
turbidity on
start-up
Table 10: CDC Well-field details
Water treatment involves pH adjustment, chlorine and UV disinfection at both sources, with
filtration provided at the Kaipaitangata Stream source. Additional filtration is being trialled
at the well-field.
CARTERTON DISTRICT COUNCIL |Infrastructure Strategy 2018–2048 47252 v9 Consultation draft 30You can also read