Flooding in the Mekong Delta: the impact of dyke systems on downstream hydrodynamics - Hydrol-earth-syst-sci.net
←
→
Page content transcription
If your browser does not render page correctly, please read the page content below
Hydrol. Earth Syst. Sci., 24, 189–212, 2020
https://doi.org/10.5194/hess-24-189-2020
© Author(s) 2020. This work is distributed under
the Creative Commons Attribution 4.0 License.
Flooding in the Mekong Delta: the impact of dyke
systems on downstream hydrodynamics
Vo Quoc Thanh1,2,3 , Dano Roelvink1,2,4 , Mick van der Wegen1,4 , Johan Reyns1,4 , Herman Kernkamp4 ,
Giap Van Vinh5 , and Vo Thi Phuong Linh3
1 Department of Water Science and Engineering, IHE Delft, Delft, the Netherlands
2 Faculty of Civil Engineering and Geosciences, Delft University of Technology, Delft, the Netherlands
3 College of Environment and Natural Resources, Can Tho University, Can Tho City, Vietnam
4 Deltares, Delft, the Netherlands
5 Cuu Long River Hydrological Center, Southern Regional Hydro-Meteorological Center, Can Tho City, Vietnam
Correspondence: Vo Quoc Thanh (t.vo@un-ihe.org)
Received: 5 February 2019 – Discussion started: 19 February 2019
Revised: 20 November 2019 – Accepted: 3 December 2019 – Published: 16 January 2020
Abstract. Building high dykes is a common measure of cop- stream flooding in Cambodia. Future studies will focus on
ing with floods and plays an important role in agricultural sediment pathways and distribution as well as climate change
management in the Vietnamese Mekong Delta. However, the impact assessment.
construction of high dykes causes considerable changes in
hydrodynamics of the Mekong River. This paper aims to as-
sess the impact of the high-dyke system on water level fluc-
1 Introduction
tuations and tidal propagation in the Mekong River branches.
We developed a coupled 1-D to 2-D unstructured grid using Rivers are the major source of fresh water for human use
Delft3D Flexible Mesh software. The model domain cov- (Syvitski and Kettner, 2011). In addition, the fresh water sup-
ered the Mekong Delta extending to the East (South China ply is an important resource for ecosystems. When river dis-
Sea) and West (Gulf of Thailand) seas, while the scenar- charge exceeds the bankfull discharge, the floodplains inun-
ios included the presence of high dykes in the Long Xuyen date. Fluvial floods cause both advantages and disadvantages
Quadrangle (LXQ), the Plain of Reeds (PoR) and the Trans- for local residents. Floods are the main source of fresh water
Bassac regions. The model was calibrated for the year 2000 supply and deliver sediments that act as a natural and valu-
high-flow season. Results show that the inclusion of high able fertiliser source for agricultural crops (Chapman and
dykes changes the percentages of seaward outflow through Darby, 2016). This is an important process in the Mekong
the different Mekong branches and slightly redistributes flow Delta as the majority of local citizens are farmers. In contrast,
over the low-flow and high-flow seasons. The LXQ and PoR extreme floods may damage both crops and infrastructure.
high dykes result in an increase in the daily mean water lev- In order to maintain agricultural cultivation during the
els and a decrease in the tidal amplitudes in their adjacent high-flow seasons, dyke rings have been built to protect
river branches. Moreover, the different high-dyke systems agricultural crops in the Vietnamese Mekong Delta (VMD).
not only have an influence on the hydrodynamics in their own As a result, the river system in the VMD has significantly
branch, but also influence other branches due to the Vam Nao changed, especially following the severe floods in 2000
connecting channel. These conclusions also hold for the ex- (Biggs et al., 2009; Renaud and Kuenzer, 2012). A dense
treme flood scenarios of 1981 and 1991 that had larger peak canal system has been created in flood-prone areas to effi-
flows but smaller flood volumes. Peak flood water levels in ciently drain flood waters from the Long Xuyen Quadrangle
the Mekong Delta in 1981 and 1991 are comparable to the and the Plain of Reeds to the West Sea (Gulf of Thailand)
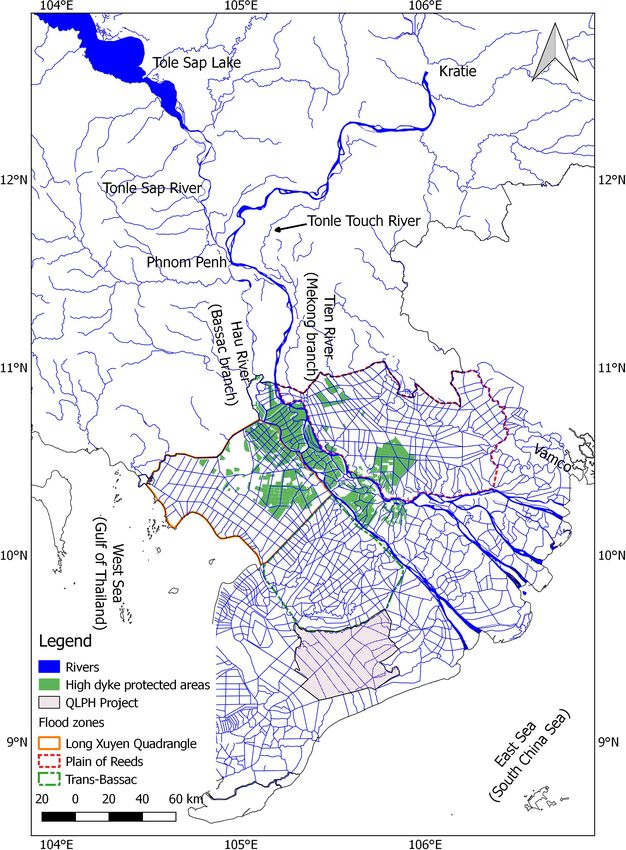
2000 flood as peak floods decrease and elongate due to up- and to the Vamco River respectively (Fig. 1).
Published by Copernicus Publications on behalf of the European Geosciences Union.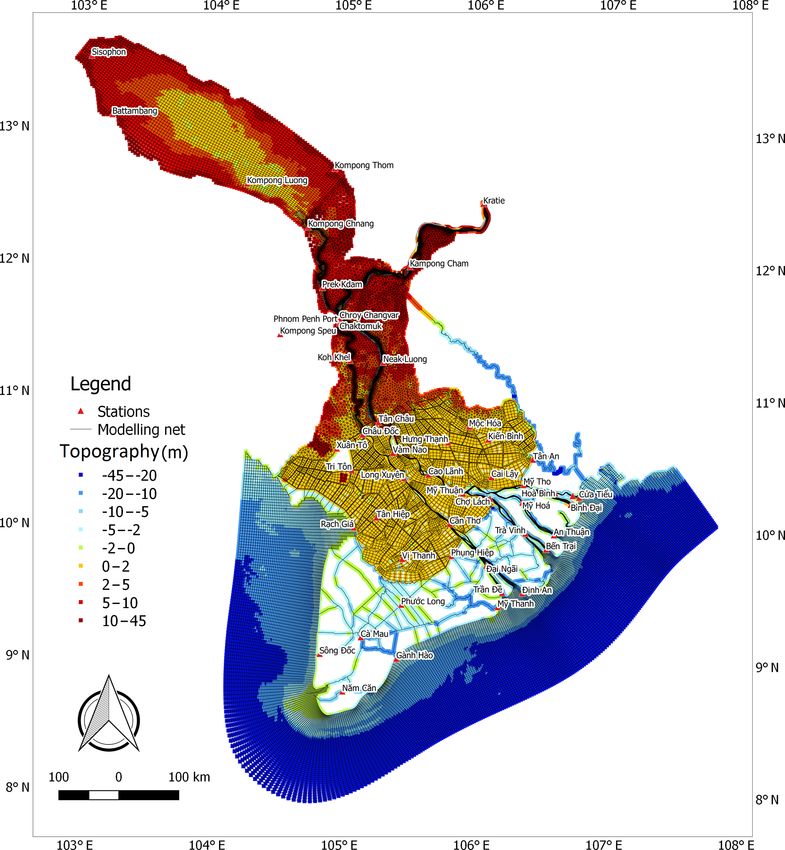
190       V. Q. Thanh et al.: Flooding in the Mekong Delta: the impact of dyke systems on downstream hydrodynamics

                                                                    dynamics by reducing inundated floodplain areas, but also
                                                                    impacts fluvial sediment deposition on floodplains.
                                                                        There are a number of large-scale numerical models used
                                                                    to simulate the annual floods and suspended sediment trans-
                                                                    port and to evaluate the impacts of dyke construction in the
                                                                    Mekong Delta (Manh et al., 2014; Tran et al., 2018; Triet
                                                                    et al., 2017; Van et al., 2012; Wassmann et al., 2004). For
                                                                    instance, Tran et al. (2018) investigated the impacts of the
                                                                    upstream high-dyke system on the downstream part of the
                                                                    VMD. Using a MIKE hydrodynamic model for the Mekong
                                                                    Delta, they found that the high-dyke system in the Long
                                                                    Xuyen Quadrangle (LXQ) can reduce the discharge of the
                                                                    Tien River, diverting around 7 % of the total volume to the
                                                                    Hau River. In addition, the yearly discharge variations have
                                                                    slight effects on the peak water levels at the Can Tho sta-
                                                                    tion, while Triet et al. (2017) found that the high-dyke sys-
                                                                    tem caused an increase from 9 to 13 cm in the flood peaks
                                                                    at the central VMD stations. Moreover, Triet et al. (2017)
                                                                    showed that the development of the dyke system upstream
                                                                    of the VMD reduced flood retention in this area, leading to
                                                                    an increase of 13.5 and 8.1 cm in the peak water levels in
                                                                    the downstream part of the VMD at Can Tho and My Thuan
                                                                    respectively.
                                                                        The above-mentioned studies evaluated the impact of high
                                                                    dykes in the LXQ and the high dykes developed up un-
                                                                    til 2011. However, the impacts of the other floodplain regions
                                                                    need to be considered, including the LXQ, the Plain of Reeds
                                                                    (PoR) and Trans-Bassac. Additionally, Manh et al. (2014),
Figure 1. Location of the Mekong Delta. Adapted from the De-        Tran et al. (2018) and Triet et al. (2017) used a common
partment of Agriculture and Rural Development of An Giang and
                                                                    1-D version of the MIKE11 model for the Mekong Delta,
Dong Thap (2012).
                                                                    and the downstream boundaries are defined at the Mekong’s
                                                                    river mouths. However, Kuang et al. (2017) found that river
                                                                    flows can contribute to a rise in the water level at the river
                                                                    mouths. Thus, in the present study another modelling ap-
   Recently, large hydraulic structures have been built not         proach is used in order to address these issues.
only in the flood-prone areas but also in coastal areas to              This study aims to assess the impacts of the high-dyke sys-
protect cropping systems from saline intrusion. Therefore,          tem on water level fluctuation and tidal propagation in the
hydrodynamic processes have changed considerably. Under-            Mekong River branches. An unstructured, combined 1-D to
standing the prevailing hydrodynamics is essential for sus-         2-D grid is used to simulate the flood dynamics in 2000. The
tainable water management in these regions.                         model domain covers the Mekong Delta and extends from
   The high-dyke system is intended to reduce local natural         Kratie in Cambodia to the East (South China Sea) and West
flood hazards but may alter the hazard downstream (Triet et         (Gulf of Thailand) seas. Simulated scenarios present the im-
al., 2017). Furthermore, this system also increases the poten-      pact of high dykes in different floodplain regions and the en-
tial risk due to dyke breaks. Following different approaches,       tire VMD. The specific objectives are
Tran et al. (2018) found that the high-dyke system upstream
of the VMD causes an increase in the peak water levels                – to develop a calibrated and validated hydrodynamic
in downstream areas. However, water levels at these down-               model using Delft3D Flexible Mesh that is able to sim-
stream stations are dominated by tidal motion. In fact, tides           ulate the annual floods in the Mekong Delta;
may result in an increase in water levels in the central VMD.
Thus, an analysis of tidal fluctuation is needed to investigate       – to analyse the spatial–temporal distribution of the
water level changes on the Mekong River. The high-dyke sys-             Mekong River’s flows for different extreme river flow
tem may be an important factor, but sea level rise in combi-            scenarios; and
nation with land subsidence enhances peak water levels at
the central stations to a larger extent (Triet et al., 2017). The     – to evaluate how the development of high dykes, which
high-dyke system influences not only the downstream hydro-              are built to protect floodplains, influences the down-

Hydrol. Earth Syst. Sci., 24, 189–212, 2020                                        www.hydrol-earth-syst-sci.net/24/189/2020/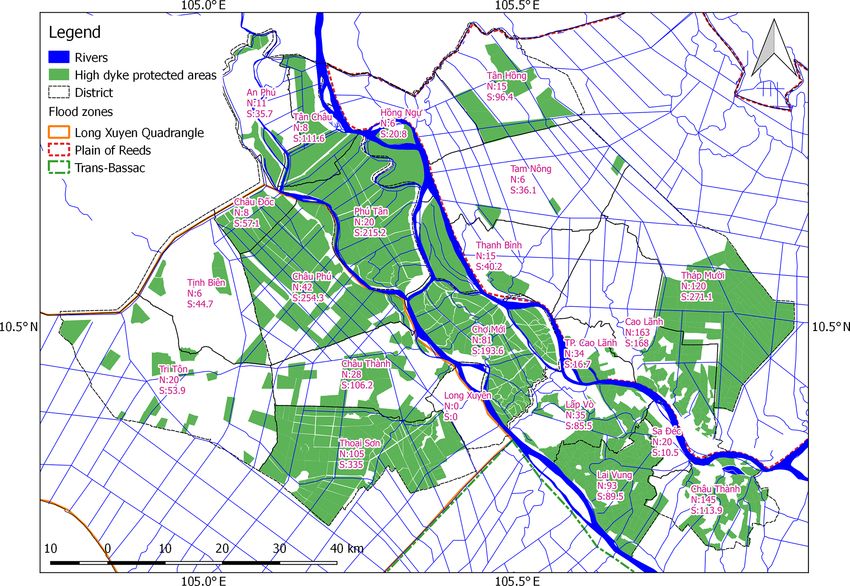
V. Q. Thanh et al.: Flooding in the Mekong Delta: the impact of dyke systems on downstream hydrodynamics                      191

      stream hydrodynamics, particularly with respect to tidal    total rainfall. The yearly mean rainfall is about 1600 mm in
      propagation.                                                the VMD. The highest rainfall is found in the western coastal
                                                                  area of the Mekong Delta and ranges between 2000 and
1.1   The Mekong Delta                                            2400 mm. The eastern coast receives about 1600 mm of rain-
                                                                  fall, whereas the lowest rainfall is recorded in the centre of
The Mekong is one the largest rivers in the world (MRC,           the VMD (Le Sam, 1996; Thanh et al., 2014).
2010). It starts in Tibet (China) and flows through five ripar-
ian countries before reaching the ocean via (originally nine      1.2   High-dyke development in the Vietnamese Mekong
branches but now) seven estuaries. It has a length of 4800 km           Delta
and a total catchment area of 795 000 km2 (MRC, 2005).
The Mekong Delta starts in Phnom Penh (Fig. 1), where             The Mekong Delta has been modified extensively over the
the Mekong River is separated into two branches, namely           last 2 decades following the devastating flood in 2000. One
the Mekong and the Bassac (Gupta and Liew, 2007; Renaud           noticeable change is the hydraulic infrastructure, especially
et al., 2013). The Mekong Delta is formed by sediment de-         the dyke development. Before the dykes were built, a dense
position from the Mekong River, which provides an annual          canal network was developed to drain floods to the West Sea
water volume of 416 km3 as well as 73 Mt yr−1 of sediment         and to clean acid sulfate soils.
at Kratie, which is mainly distributed in the high-flow sea-         Depending on the dyke function, dykes can be classified
son (Koehnken, 2014; MRC, 2005). The Mekong Delta has a           into two categories. Low dykes are built to protect the rice
complex river network, especially in the Vietnamese region.       harvest from summer–autumn crops in August. This is the
The Mekong Delta’s river network is illustrated in Fig. 2. It     rising phase of the annual floods. The low dykes allow flood
has resulted from extensive artificial canal development that     overflows and the inundation of floodplains, so the crests
began in 1819 (Hung, 2011).                                       of low dykes are designed to just equal the maximum wa-
   Regarding land resources, the VMD area comprises about         ter level in August. High dykes are constructed in order to
4 × 10⁶ ha, and three-quarters of this region is used for agri-   completely prevent the annual floods and enable intensive
cultural production (Kakonen, 2008). The livelihoods of the       agricultural production. Generally high dykes are designed
local citizens are primarily based on agriculture and aquacul-    at a crest level of 0.5 m above the year 2000 flood peak. The
ture. Thus, the river infrastructure has been developing with     2000 flood was a severe event that has a 50-year recurrence
agriculture as a priority. The area provides just over half of    interval in terms of flood volume (MRC, 2005). In An Giang,
the rice yields in Vietnam and provides up to approximately       there are two types of high dykes. The first type of high dyke
90 % of the exported rice yields from Vietnam (GSOVN,             only has a single dyke ring. The hydrodynamics just outside
2010). However, the rice cultivation is highly influenced by      of the dyke ring are dominated by floods. These dykes have
annual floods (MRC, 2009a).                                       a straightforward floodplain protection function but a high
   The most intensive agricultural production in the VMD is       risk of breaching. The other type of high dyke contains the
found in An Giang Province (Fig. 2). Although it is also a        above-mentioned single dyke ring which is then protected by
flood-prone area, the inundation periods are slightly shorter     a large outer dyke. The hydrodynamics outside of these high
due to flood withdraw to the West Sea. In the deep flooded        dykes are controlled by structures (sluice gates) in the outer
zones (the Long Xuyen Quadrangle and the Plain of Reeds),         dyke.
high dykes have been densely constructed in the downstream           Several studies have mapped the high dykes in the VMD
direction. This is due to the fact that the areas downstream      using remotely sensed images (e.g. Duong et al., 2016; Fuji-
of the LXQ and PoR experience low flood peaks, meaning            hara et al., 2016; Kuenzer et al., 2013). Using this method,
that the dyke rings do not need to be as high as they do in the   the high dykes are identified via flooded and non-flooded
regions upstream of the LXQ and PoR.                              areas. However, these results are easily affected by the wa-
   The Mekong Delta is dominated by a tropical monsoonal          ter management of the high-dyke rings. For example, in An
climate. There are two dominant monsoons. The south-              Giang, the high-dyke areas are managed according to the
west monsoon occurs from May to October, coinciding with          3 + 3 + 2 cropping cycle rule. In other words, these areas are
the high-flow season. The other, drier monsoon period is          cultivated for eight (3 + 3 + 2) agricultural crops over 3 years
from November to March and is followed by a transition            and are allowed to inundate during part of the year once ev-
period (MRC, 2010). The mean temperature is approxi-              ery 3 years. Thus, the results need to be verified with obser-
mately 26.5 ◦ C. Although the climate is seasonally changing,     vations to ensure the reliability of the maps.
monthly average temperature differences are 4 ◦ C between            High dykes were rarely constructed in the VMD be-
the hottest and coldest months (Le Sam, 1996). However,           fore 2000 (Duong et al., 2016). However, as previously
seasonal rainfall is drastically different in terms of time and   stated, the year 2000 historical flood caused enormous dam-
space. The high-flow season contributes approximately 90 %        age to infrastructure and residents’ properties. After the flood
of the total annual rainfall intensity, whereas the low-flow      event, the local authorities planned and built a cascade of
season (from December to April) accounts for 10 % of the          high dykes in order to protect residents as well as crops,

www.hydrol-earth-syst-sci.net/24/189/2020/                                        Hydrol. Earth Syst. Sci., 24, 189–212, 2020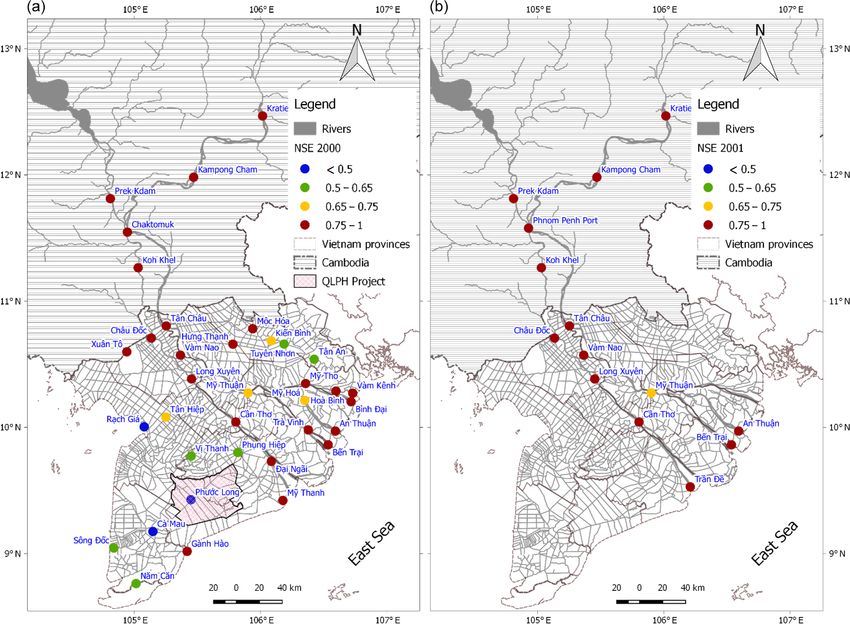
192       V. Q. Thanh et al.: Flooding in the Mekong Delta: the impact of dyke systems on downstream hydrodynamics

Figure 2. Spatial distribution of high dykes that were built up until 2011. The high dykes are presented by district. The number of high
dykes (N ) is shown as well as the area that they protect (S) in square kilometres (km2 ). Adapted from the Department of Agriculture and
Rural Development of An Giang and Dong Thap (2012).

which are the major livelihood in this region. In addition, the        whereas the latter is dominated by marine processes, in-
VMD has great potential with respect to the intensification of         cluding tides and waves (Ta et al., 2002). The Mekong
agricultural production. In 2009, the area protected by high           River supplies approximately 416 km3 of water annually,
dykes was about 1222 km2 , covering around 35 % of An Gi-              or 13 200 m3 s−1 through Kratie on average (MRC, 2005).
ang Province; in 2011, this percentage had increased to over           Figure 3 shows that water discharge varies from 1700 to
40 % (about 1431 km2 ). Dong Thap has a much lower cov-                40 000 m3 s−1 between the low-flow and high-flow seasons
erage of about 30 %, corresponding to an area of 990 km2 ;             (Frappart et al., 2006; Le et al., 2007; MRC, 2009b; Wolan-
however, Dong Thap has deep, inundated areas and its soil              ski et al., 1996). During the high-flow season, high water
contains a high concentration of sulfates, resulting in a low          discharge causes inundation in the delta floodplains in Cam-
potential for agriculture (Kakonen, 2008).                             bodia and Vietnam. The annual floods in the Mekong Delta
   Figure 2 presents the numbers of high dykes and the ar-             can be indicated by their peaks and volumes. The analysis of
eas protected by these structures by district in An Giang and          flood peaks and volumes at Kratie from 1961 to 2017 shows
Dong Thap provinces until 2011. In 2011, the number of high            that the floods in 1991 and 2000 were extreme (Fig. 4).
dykes in An Giang and Dong Thap were 329 and 657 re-                      From Kratie to Phnom Penh, the hydrodynamics of the
spectively. The total area protected by high dykes in An Gi-           Mekong River are dominated by fluvial flows. The river
ang was larger than in Dong Thap (about 14 compared with               banks are lower than the water levels in the high-flow sea-
10 km2 respectively). As a result, the mean area of a high             sons, which leads to water overflow into the floodplains. The
dyke in An Giang is larger than in Dong Thap. In fact, high            floodplains on the west side convey water to the Tonle Sap
dykes are located mainly along the banks of the Tien River             River, while the flood water flows into the Tonle Touch River
and Hau River (Fig. 2), where the soils are alluvial (Nguyen           on the east side (Fig. 1). The floodplains on the west re-
et al., 2015).                                                         ceive less water than those on the east, with water volumes
                                                                       of 24.7 and 35.4 km3 respectively. The peak discharges of
1.3   Flood dynamics in the Mekong Delta                               the Mekong River to the respective left and right floodplains
                                                                       are approximately 5400 and 7800 m3 s−1 (Fujii et al., 2003).
                                                                       These floodplains in combination with the Tonle Sap River
The Mekong Delta is spatially separated into inner and
                                                                       encompass about half of the Mekong’s peak discharge.
outer sections. The former is dominated by fluvial processes,

Hydrol. Earth Syst. Sci., 24, 189–212, 2020                                            www.hydrol-earth-syst-sci.net/24/189/2020/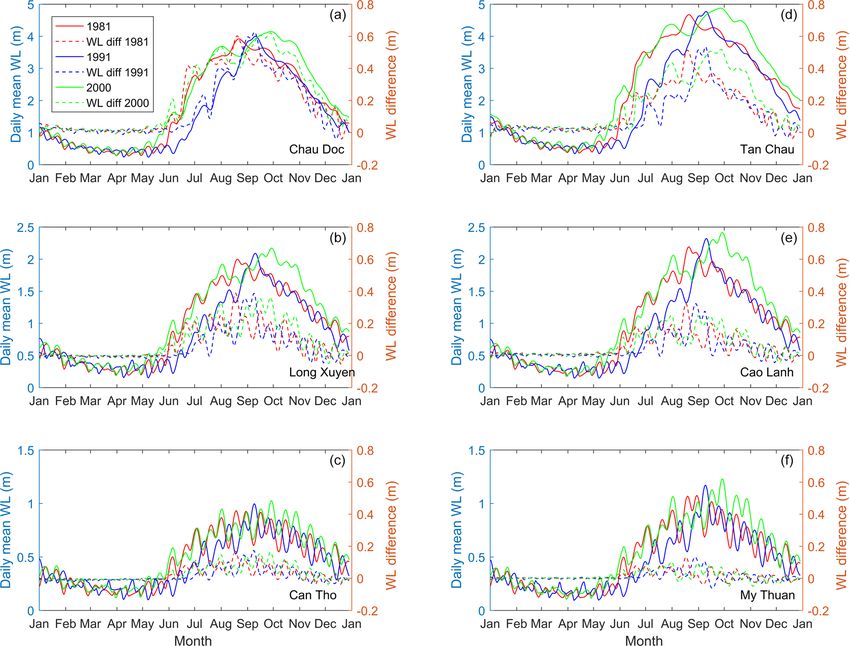
V. Q. Thanh et al.: Flooding in the Mekong Delta: the impact of dyke systems on downstream hydrodynamics                           193

Figure 3. Temporal distribution of daily water discharge at Kratie (available data from Darby et al., 2016).

Figure 4. The annual flood peaks and volumes at Kratie from 1961 to 2017. The green and black boxes indicate significant (mean ± SD) and
extreme (mean ± 2 SD) drought or flood years respectively. (SD refers to standard deviation.)

www.hydrol-earth-syst-sci.net/24/189/2020/                                                Hydrol. Earth Syst. Sci., 24, 189–212, 2020
194       V. Q. Thanh et al.: Flooding in the Mekong Delta: the impact of dyke systems on downstream hydrodynamics

                                                                   However, the Vam Nao connecting channel leads to a rela-
                                                                   tive balance between the Tien River (at My Thuan) and the
                                                                   Hau River (at Can Tho) downstream (Fig. 6). At these sta-
                                                                   tions water levels are strongly dominated by the tides of the
                                                                   East Sea. The water levels in the coastal VMD region fluctu-
                                                                   ate due to tides from both the East Sea and the West Sea, but
                                                                   the tidal range of the East Sea is much higher than that of the
                                                                   West Sea. Therefore, the East Sea’s tides play a more impor-
                                                                   tant role and become the main dominant factor controlling
                                                                   hydrodynamics in VMD coastal areas.

                                                                   2     Methodology
Figure 5. Daily averaged (from 1997 to 2004) water discharge hy-
                                                                   This section introduces the methodology of our study. Sec-
drograph at Prek Kdam and water level variation at Kampong Lu-
ong (Kummu et al., 2014). The solid line presents the river flow
                                                                   tion 2.1 describes the model set-up. Section 2.2 provides the
entering Tonle Sap Lake at the Prek Kdam station, and the dashed   model calibration and validation. Section 2.3 and 2.4 elabo-
line shows water levels at the Kampong Luong station.              rate on the high-dyke development scenarios and on further
                                                                   analysis of these scenarios respectively.

                                                                   2.1     Model description and set-up
   At Phnom Penh, the Mekong is divided into two branches
(the Mekong and the Bassac). In addition the Mekong River          2.1.1    Software description
joins with the Tonle Sap River. The Tonle Sap Lake is the
largest freshwater body in Southeast Asia and has a cru-           The hydrodynamic model applied in this study is the Delft3D
cially important role in controlling the water levels in the       Flexible Mesh (DFM) Model Suite which has been devel-
Mekong Delta. Its surface area covers an area of approxi-          oped by Deltares (deltares.nl). DFM is a multidimensional
mately 3500 km2 during the low-flow season and is about 4          model which includes one, two and three dimensions in the
times larger during the high-flow season (MRC, 2005). The          same set-up. It solves the 2-D and 3-D shallow water equa-
water volume of the lake can reach 70 km3 in the high-flow         tions (Kernkamp et al., 2011). These equations describe mass
season (MRC, 2005). The Tonle Sap Lake functions as a nat-         and momentum conservation (Deltares, 2018).
ural flood retention basin for the Mekong River, leading to a
reduction in the annual variations of water discharge flowing      ∂h
                                                                      + ∇ · (hu) = 0                                           (1)
into the delta. The flood flows to the lake and reverses back      ∂t
to the Mekong River at the Phnom Penh confluence during            ∂hu                                     τ
                                                                       + ∇ · (huu) = −gh∇ζ = ∇ · νh ∇u + ∇uT + ,               (2)
low flows. Figure 5 shows the long-term daily average wa-           ∂t                                         ρ
ter discharge flowing in and out of Tonle Sap Lake at the                                T
                                                                                   ∂    ∂
Prek Kdam station. When water levels at Kampong Luong              where ∇ = ∂x      , ∂y    , ζ is the water level, h is the water
increase, reaching a peak of over 9 m, the lake supplies wa-       depth, u is the velocity vector, g is the gravitational acceler-
ter to the delta, increasing the Mekong River flows after the      ation, ν is the viscosity, ρ is the water mass density and τ is
flood season and helping to reduce saline intrusion in coastal     the bottom friction.
areas during the low-flow season. From May to September,              DFM allows computation on unstructured grids, so it is
Mekong water feeds into the Tonle Sap Lake. From October           suitable for regions with complex geometry (Achete et al.,
until the following April it then drains back into the Mekong.     2015), including combinations of 1-D, 2-D and 3-D grids.
   From Phnom Penh to the Cambodian–Vietnamese (CV)                This feature is efficient for taking small canals into account.
border, the Mekong River flows mainly through the Mekong           Therefore, in this study, DFM is selected for simulating flood
branch, reaching up to 26 800 m3 s−1 during flood peaks (Fu-       dynamics in the Mekong Delta which comprises a dense river
jii et al., 2003). During these peaks, the floods discharge        network and highly variable river widths, dykes and flood
onto the VMD through the Mekong and Bassac branches as             plains.
well as via the floodplain overflow comprising 73 %, 7 % and
20 % of the total discharge respectively (Fig. 1).                 2.1.2    Model set-up
   In the VMD, the Mekong River flow partly diverts from
the Tien River (Mekong branch) to the Hau River (Bassac            The model in this study was improved from the model used
branch). Regarding flood distribution, water discharge at Tan      by Thanh et al. (2017). In the present configuration, the
Chau (Tien River) and Chau Doc (Hau River) is estimated            model uses a depth-averaged setting.
to be 80 % and 20 % of the total flood flow respectively.

Hydrol. Earth Syst. Sci., 24, 189–212, 2020                                        www.hydrol-earth-syst-sci.net/24/189/2020/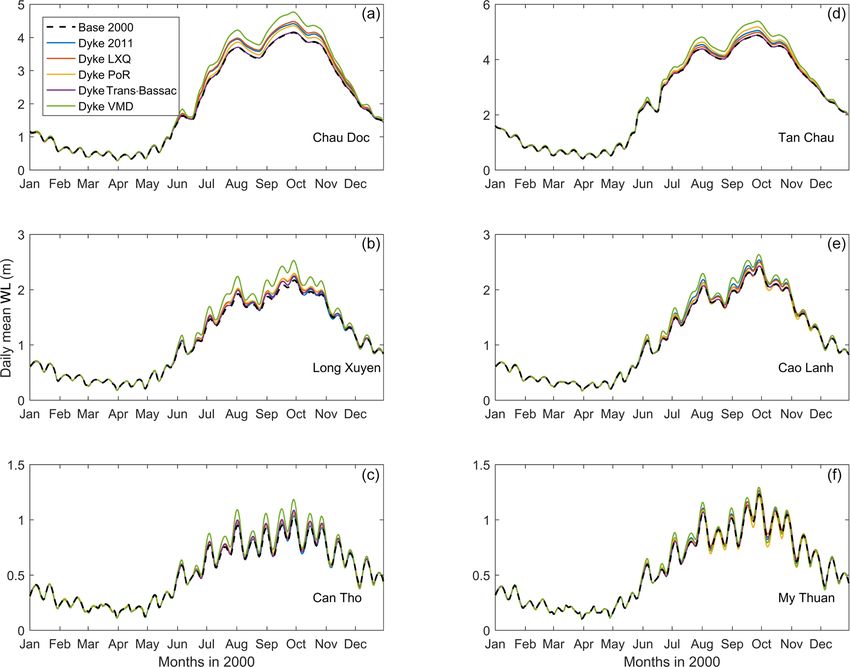
V. Q. Thanh et al.: Flooding in the Mekong Delta: the impact of dyke systems on downstream hydrodynamics                           195

Figure 6. Mekong Delta modelling grid and river interpolated topography from 1-D ISIS cross-section data and the shelf topography of the
Mekong Delta.

Grid generation and improvement                                          The grid includes the river system of the Mekong River
                                                                      from Kratie to the East Sea and its shelf. The mainstream of
The unstructured model was constructed using a multi-scale            the Mekong River, the subaqueous delta and floodplains are
modelling approach; specifically, it consists of a combination        represented by 2-D cells, whereas the primary and secondary
of 1-D (canals) and 2-D (the main branches of the Mekong              canals are modelled as 1-D networks. The 2-D cells are a
River, its floodplains and shelf) parts. The approach shows           combination of curvilinear (in the main channels) and trian-
efficiency in the case of complex geometry such as the entire         gular grid cells. The grid creation was introduced and recom-
Mekong Delta. To capture the hydrodynamics of the main                mended by Bomers et al. (2019) and Kernkamp et al. (2011).
branches and estuaries of the delta, the main channels are            The grid/element sizes vary from about 0.1 km in rivers to
represented in enough horizontal detail to resolve the flow           3 km on the delta shelf. The lengths of the grid vary depend-
patterns over channels and shoals and at the main bifurca-            ing on the river geometry. The lengths of cells are gener-
tions and confluences. Regarding the shelf, the model ex-             ally around 700 m on the Mekong River mainstreams and de-
tended to approximately 80 km from the coastline of the delta         crease to approximately 200 m at river bifurcations and con-
to fully contain the river plume (Fig. 6).                            fluences. The larger cells of the Tonle Sap Lake, the flood-

www.hydrol-earth-syst-sci.net/24/189/2020/                                             Hydrol. Earth Syst. Sci., 24, 189–212, 2020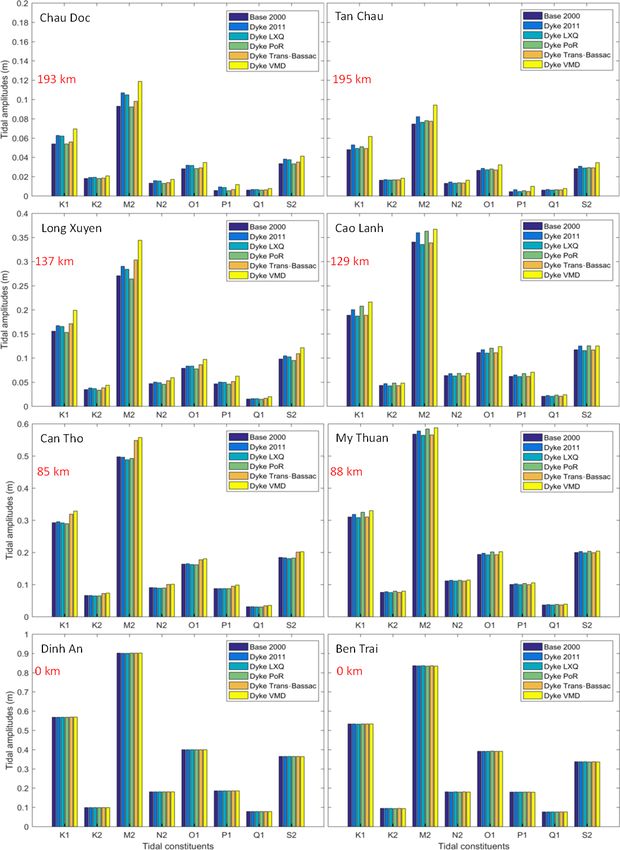
196       V. Q. Thanh et al.: Flooding in the Mekong Delta: the impact of dyke systems on downstream hydrodynamics

plains and the sea are up to 2000 m. The uniform length of         mann boundary which is driven by the alongshore water level
1-D segments is 400 m. The grid quality is critical for accu-      gradient (Tu et al., 2019).
rate simulations; therefore, the grid has been made orthog-
onal, smooth and sufficiently dense, to orthogonal values of       Initial conditions
less than 10 %.
   From the survey data, it can occur that a dyke ring in the      Water levels in the Mekong Delta vary highly in space due to
model can consist of both high dykes and low dykes. This           large-scale flood retention. Thus, the model takes a long time
situation may transpire because the model only includes the        to capture the system behaviour, especially with respect to
main rivers and the secondary canal network, and tertiary and      arriving at the correct flood storage for the Tonle Sap Lake.
small canals are not included. In order to determine whether       The Tonle Sap Lake plays a significant role in controlling
the dykes are fully protected or partly protected, the ratio of    upstream discharge in the low-flow season. Therefore, the
high-dyke area to low-dyke/non-dyke area is calculated. If         model was spun up over the year 1999; simulated results at
the ratio is higher than or equal to 1, the dyke is recognised     the end of this year were used as initial conditions for the
as a high dyke. If the ratio is lower than 1, it is determined     year 2000 simulation.
not to be a high dyke. In the modelling approach, a high dyke
does not allow water flow from linked canals to its protected      2.2   Model calibration and validation
floodplains, and we did not consider flows over the crest of
                                                                   The years 2000 and 2001 were chosen to calibrate and vali-
dykes.
                                                                   date the model respectively. The model calibration parameter
   The VMD witnessed three large floods from 2000 to 2002
                                                                   is the roughness coefficient. This parameter is also selected
based on the flood classification of the Tan Chau’s flood
                                                                   for calibration without any sensitivity analysis as it is com-
peaks. Thus, the 2000 and 2001 floods were chosen to cal-
                                                                   monly used for calibrating hydrodynamic models (Manh et
ibrate and validate the model respectively. Another reason
                                                                   al., 2014; Wood et al., 2016). In this study, the “trial and
for selecting the 2000 flood is that the datasets for this flood
                                                                   error” method is used for calibration. The roughness coef-
are comprehensive.
                                                                   ficients are extracted from the previous calibrated models,
                                                                   including ISIS (Van et al., 2012) and MIKE11 (Manh et
Bathymetry data
                                                                   al., 2014), in order to speed up the calibration process. The
                                                                   model was calibrated against measured data, with the ob-
When modelling the flood dynamics in the Mekong Delta,
                                                                   jective function of the Nash–Sutcliffe efficiency (NSE). The
bathymetry is a key element. However, available data from
                                                                   NSE is a normalised statistical indicator that uses the com-
the Mekong Delta are limited. For river bathymetry, cross-
                                                                   parison of the residual variance and the measured data vari-
sectional data were used that were collected by the Mekong
                                                                   ance (Nash and Sutcliffe, 1970); it is calculated as follows:
River Commission and used to develop the 1-D hydrody-
namic model (ISIS) to simulate fluvial flood propagation                  T                 2
                                                                                Qtm − Qto
                                                                          P
(Van et al., 2012). To use these profile data for 2-D mod-
elling, the cross-sectional data were interpolated to river               t=1
                                                                   E=−                           ,                             (3)
                                                                           T
bathymetry for the main branches, whereas the primary and                  P
                                                                                Qto − Qo
                                                                                         2
secondary canals directly used the cross-sectional data from              t=1
the 1-D ISIS model. The bathymetry of the sea area is
extracted from ETOPO1 (Amante and Eakins, 2009). The               where Qo is the mean of the observed discharges, Qtm is
floodplains’ topography is obtained from the freely available      the simulated discharges and Qto is the observed discharge
SRTM90m (Reuter et al., 2007) digital elevation model. Al-         at time t.
though SRTM is not a high-quality digital elevation model,            In this study, we used different temporal intervals of obser-
it was reasonably used for flood modelling in the Mekong           vation data. Daily data are used in the Cambodian Mekong
Delta (e.g. Dung et al., 2011; Tran et al., 2018).                 Delta (CMD), and hourly data are used in the VMD. The rea-
                                                                   son for this is that hydrodynamics in the CMD are unlikely
Boundary conditions                                                to be affected by tides, particularly in the high-flow season,
                                                                   whereas hydrodynamics in the VMD are strongly dominated
Open boundaries are defined as water discharge (at Kratie)         by tides, even in the high-flow season; thus, the hourly data
and water levels (the sea). The measured water discharges          are better for representing tidal fluctuation.
were used for the upstream boundary at Kratie and were                The NSE is commonly used for evaluating hydrologi-
collected from the Mekong River Commission. The latter             cal models. Model performance is acceptable if the NSE is
were defined as astronomical tidal constituents and extracted      higher than 0 (Moriasi et al., 2007). If the NSE is higher
from a global tidal model (TPXO; Egbert and Erofeeva,              than 0, the simulation is a better predictor than the mean
2002). Furthermore, in order to allow for alongshore trans-        observation. A NSE of 1 corresponds to a perfect match
port, the northern cross-shore boundary is defined as a Neu-       between the modelled results and the observed data. The

Hydrol. Earth Syst. Sci., 24, 189–212, 2020                                       www.hydrol-earth-syst-sci.net/24/189/2020/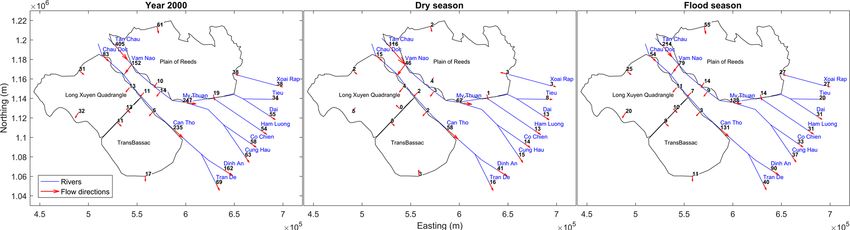
V. Q. Thanh et al.: Flooding in the Mekong Delta: the impact of dyke systems on downstream hydrodynamics                      197

hydrodynamic model is defined as well calibrated if the                 This region is a shallowly inundated area comprising
NSE, in terms of water levels and discharges, is higher                 3152 km2 .
than 0.5. Moriasi et al. (2007) classified model performance
based on the NSE as “very good” (NSE > 0.75), “good”                 – Scenario 6 (Dyke VMD) assumes that the high-dyke
(0.75 ≤ NSE ≤ 0.65), “satisfactory” (0.65 ≤ NSE ≤ 0.5) and             system is totally developed throughout the VMD’s
“unsatisfactory” (NSE < 0.5).                                          floodplains. This scenario is used to investigate the pos-
   In addition, we used a bias index in order to recognise if          sible impacts of high dykes if they are built to protect the
the model systematically under- or overestimated water lev-            entire VMD floodplain area. The total floodplain area
els. In this study, a commonly used bias measure – the mean            considered in the model is about 13 059 km2 .
error – is used to represent the systematic error of the model   2.4     Analysis of simulations
(Walther and Moore, 2005). The bias is computed based on
the following equation:                                          2.4.1    Tidal harmonic analysis
bias = S − O,                                              (4)   The peak water level is a good index for indicating ex-
where S is the simulated yearly mean, and O is the observed      treme events in flooded areas. Tran et al. (2018) and Triet
yearly mean. The bias is calculated for water levels over the    et al. (2017) used the flood peaks to assess the impact of high
year 2000.                                                       dykes in the VMD. However, the VMD coastal area is drasti-
                                                                 cally dominated by tides. As a result, the amplitudes of tidal
2.3   High-dyke development scenarios                            constituents are good indices for presenting average varia-
                                                                 tions in water levels in coastal areas. The water levels at the
To investigate the roles of different floodplains in the VMD     stations along the Tien River and Hau River were analysed
and the impact of these floodplains on the VMD’s hydro-          over the whole of the year 2000 using T_TIDE (Pawlowicz
dynamics and downstream tidal propagation, we developed          et al., 2002).
scenarios that include the contributions of each floodplains’
                                                                                      N
water retention. These scenarios used the hydrograph of the                           X          t            t

                                                                 x(t) = b0 + b1 t +      αk eiσ k + α−k e−iσ k ,               (5)
year 2000 flood, which was an extremely wet year, in order to                         k=1
estimate the maximum impacts of high dykes. The results of
a statistical analysis of flood peaks and volumes encouraged     where N is a number of tidal constituents. We analysed the
the selection of the year 2000 flood (Fig. 4).                   eight main tidal constituents. Each constituent has a fre-
   The hydrodynamic forcing is the same in these scenarios;      quency σk , which is known, and a complex amplitude αk ,
the only difference is development of high dykes. The sce-       which is not known. x(t) is a time series. αk and α−k are
narios are as follows:                                           complex conjugates.

  – Scenario 1 (Base) is the base scenario for the               2.4.2    Water balance calculation
    2000 flood, without high dykes. The floodplains in the
    VMD were not protected by high dykes before 2000             To understand flow dynamics, the water balance analysis is
    (Duong et al., 2016); therefore, no high dykes are con-      conducted using hourly discharge data from simulations. The
    sidered in this scenario.                                    targeted stations for this analysis are located on the Mekong’s
                                                                 mainstreams and boundaries of the flood-prone zones.
  – Scenario 2 (Dyke 2011) includes the high-dyke system                X
    in 2011, as illustrated in Fig. 2. The number of high        Vint =    Q · dt,                                           (6)
    dykes and the protected floodplain areas are described                t
    in Sect. 1.2.                                                where Vint is total water volume flowing in the target regions
  – Scenario 3 (Dyke LXQ) only includes the high-dyke            in accordance with the Mekong’s flow direction, Q is hourly
    system developed in the LXQ. The floodplain area pro-        simulated discharge, dt is the temporal interval, and t is se-
    tected by the high dykes in the LXQ is approximately         lected periods of an entire year and seasons.
    3034 km2 .
  – Scenario 4 (Dyke PoR) only includes the high-dyke sys-       3     Results
    tem developed in the PoR. The PoR is a deeply inun-
    dated region in the high-flow season (Kakonen, 2008).        In this section we present results of model performance and
    In this scenario, the high dykes in PoR protect a flood-     analysis. The model performance with respect to calibration
    plain area of around 5020 km2 .                              and validation is indicated by the NSE values (Sect. 3.1). The
                                                                 results for the spatial distribution and temporal variation are
  – Scenario 5 (Dyke Trans-Bassac) only includes the high-       shown in Sect. 3.2. In addition, Sect. 3.3 presents the impact
    dyke system developed in the Trans-Bassac region.            of high dykes on water levels and tidal propagation.

www.hydrol-earth-syst-sci.net/24/189/2020/                                        Hydrol. Earth Syst. Sci., 24, 189–212, 2020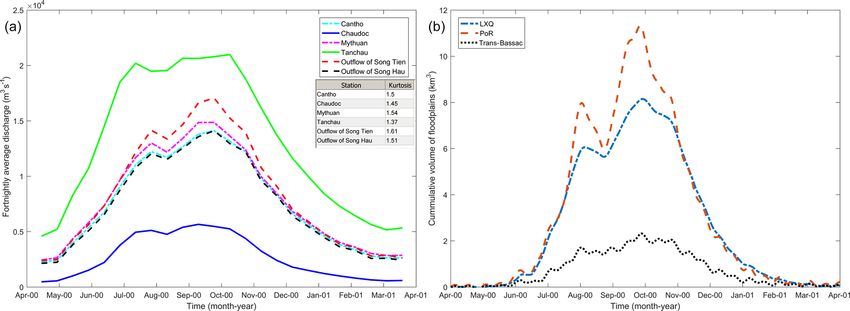
198 V. Q. Thanh et al.: Flooding in the Mekong Delta: the impact of dyke systems on downstream hydrodynamics
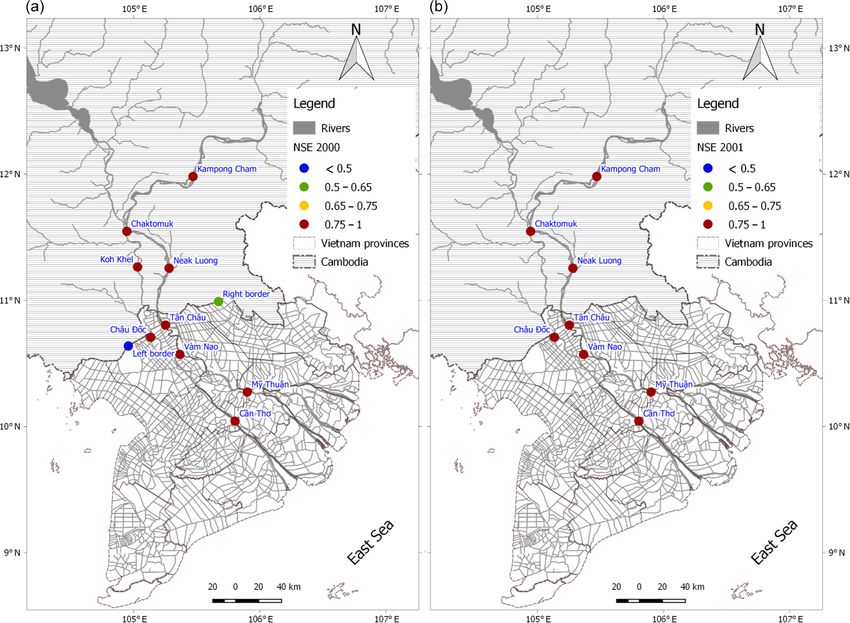
3.1 Model calibration and validation ics in the VMD. Hence, we analysed the water balance in
the three main flood-prone areas: the LXQ, the PoR and the
The overall model performance is generally satisfactory with Trans-Bassac. Among these regions, the PoR harbours the
respect to simulating flood dynamics in the Mekong Delta. largest amount of floodwater; thus, it is a main flood storage
For water level calibration, up to 36 stations are used for cal- for the VMD. Water primarily flows into the PoR across the
ibration and the majority of these stations have NSE values eastern part of the CV border in the delta area. In fact, this
higher than the satisfactory level of 0.5. The model perfor- pathway conveyed approximately 61 km3 in 2000. The simu-
mance shows its stability in validation, as the NSE values are lated results show a volume deficit of 29 km3 from the west-
higher than 0.7. Generally, the model slightly overestimates ern and southern boundary of the PoR, which is drained to
water levels. Large biases were found in the CMD, with the the Tien River. The southern PoR drains a volume of around
largest bias of around 1 m at Kratie. The absolute values of 38 km3 to the Soai Rap estuarine branch via the Vamco River.
the biases decrease to less than 0.2 m at the stations in the Analysing the water balance of the LXQ shows that it re-
VMD. Particularly, the biases at the middle and coastal VMD ceives water from the northern and eastern sides, while it
stations are smaller than 0.1 m (Appendix A). drains water to the western and southern sides. The yearly
The annual flood flows through the VMD via the Mekong inflow to the LXQ is about 44 km3 , with volumes of 31 and
mainstreams and over floodplains; therefore, discharge data 13 km3 from the northern and eastern boundaries respec-
from stations in these areas are employed for calibration. tively. It is found that a similar amount of water drains out of
A total of 11 stations on the mainstreams and across the the LXQ. The LXQ mainly releases water from the western
CV border are used for calibration. Simulated and measured boundary (32 km3 ) into the West Sea, followed by the south-
discharges at these stations show good agreement, and this ern boundary (13 km3 ). The drained water (11 km3 ) from the
is indicated by high NSE values. As a result, the Manning southern LXQ mostly enters the Trans-Bassac floodplains.
roughness coefficient values of the Mekong River reaches An additional source to the Trans-Bassac region is the Hau
and its floodplains after calibration and validation are illus- River, with an annual volume of 6 km3 . The sum of the in-
trated in Table 1. The range of roughness coefficients found flows is drained via the southern canals in this region.
is relatively similar to previous modelling efforts (Dang et The principal dynamical characteristic of the Mekong
al., 2018a; Manh et al., 2014; Tran et al., 2018; Triet et al., Delta floods is their seasonal variation. Figures 7 and 8 illus-
2017; Van et al., 2012). trate the seasonal variation of the water volume and the per-
centage volume (compared with the yearly and seasonal en-
3.2 Spatial distribution and temporal variation of tering volumes at Kratie) respectively. Obviously, the flows
water volume in the VMD in the high-flow season are significantly higher than those
in the low-flow season. The flood flows contribute up to be-
3.2.1 Spatial distribution tween 53 % and 65 % of the annual flows throughout the
mainstreams and the percentages increase to over 80 % on
Water enters the VMD in three ways: the Tien River, the the floodplains. The Mekong River that flowed into the VMD
Hau River and flows across the CV border. Figure 7 presents in 2000 was about 97 % of the total flow at Kratie. However,
the spatial distribution of the water volume in the VMD. the water volume entering the VMD was higher than the en-
The VMD received around 580 km3 in 2000, with volumes try volume at Kratie in the low-flow season.
of 405, 83, 61 and 31 km3 via the Tien River, Hau River, and In the low-flow season, there are slight discrepancies in
the right and left CV border respectively. The Tien River di- the water volumes in the segments of the Mekong River,
verts a considerable amount (152 km3 ) of water to the Hau e.g. from Tan Chau to My Thuan. A part of the discrepant
River via the Vam Nao canal. This is the major mechanism proportion is stored in the river segment. As evidence, the
that balances the flows seaward between the Tien River and water level at Tan Chau at the beginning of the low-flow sea-
Hau River. In fact, the streamflows are relatively equal be- son is about 2 m, and it then increases to 3.5 m at the begin-
tween the Tien River and Hau River, with volumes of 247 ning of the high-flow season.
(at My Thuan) and 235 km3 (at Can Tho) respectively. The
Tien River is drained by its five estuary branches, whereas the 3.2.2 Temporal variation
Hau River only has two branches. The Hau River flows into
the East Sea discharging 162 and 69 km3 via the Dinh An Figure 9 presents the simulated fortnightly average dis-
and Tran De branches respectively. The Tien River’s estuary charges at in- and outflows of the Mekong branches as well
branches, namely the Cung Hau, Co Chien, Ham Luong, Dai as cumulative water storage in the main VMD floodplains
and Tieu, drain a similar volume to the East Sea, with a range from April 2000 to April 2001. The yearly average inflows
of between 54 and 63 km3 , except for the Tieu branch which of the Mekong branches at Tan Chau and Chau Doc are
discharges only 34 km3 . approximately 13 000 and 2700 m3 s−1 respectively. Play-
In addition to the mainstreams of the Mekong River, flood- ing a great role in water diversion between the two Mekong
plains have a substantial role in changing the hydrodynam- branches, the Vam Nao canal causes water discharges from
Hydrol. Earth Syst. Sci., 24, 189–212, 2020 www.hydrol-earth-syst-sci.net/24/189/2020/V. Q. Thanh et al.: Flooding in the Mekong Delta: the impact of dyke systems on downstream hydrodynamics 199
Figure 7. The spatial distribution of the water volume (km3 ) throughout the VMD in 2000. The low-flow season is calculated from 1 January
to 30 June and the high-flow season runs from 1 July to 30 October.
Table 1. Calibrated values of the Manning roughness coefficient.
River reaches/floodplains Manning River reaches/floodplains Manning
roughness roughness
coefficient coefficient
Kratie to Phnom Penh 0.031 The Tonle Sap Lake and Tonle Sap River 0.032
Cambodian floodplains 0.036 Phnom Penh to Vam Nao (Hau River) 0.033
Phnom Penh to Tan Chau 0.031 Vam Nao to Can Tho (Hau River) 0.027
Tan Chau to My Thuan 0.029 Can Tho to Hau River mouths 0.021
VMD floodplains 0.018 VMD channels 0.027
My Thuan to Tien River mouths 0.023 Continental shelf 0.016
Table 2. Increases in the annual mean water levels (in cm) over the year 2000 at the selected stations along the Tien River and the Hau River
under different high-dyke development scenarios.
Station/ Hau River Tien River
scenario Chau Doc Long Xuyen Can Tho Din Aan Tan Chau Cao Lanh My Thuan Ben Trai
(cm)a (cm)a (cm)a (cm)b (cm) (cm)b (cm)a (cm)a
Dyke 2011 10.2 1.5 0.2 0.0 6.1 3.4 0.6 0.0
Dyke LXQ 12.3 3.2 1.0 0.0 3.6 2.6 1.1 0.0
Dyke PoR 6.1 3.6 1.2 0.0 8.8 0.6 −0.8 0.0
Dyke Trans-Bassac 1.1 1.9 0.7 0.0 0.8 0.7 0.3 0.0
Dyke VMD 22.3 9.2 3.0 0.0 16.9 6.6 1.4 0.0
a The differences fall within the model error variations. b No measured data are available.
the Tien River and Hau River to be more balanced seaward ning of July to the end of October and the remaining period
of the canal (Fig. 7). Consequently, the water discharges is defined as the low-flow season. The largest seasonal dif-
at My Thuan (Tien River) and Can Tho (Hau River) sta- ference is at Tan Chau, with maximum and minimum dis-
tions become similar, with annual average amounts of about charges of about 21 000 and 4500 m3 s−1 in the high-flow
7900 and 7500 m3 s−1 respectively. The above-mentioned and low-flow seasons respectively. The flood flow at Chau
water at Can Tho station is simultaneously drained through Doc reaches a peak of 5600 m3 s−1 , while the lowest flow is
the Hau River mouths. The total outflow from the Tien River only 500 m3 s−1 in the low-flow season. However, the high
is slightly greater than at My Thuan due to added flows from and low flows on the Hau River at Can Tho increase to over
the southern PoR, discharging around 8400 m3 s−1 . 14 100 and 2200 m3 s−1 respectively. A similar fluctuation is
The water discharges from the Tien River and Hau River found at the Hau River’s mouths. On the Tien River, the flood
are highly variable over time. As shown for the results of discharge at My Thuan is only 14 800 m3 s−1 and increases
discharge variations, the high-flow season is from the begin-
www.hydrol-earth-syst-sci.net/24/189/2020/ Hydrol. Earth Syst. Sci., 24, 189–212, 2020200 V. Q. Thanh et al.: Flooding in the Mekong Delta: the impact of dyke systems on downstream hydrodynamics
Figure 8. Percentages (compared with the total water volume at Kratie) of water distribution throughout the VMD in 2000.
Figure 9. Fortnightly average discharges at stations along the Mekong branches (a) and cumulative water volumes of the major floodplains
in the VMD (b).
slightly to 17 000 m3 s−1 at the Tien River mouths, but the these floodplains are filled, the flood flows at Can Tho and
low flows are similar (2400 m3 s−1 ) at these stations. My Thuan reach their maxima during the year.
The hydrographs in the upstream area of the VMD are
flatter than those of the downstream region. The hydrograph 3.3 Water level changes under high-dyke development
shapes are indicated by their kurtosis and are illustrated in
Fig. 9. The kurtosis index is a measure of the peakedness of Figure 10 shows that including high dykes increases the daily
the distribution. Downstream, the hydrographs are narrower mean water levels for the Hau River (Chau Doc, Long Xuyen
at Can Tho, My Thuan and the outflows of the Tien River and Can Tho) and the Tien River (Tan Chau, Cao Lanh and
and Hau River, with kurtosis values higher than 1.5. One of My Thuan), especially in the high-flow season. The highest
the noticeable points is that flows at the Can Tho and My increase was found at Chau Doc and Tan Chau stations while
Thuan stations are relatively lower at the beginning of the increases decline more seaward.
high-flow season than at the end, while the flood flows are
stable throughout the high-flow season at Tan Chau and Chau 3.3.1 Daily water levels
Doc stations. This clearly shows how the early flood peak is
stored in the major floodplains of the VMD. Figure 9 de- On the Hau River the floodplains protected by dykes in the
picts the cumulative volumes in the major floodplains. At the LXQ, PoR and Trans-Bassac cause increases of 12.3, 6.1 and
beginning of the high-flow season, these floodplains are al- 1.1 cm in the annual mean water levels at Chau Doc station
most empty. By early October, storage increases to 11, 8 and respectively. However, Table 2 shows that the effect of the
2 km3 in the PoR, LXQ and Trans-Bassac respectively. When PoR dykes on the water levels at Long Xuyen and Can Tho is
larger than that of the LXQ dykes. With the high dykes built
until 2011, the yearly averaged water levels would increase
Hydrol. Earth Syst. Sci., 24, 189–212, 2020 www.hydrol-earth-syst-sci.net/24/189/2020/V. Q. Thanh et al.: Flooding in the Mekong Delta: the impact of dyke systems on downstream hydrodynamics 201
Figure 10. Daily mean water level (WL) variations at selected stations along the Hau River (a, b, c) and Tien River (d, e, f) under different
high-dyke development scenarios.
by 10.2 cm (Chau Doc), 1.5 cm (Long Xuyen) and 0.2 cm variations (Table 2). The differences in water levels among
(Can Tho). If the high dykes were extended over the VMD the scenarios may be influenced by the model set-up.
(Scenario 6), the yearly mean water levels would increase to
22.3 cm at Chau Doc station. 3.3.2 Tidal amplitudes
Generally, water levels on the Tien River are less affected
by high dykes. Among the floodplains considered, the PoR The hydrodynamics in the Mekong Delta are significantly
has the largest effect on the Tien River’s water levels as they influenced by tides from the East Sea. A tidal harmonic
are directly connected. For example, the yearly mean water analysis is conducted over the year 2000 to explore pos-
level at Tan Chau increases by about 8.8 cm, but only by sible changes in the main tidal constituents. Figure 11 de-
0.6 cm at Cao Lanh station. Interestingly, the PoR slightly picts the projected changes in tidal amplitudes along the Tien
reduces water levels at My Thuan due to a reduction in the River and Hau River from the river mouths to approximately
conveyance capacity of floodwater from the CV border. Al- 195 km landward under a high-dyke development scenario.
though the LXQ is not directly linked to the Tien River, it Tidal amplitudes at the river mouths are unlikely to
causes increases in the water levels of around 3.6 and 1.1 change. However, differences become significant further in-
at Tan Chau and My Thuan respectively. As the high dykes land. At Chau Doc, the LXQ causes the largest increase in
covered 2421 km2 until 2011, the mean water levels are pro- tidal amplitudes compared with the other zones. It slightly
jected to rise by approximately 0.6 cm at My Thuan and up to increases the M2 and K1 tidal amplitude by about 13 % and
6.1 cm at Tan Chau. In addition, the mean water level at Tan 15 % respectively. The Trans-Bassac area has a major role
Chau could increase by 16.9 cm if the VMD’s floodplains in the tidal amplitude change from Long Xuyen to Can Tho.
were fully protected by dykes. Noticeably, the model errors Its dyked floodplains lead to an increase in the tidal ampli-
at these stations were comparable to the variability of water tudes from 8 % to 13 %. Additionally, the M2 and K1 am-
level changes among the scenarios. The differences at the se- plitudes could rise by close to 28 %, 27 % and 12 % at Chau
lected stations, except Tan Chau, fell within the model error Doc, Long Xuyen and Can Tho respectively. In contrast, high
dykes in the PoR result in a marginal reduction in the ampli-
www.hydrol-earth-syst-sci.net/24/189/2020/ Hydrol. Earth Syst. Sci., 24, 189–212, 2020202 V. Q. Thanh et al.: Flooding in the Mekong Delta: the impact of dyke systems on downstream hydrodynamics Figure 11. Tidal amplitudes of the eight main constituents at the selected stations along the Tien River (right) and Hau River (left) from the river mouths to about 195 km landward in the high-dyke development scenarios. Hydrol. Earth Syst. Sci., 24, 189–212, 2020 www.hydrol-earth-syst-sci.net/24/189/2020/
V. Q. Thanh et al.: Flooding in the Mekong Delta: the impact of dyke systems on downstream hydrodynamics                      203

tudes on the Hau River. Similarly, the LXQ and Trans-Bassac        flood contributed about 480 km3 at this location. This is con-
cause slight decreases in tidal variation on the Tien River.       siderably higher than the average volume of 330 km3 . How-
High dykes constructed on the PoR lead to higher tidal am-         ever, the annual flood peak in 2000 is only slightly higher
plitudes on the Tien River, with increases of about 6 %. These     than the mean flood peak of 52 000 m3 s−1 (MRC, 2009a).
increases could reach up to 28 % at Tan Chau, 11 % at Cao          Thus, the 2000 flood is characterised by a broader than usual
Lanh and 4.4 % at My Thuan.                                        hydrograph.
                                                                      Several studies have investigated the distribution of the
                                                                   flood volume in the Mekong Delta (e.g. Manh et al., 2014;
4     Discussion                                                   Nguyen et al., 2008; Renaud and Kuenzer, 2012). Manh et
                                                                   al. (2014) calculated the flood volume distribution for the
4.1    Model performance
                                                                   floods between 2009 and 2011 in the upper VMD and con-
The calibration presented in this study considered a               cluded that the flood distribution changed marginally over
larger number of stations compared with previous studies           the above-mentioned period. However, they did not estimate
(e.g. Thanh et al., 2017; Tran et al., 2018; Triet et al., 2017;   flow distribution through the river mouths. We found a sim-
Van et al., 2012). These stations are mainly located in the        ilar pattern with respect to the flood volume distribution on
VMD (Fig. A1). The majority of stations on the branches of         the mainstreams, but our model estimated a larger discharge
the main Mekong River have a NSE higher than 0.8 (good).           across the VC border to the VMD. A possible explanation
In contrast, the stations located further away from the main       for this is that the 2000 flood was considerably larger than
stream have a lower NSE values. The NSE values of the              the floods during the 2009–2011 period. Table 3 shows a
Phuoc Long and Ca Mau stations are lower than the accept-          comparison of the VMD’s outflows from the current study
able level because the water levels at these stations are highly   and from five other models, as summarised by Nguyen et
influenced by local infrastructure, specifically the Quan Lo       al. (2008). There is only a small variation among the models
Phung Hiep (QLPH, see Fig. 1) project. The QLPH has been           used which is attributed to different topographical data and
constructed to protect this area from saline intrusion. Flows      boundary conditions (Nguyen et al., 2008). The flow distri-
entering the QLPH are controlled by a series of sluice gates       bution from the current study falls within the range of vari-
that are mainly located along the coast to prevent saline intru-   ation of the other five models, although it differs regarding
sion into areas of rice cultivation and to control fresh water     some important branches, such as the Tien River and Hau
sources. We did not consider these sluice gates in the model,      River, below Vam Nao.
as they do not have a fixed operation schedule: their oper-           The water distributions slightly vary over the high-flow
ation is based on crop calendars and in situ hydrodynamics         and low-flow seasons. The largest changes are found in the
(Manh et al., 2014). For example, the observed water level at      discharges to the floodplains. For instance, water volumes
Phuoc Long station is relatively unchanged at 0.2 m over the       are highly seasonal at the CV border stations. The water
year 2000, while the model estimates that water levels at this     flows in the low-flow season contribute to 2 %–6 % of the
station have semi-diurnal variations between −0.2 m and 0.6        annual flows at these stations. The relative percentages of the
due to the tidal effects from the East Sea. During validation,     Mekong flow, exiting via the Hau River estuaries in the low-
a better fit was found at My Thuan station, whereas the other      flow season are higher than those in the high-flow season,
stations have comparable NSE values. As such, we are con-          whereas the percentages at the Tien River estuaries are rela-
fident that the model is capable of capturing hydrodynamics        tively constant.
in the Mekong Delta accurately.                                       Several studies have investigated the roles of the Tonle Sap
   The modelling approach in this study overcomes a limi-          Lake in regulating the flood regimes on the Mekong River
tation of previous 1-D models that define their boundaries         (Fujii et al., 2003; Kummu et al., 2014; Manh et al., 2014).
at the river mouths. The boundary conditions (usually water        Kummu et al. (2014) estimated that the Tonle Sap Lake is ca-
levels) at these locations are not always available, as the wa-    pable of reducing about 20 % of the Mekong mainstream dis-
ter level measurement system in the VMD is not installed at        charge and that its greatest storage volume is in August, with
all river mouth locations. Imposing a simple tidal forcing is      an amount of around 15 km3 from the Mekong River flows.
not justifiable because river flow will impact the mean water      The highest monthly released volume occurs in November
level as well as the tidal characteristics in river mouths. Our    and peaks at nearly 20 km3 . Consequently, Tonle Sap Lake
model grid, which considers part of the shelf, allows for a        has a crucial role in regulating the Mekong River flows on
proper description of these dynamics.                              a temporal scale. The VMD floodplains have a different role
                                                                   than the Tonle Sap Lake with respect to changing the Mekong
4.2    Spatiotemporal distribution of water volume in the          mainstream flows. They mainly store early flood waters in
       VMD                                                         August. This leads to reduce flood flows at downstream sta-
                                                                   tions along these floodplains. These stations reach peak dis-
The total net water volume flow through the Mekong Delta           charges when the VMD floodplains are almost fully filled.
at Kratie was approximately 600 km3 in 2000, as the annual         Therefore, the peak flows at the downstream stations occur

www.hydrol-earth-syst-sci.net/24/189/2020/                                        Hydrol. Earth Syst. Sci., 24, 189–212, 2020
204 V. Q. Thanh et al.: Flooding in the Mekong Delta: the impact of dyke systems on downstream hydrodynamics
Table 3. Distribution of water discharge throughout the river mouths (following Nguyen et al., 2008).
Model name The The Co Cung Dinh Tran Ba Ham Tieu Dai Others
Tien Hau Chien Hau An De Lai Luong (%) (%) (%)
River River (%) (%) (%) (%) (%) (%)
below below
Vam Vam
Nao Nao
(%) (%)
NEDECO 1974 51 49 13 15 28 21 0 15 2 6 0
VNHS 1984 55 45 13 18 27 18 0 17 1 6 0
SALO89 1991 44 54 12 8 26 24 2 14 5 2 8
Nguyen Van So 1992 – – 11 12 19 16 1 14 1.5 6 20
VRSAP 1993 50 44 11 5 18 18 0 9 2 8 29
This study 41 39 10 11 27 12 0 9 6 9 14
Note that the percentages in this study are calculated based on the total volume at Kratie.
in October. These results are consistent with the analysis of Tien River has more river mouths and a higher conveyance
Dang et al. (2018b). capacity in comparison with the Hau River.
Recent studies on the impact of high dykes in the VMD
4.3 Impact of high-dyke development (e.g. Tran et al., 2018; Triet et al., 2017) have only compared
the maximum water levels. However, we found that high
The Mekong Delta is presently facing several threats, such dykes also resulted in a reduction in the minimum water lev-
as the impact of hydropower dams, sea level rise, delta els. This means that high dykes have effects on tidal fluctua-
land subsidence and hydraulic infrastructure (Dang et al., tion on the main branches. We analysed the tidal amplitudes
2018a; Kondolf et al., 2018). The impacts of these threats of the eight main constituents over the year 2000 in order to
are highly various in terms of their timescales. Among these, quantify how water levels on the main branches changed. No-
hydraulic infrastructure (especially high dykes) has a con- ticeably, the complete implementation of the high-dyke sys-
siderable influence on the hydrodynamics in the region on tem over the VMD floodplains can cause increases of about
a short timescale. The high dykes in the VMD are built to 12 % and 4 % in the tidal amplitudes at Can Tho and My
protect agricultural land during floods. As a result, flood Thuan stations respectively. Additionally, high dykes in the
discharges on the rivers increase and hydrodynamics in the PoR directly adjacent to Tien River cause a reduction in the
VMD change. Specifically, the results indicate that a lack of tidal amplitude on the Hau River and vice versa. The reason
flood retention in the LXQ leads to an increase in the wa- for this is that river water cannot flow into the floodplains,
ter levels on the Hau River, with a downward trend of in- which leads to an increase in river discharge in the main
creases from Chau Doc to Can Tho. This rising pattern was streams. This increased river discharge causes a significant
also found by Tran et al. (2018), albeit with different magni- M2 amplitude reduction (Guo et al., 2016). The amplitudes
tudes due to the different years. They compared the peak wa- and mean water level at the river mouth stations are unlikely
ter levels, whereas we used daily mean water levels for com- to change under high-dyke development (Table 2). This is
parison. Tran et al. (2018) found that the water level peaks due to the fact that flood retention loss due to floodplain areas
would be drastically higher if high dykes were built. These protected by high dykes causes an insignificant change in the
peaks especially increased in the upper VMD (e.g. by 66 cm water discharge at that location. In contrast, and as an exam-
at Chau Doc and only 4 cm at Can Tho). ple, Kuang et al. (2017) found that if water discharges from
Interestingly, the high dykes in the PoR have slightly the Yangtze River upstream increased by 20 000 m3 s−1 , the
stronger impacts on water levels at Long Xuyen station than water levels at the mouth could rise by approximately 1 cm.
those in the LXQ region. The reason for this is an increase in An explanation for this is that the water discharge change due
the water levels on the Tien River, which causes an increase to high-dyke development is not large enough to increase wa-
in the water diversion from the Tien River to the Hau River. ter levels at the river mouths.
Due to the Vam Nao connecting canal, the PoR floodplains The impacts of high-dyke development on the downstream
influence water level fluctuation not only on the Tien River, hydrodynamics are considered to be different and not as sig-
but also on the Hau River. In addition, the LXQ floodplains nificant as those of hydropower dams, climate change and sea
affect water levels on both the Tien River and Hau River. level rise. Dang et al. (2018a) revealed that hydropower de-
Nevertheless, the increasing water levels on the Tien River velopment increases the monthly water levels at Tan Chau
remain slightly lower than the levels on the Hau River, as the by 0.4 m and at My Thuan by 0.05 m in a wet year. Sea
Hydrol. Earth Syst. Sci., 24, 189–212, 2020 www.hydrol-earth-syst-sci.net/24/189/2020/You can also read


