Contrasted release of insoluble elements (Fe, Al, rare earth elements, Th, Pa) after dust deposition in seawater: a tank experiment approach ...

Page created by Edna Cross
 
CONTINUE READING
Contrasted release of insoluble elements (Fe, Al, rare earth elements, Th, Pa) after dust deposition in seawater: a tank experiment approach ...
Biogeosciences, 18, 2663–2678, 2021
https://doi.org/10.5194/bg-18-2663-2021
© Author(s) 2021. This work is distributed under
the Creative Commons Attribution 4.0 License.

Contrasted release of insoluble elements (Fe, Al, rare earth
elements, Th, Pa) after dust deposition in seawater: a tank
experiment approach
Matthieu Roy-Barman1 , Lorna Foliot1 , Eric Douville1 , Nathalie Leblond2 , Fréderic Gazeau3 , Matthieu Bressac3,4 ,
Thibaut Wagener5 , Céline Ridame6 , Karine Desboeufs7 , and Cécile Guieu3
1 Laboratoire   des Sciences du Climat et de l’Environnement, LSCE/IPSL, CEA-CNRS-UVSQ,
Université Paris-Saclay, Gif-sur-Yvette, France
2 CNRS, Institut de la Mer de Villefranche, IMEV, Sorbonne Université, 06230 Villefranche-sur-Mer, France
3 CNRS, Laboratoire d’Océanographie de Villefranche, LOV, Sorbonne Université, 06230 Villefranche-sur-Mer, France
4 Institute for Marine and Antarctic Studies, University of Tasmania, Hobart, Tasmania, Australia
5 CNRS, IRD, MIO, UM 110, Aix Marseille Univ., Université de Toulon, 13288 Marseille, France
6 LOCEAN, Sorbonne Université, 4 Place Jussieu – 75252 Paris Cedex 05, France
7 LISA, UMR7583, Université de Paris, Université Paris-Est-Créteil, Institut Pierre Simon Laplace (IPSL), Créteil, France

Correspondence: Matthieu Roy-Barman (matthieu.roy-barman@lsce.cnrs-gif.fr)

Received: 28 June 2020 – Discussion started: 21 July 2020
Revised: 4 February 2021 – Accepted: 24 February 2021 – Published: 27 April 2021

Abstract. Lithogenic elements such as aluminum (Al), iron           lease and a higher light REE release under increased green-
(Fe), rare earth elements (REEs), thorium (232 Th and 230 Th,       house conditions.
given as Th) and protactinium (Pa) are often assumed to
be insoluble. In this study, their dissolution from Saharan
dust reaching Mediterranean seawater was studied through
tank experiments over 3 to 4 d under controlled conditions          1   Introduction
including controls without dust addition as well as dust
seeding under present and future climate conditions (+3 ◦ C         The ocean biological productivity is strongly controlled by
and −0.3 pH). Unfiltered surface seawater from three olig-          the availability of trace metals such as iron (Fe), a limiting
otrophic regions (Tyrrhenian Sea, Ionian Sea and Algerian           micronutrient for marine primary producers. Eolian dust de-
Basin) were used. The maximum dissolution was low for all           position over the ocean represents a significant Fe source for
seeding experiments: less than 0.3 % for Fe, 1 % for 232 Th         marine ecosystems (Duce and Tindale, 1991; Jickells et al.,
and Al, about 2 %–5 % for REEs and less than 6 % for Pa.            2005). However, eolian Fe fluxes are difficult to estimate be-
Different behaviors were observed: dissolved Al increased           cause eolian dust fluxes, Fe solubility and dissolved Fe re-
until the end of the experiments, Fe did not dissolve signifi-      moval rates (by biotic and/or abiotic processes) are poorly
cantly, and Th and light REEs were scavenged back on par-           constrained (Baker and Croot, 2010). To disentangle these
ticles after a fast initial release. The constant 230 Th/232 Th     processes, lithogenic tracers such as aluminum (Al), thorium
ratio during the scavenging phase suggests that there is little     (corresponding to 230 Th and 232 Th), protactinium (Pa) and
or no further dissolution after the initial Th release. Quite un-   rare earth elements (REEs) that are not affected by or are
expectedly, comparison of present and future conditions in-         less affected by biological processes are used to determine
dicates that changes in temperature and/or pH influence the         lithogenic dust inputs (Measures and Vink, 2000; Hsieh et
release of Th and REEs in seawater, leading to lower Th re-         al., 2011; Greaves et al., 1999). This is based on the premise
                                                                    that surface water stocks of these lithogenic tracers should
                                                                    be more or less proportional to their release rate by the dis-

Published by Copernicus Publications on behalf of the European Geosciences Union.
Contrasted release of insoluble elements (Fe, Al, rare earth elements, Th, Pa) after dust deposition in seawater: a tank experiment approach ...
2664                                                         M. Roy-Barman et al.: Contrasted release of insoluble elements

solution of eolian dust as long as they are not actively re-       D2 but incubated at a higher temperature (+3 ◦ C) and with
moved by the biological activity, scavenging and sedimen-          lower pH (−0.3 pH). The atmosphere above tanks C1, C2,
tation. Moreover, thorium has one isotope (232 Th) derived         D1 and D2 was flushed with ambient air. Tanks G1 and G2
from lithogenic material, whereas 230 Th is mostly produced        were flushed with air enriched with 1000 ppm CO2 in order
in seawater by radioactive decay of conservative 234 U and         to prevent CO2 degassing. The height of the tank (1.1 m) al-
hence can be used as a chronometer of the input and removal        lowed the settling of the particles to be taken into account
rate of 232 Th in ocean surface waters. A poorly constrained       and the analysis of a series of parameters in suspended and
but key parameter for the application of these tracers is their    sinking matter.
dissolution rate from the lithogenic matrix into seawater (An-        Dust particles were derived from the fine fraction (<
derson et al., 2016).                                              20 µm) of a Saharan soil (Tunisia) processed physically and
   Here, we simulated Saharan dust deposition in surface           chemically (including a treatment simulating the effect of
Mediterranean seawater to determine the release of selected        cloud water and evapo-condensation) to produce an analogue
lithogenic tracers (Fe, Al, REEs, Th, Pa). The main objective      of Saharan dust deposited over the Mediterranean Sea (see
was to determine the solubility of these tracers; their dissolu-   details in Guieu et al., 2010). The size spectrum of the treated
tion kinetics; and the possible influence of temperature, pH       dust has a median diameter around 6.5 µm and a peak at ap-
and biological activity on the dissolution processes. Dust de-     proximately 10 µm similar to the one found in Mediterranean
position was simulated in tanks filled with unfiltered seawa-      aerosols (Guieu et al., 2010). It is a mixture of quartz (40 %),
ter (to retain the impact of biological activity) with an added    calcite (30 %) and different clay minerals (25 %) with 3.3 %
amount of dust corresponding to a strong Saharan dust depo-        Al and 2.3 % Fe by weight (Desboeufs et al., 2014). The de-
sition event over the Mediterranean Sea.                           tailed dust seeding procedure is described in Gazeau et al.
                                                                   (2020a). At station TYR, samples for dissolved Fe and Al
                                                                   were taken at t = 0 (before enrichment) and at t = 1, 24 and
2     Methods                                                      72 h after dust enrichment. No samples for rare earth ele-
                                                                   ments (REEs), Th and Pa were taken at this station. At sta-
2.1    Experimental setup                                          tion ION, all tanks were sampled for Al, Fe, Th and REEs
                                                                   at t = 1, 24 and 72 h after dust addition. At station FAST,
A detailed description of the artificial dust addition exper-      tanks C1 and D1 were sampled for Al, Fe, Th, Pa and REEs
iments is given in Gazeau et al. (2020). Briefly, six ex-          at t = 0, 1, 6, 12, 24, 48, 72 and 96 h after dust addition. At
perimental high-density polyethylene (HDPE) tanks (300 L           this station, tanks C2, D2, G1 and G2 were sampled for Al,
each) with a conical base connected to a sediment trap were        Fe, Th and REEs at t = 1, 48 and 96 h after dust enrichment.
installed in a temperature-controlled container during the            At the end of each experiment, the particulate material that
PEACETIME cruise (https://doi.org/10.17600/17000300).              settled at the bottom of the tanks was recovered from the sed-
The cruise was conducted on board the R/V Pourquoi Pas?            iment traps and preserved by adding formaldehyde (5 % v/v
in the Mediterranean Sea during the late spring, a period          final concentration).
characterized by strong stratification (Guieu et al., 2020a).
Three stations representing different in situ conditions, albeit   2.2     Analytical techniques
all characterized by oligotrophic conditions, were chosen to
conduct the tank experiments: stations TYR in the Tyrrhe-          2.2.1    Dissolved Fe
nian Sea, ION in the Ionian Sea and FAST in the Algerian
                                                                   Dissolved iron (DFe) concentrations were measured by flow
Basin (Fig. S1; Guieu et al., 2020a). Experiments at TYR and
                                                                   injection with online preconcentration and chemilumines-
ION lasted 3 d (72 h), while the last experiment (at station
                                                                   cence detection (Bonnet and Guieu, 2006; Guieu et al.,
FAST) was extended to 4 d (96 h). The experimental tanks
                                                                   2018). An internal acidified seawater standard was mea-
were filled with unfiltered seawater from the continuous sur-
                                                                   sured daily to control the stability of the analysis. The de-
face pumping system upon arrival at stations TYR (17 May
                                                                   tection limit was 15 pM, and the accuracy of the method
2017) and ION (25 May 2017) and 1 d after arrival at sta-
                                                                   was controlled by analyzing the following seawater samples:
tion FAST (2 June 2017). This was done using a large peri-
                                                                   SAFe S (consensus value 0.093 ± 0.008 nmol kg−1 ), SAFe
staltic pump (Verder VF40 with an ethylene propylene diene
                                                                   D1 (consensus value 0.67 ± 0.04 nmol kg−1 ), GD (consen-
monomer (EDPM) rubber hose, flow of 1200 L h−1 ) collect-
                                                                   sus value 1.00 ± 0.10 nmol kg−1 ) and GSC (consensus value
ing water 5 m below the base of the boat. Tanks C1 and C2
                                                                   not available) seawater standards. Average values measured
were unmodified control tanks, and tanks D1 and D2 were
                                                                   during this study were 0.086 ± 0.010 nmol kg−1 (n = 3) for
enriched with dust at the beginning of the experiment (3.6 g
                                                                   SAFe S, 0.64±0.13 nmol kg−1 (n = 19) for SAFe D1, 1.04±
of dust per tank; 10 g m−2 was sprayed over each tank during
                                                                   0.10 nmol kg−1 (n = 10) for GD and 1.37 ± 0.16 nmol kg−1
20 min, typical of the intermittent but strong Saharan dust
                                                                   (n = 4) for GSC.
deposition event over the Mediterranean Sea; see Sect. 4).
Tanks G1 and G2 were enriched with dust as in tanks D1 and

Biogeosciences, 18, 2663–2678, 2021                                                   https://doi.org/10.5194/bg-18-2663-2021
Contrasted release of insoluble elements (Fe, Al, rare earth elements, Th, Pa) after dust deposition in seawater: a tank experiment approach ...
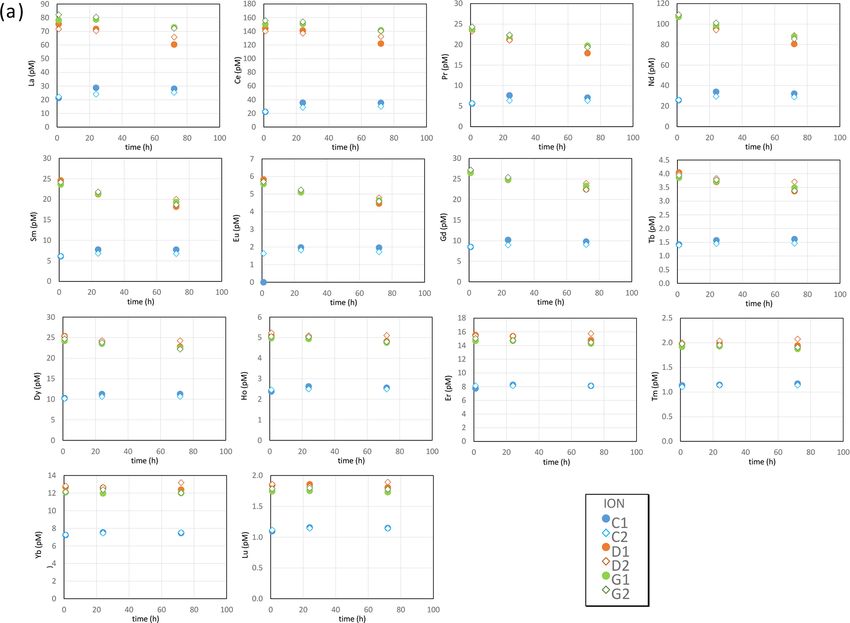
M. Roy-Barman et al.: Contrasted release of insoluble elements                                                            2665

2.2.2   Dissolved Al                                              agreements within a few percent with consensual REE val-
                                                                  ues, except for La and Lu, which were underestimated by
Determinations of dissolved aluminum (DAl) concentrations         25 % and 10 % (Table S1 in the Supplement). Agreement
were conducted on board using the fluorometric method de-         within analytical uncertainties was obtained for 232 Th and
scribed by Hydes and Liss (1976). After filtration, samples       age-corrected 230 Th concentrations. The very large uncer-
were acidified to pH < 2 with double-distilled concentrated       tainties in 232 Th analyses of the GEOTRACES standard were
HCl. After at least 24 h, lumogallion reagent was added to the    due to its low 232 Th content (in particular when compared to
sample, which was then buffered to pH = 5 with ammonium           Mediterranean seawater and the small sample volume used).
acetate. The sample was then heated to 80 ◦ C for 1.5 h to ac-    Values of 231 Pa are not reported for these intercalibration
celerate the complex formation. The fluorescence of the sam-      samples because of the encountered yield and blank prob-
ple was measured with a Jasco FP 2020 + spectrofluorom-           lems (see Sect. 3.5).
eter (excitation wavelength 495 nm, emission wavelength
565 nm). The detection limit varied between 0.2 and 0.5 nM        2.2.4    Trapped particles
and the blank values between 0.9 and 1.7 nM for the differ-
ent days of analysis. Based on the daily analysis of an inter-    Samples were collected following the standard protocol de-
nal reference seawater standard, the overall variability in the   veloped at the national service “Cellule Piege” of the French
method was 0.6 nM (the standard deviation of a mean con-          INSU-CNRS (Institut National des Sciences de l’Univers of
centration of 53.5 nM, n = 25).                                   the Centre National de la Recherche Scientifique) (Guieu
                                                                  et al., 2005). Trapped particles were rinsed three times
2.2.3   Dissolved REEs, Th and Pa                                 with ultrapure (Milli-Q) water in order to remove salt and
                                                                  freeze-dried. Approximately 10 mg of trap-collected sedi-
Seawater was sampled from the tanks and filtered (pore            ment was then weighed and acid-digested with HNO3 –HF
size 0.2 µm; Sartobran®) within 1 to 2 h after sampling and       using Suprapur reagents at 150 ◦ C in PTFE vials. After com-
subsequently acidified with trace-metal-grade HCl (NOR-           plete acid evaporation, samples were diluted in 0.1 M HNO3
MATOM®). Approximately 250 mL of filtered and acidi-              and analyzed for Fe and Al concentrations by induced cou-
fied seawater was spiked with isotopes 150 Nd, 172 Yb, 229 Th     pled plasma atomic emission spectroscopy (ICP-AES) (JY
and 233 Pa for isotope dilution measurements followed by          138 “Ultrace”, Jobin Yvon). A fraction of the remaining so-
KMnO4 and MnCl2 addition. REEs, Th and Pa were pre-               lution was used to analyze REEs, Th and Pa. Before Th and
concentrated by MnO2 co-precipitation obtained after raising      Pa analysis, the solution was spiked with 229 Th and 233 Pa
pH to 8 through addition of concentrated NH3 . The MnO2           and treated through the same chemical process as the Mn
precipitate was recovered by filtration onto a 25 mm cellu-       precipitate used for the dissolved Pa and Th analysis. REEs
lose ester filter, rinsed with Milli-Q water and dissolved in a   were analyzed directly on a quadrupole ICPMS (XseriesII ,
solution composed of 2 mL of 6 N HCl and 10 µL of H2 O2 .         Thermo Scientific) using an internal calibration (Re).
Thereafter, REEs, Th and Pa were separated using an AG1X8
ion exchange column (Gdaniec et al., 2018).
    REE contents were measured at the Laboratoire des Sci-        3     Results
ences du Climat et de l’Environnement (LSCE) by using
a quadrupole induced coupled plasma mass spectrometer             3.1     Dissolved Fe
(ICPMS) (XseriesII , Thermo Scientific©). Nd and Yb con-
centrations were directly determined by isotope dilution.         Over the course of the three experiments, DFe concentra-
Comparison of Nd and Yb concentrations measured by iso-           tions in control tanks were in the range of 0.7–2.5 nM (Ta-
tope dilution with the concentration determined by internal       ble S2 in the Supplement, Fig. 1), in good agreement with
calibration (using In-Re internal standard) provided a yield      DFe measured during the cruise in surface waters between 0
of the chemical procedure for Nd and Yb (between 70 % and         and 15 m depth (TYR: 1.47 ± 0.30; ION: 1.41 ± 0.19; FAST:
100 %). The chemical yields for Nd and Yb were used to es-        1.71 ± 0.35 nM; Bressac et al., 2021) and with surface con-
timate those of the other REEs, by assuming that the yield        centrations observed in the Mediterranean Sea during the
is a linear function of the atomic number (Arraes-Mescoff et      stratification period (Bonnet and Guieu 2006; Gerringa et al.,
al., 2001).                                                       2017; Wagener et al., 2008). For the TYR experiment, there
    Pa and Th analyses were performed using an induc-             was no clear difference between controls (C1 and C2) and
tively coupled plasma mass spectrometer (MCICP-MS;                dust-amended tanks (D1, D2, G1 and G2) that would indicate
Neptuneplus ©) equipped with a secondary electron multiplier      significant Fe release from dust. During the ION experiment,
(SEM) and a retarding potential quadrupole (RPQ) energy           DFe concentrations measured in G1 were much higher than
filter (Gdaniec et al., 2018).                                    in the other tanks, most likely due to a contamination issue.
    Analyses of seawater used during the GEOTRACES in-            DFe concentrations were lower in control tanks than in dust-
tercalibration exercise (van de Flierdt et al., 2012) showed      amended tanks during the FAST experiment. However, here

https://doi.org/10.5194/bg-18-2663-2021                                                  Biogeosciences, 18, 2663–2678, 2021
Contrasted release of insoluble elements (Fe, Al, rare earth elements, Th, Pa) after dust deposition in seawater: a tank experiment approach ...
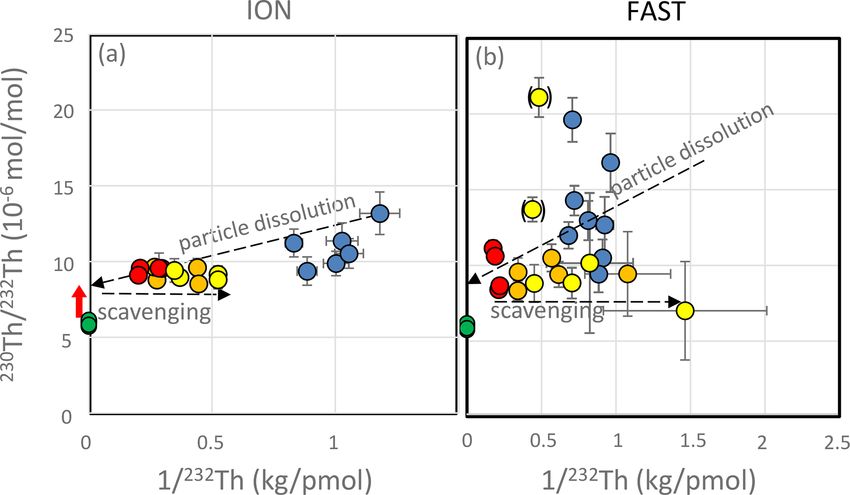
2666                                                          M. Roy-Barman et al.: Contrasted release of insoluble elements

too, high variability between duplicates suggests possible Fe       (e.g., Yb, for which the concentration remained relatively
contamination during sampling or sample processing.                 constant after t = +1 h).

                                                                    3.4   Dissolved thorium isotopes
3.2    Dissolved Al
                                                                    Concentrations of 232 Th in control tanks remained around
Al concentrations in control tanks varied between stations          1 pM during the incubations at both FAST and ION (Ta-
(47±3 nM at TYR, 77±5 nM at ION and 25±2 nM at FAST;                ble S3, Fig. 3), in agreement with surface water concen-
Table S2, Fig. 1), with little variability between tanks at indi-   trations in the Mediterranean Sea (Gdaniec et al., 2018). A
vidual stations. These values are within the range of concen-       higher 232 Th concentration (10.9 ± 0.1 pM) was measured in
trations observed in Mediterranean surface waters (Rolison          tank C1 at the FAST station 12 h after the start of the ex-
et al., 2015). After dust addition, Al concentrations increased     periments (10.9 pM). Since the consecutive measurement for
linearly with time in treatments D and G at all stations, reach-    this tank was in the expected range (1.5 pM), this extreme
ing final concentrations 50 to 100 nM higher than in control        value likely resulted from a sample contamination rather than
tanks. No systematic differences between D and G treatments         a contamination of the tank itself. As observed for the REEs,
were observed. The increase in Al at FAST (72–80 nM) was            there was a sharp increase in 232 Th concentrations after dust
larger than at TYR and ION (52–68 nM) due to the longer             addition at both ION and FAST. Concentrations after 12 and
duration of the FAST experiment.                                    24 h of incubation at station FAST were higher in tank D1.
                                                                    However, as described above for tank C1 at station FAST
3.3    Dissolved rare earth elements                                and for the sampling time t = +12 h, we consider that these
                                                                    high values can be attributed to sample contamination during
The REE concentrations measured in control tanks at sta-            sampling. Therefore, we do not consider these two samples
tions ION and FAST (Table S3 in the Supplement, Fig. 2)             further in the discussion (Fig. 3).
compared well with values reported in the Mediterranean                After the rapid 232 Th increase in the D and G treatments at
Sea (Censi et al., 2004; Tachikawa et al., 2004). In control        FAST and ION, a rapid and significant decrease in the 232 Th
tanks at both ION and FAST, a slight increase in REE con-           concentrations was observed. In contrast to REEs, 232 Th con-
centrations during the course of the experiments indicated          centrations were higher in the D tanks than in the G tanks.
some contamination from the tank or the environment of                 The variations in 230 Th concentrations with time and be-
the experiment. The potential contamination remained low            tween treatments were more or less similar to 232 Th. How-
(i.e., from 15 % to 40 % of the initial value for dissolved         ever, significant variations in the 230 Th/232 Th ratio were ob-
Nd, from 5 % to 10 % of the initial value for dissolved Yb)         served (Table S3, Fig. 3, Fig. S3 in the Supplement). The
compared to changes in concentrations observed in the dust-         highest ratios (≥ 10×10−6 mol mol−1 ) were measured in the
amended tanks. For both D and G, there was a sharp increase         control tanks.
in the concentrations of all REEs (i.e., around +400 % for
                                                                    3.5   Dissolved protactinium
dissolved Nd and +100 % for dissolved Yb), followed by
a slow decline in light REEs (LREEs; such as Nd; Fig. 2),           Due to analytical problems (low yield and large blanks),
while heavy REE concentrations (HREEs; e.g., Yb; Fig. 2)            largely because of the small sample volumes available and
remained constant. The rapid increase in REE concentrations         the low Pa content in the Mediterranean surface water, re-
can be observed by comparing the REE concentrations at              liable Pa concentrations could only be obtained at FAST in
t = 0 (before dust seeding) and t = 1 h during the D1 ex-           tanks C1 and D1. The mean 231 Pa concentrations at FAST
periment at FAST. For the other experiments (including the          were not different within uncertainties in the C1 (2.5 ±
ION tanks), the comparison of the D or G concentrations at          0.2 aM, with 1 aM = 10−18 M) and D1 (2.4 ± 0.2 aM) treat-
t = 1 h after dust seeding with the concentrations recorded in      ments (Table S3 in the Supplement, Fig. 4). Despite the small
the C series (no seeding) also highlights a sharp increase in       volumes of seawater analyzed, these concentrations agree
the REE concentrations. The only exception in these trends          within uncertainties with the Pa concentrations available for
was observed at FAST for tank D2, where no increase in REE          western Mediterranean Sea surface waters (Gdaniec et al.,
concentrations was observed after dust addition (t = +1 h).         2018). Due to the relatively large uncertainties in the indi-
As this most likely resulted from a technical issue during          vidual data, no systematic temporal trend could be detected.
sampling (perhaps bottle labeling), we consider this value to
be an outlier. In general, at any given time and site, REE con-
centrations were somewhat higher in the warmer and acidi-
fied tanks (G) as compared to ambient environmental con-
ditions (D). The subsequent decrease in concentrations was
steeper for LREEs (e.g., Nd, for which the concentration
decrease was visible as early as t = +6 h) than for HREEs

Biogeosciences, 18, 2663–2678, 2021                                                    https://doi.org/10.5194/bg-18-2663-2021
Contrasted release of insoluble elements (Fe, Al, rare earth elements, Th, Pa) after dust deposition in seawater: a tank experiment approach ...
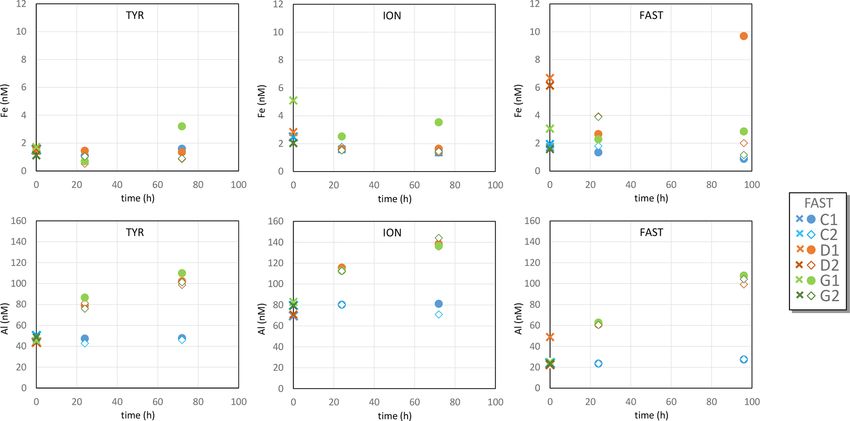
M. Roy-Barman et al.: Contrasted release of insoluble elements                                                                      2667

Figure 1. Concentrations of total dissolved Fe and Al during the dust addition experiments. Crosses correspond to samples collected before
dust addition (t = 0).

3.6   Trapped material                                                 4     Discussion

The material collected in the traps contained 2.59 %±0.03 %
(weight percent; 1 standard deviation, n = 12) Fe and 4.8 ±            The concentration changes observed during the experiments
0.1 % (1 standard deviation, n = 12) Al (Table S4 in the               resulted from a net balance between the release of chemical
Supplement). These concentrations are significantly higher             elements by the dissolution of the added dust and removal of
than the initial dust composition (2.26 ± 0.03 % of Fe and             these elements by particle scavenging and sedimentation or
3.32 ± 0.03 % of Al) due to preferential dissolution of highly         active (biological) uptake. For Fe, the scavenging efficiency
soluble calcium carbonate or possibly calcium hydrogen                 largely depends on Fe solubility driven by Fe-binding ligands
carbonate formed during the simulation of dust processing              (Witter et al., 2000). As the dust concentration in tanks was
in clouds (see Sect. 2.1; Desboeufs et al., 2014). The Ca              high, Fe re-adsorption on dust particles could have been an
(14.0 % ± 0.02 %) content was lower in the trapped mate-               important scavenging process (Wagener et al., 2010). Dust
rial compared to the initial dust (16.54 % ± 0.16 %) due to            inputs over the Mediterranean Sea are very irregular (Loÿe-
calcium carbonate dissolution, indicating a dissolution of             Pilot and Martin, 1996). The dust quantity used for the seed-
18 % of the carbonates initially present or 6.4 % of the dust          ing (10 g of total dust m−2 with an Al content of 4 %) corre-
mass. REE concentrations in the sediment trap (Table S5                sponds to half of the highest dust pulse observed during one
and Fig. S2 in the Supplement) were close to concentrations            rain event in the Mediterranean (e.g., Ternon et al., 2010) and
for the average upper continental crust (Taylor and McLen-             represents 30 %–100 % of the annual dust deposition over the
nan, 1995). Particulate 232 Th concentrations corresponded to          Mediterranean Sea (Guieu et al., 2010). Hence, the PEACE-
70 ± 5 % of the upper continental crust concentration. The             TIME experiments also document the yearly release of insol-
230 Th concentrations corresponded roughly to secular equi-            uble elements in the Mediterranean surface waters.
librium for a U/Th ratio of 0.363 ± 0.008 g g−1 , within the
range observed in average continental crust. The 231 Pa con-
centrations corresponded to secular equilibrium for a U/Th             4.1    Solubility of tracers
ratio of 0.330±0.045 g g−1 , also within the range of the con-
tinental crust and Saharan aerosols (Pham et al., 2005).
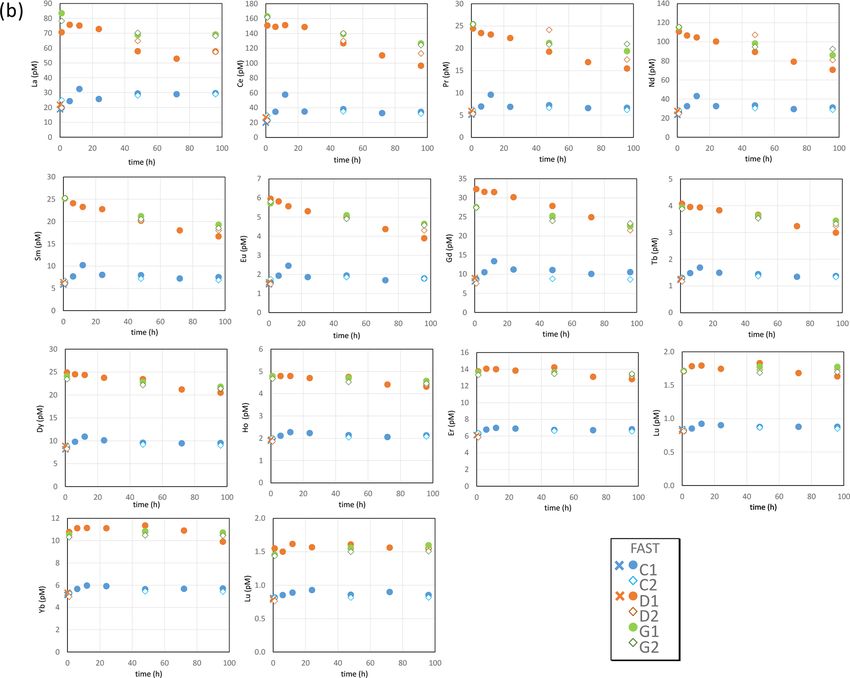
                                                                       The soluble fraction (%) of the different elements was cal-
                                                                       culated as the maximum release of the considered element
                                                                       during the experiments divided by the amount of particulate
                                                                       element per volume of seawater introduced in the tanks by

https://doi.org/10.5194/bg-18-2663-2021                                                         Biogeosciences, 18, 2663–2678, 2021
Contrasted release of insoluble elements (Fe, Al, rare earth elements, Th, Pa) after dust deposition in seawater: a tank experiment approach ...
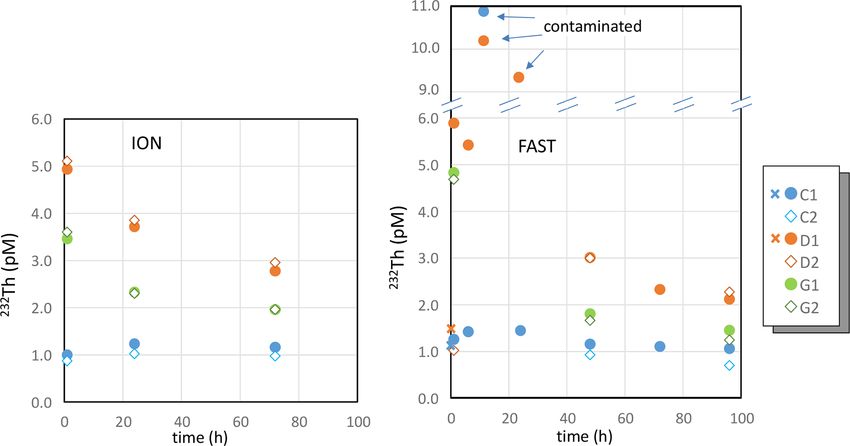
2668                                                      M. Roy-Barman et al.: Contrasted release of insoluble elements

Figure 2.

dust addition (Table 1) following the equation:                   – REE, Th and Pa concentrations in the added dust were
                                                                    identical to the sedimented material;
                 CONCmax − CONCinit
fdissol_conc =                      × 100,                (1)     – for REEs, Th and Pa, the contribution of plankton and
                  CONCdust × m/V
                                                                    other biogenic material produced during the experiment
                                                                    to the sedimented material was negligible due to the
where fdissol_conc is the soluble fraction of the element,          high dust load recovered in the trap;
CONCinit is the dissolved concentration before dust input
(estimated with the concentration in the C tanks measured at      – carbonate dissolution (see Sect. 3.6) had a negligible ef-
t = 1 h and averaged over tank replicates 1 and 2), CONCmax         fect on the particulate concentration of REEs, Th and
is the maximum concentration measured during the experi-            Pa.
ment (concentration in the D or G tanks measured at t = 1 h
and averaged over tank replicates 1 and 2), CONCdust is the     We estimated fdissol_conc considering the total mass of dust
concentration in the original dust (expressed in mol of in-     added to the tank rather than the dust remaining in suspen-
soluble element g−1 of dust), m represents the mass of dust     sion at the end of the experiment in order to relate the amount
added to the tank (3.6 g), and V represents the volume of       of element released in seawater to the total flux of dust de-
seawater in the tank (300 L). Direct analysis of the original   posited at the sea surface. At the end of the experiments, the
dust was used for total Fe and Al (Guieu et al., 2010). REEs,   dust loss by sedimentation in the traps ranged from 33 % to
Th and Pa were not analyzed in the initial dust material. For   80 % of the total mass of dust added to each tank (m), likely
these elements, we used the average concentrations of parti-    depending on the intensity of aggregation in each tank (as
cles collected in the traps assuming that                       previously observed by Bressac et al., 2012). However, these

Biogeosciences, 18, 2663–2678, 2021                                               https://doi.org/10.5194/bg-18-2663-2021
Contrasted release of insoluble elements (Fe, Al, rare earth elements, Th, Pa) after dust deposition in seawater: a tank experiment approach ...
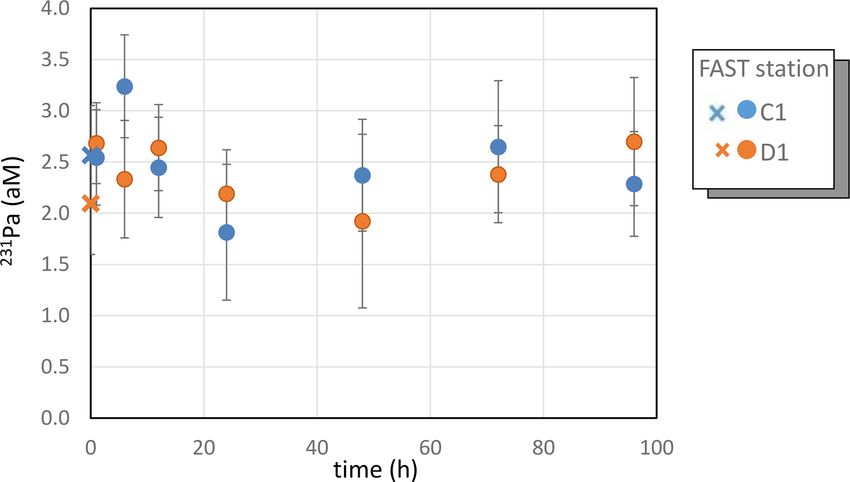
M. Roy-Barman et al.: Contrasted release of insoluble elements                                                                 2669

Figure 2. Concentrations of dissolved REEs during the tank experiments at (a) ION station and (b) FAST station. Crosses correspond to
samples collected before dust addition (t = 0).

differences did not seem to impact the estimation of the sol-        D1 at t = 72 h. Given that 30 µM of particulate Fe (CONCdust
uble fraction significantly. For example, at the ION station,        for Fe) was added to each tank, Fe dissolution would be at
while a large difference was observed between the amount             most 0.3 %. This result is in good agreement with the soluble
of Al collected in the sediment traps of D1 and D2 (when             fraction of Fe obtained using the same dust and tanks filled
seeding, 74 % and 33 % of the Al introduced were recovered           with filtered abiotic coastal northwestern Mediterranean sea-
in the traps, respectively, so that only 25 % and 67 % of the        water in May (Bressac and Guieu, 2013; Louis et al., 2018).
initial particulate remained in suspension at the end of the ex-        No significant differences in 231 Pa concentrations between
periment), the soluble fractions were identical in D1 and D2         C1 and D1 at FAST were observed. Based on trap analy-
for all the studied elements (Figs. 1–3, Table 1). This reflects     ses (Table S5), we estimate that 0.04 fM of 231 Pa was added
the fast dissolution for these elements.                             to the tanks. Given the analytical uncertainties in dissolved
   During the experiments, the DFe concentrations were               231 Pa analysis (Fig. 4), CONC
                                                                                                     max −CONCinit is certainly be-
probably affected by contaminations. Nevertheless, we can            low 0.002 fM. Hence, the soluble fraction of 231 Pa is below
assess the upper limit to Fe dissolution by assuming that the        5 %. As expected for these poorly soluble elements, the max-
highest DFe concentrations measured during the experiments           imum soluble fractions were low for all stations: less than
truly represented Fe dust release. The highest DFe (10 nM)           0.3 % for Fe, 1 % for 232 Th and Al (although their dissolution
was measured at the FAST station in the dust-amended tank

https://doi.org/10.5194/bg-18-2663-2021                                                     Biogeosciences, 18, 2663–2678, 2021
2670                                                                M. Roy-Barman et al.: Contrasted release of insoluble elements

Figure 3. Dissolved 232 Th during the ION and FAST experiments. Note the break in the y axis so as to include values of the three outliers
(contaminated samples). Crosses correspond to samples collected before dust addition (t = 0).

                                                                          1998; Wagener et al., 2008). For Al (as well as for Fe), there
                                                                          was no sample analyzed for t = 1 h (just after dust addition),
                                                                          so it was not possible to detect a putative early dissolution as
                                                                          observed for REEs and Th (see below).
                                                                             In contrast to Al, both Th and REEs were released
                                                                          rapidly after dust addition, similarly to phosphate and ni-
                                                                          trate (Gazeau et al., 2020). Fortuitously or not, it appears
                                                                          that more Th and dissolved inorganic phosphorus (DIP) were
                                                                          released at FAST than at ION. Among the differences be-
                                                                          tween ION and FAST, we note a higher biomass (chloro-
                                                                          phyll a at the end of the experiments: 0.48±0.08 µg kg−1 for
                                                                          FAST and 0.26 ± 0.08 µg kg−1 for ION) and a lower alkalin-
Figure 4. Dissolved Pa during the FAST experiments. Error bars
                                                                          ity (2452 ± 5 µmol kg−1 for FAST and 2626 ± 4 µmol kg−1
correspond to the analytical uncertainties (2σn , where σn is the error   for ION; Gazeau et al., 2020) for FAST compared to ION;
                                                                          232 Th was mostly released in the very beginning of the incu-
of the mean). Crosses correspond to samples collected before dust
addition (t = 0).                                                         bations. At both FAST and ION, Th dissolution was higher
                                                                          in the D tanks than in the G tanks (Fig. 2). In contrast, high-
                                                                          est biomass was found in the G tanks (Gazeau et al., 2020).
                                                                          The higher incubation temperature for the G tanks resulted in
kinetics do not have the same patterns), and about 2 %–5 %                higher concentrations of transparent exopolymeric particles
for REEs.                                                                 (TEPs; Gazeau et al., 2021). The high affinity of Th for TEPs
   Al dissolution was slightly higher at FAST compared to                 (Santschi et al., 2006) could have led to the lower Th concen-
ION and TYR but identical in the D and G treatments. The                  trations in these tanks. At present, however, it is not possible
contrasting behaviors of Al that progressively dissolved dur-             to determine with certainty what caused the low percentage
ing the experiments and Fe that did not dissolve significantly            of Th release in the G tanks as compared to the D tanks.
may be due to their respective solubility. The Al concentra-                 The soluble fractions of REEs were similar at FAST and
tions (22–144 nM) during the experiments were much lower                  ION. However, slightly lower LREE dissolution fractions oc-
than the dissolved Al concentration in seawater at equilib-               curred under ambient environmental conditions (D; 1.6 % for
rium with Al hydroxides, which is at the micromolar level                 La) than under future conditions (G; 1.9 % for La). The sol-
(Savenko and Savenko, 2011). By contrast, dissolved Fe con-               uble fraction of REEs increased almost linearly between ele-
centrations during the experiments were close to or above the             ments from La (1.7±0.2 %) to Dy (4.6±0.2 %) and then de-
theoretical solubility of Fe hydroxides in seawater (Millero,

Biogeosciences, 18, 2663–2678, 2021                                                          https://doi.org/10.5194/bg-18-2663-2021
M. Roy-Barman et al.: Contrasted release of insoluble elements                                                                                                                                                                                                       2671

                                                                                     Pa

                                                                                                                                               < 6%
                                                                                                                                         (0.64–0.73)
                                                                                                                                            (1.0–1.2)
                                                                                                                                                (0–8)
                                                                                                                                                (1–7)
                                                                                  Thisot ∗ (range)

                                                                                                                                         0.7
                                                                                                                                         1.1
                                                                                                                                         0.1
                                                                                                                                         2.4
                                                                                                                                         0.17
                                                                                                                                         0.05
                                                                                                                                         0.03
                                                                                                                                         0.11

                                                                                                                                                                                         4
                                                                                                                                                                                         2
                                                                                                                                                                                         2
                                                                                                                                                                                         1
                                                                                                                                                                                         4
                                                                                     Thconc

                                                                                                                                         1.02
                                                                                                                                         0.66
                                                                                                                                         1.19
                                                                                                                                         0.91

                                                                                                                                                                                         43
                                                                                                                                                                                         45
                                                                                                                                                                                         64
                                                                                                                                                                                         60
                                                                                                                                                                                         72
                                                                                     Error

                                                                                                                                         0.3
                                                                                                                                         0.3
                                                                                                                                         0.4
                                                                                                                                         0.1

                                                                                                                                                                                          3.8
                                                                                                                                                                                          3.5
                                                                                                                                                                                         10.2
                                                                                                                                                                                         10.8
                                                                                                                                                                                          5.3
                                                                                     Lu

                                                                                                                                         3.5
                                                                                                                                         3.2
                                                                                                                                         3.5
                                                                                                                                         3.1

                                                                                                                                                                                          0.1
                                                                                                                                                                                          0.7
                                                                                                                                                                                          3.0
                                                                                                                                                                                          3.6
                                                                                                                                                                                         −7.3
                                                                                     Error

                                                                                                                                         0.3
                                                                                                                                         0.1
                                                                                                                                         0.4
                                                                                                                                         0.2

                                                                                                                                                                                         5.2
                                                                                                                                                                                         0.3
                                                                                                                                                                                         8.6
                                                                                                                                                                                         8.5
                                                                                                                                                                                         3.5
                                                                                     Yb

                                                                                                                                         3.5
                                                                                                                                         3.2
                                                                                                                                         3.5
                                                                                                                                         3.5

                                                                                                                                                                                         −0.3
                                                                                                                                                                                          0.9
                                                                                                                                                                                          4.2
                                                                                                                                                                                         12.8
                                                                                                                                                                                         −1.5
                                                                                     Error

                                                                                                                                         0.4
                                                                                                                                         0.4
                                                                                                                                         0.6
                                                                                                                                         0.1

                                                                                                                                                                                          5.6
                                                                                                                                                                                          3.3
                                                                                                                                                                                          9.7
                                                                                                                                                                                         10.5
                                                                                                                                                                                          3.5
                                                                                     Tm

                                                                                                                                         3.7
                                                                                                                                         3.7
                                                                                                                                         3.8
                                                                                                                                         3.8

                                                                                                                                                                                         −1.2
                                                                                                                                                                                          2.9
                                                                                                                                                                                          1.6
                                                                                                                                                                                          4.6
                                                                                                                                                                                         −1.4
                                                                                     Error

                                                                                                                                         0.3
                                                                                                                                         0.4
                                                                                                                                         0.6
                                                                                                                                         0.3

                                                                                                                                                                                         4.8
                                                                                                                                                                                         2.3
                                                                                                                                                                                         9.0
                                                                                                                                                                                         9.8
                                                                                                                                                                                         2.1
                                                                                     Er

                                                                                                                                         4.3
                                                                                                                                         4.2
                                                                                                                                         4.5
                                                                                                                                         4.5

                                                                                                                                                                                         1.4
                                                                                                                                                                                         3.2
                                                                                                                                                                                         4.7
                                                                                                                                                                                         6.8
                                                                                                                                                                                         0.5
                                                                                     Error

                                                                                                                                         0.5
                                                                                                                                         0.3
                                                                                                                                         0.5
                                                                                                                                         0.3

                                                                                                                                                                                         5.7
                                                                                                                                                                                         1.7
                                                                                                                                                                                         9.1
                                                                                                                                                                                         9.6
                                                                                                                                                                                         3.4
                                                                                     Ho

                                                                                                                                         4.7
                                                                                                                                         4.6
                                                                                                                                         4.8
                                                                                                                                         5.0

                                                                                                                                                                                         4.0
                                                                                                                                                                                         4.6
                                                                                                                                                                                         7.8
                                                                                                                                                                                         9.8
                                                                                                                                                                                         4.5
                                                                                     Error

                                                                                                                                         0.3
                                                                                                                                         0.2
                                                                                                                                         0.5
                                                                                                                                         0.2

                                                                                                                                                                                         4.3
                                                                                                                                                                                         2.0
                                                                                                                                                                                         8.0
                                                                                                                                                                                         8.4
                                                                                                                                                                                         2.9
                                                                                     Dy

                                                                                                                                         4.5
                                                                                                                                         4.3
                                                                                                                                         4.7
                                                                                                                                         4.7

                                                                                                                                                                                          7.3
                                                                                                                                                                                          8.7
                                                                                                                                                                                         14.9
                                                                                                                                                                                         17.7
                                                                                                                                                                                          9.1
                                                                                     Error

                                                                                                                                         0.2
                                                                                                                                         0.2
                                                                                                                                         0.5
                                                                                                                                         0.2

                                                                                                                                                                                         6.8
                                                                                                                                                                                         3.4
                                                                                                                                                                                         7.3
                                                                                                                                                                                         7.3
                                                                                                                                                                                         2.9
                                                                                     Tb

                                                                                                                                         4.2
                                                                                                                                         4.1
                                                                                                                                         4.5
                                                                                                                                         4.3

                                                                                                                                                                                         12.0
                                                                                                                                                                                         11.9
                                                                                                                                                                                         20.6
                                                                                                                                                                                         26.5
                                                                                                                                                                                         13.5
                                                                                     Error

                                                                                                                                         0.2
                                                                                                                                         0.2
                                                                                                                                         0.6
                                                                                                                                         0.2

                                                                                                                                                                                         4.7
                                                                                                                                                                                         4.0
                                                                                                                                                                                         7.4
                                                                                                                                                                                         7.1
                                                                                                                                                                                         2.2

                                                                                                                                                                                                       Figure 5. (a) Average maximum dissolution (fdissol_conc , given in
                                                                                                                                                                                                       percent) and (b) scavenging fractions (fscav , given in percent) for
                                                                                     Gd

                                                                                                                                         3.7
                                                                                                                                         3.8
                                                                                                                                         4.8
                                                                                                                                         3.9

                                                                                                                                                                                         13.9
                                                                                                                                                                                         14.8
                                                                                                                                                                                         22.8
                                                                                                                                                                                         29.3
                                                                                                                                                                                         16.6

                                                                                                                                                                                                       REEs. For comparison purposes, scavenging was calculated with
                                                                                     Error

                                                                                                                                         0.2
                                                                                                                                         0.1
                                                                                                                                         0.5
                                                                                                                                         0.2

                                                                                                                                                                                         5.1
                                                                                                                                                                                         1.9
                                                                                                                                                                                         8.1
                                                                                                                                                                                         8.0
                                                                                                                                                                                         1.7

                                                                                                                                                                                                       data at t = 72 h for both ION and FAST.
                                                                                     Eu

                                                                                                                                         3.8
                                                                                                                                         3.7
                                                                                                                                         4.0
                                                                                                                                         3.7

                                                                                                                                                                                         19.9
                                                                                                                                                                                         18.2
                                                                                                                                                                                         26.6
                                                                                                                                                                                         34.7
                                                                                                                                                                                         20.0
                                                                                     Error

                                                                                                                                         0.3
                                                                                                                                         0.2
                                                                                                                                         0.4
                                                                                                                                         0.2

                                                                                                                                                                                         6.2
                                                                                                                                                                                         3.3
                                                                                                                                                                                         6.7
                                                                                                                                                                                         7.1
                                                                                                                                                                                         2.3

                                                                                                                                                                                                       creased for heavier elements (3.3 ± 0.2 % for Lu; Fig. 5a). It
                                                                                     Sm

                                                                                                                                         3.4
                                                                                                                                         3.4
                                                                                                                                         3.5
                                                                                                                                         3.5

                                                                                                                                                                                         21.7
                                                                                                                                                                                         20.4
                                                                                                                                                                                         28.6
                                                                                                                                                                                         33.9
                                                                                                                                                                                         25.1

                                                                                                                                                                                                       closely follows the solubility pattern obtained from Saharan
                                                                                     Error

                                                                                                                                         0.2
                                                                                                                                         0.2
                                                                                                                                         0.3
                                                                                                                                         0.3

                                                                                                                                                                                         6.2
                                                                                                                                                                                         2.7
                                                                                                                                                                                         5.8
                                                                                                                                                                                         4.7
                                                                                                                                                                                         4.3

                                                                                                                                                                                                       aerosols leached with filtered seawater (Greaves et al., 1994).
             Table 1. Maximum fractional dissolution and scavenging in percent.

                                                                                                                                                                                                       In this study, the pattern of the soluble fraction of REEs was
                                                                                     Nd

                                                                                                                                         3.0
                                                                                                                                         3.1
                                                                                                                                         3.1
                                                                                                                                         3.3

                                                                                                                                                                                         21.4
                                                                                                                                                                                         19.7
                                                                                                                                                                                         28.5
                                                                                                                                                                                         36.2
                                                                                                                                                                                         22.6

                                                                                                                                                                                                       associated with Fe oxyhydroxides and exceeded the soluble
                                                                                     Error

                                                                                                                                         0.2
                                                                                                                                         0.2
                                                                                                                                         0.3
                                                                                                                                         0.3

                                                                                                                                                                                         6.0
                                                                                                                                                                                         2.7
                                                                                                                                                                                         5.9
                                                                                                                                                                                         5.0
                                                                                                                                                                                         4.5

                                                                                                                                                                                                       fraction of Fe, possibly due to the high REE content of Fe
                                                                                                                                                                                                       oxyhydroxides (Haley et al., 2004).
                                                                                     Pr

                                                                                                                                         2.4
                                                                                                                                         2.5
                                                                                                                                         2.5
                                                                                                                                         2.6

                                                                                                                                                                                         20.5
                                                                                                                                                                                         18.8
                                                                                                                                                                                         30.9
                                                                                                                                                                                         36.7
                                                                                                                                                                                         20.6

                                                                                                                                                                                                          An unexpected result of the PEACETIME experiments is
                                                                                     Error

                                                                                                                                         0.2
                                                                                                                                         0.1
                                                                                                                                         0.2
                                                                                                                                         0.3

                                                                                                                                                                                         6.9
                                                                                                                                                                                         2.7
                                                                                                                                                                                         6.2
                                                                                                                                                                                         4.8
                                                                                                                                                                                         1.4

                                                                                                                                                                                                       the contrasting dissolution kinetics of Al relative to Th and
                                                                                     Ce

                                                                                                                                         1.9
                                                                                                                                         2.1
                                                                                                                                         1.9
                                                                                                                                         2.1

                                                                                                                                                                                         10.6
                                                                                                                                                                                          7.9
                                                                                                                                                                                         26.7
                                                                                                                                                                                         35.9
                                                                                                                                                                                         22.7

                                                                                                                                                                                                       REEs. Specific REE- and Th-rich phases may partly account
                                                                                     Error

                                                                                                                                         0.2
                                                                                                                                         0.2
                                                                                                                                         0.1
                                                                                                                                         0.3

                                                                                                                                                                                         8.3
                                                                                                                                                                                         3.9
                                                                                                                                                                                         6.1
                                                                                                                                                                                         5.9
                                                                                                                                                                                         4.6

                                                                                                                                                                                                       for the decoupling with Al (Marchandise et al., 2014). Alter-
                                                                                                                                                                                                       natively, the fast dissolution of calcium carbonate or calcium
                                                                                     La

                                                                                                                                         1.6
                                                                                                                                         1.9
                                                                                                                                         1.6
                                                                                                                                         1.8

                                                                                                                                                                                         14.2
                                                                                                                                                                                          9.5
                                                                                                                                                                                         25.2
                                                                                                                                                                                         18.3
                                                                                                                                                                                         15.1

                                                                                                                                                                                                       hydrogen carbonate formed during dust processing to simu-
                                                                                     Error

                                                                                                                                       0.05
                                                                                                                                       0.27
                                                                                                                                       0.04
                                                                                                                                       0.09
                                                                                                                                       0.08
                                                                                                                                       0.03

                                                                                                                                                                                                       late clouds might account for the REE and Th release (see
                                                                                     Al

                                                                                                                                       0.56
                                                                                                                                       0.82
                                                                                                                                       0.91
                                                                                                                                       0.96
                                                                                                                                       1.09
                                                                                                                                       1.13

                                                                                                                                                                                                       Sects. 3.6 and 4.3).
                                                                                                                                                                                                          The soluble fraction of Mediterranean aerosols was also
                                                                                     Error

                                                                                                                                       0.01
                                                                                                                                       0.02
                                                                                                                                       0.01
                                                                                                                                       0.03
                                                                                                                                       0.04
                                                                                                                                       0.01

                                                                                                                                                                                                       evaluated by leaching aerosols collected during the PEACE-
                                                                                     Fe

                                                                                                                                       0.01
                                                                                                                                       0.02
                                                                                                                                       0.01
                                                                                                                                       0.03
                                                                                                                                       0.10
                                                                                                                                       0.04

                                                                                                                                                                                                       TIME cruise in ultrapure water for 30 min (van Wambeke
                                                                                                                                                        Scavenging fraction in percent
                                                                                                     Dissolution fraction in percent

                                                                                                                                                                                                       et al., 2020). The median soluble fraction of Nd was 6 %,
                                                                                                                                                                                                       close to the soluble fraction of Nd in our tank experiments
                                                                                                                                                                                                       (3 %). These low values are also consistent with former es-
                                                                                                                                                                                         FAST_D 72 h
                                                                                                                                                                                         FAST_D 96 h
                                                                                                                                                                                         FAST_G 96 h
                                                                                                                                                                                         ION_D 72 h
                                                                                                                                                                                         ION_G 72 h

                                                                                                                                                                                                       timates based on Saharan aerosol leaching in distilled water
                                                                                                                                       FAST_D
                                                                                                                                       FAST_G
                                                                                                                                       TYR_D
                                                                                                                                       TYR_G
                                                                                                                                       ION_D
                                                                                                                                       ION_G

                                                                                                                                                                                                       (1 %–3 %; Greaves et al., 1994). In contrast, aerosol leaching

https://doi.org/10.5194/bg-18-2663-2021                                                                                                                                                                                         Biogeosciences, 18, 2663–2678, 2021
2672                                                         M. Roy-Barman et al.: Contrasted release of insoluble elements

in ultrapure water during PEACETIME by Fu et al. (2021)            prominent and decreased from LREEs (fscav = 15 %–37 %)
suggested much larger Al and Fe solubilities (around 20 %)         to HREEs (fscav = 1 %–13 %; Fig. 5b). The reduced scav-
than those observed during our dust addition experiments.          enging of HREEs is consistent with the stronger complexa-
These differences reflect mainly the anthropogenic compo-          tion of HREEs by carbonate ions in seawater (Tachikawa et
nent in the aerosol samples collected during the cruise, result-   al., 1999) observed during equilibrium experiments with syn-
ing from mixing of Saharan dusts and polluted air masses (Fu       thetic minerals in seawater (Koeppenkastrop and Eric, 1992).
et al., 2021). Anthropogenic metals are significantly more         The net effect of REE release from particles with a relatively
soluble than metals issued from desert dust (Desboeufs et          flat shale-normalized REE pattern (with a slight mid-rare
al., 2005). However, the Al and Fe solubility values obtained      earth element (MREE) enrichment) combined with preferen-
in our dust addition experiments are in agreement with the         tial scavenging of LREE results in a shale-normalized REE
values found in ultrapure water for the same amended dust          pattern with a weaker depletion of LREEs and a flat pattern
(Aghnatios et al., 2014), for other Saharan dust analogs (Des-     from MREEs to HREEs (Fig. S2).
boeufs et al., 2001; Paris et al., 2011) or for dust collected        The scavenged fraction of both Th and LREEs was higher
over the Sahara (Paris et al., 2010). We conclude that the sol-    at FAST than at ION. At all stations, scavenged fractions
ubility of particulate Al and Fe obtained in our experiments       were similar in the D and G treatments. Considering that
is representative of pure Saharan dust inputs.                     3.6 g of dust was introduced in 300 L of seawater, with 17 %
                                                                   to 51 % loss through sedimentation to the bottom trap (Bres-
4.2    Removal of dissolved tracers                                sac et al., 2011), the average dust concentration remaining
                                                                   in suspension in the tank ranged from 5900 to 9960 µg L−1 .
During the experiments, biological uptake or scavenging            This is several orders of magnitude higher than typical partic-
onto particulate matter may have biased the soluble-fraction       ulate matter concentrations in seawater (1–100 µg L−1 ; Lal,
estimates for the less soluble elements. Fe and Al are well        1977) not impacted by recent dust deposition events. At these
known for being taken up by plankton as a micronutrient            high particulate matter concentrations, it is likely that scav-
(e.g., Twining et al., 2015) and Al by substitution to Si          enging of insoluble elements by the remaining suspended
in diatom frustules (Gehlen et al., 2002). With the chloro-        dust occurred. Adsorption experiments of a radioactive Ce
phyll a (chl a) increase observed during the course of             tracer on deep-sea clays showed a decrease of 30 % in dis-
the experiments (at most 0.5 µg L−1 ), a C/chl a ratio of          solved Ce over a few days (Li et al., 1984), comparable in
50 mg C (mg chl a)−1 and an Fe/C ratio ranging from 10 to          magnitude to the results presented here. The experiments
100 µmol mol−1 (Twining et al., 2015), we estimate that bi-        with deep-sea clays were carried out in abiotic conditions,
ological activity should have taken up at most 0.25 nM of          raising the possibility that adsorption observed during our
Fe, an order of magnitude less than the dissolved Fe mea-          tank experiments was, at least in part, due to adsorption on
sured during the course of the experiments. Therefore, any         the suspended dust. However, since the same dust was used
significant Fe dissolution would not have been masked by           during ION and FAST, it is likely that the higher scavenging
biological uptake. Using the biogenic silica flux measured in      rate at FAST compared to ION was due to the higher bio-
the sediment traps (10–41 mg m−2 d−1 ) and an Al/Si ratio          logical activity at FAST (Gazeau et al., 2020). Th has a high
in diatom frustules of 0.008 (maximum value in Gehlen et           affinity for TEPs (Santschi et al., 2006). However, there was
al., 2002), diatoms could have incorporated as much as 6–          not a marked difference in TEP content at ION compared to
18 nM Al. This represents a small but significant fraction of      FAST (Gazeau et al., 2021). The very high adsorption rates
the Al released by the dust.                                       occurred possibly because all the dust was deposited instan-
   As REEs and Th are not known to be taken up by plankton,        taneously at the beginning of the experiment. Deposition of
their decreasing concentrations during the course of the ex-       the same amount of dust over longer periods (weeks, months)
periments suggest that they may be removed by scavenging           as in less dusty periods and environments would certainly re-
onto particles. We define the scavenging fraction as follows:      sult in less re-adsorption (but likely similar dissolution).
          CONCmax − CONCmin
fscav =                     × 100,                          (2)    4.3   Thorium isotopes
              CONCmax
where fscav is the scavenging fraction of the element,             The 230 Th/232 Th ratio of surface Mediterranean seawater
CONCmax is the dissolved concentration measured at the be-         (230 Th/232 Th ≈ 15 × 10−6 ; Gdaniec et al., 2018) is higher
ginning of the incubation (t = 1 h) averaged over tanks 1 and      than the 230 Th/232 Th ratio in the dust (230 Th/232 Th ≈ 3–
2 of the D or G experiments, and CONCmin is the dissolved          6 × 10⁻⁶ ; Pham et al., 2005; Roy-Barman et al., 2009).
concentration measured at the end of the incubation (t = 72 h      Hence, dust Th release in the tanks leads to a decrease
or t = 96 h) averaged over tanks 1 and 2, except for FAST          in the 230 Th/232 Th ratio of seawater. Conversely, scav-
D (t = 72 h; measured in tank 1 only). Th appeared to be           enging of dissolved Th does not lead to changes in the
the element most sensitive to scavenging (fscav = 43 %–44 %        230 Th/232 Th ratios since both isotopes behave similarly.

at ION and 65 %–70 % at FAST). REE scavenging was less             Hence the 230 Th/232 Th ratios of the seawater allow an esti-

Biogeosciences, 18, 2663–2678, 2021                                                  https://doi.org/10.5194/bg-18-2663-2021
M. Roy-Barman et al.: Contrasted release of insoluble elements                                                                 2673

mation of the Th released from dust even when re-adsorption         Knowing flitho , we can determine fdissol_isot , the dissolution
occurs. Further, since the Th content in the dust greatly ex-       fraction based on the isotopic data:
ceeds the content in seawater, the 230 Th/232 Th ratio in dust                                        
                                                                                             flitho
remains virtually constant even if seawater-derived Th ad-                       CONCinit 1−f    litho
sorbs on the particles.                                             fdiss_isot =                         ,                       (4)
                                                                                  CONCdust m/V
   On a diagram of the 230 Th/232 Th ratio as a function of
   232
1/ Th (Fig. 6), the theoretical evolution of the filtered sea-      where CONCinit is the 232 Th concentration in seawater be-
water samples with time should be as follows: (1) for simple        fore dust addition; fdissol_isot is independent of concentra-
dissolution, filtered seawater samples lie on a straight line       tions that may be biased by re-adsorption. We evaluate
between 6×10⁻⁶ (ratio measured in dust) and 15×10−6 (ra-            fdissol_isot based on average ratios for original seawater (con-
tio in seawater); (2) if re-adsorption occurs, the filtered sea-    trol tanks) and the average ratio of the last samples of the D
water samples will be shifted horizontally toward the right         and G treatments, respectively, to estimate dissolution over
(Arraes-Mescoff et al., 2001). For the ION experiments, all         the course of the whole experiment (Table S3 in the Supple-
C samples (controls with no dust addition) and D and G sam-         ment). For the particulate ratio, we tentatively used a ratio of
ples at t = 1 h (just after dust addition) plot on an oblique       8.5×10⁻⁶ mol mol−1 (value best defined by the y-axis value
line, suggesting that the initial increase in seawater Th con-      for 1/232 Th = 0 of the dissolution and scavenging trends at
centration results from the simple dissolution of marine par-       ION; Fig. 5).
ticles. On this diagram, the intercept at 1/232 Th = 0 repre-          The resulting average fdissol_isot is below 3 % for FAST
sents the 230 Th/232 Th of the dissolving particles. This ratio     and ION treatments D and G, confirming the low solubility
of about (8.5 ± 0.8) × 10−6 mol mol−1 is significantly higher       of Th (Table 1). While we recognize that for FAST, the large
than the ratio measured on the particles ((6.0±0.15)×10−6 )         data scatter results in large uncertainties in the interpretation
collected in the traps or in the Saharan dust (Pham et al.,         of the results, all the results obtained during PEACETIME
2005; Roy-Barman et al., 2009). It indicates a preferential         indicate a low Th solubility.
release of 230 Th due to the combined effect of the recoil
of two alpha decays from 238 U to 230 Th and the variable           4.4   Implication for dust deposition estimation
U/Th ratio observed among the phases carrying U and Th
in the dust (Bourne et al., 2012; Bosia et al., 2018; Marchan-      The 230 Th/232 Th ratio in the surface ocean has been pro-
dise et al., 2014). Travertine and pedogenic carbonates from        posed as a tracer to for dust inputs and the release of trace
the Western Sahara ranges have 232 Th concentrations rang-          metals at the ocean surface (Hsieh et al., 2011). Neglect-
ing from 0.5 to 12 ppm (Szabo et al., 1995; Candy et al.,           ing lateral transport, 232 Th is delivered by dust dissolution,
2004; Weisrock et al., 2008). Assuming 2 ppm for 232 Th in          whereas 230 Th derives mostly from the in situ decay of 234 U
carbonates and considering that carbonate dissolution repre-        and can be further used to track 232 Th dissolution. Know-
sents 6.4 % of the dust mass (see Sect. 3.6), an increase of        ing the solubility of 232 Th would allow the estimation of the
6.6 pM (1986 pmol in the 300 L tanks) can be estimated, in          dust flux required to account for the 230 Th/232 Th ratio in sur-
gross agreement with observations (Fig. 3). While pedogenic         face waters. Until now, 232 Th solubility from dust was poorly
calcretes contain sufficient amounts of 232 Th and REEs to          constrained. Using dust fluxes from a global dust deposition
account for the changes in Th and REE concentrations ob-            model and adjusting the fraction of lithogenic 232 Th disso-
served during the PEACETIME experiments (Prudencio et               lution to match the 230 Th/232 Th ratio in the surface water
al., 2011), the 230 Th/232 Th ratio of these carbonates is gen-     of the Atlantic Ocean, Hsieh et al. (2011) estimated that the
erally low (230 Th/232 Th = 2–5 × 10⁻⁶ ; Candy et al., 2004)        fraction of lithogenic 232 Th dissolution ranges between 1 %
so that it cannot account for the higher 230 Th/232 Th ratio        and 5 % in high-dust-flux areas such as the eastern equatorial
((8.5 ± 0.8) × 10−6 mol mol−1 ) found in these experiments          Atlantic and up to 10 %–16 % in areas of low dust deposition
(Fig. 6).                                                           such as the South Atlantic (Hsieh et al., 2011). Estimates of
   Samples from the D and G treatments (t = 1 to 72 h) plot         the soluble fraction of 232 Th at the Bermuda Atlantic Time-
on a horizontal line (with little change in the 230 Th/232 Th       series Study (BATS) ranged from 14 % to 28 % and increased
ratio), confirming that simple reabsorption occurs after the        with the depth range (Hayes et al., 2017). The solubility of
initial dissolution (with little or no release of particulate Th    232 Th in atmospheric dust from particle leaching experiments

after the initial dissolution observed at t = 1 h).                 in deionized water or dilute acetic acid provided a wide range
   A simple mass balance gives the fraction of dissolved            of values (Anderson et al., 2016).
232 Th in seawater from the dissolution of particulate Th              The present work indicates a low 232 Th fractional solubil-
(Roy-Barman et al., 2002):                                          ity (around 1 %) for the dusts used in the tank experiments.
           230                     230                          It is low but qualitatively consistent with the low solubility
                Th                       Th                         (3 %–5 %) of lithogenic Th derived from a budget of Th iso-
            232 Th               − 232 Th
                     D or G tank 230  C tank .
flitho =       230                                          (3)   topes in the western Mediterranean Sea, where Th inputs are
                    Th
                232 Th       − 232 ThTh                             dominated by ocean margins (Roy-Barman et al., 2002). Our
                    dust           C tank

https://doi.org/10.5194/bg-18-2663-2021                                                    Biogeosciences, 18, 2663–2678, 2021
2674                                                             M. Roy-Barman et al.: Contrasted release of insoluble elements

Figure 6. Mixing diagram of 230 Th/232 Th versus 1/232 Th for the ION (a) and FAST (b) experiments. Blue dots: t = 0 h (no dust addition
yet); red dots: t = 1–6 h; orange dots: t = 24–48 h; yellow dots: t = 72–96 h. Yellow dots between brackets fall above the scavenging line for
unknown reasons. Green dots: particles in the sediment traps. Red arrow: preferential release of 230 Th.

results are also in qualitative accordance with low overall              5    Conclusions
fractional solubility of Th (from 4 % to 8 %) from Saharan
aerosols leached with an ammonium acetate solution at pH
4.7 (Baker et al., 2020). Keeping in mind the limitation of our          The PEACETIME tank experiments quantified the
study (limited time duration, very high particle concentration           particulate-dissolved exchanges of Al, Fe, REEs, Pa
promoting re-adsorption), these results suggest that the high            and Th following Saharan dust addition to surface seawater
Th solubility derived by balancing dust inputs with the scav-            from three basins of the Mediterranean Sea under present
enging on settling particles could be biased by advective in-            and future climate conditions. We highlight differences
puts at large spatial and temporal scales (Hayes et al., 2017).          in the amount and kinetics of dissolution as well as scav-
Hence, estimating dust inputs from the 230 Th/232 Th ratio of            enging among the different lithogenic tracers and report
surface waters (Hsieh et al., 2011) requires the consideration           first estimates for 232 Th and 231 Pa. Under the experimental
of areas where the water residence time exceeds the Th resi-             conditions, Fe dissolution was much lower than the dis-
dence time relative to scavenging. This is the case of part of           solution of Th, REEs or Al. As a consequence, assuming
the South Pacific gyre, where the horizontal dissolved-232 Th            similar soluble fractions for lithogenic tracers to evaluate
gradient tends to vanish (Pavia et al., 2020).                           Fe fluxes is probably generally not appropriate. Using
   One aim of providing 230 Th–232 Th-based estimates of the             relative solubility might be also biased by the different
dust deposition is to determine Fe fluxes at the ocean surface.          dissolution and scavenging kinetics characterizing each
To circumvent the difficulty in determining the trace metal              tracer. Quite unexpectedly, comparison of present and future
solubility from dusts, the relative fractional solubility ratio          conditions indicates that changes in temperature (+3 ◦ C)
of Fe to Th (Fe percent dissolution to Th percent dissolution            and/or pH (−0.3 pH) influence the release of 232 Th and
from the dust) is used as a more robust parameter. It is often           REEs in seawater, leading to a lower Th release and a higher
assumed that Fe and Th are released congruently from dust,               light REE release under increased greenhouse conditions.
yielding an Fe/Th ratio on the order of 20 000 mol mol−1                 Using Th isotopes, we show that Th was released within
(Hayes et al., 2017, Pavia et al., 2020). Aerosol leaching ex-           the first hour of the experiment and that no subsequent Th
periments suggest a preferential release of Th compared to               release occurs during the following days. This observation,
Fe, with an Fe/Th ratio around 10 000 mol mol−1 (Baker et                associated with the low Th soluble fraction (1 %) from dust,
al., 2020). Keeping in mind potential bias due to the signif-            puts constraints on the use of Th isotopes as a tracer of dust
icantly different dissolution kinetics, a salient result of the          inputs in surface waters and highlights the importance of
PEACETIME tank experiments is the much lower dissolu-                    advection as a source of 232 Th in the open ocean.
tion extent of Fe relative to Th, yielding an upper limit of                The implications of these experiments are not limited to
200–1500 mol mol−1 (Table S5).                                           constraining eolian inputs to the surface ocean. They also
                                                                         contribute to a better understanding of the strong contrast
                                                                         in vertical profiles and zonal distribution of insoluble ele-

Biogeosciences, 18, 2663–2678, 2021                                                           https://doi.org/10.5194/bg-18-2663-2021
M. Roy-Barman et al.: Contrasted release of insoluble elements                                                                            2675

ments in the Mediterranean Sea. In this region, dissolved Al              PEACETIME is also a contribution to the SOLAS and IMBER pro-
increases from the surface to deep waters and also laterally at           grams. We thank the captain and the crew of the RV Pourquoi Pas?
depth from the western basin to the eastern basin (Rolison et             for their professionalism and their work at sea. Frank Pavia, an
al., 2015). Dissolved Fe and 232 Th profiles often present sur-           anonymous reviewer and co-editor-in-chief Christine Klaas greatly
face concentration maxima but no systematic concentration                 improved this paper with their constructive comments.
gradient between the deep western and eastern basins (Ger-
ringa et al., 2017; Gdaniec et al., 2018). While the fractions
                                                                          Financial support. Matthieu Bressac received a grant from the Eu-
of Al and Th dissolved from dust during the tank experiments
                                                                          ropean Union Seventh Framework Program (grant no. PIOF-GA-
were comparable, dissolution kinetics were different: 232 Th              2012-626734). The publication of this article was financed by the
was largely removed through scavenging after the initial re-              CNRS-INSU.
lease, whereas Al increased continuously in the tanks. This
highlights the highly particle-reactive character of 232 Th as
compared to Al. Hence 232 Th cannot accumulate along the                  Review statement. This paper was edited by Christine Klaas and
Mediterranean deep circulation and does not exhibit a zonal               reviewed by Frank Pavia and one anonymous referee.
gradient as Al.

Data availability. Underlying research data are being used by re-
                                                                          References
searcher participants of the “Peacetime” campaign to prepare other
manuscripts, and therefore data are not publicly accessible at the
                                                                          Anderson, R. F., Fleisher, M. Q., Robinson, L., Edwards, R. L.,
time of publication. Data will be accessible (http://www.obs-vlfr.fr/
                                                                            Hoff, J. A., Moran, S. B., Rutgers van der Loeff, M. M., Thomas,
proof/php/PEACETIME/peacetime.php, Guieu et al., 2020b) once
                                                                            A. L., Roy-Barman, M., and Francois, R.: GEOTRACES inter-
the special issue is completed (all papers should be published by
                                                                            calibration of 230 Th, 232 Th, 231 Pa, and prospects for 10 Be, Lim-
fall 2020).
                                                                            nol. Oceanogr.-Meth., 10, 179–213, 2012.
                                                                          Anderson, R. F., Cheng, H., Edwards, R. L., Fleisher, M. Q., Hayes,
                                                                            C. T., Huang, K. F., Kadko, D., Lam, P. J., Landing, W. M., Lao,
Supplement. The supplement related to this article is available on-         Y., Lu, Y., Measures, C. I., Morton, P. L., Moran, S. B., Robinson,
line at: https://doi.org/10.5194/bg-18-2663-2021-supplement.                L. F., and Shelley, R. U.: How well can we quantify dust deposi-
                                                                            tion to the ocean?, Philos. T. R. Soc. A, 374, 2015028520150285,
                                                                            https://doi.org/10.1098/rsta.2015.0285, 2016.
Author contributions. CG and KD conceived the PEACETIME                   Aghnatios, C., Losno, R., and Dulac, F.: A fine fraction of soil used
program. CG and FG conceived and led the tank experiments on                as an aerosol analogue during the DUNE experiment: sequential
board. MB analyzed dissolved Fe. TW analyzed dissolved Al. NL               solubility in water, decreasing pH step-by-step, Biogeosciences,
analyzed trapped material. MRB, LF and ED analyzed Th, Pa and               11, 4627–4633, https://doi.org/10.5194/bg-11-4627-2014, 2014.
REEs. MRB prepared the manuscript with contributions from all             Arraes-Mescoff, R., Roy-Barman, M., Coppola, L., Souhaut, M.,
co-authors.                                                                 Tachikawa, K., Jeandel, C., Sempéré, R., and Yoro, C.: The be-
                                                                            havior of Al, Mn, Ba, Sr, REE and Th isotopes during in vitro
                                                                            degradation of large marine particles, Mar. Chem., 73, 1–19,
Competing interests. The authors declare that they have no conflict         2001.
of interest.                                                              Azetsu-Scott, K. and Niven, S. E.: The role of transparent exopoly-
                                                                            mer particles (TEP) in the transport of 234 Th in coastal water
                                                                            during a spring bloom, Cont. Shelf Res., 25, 1133–1141, 2005.
Special issue statement. This article is part of the special issue “At-   Baker, A. R. and Croot, P. L.: Atmospheric and marine controls on
mospheric deposition in the low-nutrient–low-chlorophyll (LNLC)             aerosol iron solubility in seawater, Mar. Chem., 120, 4–13, 2010.
ocean: effects on marine life today and in the future (ACP/BG inter-      Baker, A. R., Li, M., and Chance, R.: Trace metal fractional solu-
journal SI)”. It is not associated with a conference.                       bility in size-segregated aerosols from the tropical eastern At-
                                                                            lantic Ocean, Global Biogeochem. Cy., 34, e2019GB006510,
                                                                            https://doi.org/10.1029/2019GB006510, 2020.
                                                                          Bosia, C., Chabaux, F., Pelt, E., Cogez, A., Stille, P., Deloule, E.,
Acknowledgements. This study is a contribution to the PEACE-
                                                                            and France-Lanord, C.: U-series disequilibria in minerals from
TIME project (http://peacetime-project.org, last access: 9 April
                                                                            Gandak River sediments (Himalaya), Chem. Geol., 477, 22–34,
2021), a joint initiative of the MERMEX and ChArMEx compo-
                                                                            2018.
nents supported by the CNRS-INSU, IFREMER, CEA and Météo-
                                                                          Bonnet, S. and Guieu, C.: Atmospheric forcing on the an-
France as part of the MISTRALS program coordinated by CNRS-
                                                                            nual iron cycle in the western Mediterranean Sea: A
INSU (PEACETIME cruise; https://doi.org/10.17600/17000300).
                                                                            1 year survey, J. Geophys. Res.-Oceans, 111, C09010,
All data have been acquired during the PEACETIME oceano-
                                                                            https://doi.org/10.1029/2005JC003213, 2006.
graphic expedition on board R/V Pourquoi Pas? in May–June 2017.
                                                                          Bourne, M. D., Thomas, A. L., Mac Niocaill, C., and Hender-
PEACETIME was endorsed as a process study by GEOTRACES.
                                                                            son, G. M.: Improved determination of marine sedimentation

https://doi.org/10.5194/bg-18-2663-2021                                                            Biogeosciences, 18, 2663–2678, 2021
You can also read