The observed diurnal cycle of low-level stratus clouds over southern West Africa: a case study
←
→
Page content transcription
If your browser does not render page correctly, please read the page content below
Atmos. Chem. Phys., 19, 1281–1299, 2019
https://doi.org/10.5194/acp-19-1281-2019
© Author(s) 2019. This work is distributed under
the Creative Commons Attribution 4.0 License.

The observed diurnal cycle of low-level stratus clouds over southern
West Africa: a case study
Karmen Babić1 , Bianca Adler1 , Norbert Kalthoff1 , Hendrik Andersen1 , Cheikh Dione2 , Fabienne Lohou2 ,
Marie Lothon2 , and Xabier Pedruzo-Bagazgoitia3
1 Institute
          of Meteorology and Climate Research, Karlsruhe Institute of Technology (KIT), Karlsruhe, Germany
2 Laboratoired’Aérologie, Université de Toulouse, CNRS, UPS, Toulouse, France
3 Meterology and Air Quality Group, Wageningen University and Research, Wageningen, the Netherlands

Correspondence: Karmen Babić (karmen.babic@kit.edu)

Received: 27 July 2018 – Discussion started: 13 August 2018
Revised: 14 November 2018 – Accepted: 23 January 2019 – Published: 31 January 2019

Abstract. This study presents the first detailed observa-          I and II), turbulent mixing is an important factor leading to
tional analysis of the complete diurnal cycle of strati-           the cooling below the cloud base, while strong radiative cool-
form low-level clouds (LLC) and involved atmospheric pro-          ing at the cloud top helps to maintain thick stratus.
cesses over southern West Africa (SWA). The data used
here were collected during the comprehensive DACCIWA
(Dynamics-Aerosol-Chemistry-Cloud-Interactions in West
Africa) ground-based campaign, which aimed at monitoring
LLC characteristics and capturing the wide range of atmo-          1   Introduction
spheric conditions related to the West African monsoon flow.
In this study, in situ and remote sensing measurements from        During the summer monsoon season in southern West Africa
the supersite near Savè (Benin) collected during a typical         (SWA), stratiform low-level clouds (LLC) frequently form
day, which is characterized by the onset of a nocturnal low-       during the night with a typical cloud-base height (CBH) of
level jet (NLLJ) and the formation of LLC, are analyzed. The       several hundred meters above ground, and cover extensive
associated dynamic and thermodynamic conditions allow the          areas (Knippertz et al., 2011; Schrage and Fink, 2012; Schus-
identification of five different phases related to the LLC di-     ter et al., 2013; van der Linden et al., 2015). Using multi-
urnal cycle: the stable, jet, stratus I, stratus II, and convec-   year (2006–2011) surface synoptic observations and various
tive phases. The analysis of relative humidity tendency shows      satellite products, van der Linden et al. (2015) presented a
that cooling is a dominant process for LLC formation, which        first climatology of the LLC during the wet monsoon sea-
leads to a continuous increase in relative humidity at a max-      son (July–September) in SWA. They found that shortly af-
imum rate of 6 % h−1 , until finally saturation is reached and     ter sunset LLC frequently form along the coast of Guinea
LLC form with a cloud-base height near the height of NLLJ          and spread farther inland in the course of the night, while
maximum. Results of heat budget analysis illustrate that hor-      LLC are most frequent upstream of elevated terrain. The
izontal cold-air advection, related to the maritime inflow,        LLC reach a maximum northward extent between 09:00
which brings the cool maritime air mass and a prominent            and 10:00 UTC, with the maximum aerial coverage of ap-
NLLJ wind profile, has the dominant role in the observed           proximately 800 000 km2 . Similar results were obtained by
strong cooling of −1.2 K h−1 during the jet phase. The con-        Schrage and Fink (2012) and Schuster et al. (2013), who an-
tribution from horizontal cold advection is quantified to be up    alyzed the data collected during the African Monsoon Mul-
to 68 %, while radiative cooling and sensible heat flux diver-     tidisciplinary Analysis (AMMA) 2006 special observing pe-
gence both contribute 16 % to the observed heat budget be-         riods (May–October). Due to their persistence until the early
low the NLLJ maximum. After the LLC form (stratus phases           afternoon hours, LLC significantly influence the radiation
                                                                   budget at the surface (Schuster et al., 2013; Hill et al., 2018),

Published by Copernicus Publications on behalf of the European Geosciences Union.
1282                                            K. Babić et al.: Diurnal cycle of low-level clouds over southern West Africa

and thus affect the diurnal cycle of the atmospheric boundary     cast and predictions of the West African monsoon in weather,
layer (ABL) and regional climate (Knippertz et al., 2011).        seasonal and decadal climate simulations (Knippertz et al.,
   So far, only few studies focused on the analysis of mech-      2011; Hannak et al., 2017). In order to fulfill this gap, a com-
anisms and factors controlling the onset and maintenance of       prehensive field campaign was conducted within the frame-
LLC in SWA. Schrage and Fink (2012) used remote sensing           work of the Dynamics-aerosol-chemistry-cloud-interactions
observations at Nangatchori in central Benin, Schuster et al.     over West Africa (DACCIWA) project (Knippertz et al.,
(2013) performed regional simulations for the whole 2006          2015) in June and July 2016. The campaign included ground-
monsoon season using the Weather Research and Forecast-           based measurements at three supersites in Ghana, Benin, and
ing (WRF) model, while Adler et al. (2017) performed high-        Nigeria (Kalthoff et al., 2018), radiosonde and aircraft mea-
resolution numerical simulations with the Consortium for          surements (Flamant et al., 2018). Knippertz et al. (2017) pre-
Small-Scale Modeling (COSMO) model for a case study and           sented the large-scale setting and synoptic and mesoscale
an area around the city of Savè (Benin). Schrage and Fink         weather systems, which affected the region during the DAC-
(2012) found the formation of LLC to be related to the on-        CIWA campaign, identifying different phases of similar me-
set of the nocturnal low-level jet (NLLJ) and the same con-       teorological conditions, while Kalthoff et al. (2018) gave an
clusion is obtained from the model simulations. Schrage and       overview of the diurnal cycle of the ABL conditions as well
Fink (2012) proposed the strong wind shear underneath the         as of the conditions related to nocturnal LLC at three ground-
NLLJ, which leads to the destabilization of the near-surface      based supersites.
layer and increased turbulent upward mixing of cold air and          This study is conducted in concert with the analyses pre-
moisture, to be the major process for the cloud formation at      sented by Adler et al. (2019) and Dione et al. (2018). In this
Nangatchori. On the other hand, modeling results of Schus-        study we focus on the description of the diurnal cycle of
ter et al. (2013) suggest that turbulent processes related to     LLC and identification of physical processes and factors that
the NLLJ are more dominant close to the coast, while oro-         control the formation, maintenance, and dissolution of LLC
graphically forced lifting on the windward side of mountains      during one typical night with undisturbed monsoon condi-
is more important farther inland. The importance of horizon-      tions and persistent LLC (e.g., Flamant et al., 2018; Kalthoff
tal cold-air advection with the southwesterly monsoon flow        et al., 2018). For this we use measurements performed at the
for the formation of LLC was found by both modeling stud-         Savè supersite during intensive observation period (IOP) 8
ies (Schuster et al., 2013; Adler et al., 2017). Finally, after   (7–8 July 2016). Specifically, we aim at identifying the main
LLC form, radiative cooling at the cloud top, as well as the      factors leading to the relative humidity (RH) change and LLC
vertical mixing below the cloud, help to maintain the stra-       formation and assessing the heat budget terms for different
tus deck. High-resolution simulations suggest that additional     phases during the life cycle of the LLC. Although we show
processes could be important for LLC formation, such as ver-      only one case study, the dominant processes are considered to
tical cold-air advection, which is related to orographically      be representative of a major part of the DACCIWA campaign,
induced lifting as well as to gravity waves, and enhanced         especially for the post-onset phase of monsoon (22 June–
convergence and upward motion upstream of existing clouds         20 July 2016, Knippertz et al., 2017). This is supported by the
(Adler et al., 2017).                                             analysis of Adler et al. (2019), who perform in a consistent
   While LLC and involved phenomena are the integral part         manner an analysis for 11 IOPs, and we find a good agree-
of the West African Monsoon system, climate models strug-         ment between these two studies. Additionally, Adler et al.
gle to realistically represent them. Knippertz et al. (2011)      (2019) investigate LLC characteristics (vertical extent, cov-
conducted a comprehensive analysis of global climate mod-         erage, onset time, and horizontal distribution and evolution),
els and found positive biases in NLLJ speed, negative biases      as well as the intra-night variability of boundary-layer condi-
in LLC cover, and consequently large overestimation of solar      tions and processes relevant for LLC formation. Dione et al.
radiation (of up to 90 W m−2 ). Hannak et al. (2017) extended     (2018) present a detailed statistical analysis of the character-
the analysis of Knippertz et al. (2011) to the latest global      istics of the LLC and the dynamics in the lower atmosphere
climate model data sets. While similar biases are found as        for a 41-day period.
in Knippertz et al. (2011), the authors have identified differ-      This paper is organized as follows: in Sect. 2 a brief de-
ences in subgrid cloud schemes as one of the possible reasons     scription of the study site, data, and methods used is given.
why models struggle to realistically represent LLC.               In Sect. 3, the evolution of LLC is described, followed by
   Up to now, spatial and temporal investigations of LLC in       the presentation of atmospheric dynamic and thermodynamic
this region have been performed based mainly on satellite im-     conditions in Sect. 4. In this section we also analyze the RH
ages, synoptic observations and few modeling studies men-         tendency and the heat budget. The discussion of results is
tioned above, while high-quality observational data sets were     presented in Sect. 5, while the main findings are summarized
rare. Due to these limitations, processes that control the for-   in Sect. 6.
mation and dissolution of LLC are still not fully understood.
Moreover, understanding of these processes has important
practical implications, such as improving operational fore-

Atmos. Chem. Phys., 19, 1281–1299, 2019                                            www.atmos-chem-phys.net/19/1281/2019/
K. Babić et al.: Diurnal cycle of low-level clouds over southern West Africa 1283
2 Data and methods affected by clouds and remove outliers and echos by hard
targets. Then we estimate the mean wind speed and direction
2.1 Meteorological measurements at the Savè supersite using a simplified version of the VAD method (Bonin et al.,
2017). The variance for each range ring is calculated by av-
In this study we analyze the data collected during the DAC- eraging the deviation from the fitted curve and corrected for
CIWA ground-based measurement campaign, which took uncorrelated noise. We obtained the information on liquid
place between 14 June and 31 July 2016 at the Savè (Benin) water path (LWP) and integrated water vapor (IWV) from
supersite (Fig. 1). The comprehensive and unique data set of the microwave radiometer (Wieser et al., 2016) using the
the ground-based campaign consists of remote sensing and retrieval algorithm provided by the University of Cologne
in situ data (Bessardon et al., 2019), which enable the inves- (Löhnert and Crewell, 2003; Löhnert et al., 2009). This al-
tigation of cloud characteristics and dynamic and thermody- gorithm was trained on a set of more than 12 000 radiosonde
namic conditions at high temporal and vertical resolutions profiles measured between 1980 and 2014 in Abidjan (Ivory
(Kalthoff et al., 2018). During the campaign, 15 IOPs were Coast). These quantities are needed for the radiative transfer
conducted, during which, in addition to normal radiosondes model, which we used to obtain vertical profiles of radiative
launched at standard synoptic times, frequent radiosondes fluxes, and which is described in Sect. 2.3.
were launched at regular intervals in between the normal
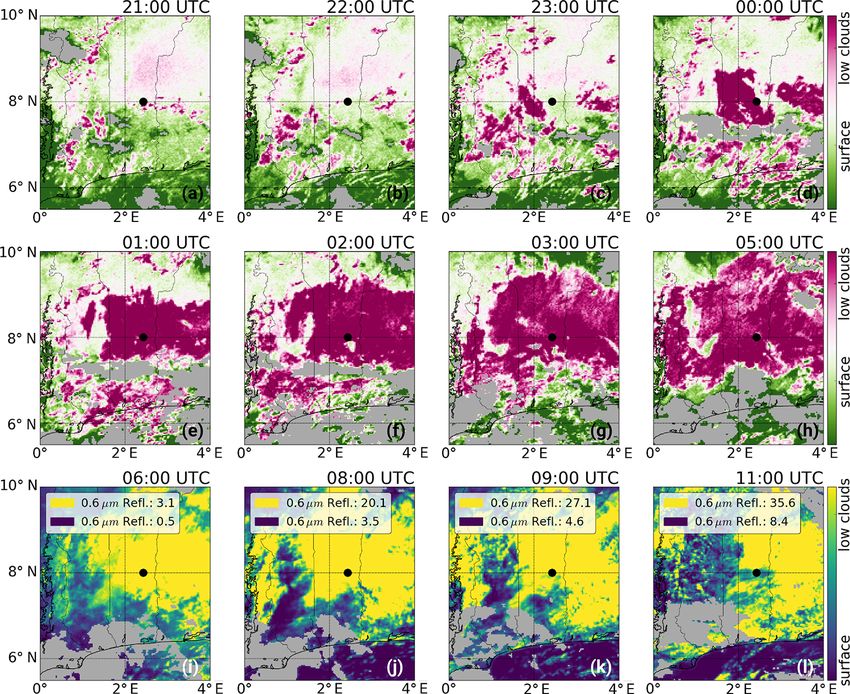
radiosondes. The Savè supersite (8.00◦ N, 2.43◦ E; 166 m 2.2 Measurements of LLC characteristics
above sea level (a.s.l.)) is located approximately 185 km in-
land from the coast in a moderately hilly region which is The cloud characteristics are documented by ceilometer
favorable for LLC formation (van der Linden et al., 2015; (CBH), cloud radar measurements (cloud top height, CTH),
Adler et al., 2017; Kalthoff et al., 2018). The vegetation cover and infrared (IR) cloud camera (cloud cover). The CHM15k
at the site is characterized by grass and bushes (waist deep). ceilometer operates at a wavelength of 1064 nm and a pulse
A comprehensive measurement setup at this supersite al- rate of 5–7 kHz. It records the backscatter every 60 s up to
lows the detailed investigation of atmospheric conditions and 15 km a.g.l. and has a vertical resolution of 15 m. A 35.5 GHz
identification of atmospheric processes relevant to the ob- cloud radar was operated in the vertical stare mode to pro-
served life cycle of LLC. Meteorological data used here com- vide radial velocity and reflectivity profiles from 150 m to
prise near-surface meteorological parameters, 30 min aver- 15 km a.g.l. at a vertical resolution of 30 m and a tempo-
aged turbulence fluxes and turbulence variables, which were ral resolution of 10 s. The CBH is determined from the at-
calculated using the TK3.11 software (Mauder et al., 2013), tenuated backscatter coefficient profiles based on a thresh-
and radiation fluxes (Kohler et al., 2016). old method (manufacturer Lufft, personal communication,
The dynamic and thermodynamic conditions in the ABL 2016), while the CTH is derived from the measurements
were measured with radiosondes (normal and frequent) and of radar reflectivity of hydrometeors using a threshold of
different continuously running active and passive remote −35 dBz; i.e., reflectivities larger than −35 dBz are consid-
sensing instruments (Derrien et al., 2016; Handwerker et al., ered clouds (Bauer-Pfundstein and Goersdorf, 2007). In ad-
2016; Wieser et al., 2016). The radiosondes were launched dition to this, information on sky conditions is obtained with
in regular intervals of 1.5 h, starting at 17:00 UTC prior to the IR cloud camera. This camera takes images of the frac-
the IOP day (7 July) until 11:00 UTC on the IOP day. For tion of sky every 2 min with an opening angle of 43◦ ×
Benin, local standard time equals UTC plus 1 h. Addition- 32◦ (i.e., 166 m × 114 m covered area at 200 m height) and a
ally, the radiosounding measurements at the coastal station wavelength range of 7.5–13.5 µm. The sky images are coded
Accra (Ghana, Fig. 1) were performed as part of the DAC- in three colors: red, green, and blue (RGB). The color of
CIWA radiosonde campaign (Flamant et al., 2018). High- the image depends on the emissivity of the sky and, conse-
resolution information of flow conditions (wind speed and di- quently, on the temperature. Thus, a red image indicates a rel-
rection) is obtained from a sodar (for lower part of the ABL) atively warm temperature, while blue indicates colder tem-
and an ultra-high frequency (UHF) wind profiler (above peratures. Based on this, it is possible to distinguish cloud-
200 m a.g.l.) measurements. Additionally, Doppler lidar az- free periods, periods with continuous cloud deck, as well as
imuth scans at 15◦ elevation angle (plan-position indicator, periods with intermittent (stratus fractus) clouds.
PPI) provided the information on the three-dimensional ra- The Spinning Enhanced Visible Infra-Red Imager (SE-
dial velocity field by applying the velocity–azimuth display VIRI) data provided the spatiotemporal characteristics of
(VAD; Browning and Wexler, 1968) technique. In addition LLC in the larger area. The spatiotemporal distribution and
to the retrieval of the mean horizontal wind field with the evolution of LLC in the study area is observed with the SE-
VAD method, PPI scans can be used to quantify turbulence VIRI (Schmetz et al., 2002) sensor, mounted on the geosta-
(e.g., Bonin et al., 2017). We use PPI scans performed at a tionary Meteosat Second Generation satellite system. Infor-
15◦ elevation angle to estimate the variance of radial veloc- mation on LLC coverage is inferred using three channels:
ity for each range ring and project them to the vertical axis. the visible at 0.6 µm (VIS), middle-infrared at 3.9 µm (MIR)
The procedure is as follows: first we dismiss all range rings and thermal-infrared at 10.8 µm (TIR) at their native reso-
www.atmos-chem-phys.net/19/1281/2019/ Atmos. Chem. Phys., 19, 1281–1299, 2019
1284                                               K. Babić et al.: Diurnal cycle of low-level clouds over southern West Africa

Figure 1. (a) The black rectangle indicates the geographical location of the DACCIWA area of interest. (b) Topographic map of the inves-
tigation area. The three supersites, including the Savè supersite, are indicated with black squares. The Accra coastal radiosonde station is
shown with a red circle.

lution of 3 × 3 km2 (at nadir) and a repeat rate of 15 min.             283 K. Based on observed temperature profiles, this approx-
At night, LLC are illustrated using the brightness tempera-             imates a cloud-top altitude of 2.7 km. It should be noted that
ture difference of the TIR and the MIR channels, which is a             edges of mid-level clouds might be missed by the TIR filter.
proxy for cloud droplet size and can thus be used to detect             The satellite imagery shown in this study is meant to be a
low clouds (smaller droplets) (Hunt, 1973). The underlying              purely qualitative representation of LLC occurrence and dis-
concept is based on the assumption that the average droplet             tribution during the IOP.
size within the LLC is smaller than in higher-altitude clouds.
As the emissivity difference of the TIR and the MIR is de-              2.3    SBDART radiative transfer model
pendent on cloud droplet size (Hunt, 1973), the brightness
temperature difference between TIR and MIR has been used                Vertical profiles of radiative fluxes are computed with the
frequently to detect low clouds from various satellite plat-            Santa Barbara DISORT Atmospheric Radiative Transfer
forms (e.g., Eyre et al., 1984; Cermak and Bendix, 2007).               (SBDART) model. SBDART is a software tool which com-
However, during daytime, the channel at 3.9 µm measures a               putes plane-parallel radiative transfer in clear and cloudy
mixture of outgoing thermal and reflected solar radiation, so           conditions within the Earth’s atmosphere (Ricchiazzi et al.,
this method does not work after sunrise (Cermak and Bendix,             1998). Thanks to the rich data set obtained within the field
2008). Therefore, the reflectance in the VIS channel is used            campaign, many of the input parameters can be specified, al-
to illustrate cloud coverage during daytime. In order to eas-           lowing for a realistic modeling of radiative fluxes. For ex-
ily distinguish between these two techniques, different col-            ample, based on the radiosonde measurements, vertical pro-
ormaps in Fig. 2 are chosen for the different techniques. For           files of pressure, temperature, and water vapor are used in
both, daytime and nighttime, higher-level clouds are masked             the model, while the microwave radiometer provides IWV
out by applying a TIR brightness temperature threshold at               values. The standard tropical ozone density profile is used as
                                                                        input (linearly interpolated to model levels), since this infor-

Atmos. Chem. Phys., 19, 1281–1299, 2019                                                    www.atmos-chem-phys.net/19/1281/2019/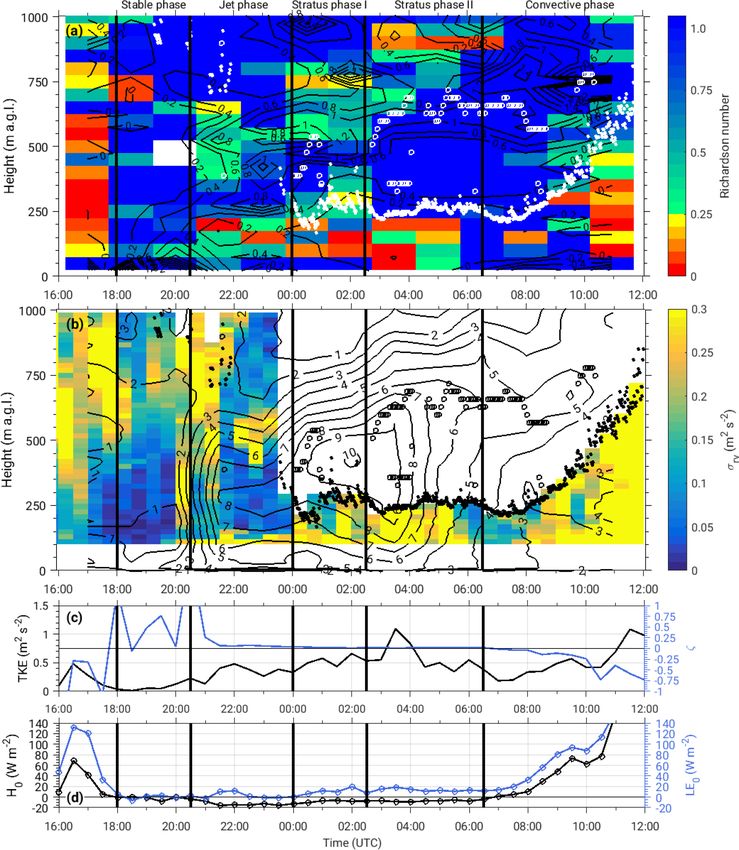
K. Babić et al.: Diurnal cycle of low-level clouds over southern West Africa                                                       1285

Figure 2. The difference in brightness temperature for spectral channels 10.8 (TIR) and 3.9 µm (MIR) is shown in panels (a)–(h) for the
nighttime period. The range of the color bar for the nighttime period (a–h) is between −1 and 3.5 K. Purple color indicates LLC. Time is
indicated in the top right corner in each panel, with panel (a) showing 21:00 UTC on 7 July 2016 and (l) showing 11:00 UTC on 8 July 2016.
For the daytime period (i–l) the reflectance in the visible channel (0.6 µm) is shown and the range of the color bar is indicated in the
legend. The gray areas indicate the TIR brightness temperature threshold at 283 K, which indicates higher-level clouds. The Savè supersite
is indicated with a black circle.

mation is not available from measurements. In total, 65 ver-           ness is determined from the LWP measurements and the
tical input levels are specified, with 50 m resolution in the          cloud droplet effective radius. We use the default value of
lowest 2.5 and 1 km resolution between 3 and 16 km.                    cloud droplet effective radius of 8 µm as this value is within
   The spectral range of radiative flux calculations is selected       the range of aircraft measurements in the area (Deetz et al.,
to correspond to the measurement range of the near-surface             2018b; Taylor et al., 2019). The phase function model used
solar radiation instrument, namely between 0.34 and 2.2 µm             in cloud layers is Mie scattering. All other input parameters
in the shortwave range and 4.5–42 µm in the longwave range             correspond to the default ones. Sensitivity tests were also per-
with spectral resolutions of 0.01 and 0.1 µm, respectively.            formed in order to inspect how sensitive the model output
The solar illumination angles are computed from the spec-              is to input parameters, and the configuration which gave the
ified day of year, time, and geographic coordinates. A spec-           best agreement of net longwave and shortwave radiation with
trally uniform albedo equal to 0.2 (Kalthoff et al., 2018) is          the near-surface observations was chosen.
set for the surface reflectance properties. The boundary-layer
aerosol type is set to typical rural, while the vertical opti-
cal depth of the boundary-layer aerosol is defined as a mean           3   Characteristics of the diurnal cycle of LLC
daily aerosol optical depth measured on 7 July (Level 1.5,
http://aeronet.gsfc.nasa.gov/, last access: 15 March 2018)             The SEVIRI-based information about the spatial distribution
and is equal to 0.36. In the case of cloud presence, cloud             and temporal evolution of LLC is shown in Fig. 2. In the
properties, such as cloud-layer range and the optical thick-           early evening, some patchy LLC are present in the investi-
ness of the cloud layer, are specified. The cloud optical thick-       gation area and are confined to higher terrain (Fig. 1) of the
                                                                       Atakora Mountains range (Togo) and upstream of the Os-

www.atmos-chem-phys.net/19/1281/2019/                                                    Atmos. Chem. Phys., 19, 1281–1299, 2019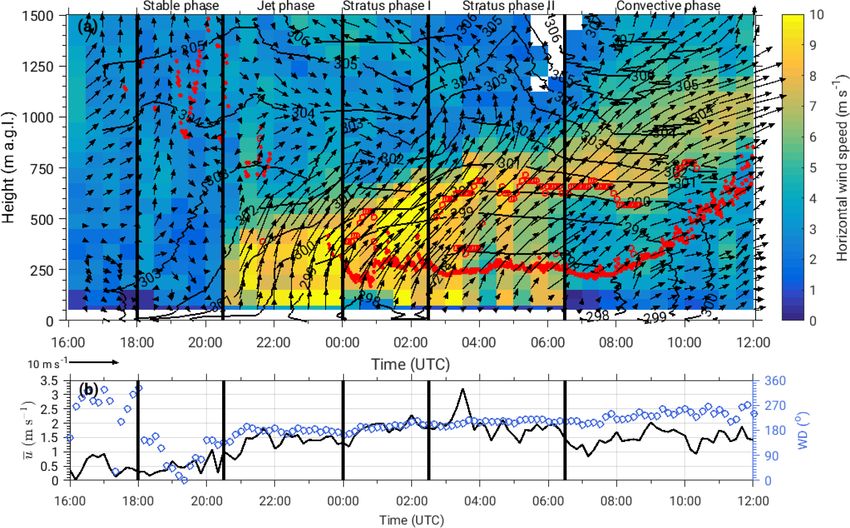
1286                                             K. Babić et al.: Diurnal cycle of low-level clouds over southern West Africa

hogbo Hills (Nigeria) (Fig. 2a, b). After 22:00 UTC, the first     winds and the African easterly jet above (Flamant et al.,
LLC formed southwest, i.e., upstream, of Savè and then ex-         2018). Note that on this particular IOP the observed mon-
tended to the downstream side by 00:00 UTC (Fig. 2c, d).           soon depth is lower than for the whole DACCIWA investiga-
At the same time, the area in the neighboring Nigeria cov-         tion period, which has a median depth of 2 km (Dione et al.,
ered with LLC was extending westwards until the two areas          2018). The minimum wind speed is found within the layer
merged into one large area around 01:00 UTC (Fig. 2d, e).          between about 1000 and 1500 m a.g.l., which corresponds to
At about 02:00 UTC, LLC have already extended and cover            the transition layer between the southwesterly monsoon flow
a substantial part of the domain (Fig. 2f), which continues to     and easterlies above. In the African easterly jet layer, winds
grow in the course of the night (Fig. 2g), so that at 05:00 UTC    reach a maximum of 15 m s−1 at about 3500 m a.g.l. (see
LLC cover the large part of the investigation area (Fig. 2h).      Fig. 4b in Dione et al., 2018). During the afternoon and early
After sunrise at around 06:00 UTC (Fig. 2i), LLC start slowly      evening, a moderate northwesterly-to-southwesterly flow of
to dissipate (Fig. 2j, k); however, at 11:00 UTC (Fig. 2l) their   3 m s−1 prevails in the lowest 1500 m (Fig. 4a). The onset
presence in the domain is still substantial.                       of NLLJ is observed at 20:30 UTC, with an abrupt increase
   The ceilometer backscatter measurements at Savè (Fig. 3a)       in wind speed up to a maximum of 8 m s−1 , at a height of
show some low- and mid-level clouds (up to 3 km, not               275 m a.g.l. At the time of the NLLJ onset wind direction
shown) present between 18:00 and 22:00 UTC, followed by            changes from westerly to southerly and south-southwesterly.
a cloud-free period. The LLC formed around midnight, with          The height of the NLLJ maximum corresponds to the height
CBH at around 300 m a.g.l., and the same was observed by           at which LLC form roughly 3.5 h later (Fig. 3b). Once the
SEVIRI (Fig. 2d). These LLC are maintained during the              clouds have formed, the NLLJ maximum shifts upwards to
rest of the night and even after sunrise, with CBH at ap-          the height of around 450 m a.g.l., reaching the maximum
proximately 250 m a.g.l. After around 08:00 UTC, the CBH           speed of 10 m s−1 (Fig. 4a). A weakening of the NLLJ is
rises approximately linearly with time. At first, the CTH          seen after 04:00 UTC and the axis is lifted to around 600–
is observed roughly at 500 m a.g.l., indicating on average a       700 m a.g.l. With respect to wind speed close to the surface,
250 m deep cloud layer, with a period between 01:00 and            we observe a similar behavior to Lothon et al. (2008), with
03:00 UTC without a clear cloud radar signal, therefore mak-       the wind speed only slightly increasing above 1.5 m s−1 after
ing it difficult to determine the CTH for the whole pe-            the NLLJ onset (Fig. 4b). The wind direction becomes less
riod (Fig. 3b). After 03:00 UTC, LLC are persistent until          variable after the arrival of south-southwesterly NLLJ and
08:00 UTC, with the CTH roughly constant at 650 m a.g.l.           southwesterly flow persists in the course of the night and the
forming a 400 m deep cloud layer. After around 08:00 UTC,          following morning.
the CTH rises linearly as well. The microwave radiometer              The potential temperature isolines show that after the sun-
measurements of the LWP reveal varying cloud characteris-          set at 18:00 UTC, a strong cooling of the layer close to
tics during the night (Fig. 3c). In the first couple of hours      the ground occurs, while coincident with the NLLJ onset
LLC contain less liquid water, most likely due to the com-         this layer becomes deeper and reaches approximately 750 m
bination of a shallow cloud layer and lower optical thick-         depth (Fig. 4a). The period between the onset of NLLJ and
ness, and according to the sky conditions obtained with an         the formation of LLC is characterized by the strongest de-
IR cloud camera, they are intermittent as well (Fig. 3d). After    crease in temperature. After the continuous LLC deck has
about 03:00 UTC, the LWP increases considerably probably           formed around 02:30 UTC, the temperature is roughly con-
because the cloud deepens, while a continuous cloud cover          stant below the cloud base as well as within the cloud layer.
is observed. A minimum of IWV is observed just prior to            The increase in the temperature coincides with the increase
the LLC onset and in the course of the night only a slight         in the CBH after 08:00 UTC due to an evolving convective
increase is observed. The observed differences in LLC char-        boundary layer (CBL).
acteristics suggest varying atmospheric conditions; therefore,        So far we have seen that due to the observed varying at-
we inspect dynamic and thermodynamic conditions at Savè            mospheric conditions, the investigated period can be divided
in the next section.                                               into different phases. The first phase identified is the period
                                                                   between the sunset (18:00 UTC) and the onset of the NLLJ
                                                                   (20:30 UTC), when the increasing static stability causes the
4     Atmospheric conditions relevant for the diurnal cycle        decoupling of the mixed layer from the stable surface layer,
      of LLC                                                       and this phase is denoted the stable phase. This phase is
                                                                   followed by the jet phase, a time period between the on-
4.1    Low-level jet and thermodynamic conditions                  set time of NLLJ and the formation of LLC (00:00 UTC),
                                                                   which marks the beginning of the stratus phase. The pe-
We start the investigation of atmospheric conditions during        riod of roughly 2.5 h after LLC formation is identified as
this IOP by inspecting the horizontal wind field (Fig. 4).         stratus phase I, since inhomogeneous cloud cover and non-
The large-scale conditions on this IOP are characterized by        stationary atmospheric conditions are observed. This is fol-
an about 1000 m deep monsoon layer with southwesterly              lowed by stratus phase II, which corresponds to the period

Atmos. Chem. Phys., 19, 1281–1299, 2019                                             www.atmos-chem-phys.net/19/1281/2019/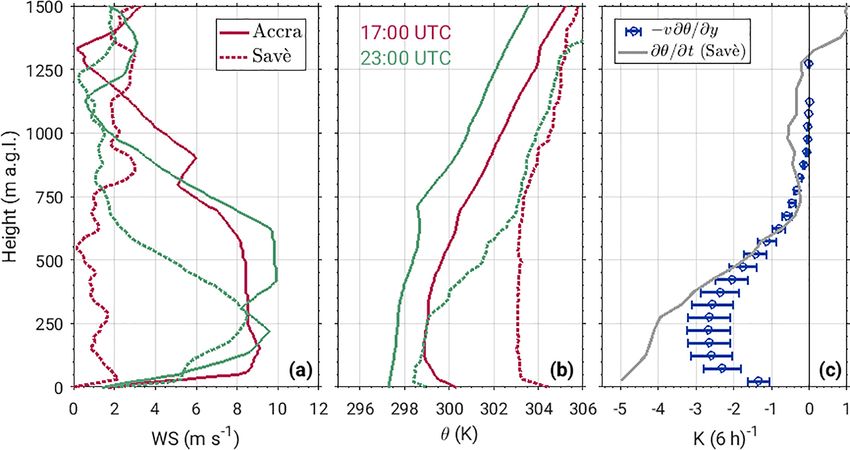
K. Babić et al.: Diurnal cycle of low-level clouds over southern West Africa                                                            1287

Figure 3. (a) Time series of ceilometer backscatter (color) and CBH (black dots) derived from the backscatter profiles. (b) The reflectivity of
hydrometeors obtained by cloud radar (color), the CBH (black dots), and CTH (open circles) derived from the cloud radar using a threshold
of −35 dBz. (c) Time series of 30 min averaged LWP and IWV from microwave radiometer. (d) The RGB coded image of sky conditions
obtained by IR cloud camera. The image shows relative contributions of red, green, and blue in a given pixel, where the color of the pixel
depends on the emissivity of the sky area and its brightness temperature. The blue colors correspond to clear sky and the red color indicates
LLC.

between 02:30 and 06:30 UTC, with a persistent LLC deck                   shows the absolute values of the gradient Richardson number
and quasi-stationary atmospheric conditions. The final con-               (Ri), which we calculate from radiosonde profile measure-
vective phase is associated with growing CBL and is charac-               ments for the 50 m averaged bins according to the following
terized by increased surface heating and lifting of the cloud             expression: Ri = gθ ∂θ/∂z 2 , where g is the acceleration due
                                                                                               (∂U/∂z)
base. Note that these five phases do not occur only on this               to gravity, θ is the potential temperature, and U is the hor-
particular IOP. Adler et al. (2019) found that the same phases            izontal wind speed. Generally, turbulence is stronger as the
can be distinguished for at least 10 other IOPs.                          Richardson number is smaller, while Ri = 0.21–0.25 is con-
   The wind shear underneath the NLLJ causes mechanical                   sidered to be a critical Richardson number below which the
production of turbulence, which is considered to be an impor-             flow is fully turbulent. When Ri is above 1, the flow is consid-
tant process leading to the LLC formation (Zhu et al., 2001;              ered to be laminar (e.g., Stull, 1988). Although two Doppler
Schrage and Fink, 2012; Schuster et al., 2013). Figure 5a                 lidars were deployed at Savè, we could not obtain reliable

www.atmos-chem-phys.net/19/1281/2019/                                                       Atmos. Chem. Phys., 19, 1281–1299, 2019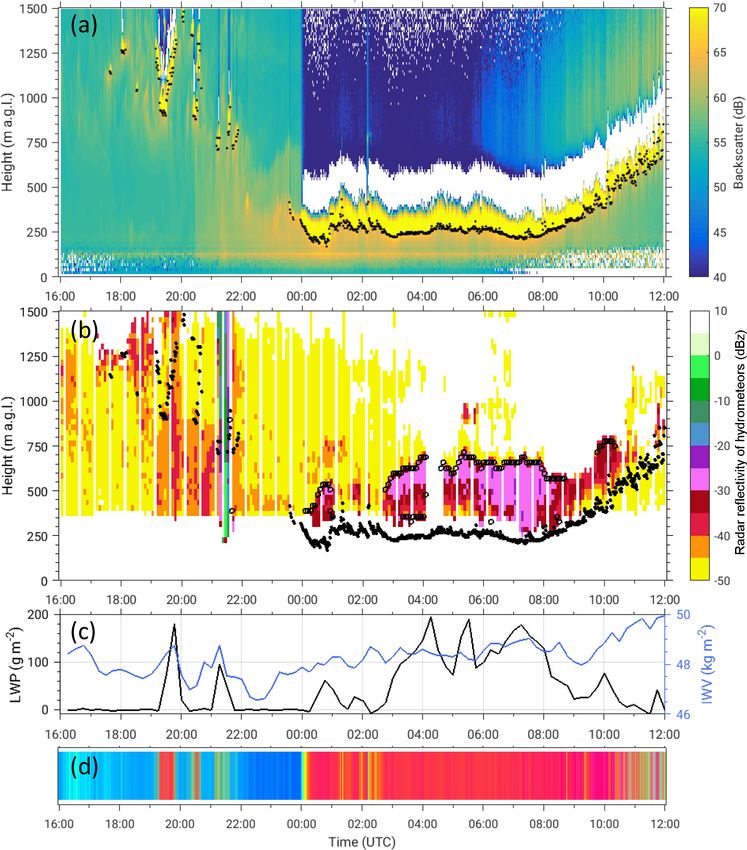
1288                                              K. Babić et al.: Diurnal cycle of low-level clouds over southern West Africa

Figure 4. (a) Temporal evolution of the wind speed is shown in color, while arrows show wind direction obtained from sodar and UHF. Black
contours show linearly interpolated potential temperature measured every 1.5 h by radiosondes. The red dots show CBH and CTH as shown
with open red circles. (b) Time series of the near-surface 10 min averaged wind speed (black) and wind direction (blue) measured by energy
balance station. The vertical black lines indicate the beginning of five different phases observed during this IOP.

measurements of vertical velocity fluctuations (σw ) from the          kinematic heat flux. This parameter is traditionally used as
vertical stare mode observations (Adler et al., 2019). How-            a measure of stability in the surface layer. Its magnitude is
ever, for an assessment of turbulence in the nocturnal cloud-          not directly related to static stability, but a positive sign indi-
free ABL, radial velocity measurements during PPI scans                cates statically stable conditions, and a negative one implies
performed with the scanning Doppler lidar at Savè can be               unstable conditions (e.g., Stull, 1988). Simultaneously with
used too. The standard deviation of the radial velocity (σrv )         the NLLJ onset, turbulence increases in the upper and lower
measured by Doppler lidar is shown in Fig. 5b.                         shear zones of the jet. In the jet phase, below the NLLJ max-
   The importance of the NLLJ for LLC formation was first              imum and at the surface, static stability decreases, enabling
reported by Schrage and Fink (2012) for the SWA region,                stronger turbulent mixing and increase in TKE (Fig. 5a, c),
while Zhu et al. (2001) found similar importance for the noc-          while simultaneously the sensible heat flux decreases from
turnal stratus in the Great Plains (USA). The signature of             −10 W m−2 to its maximum value of −16 W m−2 during
the NLLJ in the near-surface measurements is expected to be            the night (Fig. 5d). This enhanced vertical mixing is likely
mostly seen in the TKE and not necessarily in the mean wind            dominated by large coherent eddies (Sun et al., 2016) and
speed, as suggested by Lothon et al. (2008) in their AMMA              leads to the vertical transport of cold air from the radia-
study.                                                                 tively cooled surface. In the first couple of hours after the
   Figure 5a, b show that before the sunset, a CBL is still            LLC formed, mostly intermittent turbulence (0.25 < Ri < 1)
present at 17:00 UTC, while during the stable phase turbu-             is present within the LLC in the shear zones of the upper part
lence decays due to the lack of mechanically generated mix-            of the jet (Fig. 5a), while increased turbulent mixing is evi-
ing since the wind speed is rather low. Additionally, due to           dent below the CBH (Fig. 5a, b), which results in a highly tur-
the longwave radiative cooling of the surface after sunset re-         bulent ABL. We notice that there is quite good agreement in
sulting in a negative sensible heat flux (Fig. 5d), the stable         the information about the turbulence intensity obtained from
ABL develops and the negative buoyancy suppresses verti-               different measurement systems. The profiles of radial veloc-
cal mixing in the ABL, which is evident from low values of             ity variance show higher values in the lower and upper shear
the TKE and a high stability parameter (ζ , Fig. 5c). The sta-         zones of the NLLJ maximum, as well as below the CBH.
bility parameter is defined as the ratio of a height z and the            Figure 6a, b show temporal evolution of RH in combi-
Obukhov length L = −u3∗ /(k gθ w0 θ 0 ), where u∗ is the friction      nation with potential temperature and specific humidity. In
velocity, k = 0.4 is the von Kármán constant, and w0 θ 0 is the        the stable phase the increase in RH is confined to the lowest

Atmos. Chem. Phys., 19, 1281–1299, 2019                                                  www.atmos-chem-phys.net/19/1281/2019/
K. Babić et al.: Diurnal cycle of low-level clouds over southern West Africa                                                              1289

Figure 5. (a) The gradient Richardson number shown in color is calculated from radiosonde measurements. Black isolines show the vertical
potential temperature gradient in K (100 m)−1 calculated from radiosonde data. The white dots show CBH and open white circles denote
CTH. (b) Variance of the radial velocity obtained by Doppler lidar measurements. The black contours show horizontal wind speed (in
m s−1 ) measured by radiosondes, while black dots show CBH and open black circles denote CTH. (c) Time series of the near-surface 30 min
averaged TKE (black) and stability parameter (ζ , blue). (d) Time series of the near-surface sensible heat flux (H0 , black) and latent heat flux
(LE0 , blue) measured by the energy balance station. The vertical black lines indicate the beginning of five different phases observed during
this IOP.

100 m, with the simultaneous decrease in temperature and                   the aerosol hygroscopic growth, i.e., the size and composi-
increase in specific humidity. At the surface, temperature de-             tion of particle change due to their water vapor uptake (Deetz
creases by 4 ◦ C, while a small increase in specific humidity              et al., 2018a; Haslett et al., 2018). At the beginning of the jet
occurs (∼ 1 g kg−1 ), which finally leads to an increase in RH             phase a slight increase in specific humidity (∼ 0.7 g kg−1 be-
from 70 % to 85 % (Fig. 6c). We observe the drop in temper-                tween 20:00 and 21:30 UTC) in the layer up to 1100 m a.g.l.
ature by 3 ◦ C in the period between 20:00 and 00:00 UTC,                  is recorded. This increase in specific humidity occurs si-
while simultaneously RH increases by 10 % in the layer be-                 multaneously with the increased turbulent mixing due to the
low 700 m a.g.l. We note that simultaneously with the RH in-               NLLJ. In the second part of the jet phase (21:30–23:00 UTC),
crease after 20:00 UTC, an increase in ceilometer backscat-                specific humidity decreased by 0.6 g kg−1 in the same layer.
ter is observed as well (Fig. 3). This is most likely related to           After saturation has been reached, LLC form. The unsteady

www.atmos-chem-phys.net/19/1281/2019/                                                         Atmos. Chem. Phys., 19, 1281–1299, 2019
1290                                                K. Babić et al.: Diurnal cycle of low-level clouds over southern West Africa

Figure 6. Temporal evolution of relative humidity (color) and potential temperature in Kelvin (panel a, isolines) and specific humidity in
g kg−1 (panel b, isolines) in the lowest 1.5 km obtained from radiosonde profiles performed every 1.5 h. The arrows show the horizontal
wind vector from radiosondes. The CBH is indicated with white dots and the CTH with open white circles. Time series of 10 min averaged
RH (c), temperature, and specific humidity (d) measured by the energy balance station 4 m a.g.l. The vertical red and black lines indicate the
beginning of five different phases observed during this IOP.

conditions during the subsequent roughly 2 to 3 h (stratus               neutrally stratified surface layer (ζ ≈ 0, Fig. 5c) and con-
phase I) are reflected in the RH measurements, with the                  tributes to further vertical mixing (Fig. 5c). After 08:00 UTC,
sonde released at 02:00 UTC not reaching saturation. At the              RH starts to decrease with a simultaneous increase in temper-
same time, the decrease in temperature is accompanied by                 ature and specific humidity.
the decrease in moisture; i.e., specific humidity decreased at              Based on radiosonde measurements, CBH and CTH can
a rate of 0.5 g kg−1 h−1 below 600 m a.g.l. This suggests that           be determined by applying different criteria to RH measure-
the air mass behind the NLLJ is drier than the environment at            ments, such as the criteria described in Kalthoff et al. (2018).
Savè. After 03:00 UTC, the conditions below the cloud base               Their criteria detect cloud layers when RH is larger than
are quasi-stationary. The cooling of the near-surface layer              99 %. Comparison of RH profiles with CBH and CTH shown
weakens after the cloud deck forms, which leads to a near-               in Fig. 6a clearly shows that three radiosonde profiles would

Atmos. Chem. Phys., 19, 1281–1299, 2019                                                     www.atmos-chem-phys.net/19/1281/2019/
K. Babić et al.: Diurnal cycle of low-level clouds over southern West Africa                                                 1291

indicate a deeper cloud layer than detected by the cloud radar.    gation from the known uncertainties of measurements, which
While on average there is a good agreement between the             are σT = 0.2 ◦ C for T and σRH = 2 % for RH.
CBH estimates from ceilometer and radiosondes, RH mea-                During the stable phase, RH increases in the layer below
surements can suggest a too high CTH due to the condensa-          300 m a.g.l., with a maximum of about 4 % h−1 (Fig. 7a).
tion on the sensor even after the sonde has risen above the        Above this level up to roughly 700 m a.g.l., RH is almost con-
cloud top. This issue highlights the advantage of the DAC-         stant, while above RH decreases. The decrease in the tem-
CIWA ground campaign and the multitude of instruments              perature is mostly responsible for the increase in RH below
deployed allowing for the multiple estimates of certain pa-        300 m, while on average there is a small positive moisture
rameters and their cross-validation.                               contribution. The median wind speed profile in this phase is
   In the following sections we present the analysis of pro-       less than 3 m s−1 in the lowest 1 km. The large uncertainty
cesses relevant for the evolution of LLC and assess their rel-     for each of the terms in stable phase is due to the fact that the
evance during different phases.                                    tendencies are calculated over a relatively short time period
                                                                   of just 1.5 h. During the next phase, the layer with a signif-
4.2    Relative humidity tendency                                  icant increase in RH deepens to about 700 m a.g.l., with a
                                                                   maximum rate of 6 % h−1 (Fig. 7b). The main bulk of this
The observed changes in RH are a result of temperature (T )        change is caused by cooling, while moisture change is negli-
and/or specific humidity (q) changes, i.e., RH increases due       gible during the jet phase. The layer of the maximum change
to increase in specific humidity and/or decrease in tempera-       corresponds to the level of the NLLJ maximum. This is in
ture. In order to quantify whether the q or T change has a         agreement with results in Adler et al. (2019), who found that
stronger influence on the RH tendency and consequently on          on average cooling is the main process leading to the increase
LLC formation, we determine their respective contributions         in RH and saturation, while moistening contributes only lit-
using consecutive radiosonde measurements. The terms of            tle.
the RH tendency equation are derived from the time deriva-            At the end of the jet phase the clouds form, but are in-
tive of RH = e/es , where e is the water vapor pressure and        termittent during stratus phase I, which is characterized by
es is the saturation water vapor pressure. In the next step,       almost constant RH within the cloud layer, while below the
we incorporate the Clausius–Clapeyron relation ∂e     s    Lv es
                                                    ∂T = Rv T 2    cloud base a small decrease in RH of −1 % h−1 is recorded
                                                       q
and the definition of water vapor pressure, e = 0.378q+0.622  p,   (Fig. 7c). Although we still observe cooling in the lowest
where T is the air temperature in Kelvin, p is the air pressure    1 km during this phase, the rate is much lower compared
in hPa, Lv is the latent heat of vaporization (2.5×10⁶ J kg−1 ),   to the stable and jet phases. At the same time a compet-
and Rv = 461.5 J kg−1 K−1 is the gas constant for water va-        ing, stronger negative contribution of the specific humid-
por. Finally, the contribution of absolute values and tenden-      ity change is observed. The median wind speed in the jet
cies of q and T to RH tendency is calculated according to          layer has even increased to 9 m s−1 , with the NLLJ maximum
∂RH     p         0.622        ∂q                                  shifting upwards to the cloud top. As the LLC deck grows
      =                      2 ∂t
                                                                   and becomes thicker, the NLLJ maximum shifts further up-
  ∂t    e s (0.378q +  0.622)
| {z } |            {z          }                                  ward towards the cloud top during stratus phase II (Fig. 7d).
 (I)                 (II)                                          As this phase lasts even after sunrise, the daytime heating
    p          qLv          ∂T                                     causes the weakening of the jet wind speed, and we observe a
  −                            .                            (1)
                          2
    e (0.378q + 0.622)Rv T ∂t                                      stronger temperature increase above the CTH than below the
  | s           {z             }                                   CBH. On average, a small positive RH tendency exists be-
                  (III)
                                                                   low the NLLJ maximum (about 0.5 % h−1 ), mostly due to a
   Terms of Eq. (1) are calculated directly from available         positive q tendency. In the convective phase, the temperature
radiosonde measurements of RH, q, T and p. In Eq. (1),             continues to increase below 700 m a.g.l., and has a stronger
term (I) is the observed RH tendency, term (II) represents the     contribution to negative RH tendency, while the q tendency
contribution from q change and term (III) from T change.           is small (Fig. 7e). The analysis of RH tendency shows that
Term (III) includes the minus sign, which means that a pos-        on average temperature changes are more pronounced than
itive value of this term indicates cooling and vice versa. For     moisture changes, especially in the period prior to LLC for-
the calculation of RH, q and T tendencies we use sound-            mation as well as after sunrise. Therefore, in the next step we
ings released at 18:30 and 20:00 UTC for the stable phase,         investigate processes responsible for the observed tempera-
at 20:00 and 23:00 UTC for the jet phase, at 23:00 and             ture changes.
03:30 UTC for the stable phase I, at 03:30 and 06:30 UTC
for the stratus phase II and at 06:30 and 11:00 UTC for con-       4.3   Heat budget analysis
vective phase. Other quantities in Eq. (1) are calculated as
averages of all soundings within each phase. The results are       Since the contribution of the temperature change is more
shown in Fig. 7. For each of the terms in Eq. (1) the range of     dominant, i.e., cooling is the dominant process for LLC for-
uncertainty is determined by calculating uncertainty propa-        mation, we investigate in more detail the heat budget during

www.atmos-chem-phys.net/19/1281/2019/                                               Atmos. Chem. Phys., 19, 1281–1299, 2019
1292 K. Babić et al.: Diurnal cycle of low-level clouds over southern West Africa
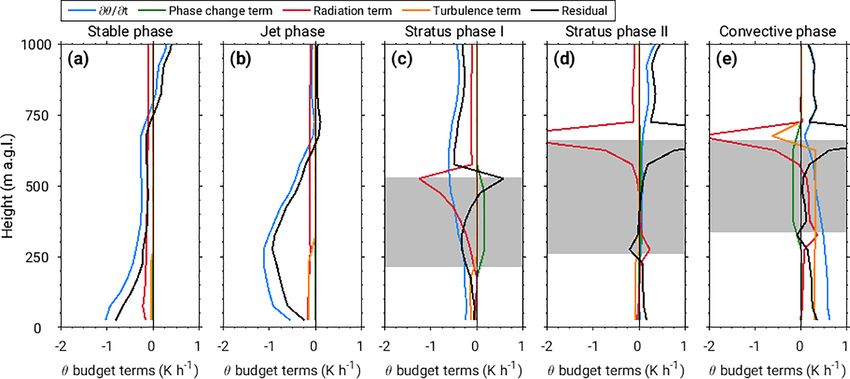
Figure 7. The observed RH tendency profiles (Term (I) in Eq. 1) obtained from radiosonde measurements for different phases during IOP 8
are shown in blue. The contributions from the specific humidity changes (Term (II) in Eq. 1) and temperature changes (Term (III) in Eq. 1)
are shown in green and red, respectively. The shading indicates the range of uncertainty of each term determined based on the uncertainty
propagation calculations. The colored circles show values of different terms of Eq. (1) obtained from near-surface measurements. The black
circles denote the median horizontal wind speed (WS) profile for each phase. The mean cloud layer is indicated in gray shading.
this IOP. The conservation equation for the mean potential the mean surface values of sensible heat flux (H0 , Fig. 5d) for
temperature (θ), with the molecular term neglected, is equal the respective phase and assuming linear decrease up to the
to (e.g., Garratt, 1992) top of the inversion layer (stable phase), to the NLLJ max-
! imum (jet phase) or to the CBH during the nighttime con-
∂θ ∂θ ∂θ ∂θ ditions (stratus phase I and II). For the daytime conditions,
=− u +v +w
∂t
|{z} ∂x ∂y ∂z we analyzed measurements of turbulent fluxes obtained by
(I)
| {z } unmanned arial system (UAS) ALADINA (Altstädter et al.,
(II)
∗
2015; Bärfuss et al., 2018) in order to get the insight into
1 ∂Qj Lv E ∂w 0 θ 0 their characteristics. Since the flight times of the UAS do not
+ − − , (2)
ρcp ∂z ρcp | ∂z
{z } correspond to the time period of the convective phase, it is
| {z } | {z }
(V) not possible to include them in the analysis directly. How-
(III) (IV)
ever, the analysis of 20 flights during the morning hours on
where cp = 1004 J kg−1 K−1 is the specific heat at constant 8 different days (not shown) indicates that it is reasonable to
air pressure, ρ is density of the air, Q∗j is the net radiation assume that sensible heat flux decreases linearly with height
flux, E is the mass of water vapor per unit volume per unit and equals −0.2H0 at the CTH (e.g., Stull, 1988; Wood,
time being created by a phase change from liquid or solid 2012).
to gaseous and w 0 θ 0 is the kinematic heat flux. We use ra- Figure 8 shows the vertical profiles of heat budget terms
diosoundings in the same manner as in the previous sec- for the five phases. The strong cooling of the layer below
tion to calculate the potential temperature tendency (term I). 300 m a.g.l. during the stable phase leads to the formation of
The advection term (II) is considered here as a residual term the stably stratified nocturnal ABL. A large part of the ob-
since we can not calculate this term for each phase, but is served cooling is due to the surface longwave radiative flux
estimated for a specific period in Sect. 4.3.1. The radia- divergence with a maximum cooling rate of −0.22 K h−1 .
tive flux divergence term (III) is determined using the ra- When vertically averaged up to 275 m a.g.l., this term ex-
diative transfer (SBDART) model (Ricchiazzi et al., 1998). plains 29 % of the observed temperature change, while con-
The latent heat release term (IV) is relevant in the case when tribution from sensible heat flux divergence is only 7 %. The
clouds are present, and is determined from the LWP mea- residual term is found to be the largest, with 64 % contri-
surements (Fig. 3c), assuming that the liquid water content is bution to the observed temperature change during this period
linearly distributed over the cloud layer depth (h), therefore, (Fig. 8a). The large residual term is most likely caused by the
v ∂(LWP)
the phase change term equals Lρcv Ep = − cpLρh ∂t . Finally, cold pool outflow, which resulted from the early evening lo-
the divergence of sensible heat flux (V ) is determined using cal rainfall event which occurred approximately 15 km south
Atmos. Chem. Phys., 19, 1281–1299, 2019 www.atmos-chem-phys.net/19/1281/2019/K. Babić et al.: Diurnal cycle of low-level clouds over southern West Africa 1293
Figure 8. Vertical profiles of heat budget terms: potential temperature tendency (blue), phase change term (green), radiation flux divergence
term (red), divergence of the sensible heat flux (orange), and residual term (black) shown for different phases during IOP 8. The shaded gray
area indicates the mean cloud layer.
of Savè and moved westward during its life cycle (between sensible heat flux divergence and horizontal advection to the
19:00 and 21:00 UTC), as revealed by X-band radar data (not observed cooling are obtained during these two phases.
shown). These results are in general agreement with findings During stratus phase I, the observed cooling below the
by Sun et al. (2003), who found that the strongest radiative CBH is mostly due to the strong vertical wind shear, which
flux divergence is observed in the early evening under weak- causes an increase in the sensible heat flux divergence
wind and clear-sky conditions, which may contribute even up and contributes 48 % of the observed temperature change
to 48 % to the observed cooling in the lowest 48 m a.g.l. (Fig. 8c). The contribution of the radiative cooling is similar
After the arrival of the NLLJ, the layer of the strongest to the jet phase and is equal to 13 %. At the same time, the
cooling deepens to 700 m a.g.l., with the maximum cool- strong radiative cooling of −1.3 K h−1 at the cloud top helps
ing rate of −1.2 K h−1 at the height of the NLLJ maximum to maintain the cloud layer, which consequently evolves into
(Fig. 8b). Below the NLLJ maximum, the contribution of dense stratus clouds by the end of this phase. The phase
longwave radiation, which is still active during this cloud- change term is positive within the cloud layer due to con-
free period, and of sensible heat flux divergence to the ob- densational heating. During stratus phase II, the atmospheric
served cooling, is approximately equal, i.e., 16 %. Based on conditions below roughly 500 m a.g.l. are quasi-stationary;
Ri and radial velocity variance values (Fig. 5a), there is ev- therefore, no substantial difference between the different
idence of increased turbulent mixing below the NLLJ maxi- terms is observed. The most pronounced feature is the strong
mum, suggesting upward turbulent transport of cold air lead- radiative cooling of −3 K h−1 at the cloud top (Fig. 8d). Nor-
ing to cooling and an increase in RH in this layer (Fig. 6a, mally, this strong radiative cooling at the cloud top leads to
b). However, the contribution of longwave radiation and sen- entrainment of air and increased turbulent mixing within the
sible heat flux divergence (due to turbulent mixing) to the ABL (due to the density differences at the CTH) and, sub-
observed cooling below the NLLJ maximum is substantially sequently, to the development of a strong capping inversion
lower compared to the 68 % contribution from the residual at the cloud top (e.g., Vilà-Guerau De Arellano et al., 2015).
term. We assume that cooling due to the horizontal cold-air However, we do not observe the expected strong temperature
advection, associated with the onset of NLLJ, is most likely inversion at the cloud top. Instead, in our case the radiative
the reason for the strong decrease in temperature during the cooling is counter-balanced by the large-scale advection of
jet phase and is considered in more detail in the next sub- warmer air in the layer up to 2 km, leading to the observed
section. These results are in general agreement with results weak heating at the cloud top. This horizontal warm-air ad-
obtained for 11 different IOPs by Adler et al. (2019); i.e., vection is accompanied by a wind direction change (Fig. 6).
the average 22 % radiative flux divergence contribution to the After sunrise, solar radiation heats the surface, causing
cooling during the stable and jet phases is in agreement with positive sensible heat flux (Fig. 5d) and evolving CBL. Tur-
their results. Note that direct comparison of magnitudes is not bulent mixing due to buoyancy leads to upward transport of
advised since the methods applied differ slightly between the warm air from the surface and warming of the layer below
studies; therefore, some differences in the contributions from the CBH, which explains 52 % of the warming of the CBL
(Fig. 8e). However, due to the fact that sensible heat flux in-
www.atmos-chem-phys.net/19/1281/2019/ Atmos. Chem. Phys., 19, 1281–1299, 20191294 K. Babić et al.: Diurnal cycle of low-level clouds over southern West Africa
creases rapidly during convective phase (the mean and stan- The estimation of the horizontal temperature advection is
dard deviation are 93 and 45 W m−2 , respectively), the esti- based on several assumptions, which are described in detail
mation of the turbulence term is associated with high uncer- in Adler et al. (2019). These include (i) the assumption of ho-
tainty. Within the clouds, the phase change term is negative mogeneous temperature distribution along the coast, (ii) ne-
due to the evaporative cooling. glecting the zonal wind component, (iii) gradual (linear) in-
crease in temperature in the south–north direction within the
4.3.1 Horizontal temperature advection maritime inflow air mass at a certain distance from the coast
(due to the position of the maritime air mass front), and
The large residual during the jet phase suggests that the hor- (iv) constant temperature in the continental ABL north of
izontal cold-air advection related to the NLLJ arrival has an the front. Recent modeling studies (Adler et al., 2017; Deetz
important contribution to the observed temperature change, et al., 2018b) indicate that the maximum inland penetration
which consequently led to the saturation and LLC formation. of the maritime air mass front in the afternoon hours is be-
In conditions of undisturbed southwesterly monsoon flow, tween 50 and 125 km inland from the coast. Therefore, we es-
Adler et al. (2017) and Deetz et al. (2018b) observed a fre- timate the contribution of horizontal advection to cooling at
quent occurrence of a stationary front, which formed along Savè during the stable and jet phases, using radiosonde mea-
the Guinean coast in the afternoon and was located several surements at the coast (Accra) and Savè (Fig. 9c). The merid-
tens of kilometers inland. This front was reflected in a strong ional temperature difference for four different front locations
gradient between the relatively cool air mass over the Gulf (50, 75, 100, and 125 km inland) is determined at 17:00 UTC,
of Guinea and warm air over land. Northward propagation while the mean (meridional v) wind is the average of mea-
of the front started after 16:00 UTC, i.e., after decay of tur- surements at 17:00 UTC in Accra and 23:00 UTC at Savè.
bulence in the CBL, and it reached the Savè region around The horizontal advection (−v1θ 1y −1 ) estimate indicates a
21:00 UTC. A similar stationary frontal structure was seen in maximum cooling rate of −2.7 K (6 h)−1 at the height of the
the simulations by Grams et al. (2010) for the coast of Mau- NLLJ maximum. When we compare estimated horizontal ad-
ritania. They related its stationary during the day to a bal- vection to the potential temperature tendency at Savè for the
ance between horizontal advection within the onshore flow time period 17:00 to 23:00 UTC, above the NLLJ maximum
and turbulence in the CBL over the land. Based on previous there is an almost perfect fit (Fig. 9c), indicating that cooling
numerical simulations, as well as the investigation of con- in this layer can be explained by horizontal advection. Below
ditions along the coast (using radiosonde data) and at Savè, the NLLJ maximum, the contribution of horizontal advection
similar processes are expected to occur along the Guinean is 55 % to the observed cooling, which explains the large part
coast during the monsoon season. Specifically, we expect the of the heat budget residual term during the jet phase and is
horizontal cold advection to be related to the Gulf of Guinea in good agreement with the estimated average contribution
maritime inflow which reaches Savè in the evening (Adler from horizontal advection to cooling during the stable and
et al., 2019). jet phases for the whole DACCIWA campaign (Adler et al.,
Figure 9a, b show the vertical profiles of wind speed and 2019). Since for IOP 8 radiosonde data are available every
potential temperature from radiosoundings at the coast (Ac- 1.5 h, we could determine the contribution of horizontal ad-
cra) and Savè. The conditions at the coast at 17:00 UTC are vection to the heat budget for the stable and jet phases sepa-
characterized by a strong monsoon flow of 8 m s−1 , com- rately. Related to the jet phase, which is characterized by the
pared to low winds at Savè. On the other hand, the con- largest temperature change and the arrival of the NLLJ, the
ditions at Savè are much warmer, with a well-mixed CBL. contribution by cold-air advection accounts for almost 70 %,
Generally, there are large differences in the conditions be- while its contribution accounts for 55 % when relating it to
tween the coast and Savè, as the coastal station seems to be the period from 17:00 to 23:00 UTC.
in the cold maritime air mass, while a well-developed CBL
dominates the conditions at Savè (Fig. 9a, b). At 23:00 UTC
strong winds in Accra are still present, while the potential 5 Discussion
temperature decreased slightly. At the same time conditions
at Savè have changed substantially: the wind profile is now Satellite images reveal that during this particular IOP, first
characterized by a pronounced NLLJ up to 8 m s−1 , which is LLC form east of the Atakora Mountains in Togo and up-
the same as at the coast, and potential temperature decreased stream of Oshogbo Hills in Nigeria. The location of LLC
considerably to about 299 K in the layer below 600 m a.g.l.; confined to mountainous regions suggests that orographically
i.e., it has nearly the same value as at the coast during the induced lifting is one important process relevant for their for-
daytime. Based on these considerations we conclude that the mation as found in modeling studies of Schuster et al. (2013)
front of the Gulf of Guinea maritime inflow with maritime and Adler et al. (2017). In subsequent hours, the clouds in the
air mass already passed Savè at this time. In the layer above region of the Atakora Mountains extend towards the north-
750 m a.g.l. conditions at Savè do not change considerably east, i.e., upstream of Savè. The evolution of LLC at Savè
during this period. suggests that they are not advected from southwest, where
Atmos. Chem. Phys., 19, 1281–1299, 2019 www.atmos-chem-phys.net/19/1281/2019/You can also read