FOOD AND NUTRITION CRISIS 2020 - ANALYSES & RESPONSES No.3, NOVEMBER 2020 - OECD
←
→
Page content transcription
If your browser does not render page correctly, please read the page content below
No.3, NOVEMBER 2020

                            MAPS & FACTS
                            FOOD AND NUTRITION
                            CRISIS 2020
    www.food-security.net
                            ANALYSES & RESPONSES

                                                    SAHEL AND
                                                   WEST AFRICA   Club
                                                                  Secretariat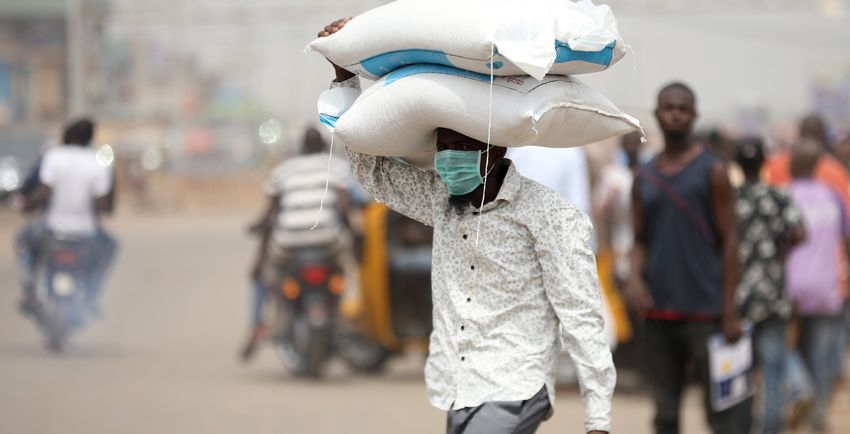
ABOUT THE RPCA
                             Promoting dialogue and co-ordination, building a coherent and shared understanding of the food
                             and nutrition situation, and nurturing decision-making: these objectives have been at the heart of
                             the Food Crisis Prevention Network’s (RPCA) mission for over 35 years. Created in 1984, the RPCA
                             is an international network for co-operation and co-ordination under the political leadership of
                             the Commissions of the Economic Community of West African States (ECOWAS) and the West
                             African Economic and Monetary Union (UEMOA). Co-ordinated jointly by the Permanent Inter-State
                             Committee for Drought Control in the Sahel (CILSS) and the Sahel and West Africa Club Secretariat
                             (SWAC/OECD), the RPCA brings together more than 100 key stakeholders: representatives of
                             Sahelian and West African countries, regional organisations, regional and international information
                             systems, bilateral and multilateral co-operation agencies, humanitarian agencies and international
                             NGOs, agricultural professional organisations, civil society and the private sector.

 SAHEL AND
WEST AFRICA   Club
               Secretariat
                             Prepared by Julia Wanjiru, Sahel and West Africa Club Secretariat (SWAC/OECD)

                             Contributors: Issoufou Baoua (CILSS), Cédric Bernard (ACF), Ali Bety (CH-Initiative 3N, Niger),
                             Anne‑Céline Delinger (UNICEF), Mado Diakité (CH-Initiative 3N, Niger), Saliou Faye (SE-CNSA, Senegal),
                             Seyni Hamadou (UEMOA), Mahalmoudou Hamadoun (CILSS), Malick Lompo (ECOWAS), Nicole Mansis
                             (SE-CNSA, Senegal), Simeon Nanama (UNICEF), Abdoulaye Ndiaye (WFP), John Ntambi (UNICEF),
                             Gabriel Pons (Oxfam), Jean-Pierre Senghor (SE-CNSA, Senegal), Ollo Sib (WFP), Ousman Tall (SWAC/OECD),
                             Sy Alain Traoré (ECOWAS), Sy Martial Traoré (CILSS) and Sibiri Jean Zoundi (SWAC/OECD).

                             The views expressed herein are those of the author and do not necessarily represent those of
                             OECD member countries or RPCA members.

                             Authorised for publication by Laurent Bossard, Director, SWAC/OECD Secretariat.

                             RECOMMENDED CITATION
                             SWAC/OECD (2020), Food and Nutrition Crisis 2020, Analyses & Responses, Maps & Facts, No. 3, November 2020.

                             Cover photo: Kola Sulaimon, AFP; back cover photo: ACF.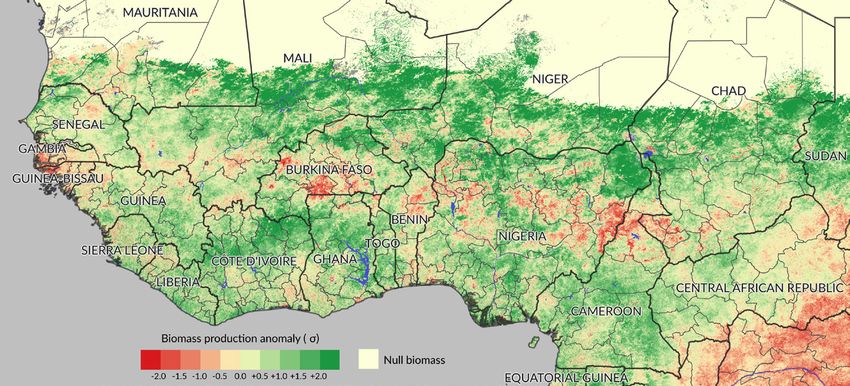
CONTENTS
FOOD & NUTRITION SECURITY TRENDS P. 6                                    AGGRAVATING FACTORS P. 30
•   11.4 million people in “Crisis” or worse situation, March-May 2020   •   Insecurity
•   17 million people in “Crisis” or worse situation, June-August 2020   •   Displacement
•   The Cadre harmonisé analysis                                         •   High food prices
•   Key figures                                                          •   Covid-19 pandemic and related measures
•   Prevalence of severe food insecurity                                 •   Impact of Covid-19 on local food stocks
•   Food insecurity trends over time                                     •   Flooding
                                                                         •   Desert locust threat
ACUTE FOOD INSECURITY HOTSPOTS P. 12
•   Nigeria: 7.1 million acutely food-insecure people
                                                                         NATIONAL RESPONSES P. 38
•   Entrenched conflict in northeast Nigeria                             •   An anticipated response
•   Liptako-Gourma: 2.7 million acutely food-insecure people             •   Revised response plans
•   Recurrent food insecurity                                            •   Example 1: Burkina Faso’s response
•   Burkina Faso: 3.3 million acutely food-insecure people               •   Example 2: Niger’s response
•   Sierra Leone: 1.3 million acutely food-insecure people               •   Example 3: Senegal’s response

MALNUTRITION P. 21                                                       REGIONAL RESPONSES P. 46
•   Acute malnutrition                                                   • ECOWAS response
•   New admissions of malnourished children                              • UEMOA response
•   Morbidity and malnutrition in Nigeria                                • CILSS response
•   Fewer admissions despite high levels of severe acute malnutrition
•   Persisting chronic malnutrition                                      INTERNATIONAL RESPONSES P. 50
                                                                         • Multiple initiatives & co-ordination challenges
PASTORAL SITUATION P. 26                                                 • Ministerial roundtable for the Central Sahel
•   Pastoral communities under strain
•   Biomass situation                                                    REFERENCES P. 52
•   Access to grazing land
•   Transhumance & reduced seasonal mobility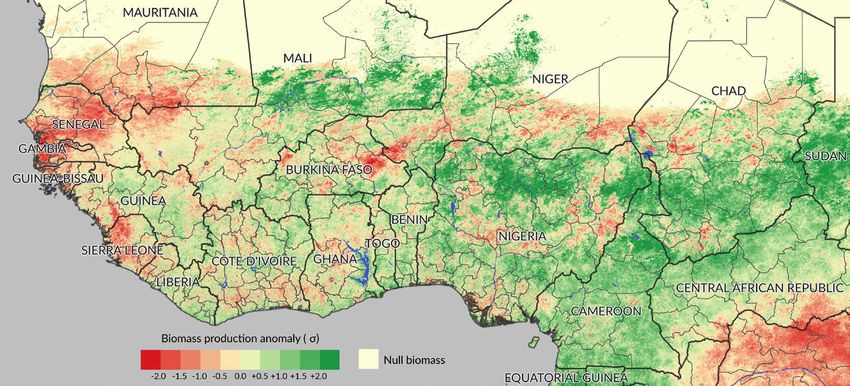
This document, as well as any data and maps included herein, are without prejudice to the status of or sovereignty over any territory,
    to the delimitation of international frontiers and boundaries and to the name of any territory, city or area.

4   Maps & Facts: Food and Nutrition Crisis 2020                                                   © Sahel and West Africa Club Secretariat (SWAC/OECD)
T
        he food and nutrition crisis of 2020           It is important to remember that every year       and destructive floods. All of these elements
        will undoubtedly be remembered                 millions of people are rescued and hundreds       were intertwined, either prompting or
        as one of the most serious in recent           of thousands of children benefit from             exacerbating matters.
decades. Behind the figures that the reader            nutrition programmes. Without the continued
will come across in this brochure there are            mobilisation of all stakeholders, the situation   What lessons can be learned from this
lives at risk, women in distress, and children         would be much worse. However, we cannot           combination of problems and the responses
whose stunted growth is compromising                   be complacent about this observation and          to them?
their prospects of leading a dignified life. All       most importantly, we cannot consider that
serious threats to the future.                         our work is over. This is why we need to          We hope that this brochure will help inform
                                                       improve our understanding of the 2020 crisis.     this discussion. Its content owes much to the
The Members of the Sahel and West Africa                                                                 Members of the RPCA. It reflects the vibrancy
Club (SWAC) and the Food Crisis Prevention             An unusually high number of factors               of this network, which the SWAC Secretariat
Network (RPCA) are concerned. Since the                were triggered simultaneously in a fragile        has supported for over three decades.
severe droughts of the 1970s and 1980s,                environment where chronic malnutrition
hunger has still not been eradicated, despite          is still too prevalent: a paroxysmal security
the considerable financial efforts made by             crisis and massive population displacements,
governments, their regional organisations              a pastoral crisis, serious impediments to
and the international community. These                 the functioning of markets stemming from                       Laurent Bossard
concerns must not allow fatalism to take hold.         violence and the health crisis, price increases        Director, SWAC/OECD Secretariat

© Sahel and West Africa Club Secretariat (SWAC/OECD)                                                            Maps & Facts: Food and Nutrition Crisis 2020   5
FOOD & NUTRITION SECURITY TRENDS
    11.4 MILLION PEOPLE IN “CRISIS” OR WORSE
                                        SAHEL SITUATION,   MARCH-MAY 2020
                                              AND WEST AFRICA:
                                                                                    FOOD AND NUTRITION
                                                                                                Map 1.
                                                                                                       SITUATION
    Some 11.4 million people were estimated                     Food and nutrition situation in the Sahel orand West(phases
                                                                                                                      Africa,3-5)
                                                                                                                              March-May 2020
                                                                            11.4 million people in “Crisis”   worse
    to be in immediate need of assistance
    (phases 3-5) in March-May 2020 in the                                                                       Current situation:
    13 countries analysed in the Sahel and West                                                                 March-May 2020
    Africa region, including 5.1 million in Nigeria,
    1.6 million in Burkina Faso and 1.6 million
    in Niger. The food and nutrition situation                               MAURITANIA
    remains difficult in conflict-affected areas
                                                                                                         MALI
    such as the Liptako‑Gourma area or the Lake                                                                                            NIGER

    Chad basin, particularly in northeast Nigeria,                SENEGAL                                                                                         CHAD
    which accounted for 34% of food insecure
    people in the region. Some areas are still                                 GUINEA
                                                                                                         BURKINA FASO

    not accessible to humanitarian actors, and            GUINEA-BISSAU
                                                                                                                        BENIN
                                                                                                                                                                                    GUINE
                                                                                                                                      NIGERIA
    the situation of people living in these areas                                              CÔTE
                                                              SIERRA LEONE                                  GHANA                                                                       S
    remains unknown. In 2020, Sierra Leone was                                                D’IVOIRE
                                                                                  LIBERIA                                                                                              C
    also among the hotspot countries, mostly                  CABO VERDE
                                                                                                                    TOGO
    due to macro-economic shocks. The food
    and nutrition situation in Liberia deteriorated                                         GAMBIA
    but could not be analysed due to lack of data.

                                                             Phases of food insecurity                                            Partially inaccessible zones     Not analysed        P

                                                               Phase 1: Minimal         Phase 2: Stressed           Phase 3: Crisis       Phase 4: Emergency     Phase 5 : Famine

                                                       Source: Cadre
                                                          Source: Cadreharmonisé   analysis,
                                                                       harmonisé analyses,      regional
                                                                                           regional        concertation
                                                                                                    concertation            meeting,
                                                                                                                 meeting, Niamey, Niger,Niamey, Niger, March
                                                                                                                                        March 2020           2020. Map: © CILSS.
                                                                                                                                                       www.food-security.net          Sou

6   Maps & Facts: Food and Nutrition Crisis 2020
                                                           © 2020. Food Crisis Prevention Network (RPCA), map produced by CILSS/AGRHYMET
                                                                                                              © Sahel and West Africa Club Secretariat (SWAC/OECD)
                                                                                                                                                                                      ©2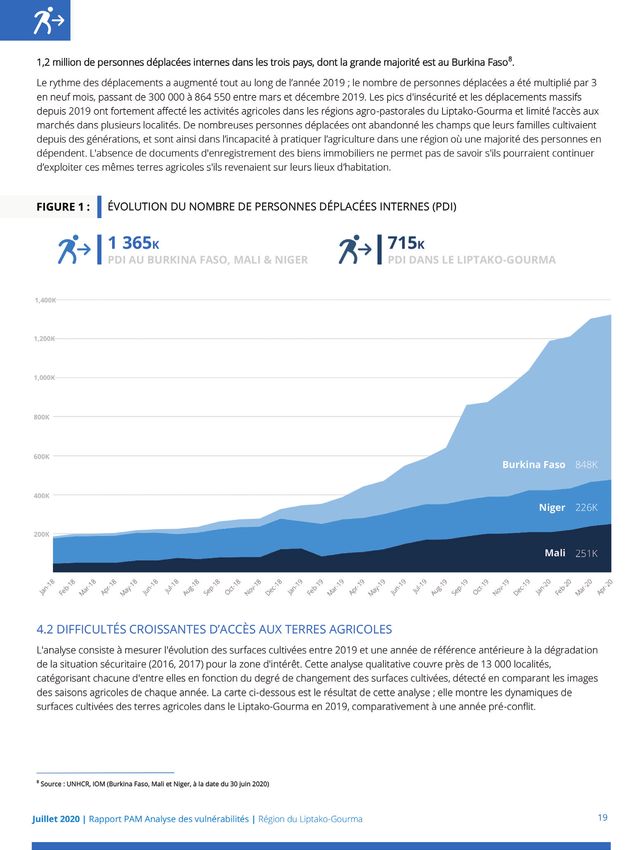
Food & nutrition security trends

      17 MILLION PEOPLE  IN “CRISIS”
                   SAHEL AND          OR WORSE SITUATION, JUNE-AUGUST 2020
                             WEST AFRICA:
                                  FOOD AND NUTRITION OUTLOOK
                                                  Map 2.
                                                                                                                                   According to March 2020 estimates
               Food and
                      17nutrition outlook
                        million people    in thetoSahel
                                       expected         and West
                                                   face “Crisis”    Africa,(phases
                                                                 or worse    June-August
                                                                                   3-5) 2020
                                                                                                                                   (pre-Covid-19), some 17 million people were
                                                           Projected situation:                                                    projected to be in a “Crisis” or worse situation
                                                           June-August 2020                                                        by June-August 2020, including 1.2 million in
                                                                                                                                   emergency (phase 4). This is 5 million people
                                                                                                                                   more than the five-year average (Figure 2). A
                            MAURITANIA                                                                                             partial update of the Cadre harmonisé analysis
                                                      MALI
                                                                                                                                   was conducted in Burkina Faso, Nigeria and
                                                                                          NIGER
                                                                                                                                   Togo in June 2020 (Pages 13 and 19). The
                 SENEGAL                                                                                         CHAD              number of acutely food-insecure people in
                                                                                                                                   Burkina Faso increased from 2.2 million to
                                                      BURKINA FASO
                                                                                                                                   3.4 million people, including 11 400 people
                              GUINEA                                 BENIN
        GUINEA-BISSAU
                                                                                     NIGERIA
                                                                                                                                   facing famine (phase 5). Nigeria recorded an
                                            CÔTE           GHANA
                                                                                                                                   additional 1.55 million food insecure people,
             SIERRA LEONE                  D’IVOIRE
                                                                                                                                   including 669 000 people facing an emergency
            CABO VERDE         LIBERIA
                                                                   TOGO                                                            situation (phase 4). New estimates for Togo
                                                                                                                                   indicated some 280 000 people facing a crisis
                                       GAMBIA                                                                                      (up from less than 4 000 people). The small
                                                                                                                                   coastal country particularly suffered from
                                                                                                                                   the impacts of Nigeria’s border closure and
                                                                                                                                   the effects of Covid-19-related protection
ed          Phases of food insecurity                                            Partially inaccessible zones     Not analysed
                                                                                                                                   measures.
ne             Phase 1: Minimal        Phase 2: Stressed           Phase 3: Crisis       Phase 4: Emergency     Phase 5 : Famine

net   Source: Cadre
         Source: Cadreharmonisé   analysis,
                      harmonisé analyses,      regional
                                          regional        concertation
                                                   concertation            meeting,
                                                                meeting, Niamey, Niger,Niamey, Niger, March
                                                                                       March 2020           2020. Map: © CILSS.
                                                                                                      www.food-security.net
         © 2020. Food Crisis Prevention Network (RPCA), map produced by CILSS/AGRHYMET
      © Sahel and West Africa Club Secretariat (SWAC/OECD)                                                                                Maps & Facts: Food and Nutrition Crisis 2020   7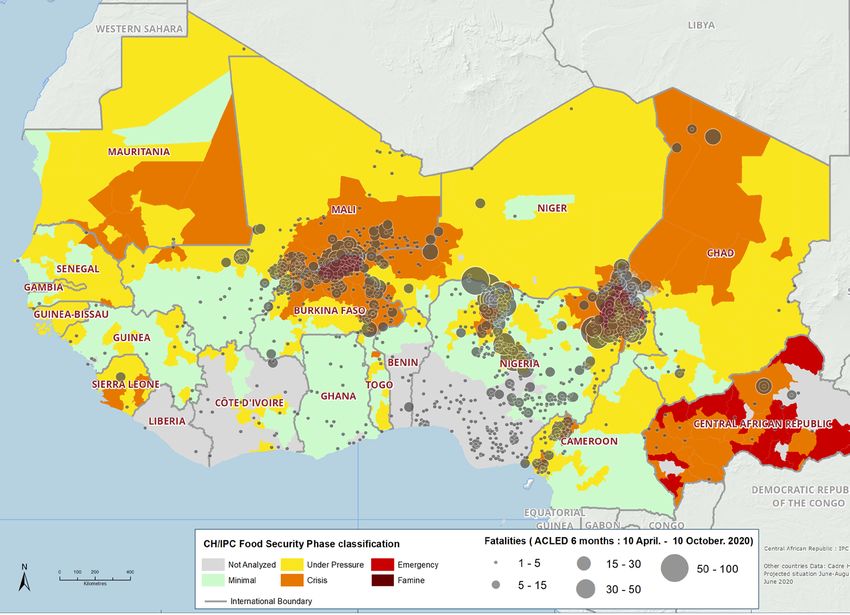
Food & nutrition security trends

    THE CADRE HARMONISÉ ANALYSIS

    KEY FEATURES                                       DATA GAPS & EVOLUTIONS UNDER CH.2                      COMPARABILITY

    The Cadre harmonisé (CH) is the West               Lack of data and information remains a key             While the CH analysis makes an effort of
    African tool for analysing the vulnerability of    challenge, particularly in coastal countries, which    regional data consolidation (a major difference
    populations to food and nutrition insecurity.      heavily rely on proxy indicators. While household      compared with the Integrated Food Security
    Drawing on various information sources and a       surveys on the food consumption and livelihood         Phase Classification - IPC), direct comparison
    common methodology, the analysis identifies        changes are mostly available, improving the            between countries and over different periods
    the number and areas of food insecure people.      reporting process of nutritional data remains a        of time remains nevertheless challenging. The
    They are categorised in 5 phases (minimal,         major challenge in many countries. The reliability     number of people and areas analysed varies
    stressed, crisis, emergency and famine). The       of national analyses is not the same. Moreover,        for some countries within and between years.
    CH analysis feeds into national response           the CH Technical Committee introduced a                This affects the comparability of the number
    plans (Page 38) and informs the decision-          new manual (CH.2), which allows for much               of acutely food-insecure people between
    making bodies of ECOWAS and UEMOA. It also         more accurate estimates of the food situation,         time periods. Comparison over time thus
    provides the basis for requests by member          including inaccessible areas. The sharp increase       indicates a general trend but should be used
    states to trigger the ECOWAS Regional Food         in the number of severely food-insecure people in      with caution.
    Security Reserve (Page 47). At the global level,   some countries can be partially explained by the
    the results of CH analysis serve as a basis for    use of specific protocols covering the situation       FUNDING CHALLENGES
    the preparation of humanitarian appeals.           of people in refugee and internally displaced
    The analysis is conducted twice per year,          persons camps, which were previously not               Lack of funding heavily undermines the ability
    offering an assessment of the current situation    included. Some national analyses (Burkina Faso,        to collect reliable and timely data. During
    (October‑December and March-May) and the           Mali, Niger and Senegal) include capital cities.       the March 2020 cycle, this was particularly
    projected situation (June-August). Updated data    However, the CH tool does not yet address              the case in Benin, Cabo Verde, Ghana,
    is presented during the RPCA meetings in April     systematically the food and nutrition situation        Guinea‑Bissau, Liberia and Mauritania.
    and December. The CH cycle is supported and        of urban areas. Similarly, the CH.2 includes
    co-ordinated by CILSS, in close collaboration      provisions for the analysis of gender dynamics,
    with national governments and partners.            which remains limited because of the lack of
                                                       gender-disaggregated data at household level.
8   Maps & Facts: Food and Nutrition Crisis 2020                                                             © Sahel and West Africa Club Secretariat (SWAC/OECD)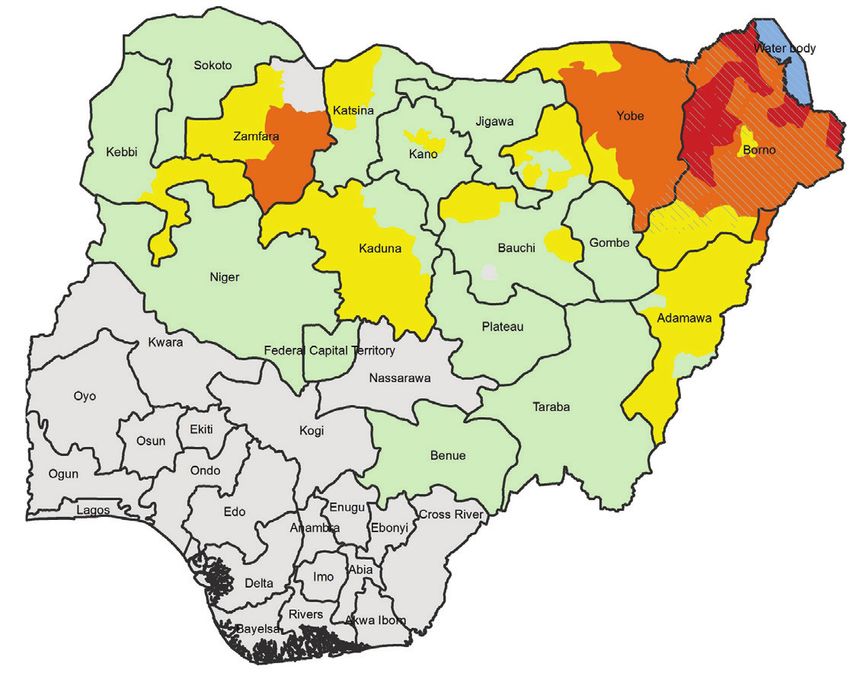
Food & nutrition security trends

KEY FIGURES
                                                                                                   Table 1. Key figures, June-August 2020

The table provides an overview of the
projections of the CH analysis, which have             FOOD & NUTRITION SECURITY OUTLOOK 2020
been reviewed during a regional concertation           Estimated number of people per phase of food and nutrition insecurity, projected situation, June-August 2020
meeting in March 2020 (pre-Covid-19).                                                               Phase 1           Phase 2           Phase 3          Phase 4          Phase 5            Phases 3-5
                                                         Country                Population
                                                                                 analysed           # people         # people          # people          # people         # people        # people         %
    No country was initially projected
                                                        Benin   *                   8 154 221         7 344 140          795 504            14 578                   -                -        14 578      0.2
     to face famine (phase 5); however,
                                                        Burkina Faso**            21 398 997        14 093 370         5 153 661         2 015 791           136 175                  -    2 151 966      10.1
     the CH June update for Burkina Faso                Cabo Verde                    481 155           405 622            65 521           10 012                   -                -        10 012      2.1
     identified 11 400 people in phase 5                Chad                      14 640 810        10 543 253         3 080 199           882 474           134 884                       1 017 358       7.0
    At least 1.2 million people in the                 Côte d’Ivoire*              6 181 235         5 111 105          901 732           168 398                   -                -      168 398       2.7
                                                        Gambia (The)                2 455 843         1 763 268          555 988           136 586                   -                -      136 586       5.6
     region were set to be in an emergency
                                                        Guinea                    10 259 872          8 573 522        1 419 134           267 170                   -                -      267 170       2.6
     situation (phase 4)                                Guinea-Bissau               1 298 279           913 459          317 053            67 767                   -                -        67 767      5.2
    Six countries (Burkina Faso, Chad,                 Ghana                     28 552 702        26 726 375         1 804 615            21 712                   -                -        21 712      0.1
     Mali, Niger, Nigeria and Sierra Leone)             Mali**                    20 537 000        15 541 372         3 654 887         1 210 866           129 874                  -    1 340 740       6.5
                                                        Mauritania                  4 173 047         2 764 040          799 826           542 194            66 986                  -      609 180      14.6
     counted more than 1 million people
                                                        Niger**                   22 140 083        15 109 102         5 018 614         1 950 608            61 758                  -    2 012 366       9.1
     in a “Crisis” or worse situation                   Nigeria***               103 042 030        76 709 687        19 245 241         6 543 645           543 458                  -    7 087 103       6.9
     (phases 3-5)                                       Senegal                   16 705 590        12 468 577         3 470 287           757 851             8 874                  -      766 725       4.6
    51 million vulnerable people (phase 2)             Sierra Leone                8 260 417         2 912 022        4 043 410         1 231 462            73 523                  -    1 304 985      15.8
                                                        Togo                        5 768 550         5 311 876          453 115              3 560                  -                -         3 560      0.1
     required close monitoring as they were
                                                        Total                    274 049 831       206 290 790        50 778 787        15 824 674         1 155 532                  -   16 980 206       6.2
     at risk of falling into a crisis situation
    More than 1 out of 10 people was                  * Liberia as well as several areas of Benin and Côte d’Ivoire were not included due to lack of data.
                                                       Source: Cadre harmonisé analysis, regional concertation meeting, Niamey, Niger, March 2020
                                                       ** Some areas of Burkina Faso, Mali and Niger were inaccessible.
     severely food insecure in Burkina Faso,           * Liberia as well as several areas of Benin and Côte d’Ivoire were not included due to lack of data.
                                                       ***  In Nigeria,     the analysis
                                                       ** Some    areas in Burkina  Faso, Malicovers   16were
                                                                                               and Niger   of the    36 federal states as well as the Federal Capital Territory (FCT).
                                                                                                               inaccessible.
     Mauritania and Sierra Leone                            Some
                                                       *** In Nigeria,areas   in Borno
                                                                       the analysis        State
                                                                                    covers 16  of thewere  inaccessible.
                                                                                                     36 federal states as well as the Federal Capital Territory (FCT). Some areas in Borno State were inaccessible.

     (prevalence >10%)
                                                       Source: Cadre harmonisé analysis, regional concertation meeting, Niamey, Niger, March 2020.

© Sahel and West Africa Club Secretariat (SWAC/OECD)                                                                                              Maps & Facts: Food and Nutrition Crisis 2020                        9
Food & nutrition security trends
PREVALENCE OF SEVERE FOOD INSECURITY
When looking at the regional overview, it is Figure 1.
important to distinguish between absolute Prevalence and absolute number of people in “Crisis” or worse situation
numbers and the level of prevalence of severe in most affected countries and northeast Nigeria, June-August 2020
food insecurity. High numbers of people in
“Crisis” or worse situation (phase 3-5) do . Number of people in “Crisis” or worse (million) 7.1 M
.
Level of prevalence %
Regional average
not always mean high prevalence. Nigeria,
for example, has an average prevalence of
6 30
6.9%, close to the regional average of 6.2%.
However, prevalence largely varies within
the country. The three crisis-affected States
in the northeast (Adamawa, Borno and Yobe) 4 20
have very high levels of prevalence of severe
food insecurity: nearly one out of three people
needs emergency assistance. The northern .
2.2 M
.
2M
2 .
1.8 M 10
regions of Burkina Faso reached the highest
prevalence level of 52% in the region (June CH
1M
. .
1.3 M
.
1.3 M
.
1.2 M
update). Sierra Leone is the country with the 6.2% 10.1% 7.0% 6.5% 9.1% 15.8% 6.9%
.
0.7 M
13.8% 31.3% 27.2%
highest national prevalence level (15.8%). 0 0
o d li r e *
wa ** be
Given its small population size, it is, however, as ha Ma ge on r ia no Yo
aF C Ni Le ge m
a r
usually not quoted among the acute food ki
n
rr
a Ni Ad
a Bo
insecurity hotspots. At the regional level, B ur S ie
Sierra Leone ranked position 5 of countries * In Nigeria, the analysis covers 16 of the 36 federal states as well as the Federal Capital Territory (FCT).
with the largest number of people requiring ** Some areas in Borno State were inaccessible.
urgent support.
Source: Cadre harmonisé analysis, regional concertation meeting, Niamey, Niger, March 2020;
author’s calculation. Figure: © SWAC/OECD.
10 Maps & Facts: Food and Nutrition Crisis 2020 © Sahel and West Africa Club Secretariat (SWAC/OECD)4
2 Food & nutrition security trends
0
FOOD INSECURITY TRENDS OVER TIME2016-17
2015-16 2017-18 2018-19 2019-20
October-December March-May June-August
The number of acutely food-insecure people Figure 2.
has increased over the past five years, Number of people in “Crisis” or worse situation in the Sahel and West Africa over time
mostly due to insecurity and large-scale
displacement in conflict-affected countries. Million
The increase is also due to economic shocks
18 17 M
and extreme climate events in some countries
as well as to Covid‑19‑related impacts in 16
13.3 M
2020. Figure 2 illustrates the region’s typical 14
seasonal variations, which are marked by the 12 11.4 M
10.6 M
9.5 M 9.6 M 9.5 M
precarious lean season in Sahelian countries 10
(June-August), a three-month period 8 6.7 M 7.1 M
between two harvests when food stocks are 6 6.7 M
depleted. The food situation usually improves 4
once new harvests become available. The
2
2020 food and nutrition crisis reaches a new
0
peak of food insecurity in the region. Between
2016 2017 2018 2019 2020
2016-20, the region counted on average about
8.3 million acutely food-insecure people in March-May June-August
March-May June-August
March-May and 12 million in June-August.
The number of food insecure people requiring Note: Comparison over time indicates a general trend but should be used with caution as regional
urgent assistance in 2020 is far above the coverage and methodology may vary significantly (Page 9).
5-year average and doubled in many countries
compared to 2019. These estimates do not Source: Cadre harmonisé analysis, 2016-20, March data; author’s calculation. Figure: © SWAC/OECD.
yet take into account the negative impacts of
Covid-19-related lockdowns on the urban poor.
© Sahel and West Africa Club Secretariat (SWAC/OECD) Maps & Facts: Food and Nutrition Crisis 2020 11ACUTE FOOD INSECURITY HOTSPOTS
NIGERIA: 7.1 MILLION ACUTELY FOOD-INSECURE PEOPLE
Map 3.
Food and nutrition situation in Nigeria, June-August 2020, projected situation
Nigeria alone accounts for 42% of the region’s
total number of acutely food-insecure
people. In terms of absolute numbers,
Nigeria ranked among the world’s 10 worst
food crises in 2019, with 5 million food
insecure people. One year on, according to
the CH national analysis (March 2020), some
5.1 million people were still in immediate
need of assistance (phases 3-5) in March-May
2020, including 1.4 million in Borno State,
1 million in Yobe State and 0.5 million
in Adamawa State. The number of food
insecure people has increased by 1.1 million
people since October-December 2019. By
June-August 2020, 7.1 million people were
estimated to be in a “Crisis” or worse situation
(phases 3-5).
Phases of food insecurity Partially inaccessible zones Not analysed
Phase 1: Minimal Phase 2: Stressed Phase 3: Crisis Phase 4: Emergency Phase 5: Famine
Source: Cadre harmonisé national analysis, Abuja, Nigeria, March 2020. Map: © CILSS.
12 Maps & Facts: Food and Nutrition Crisis 2020 © Sahel and West Africa Club Secretariat (SWAC/OECD)Acute food insecurity hotspots
A WORSENING SITUATION Ü Table 2. CH updates on the food & nutrition situation in Nigeria, June-August 2020
ESTIMATES NOVEMBER 2019 MARCH 2020 JUNE 2020
An update of the CH analysis was prepared
in June 2020 covering four states (Adamawa, Number of food insecure people 5.94 million 7.10 million 8.65 million
(phases 3-5)
Borno, Kano and Yobe). It analysed the
impacts of the unfolding health crisis in the Source: Cadre harmonisé national analyses, Abuja, Nigeria, November 2019, March 2020 and June 2020.
context of the extremely fragile environment
of northeast Nigeria and the strategic Nigeria’s overall situation is worse. Its urban
importance of Kano State as a commercial south has been heavily affected by the GROWING SCOPE OF ANALYSIS
hub in northwest Nigeria. According to the negative consequences of Covid-19-related The CH analysis was conducted by CILSS, the
June update, some 8.65 million Nigerians lockdowns and reduced intra-regional Government of Nigeria as well as partners. It
were in a “Crisis” or worse situation trade with neighbouring countries. Nigeria’s covered 16 out of 36 federal states and the
(phases 3-5) in June‑August 2020. This means border closure with Benin and Niger (since Federal Capital Territory (FCT): Adamawa,
that 2.7 million additional people required August 2019) contributed to pushing up food Bauchi, Benue, Borno, Gombe, Jigawa,
urgent humanitarian assistance compared prices (Page 32). Preventive measures to Kaduna, Kano, Katsina, Kebbi, Niger, Plateau,
to the initial estimate of November 2019 control the spread of the Covid-19 pandemic Sokoto, Taraba, Yobe and Zamfara. For the
(Table 2). One out of two food insecure heavily affected informal workers in the first time, four completely inaccessible
Nigerians lives in northeast Nigeria. However, urban economy. Nigerians heavily depend on local government areas (LGAs) of Borno
the number of people in a “Crisis” situation purchasing food on markets and its food prices State were analysed via remote surveys and
(phase 3) also sharply increased in the state of are among the highest in West Africa. According land observation tools (Abadam, Guzamala,
Kano from 578 000 people (March estimates) to a survey of the National Bureau of Statistics, Kukawa and Marte). The security situation
to 1.4 million people (June update). The rising Nigerians spend on average about 56.7% of remains highly volatile. Key stakeholders in
figures reflect the combined impact of the their household expenditures on food items. Nigeria called for rapid and co-ordinated
security and the health crises. The estimates The full extent of food insecurity in Nigeria is deployment of food and humanitarian
offer only a partial picture as the CH analysis yet unknown. assistance in areas with limited humanitarian
covers only about half of Nigeria’s population access, including military operations to open
(111 million people). up access to vulnerable populations.
© Sahel and West Africa Club Secretariat (SWAC/OECD) Maps & Facts: Food and Nutrition Crisis 2020 13Acute food insecurity hotspots
ENTRENCHED CONFLICT IN NORTHEAST NIGERIA
Map 4.
Northeast Nigeria has been struggling with the Between 2016-20, northeast Nigeria counted on Food and nutrition situation
Islamist insurgency since 2008. Violent conflictaverage some 3.7 million people in urgent need in northeast Nigeria: 4.3 million people
has severely weakened fragile livelihoods of humanitarian and food assistance every year. in “Crisis” or worse situation
resulting in a deep humanitarian crisis. The states
The number of acutely food-insecure people
of Adamawa, Borno and Yobe recorded very high reached a peak in Borno in June-August 2017 Projected situation: June-August 2020
levels of food insecurity over the past decade (3.7 million people). RPCA members already
(Figure 3). Food insecurity has become a chronicsounded the alarm in December 2016 and
problem. Large-scale population displacement released a declaration to encourage international
negatively impacted livelihood activities withinpartners to develop more structural responses
displaced and host community households. based on a long-term vision and a recovery plan
for these conflict-affected areas.
Figure 3.
Number of people in “Crisis” or worse situation in northeast Nigeria, June-August 2016-20
Million 5-year average
3 Phases of
food insecurity
2.1 million
Phase 1: Minimal
2
Phase 2: Stressed
1 million Phase 3: Crisis
1 0.6 million Phase 4: Emergency
Phase 5: Famine
0 Partially
2016 2017 2018 2019 2020 2016 2017 2018 2019 2020 2016 2017 2018 2019 2020 inaccessible zones
Adamawa Borno Yobe
Source : Cadre harmonisé national analysis,
Source: Cadre harmonisé national analysis, Abuja, Nigeria, March 2016-20; author’s calculation. Abuja, Nigeria, March 2020. Map: © CILSS.
Figure: © SWAC/OECD.
14 Maps & Facts: Food and Nutrition Crisis 2020 © Sahel and West Africa Club Secretariat (SWAC/OECD)Acute food insecurity hotspots
Figure 4. Number of people in “Crisis” or worse situation in northeast Nigeria, June-August 2020 (CH June update)
ADAMAWA BORNO YOBE
facing a “Crisis” or worse situation 2.1M are facing a “Crisis” or worse situation 1.3M are facing a “Crisis” or worse situation
910K orare18.4% of the population analysed, or 35.8% of the population analysed, or 29.7% of the population analysed,
(phases 3-5) (phases 3-5) (phases 3-5)
2.0% 7.4% 3.2%
16.4% 24.9%
28.4% 26.5% 34.1%
47.8%
33.8% 4.9M 5.9M 4.3M
39.1% 35.2%
FOOD AND NUTRITION SITUATION IN NORTHEAST NIGERIA
Estimated number of people per phase of food and nutrition insecurity, projected situation, June-August 2020
Population Phase 1 Phase 2 Phase 3 Phase 4 Phase 5 Phases 3-5
State analysed # people # people # people # people # people # people %
Adamawa 4 946 724 2 366 919 1 670 980 813 429 95 396 - 908 825 18.4
Borno 5 884 116 1 465 472 2 298 249 1 671 264 433 498 - 2 104 762 35.8
Yobe 4 340 967 1 481 144 1 529 710 1 148 068 139 034 - 1 287 103 29.7
Total 15 171 807 5 313 535 5 498 939 3 632 761 667 928 - 4 300 689 28.3
Source: Cadre harmonisé national analysis, Abuja, Nigeria, June 2020; author’s calculation. Figure: © SWAC/OECD.
© Sahel and West Africa Club Secretariat (SWAC/OECD) Maps & Facts: Food and Nutrition Crisis 2020 15Acute food insecurity hotspots
LIPTAKO-GOURMA: 2.7 MILLION ACUTELY FOOD-INSECURE PEOPLE
The Liptako-Gourma area – composed of Map 5. Food and nutrition situation in the Liptako-Gourma area, June-August 2020
border areas of Burkina Faso, Mali and Niger –
is the second acute food insecurity hotspot in
the region. While geographic definitions may
vary, the border areas of these three countries
concentrate a disproportional large share of
severely food-insecure people compared to
the rest of their respective territories. Nearly
half of the food insecure people of the three
countries (2.7 million out of 5.5 million
people) live in this area. According to the
CH June update of Burkina Faso (Page 19),
the number of people in “Crisis” or worse
situation in Burkina Faso’s northern areas
increased by nearly 400 000 people, notably
in the Sahel region. This brings the total
number of people in need of emergency Phases of food insecurity Partially inaccessible zones Not analysed
assistance to over 3 million people. Acute
Phase 1: Minimal Phase 2: Stressed Phase 3: Crisis Phase 4: Emergency Phase 5: Famine
food insecurity worsened primarily because
of increasing insecurity and violence in cross- Burkina Faso : Centre-Nord (Bam, Namentenga and Sanmatenga); Nord (Loroum, Yatenga)
border areas, including terrorist attacks on and Sahel (Oudalan, Seno, Soum and Yagha)
civilian populations. Some 3 242 security Mali : Gao (Ansongo, Bourem, Gao), Ménaka, Mopti (Bandiagara, Bankass, Djenné, Douentza, Koro,
Mopti, Tenenkou, Youwarou) and Timbuktu (Diré, Gourma Rharous and Niafunké)
incidents have been reported since 2014 and
Niger : Tahoua (Tahoua, Tassara and Tilia) and Tillabéri (Abala, Ayerou, Banibangou, Bankilaré, Filingué,
nearly 10 000 people have died (WFP, 2020).
Gotheye, Ouallam, Téra and Tillabéri)
The persistent security crisis triggered
massive internal displacement (Page 31). Source: Cadre harmonisé national analyses of Burkina Faso, Mali and Niger, March 2020.
16 Maps & Facts: Food and Nutrition Crisis 2020 © Sahel and West Africa Club Secretariat (SWAC/OECD)Acute food insecurity hotspots
Figure 5. Number of people in “Crisis” or worse situation in the Liptako-Gourma area, June-August 2020
BURKINA FASO MALI NIGER
CENTRE-NORD, NORD AND SAHEL* GAO, MÉNAKA, MOPTI & TIMBUKTU* TAHOUA AND TILLABÉRI*
facing a “Crisis” or worse situation 813K are facing a “Crisis” or worse situation 486K are facing a “Crisis” or worse situation
1.4M orare32.5% of the population analysed, or 19.3% of the population analysed, or 15.7% of the population analysed,
(phases 3-5) (phases 3-5) (phases 3-5)
2.9% 2.5% 1.2%
16.8% 14.5%
29.6% 32.7% 48.9% 59.8%
4.3M 31.8%
4.2M 24.5%
3.1M
34.8%
FOOD AND NUTRITION SITUATION IN THE LIPTAKO-GOURMA AREA
Estimated number of people per phase of food and nutrition insecurity, projected situation, June-August 2020 * Definition of Page 16
Population Phase 1 Phase 2 Phase 3 Phase 4 Phase 5 Phases 3-5
Border areas* analysed # people # people # people # people # people # people %
Burkina Faso 4 262 778 1 395 000 1 482 894 1 262 105 122 780 - 1 384 884 32.5
Mali 4 204 817 2 055 203 1 336 657 706 735 106 223 - 812 958 19.3
Niger 3 090 874 1 848 001 757 095 446 445 39 333 - 485 778 15.7
Liptako-Gourma 11 558 468 5 298 203 3 576 644 2 415 285 266 313 - 2 683 619 23.2
Source: Cadre harmonisé national analyses of Burkina Faso, Mali and Niger, March 2020; author’s calculation. Figure: © SWAC/OECD.
© Sahel and West Africa Club Secretariat (SWAC/OECD) Maps & Facts: Food and Nutrition Crisis 2020 17Acute food insecurity hotspots
RECURRENT FOOD INSECURITY
The Liptako-Gourma area has become Figure 6. Number of acutely food-insecure people in the Liptako-Gourma area
chronically food insecure. Over the (phases 3-4), June-August 2014-20
past seven years, this cross-border area
counted on average about 1.43 million Million 7-year average
people per year in need of humanitarian 3
2.67
food assistance, including 114 000 people
facing an emergency situation. Moreover, 2.5 0.27
every year during the lean season, about
2
4 million additional people are under stress 1.65
(phase 2). As a result, nearly half of the 1.5 0.26 1.43 million 1.50 1.50
people in the border areas of Burkina Faso,
Mali and Niger face a difficult situation every 1 0.94 0.89
0.84
year, which requires continuous external
support. To date, one out of four people in 0.5
the Liptako‑Gourma area depends on food 1.39 0.80 0.93 0.86 1.38 1.43 2.40
assistance. This sour situation highlights the 0
2014 2015 2016 2017 2018 2019 2020
need for long-term, structural investments in
this fragile cross‑border area. Phase 3: Crisis Phase 4: Emergency
Source: Cadre harmonisé national analyses of Burkina Faso, Mali and Niger, March 2020 and the
Global Report on Food Crisis 2020 for 2014-19 data, p. 41; author’s calculation. Figure: © SWAC/OECD.
18 Maps & Facts: Food and Nutrition Crisis 2020 © Sahel and West Africa Club Secretariat (SWAC/OECD)Acute food insecurity hotspots
BURKINA FASO: 3.3 MILLION ACUTELY FOOD-INSECURE PEOPLE
According to the CH June 2020 update taking Map 6. Number of people in “Crisis” or worse situation in Burkina Faso, June-August 2020
into account the deteriorating security situation,
high levels of acute malnutrition and Covid-19- Current situation (CH June update)
related impacts, the number of people in “Crisis”
→ 2 760 000 people facing a crisis
or worse situation has more than doubled in → 507 500 people in an emergency
Burkina Faso from 1.6 million (CH March) to → 11 400 people facing famine
3.3 million. The provinces of the Sahel region
– Ouadalan and Soum – were driven into an
emergeny phase. In June-August 2020, some
6 100 and 5 300 people respectively faced
famine (phase 5) making the situation worse
than in northeast Nigeria. One out of two people
was in need of emergency assistance. Despite
the ongoing humanitarian response, additional
support is urgently needed (Page 51).
3.3M or 15.7% of the population
analysed, are facing a “Crisis” or
worse situation(phases 3-5)
2.4%
12.9% 0.05%
60.45%
Phases of food insecurity Partially inaccessible zones Not analysed
21.4 M Phase 1: Minimal Phase 2: Stressed Phase 3: Crisis Phase 4: Emergency Phase 5: Famine
24.2% Source: Cadre harmonisé national analysis, Ouagadougou, Burkina Faso, June 2020. Map: © CILSS.
© Sahel and West Africa Club Secretariat (SWAC/OECD) Maps & Facts: Food and Nutrition Crisis 2020 19Acute food insecurity hotspots
SIERRA LEONE: 1.3 MILLION ACUTELY FOOD-INSECURE PEOPLE
Map 7 & Figure 7.
This small coastal country is also among Number of people in “Crisis” or worse situation in Sierra Leone, June-August 2020
the hotspot countries in 2020, exceeding
1 million food-insecure people, mainly Projected situation: June-August 2020 SIERRA LEONE
in the districts of Bonthe, Kenema and
Moyamba. Considering its small population 1.3M orare15.8% of the population analysed,
facing a “Crisis” situation
size (8.3 million people), Sierra Leone or worse (phases 3-5)
is the country with the highest national
prevalence rate of acutely food-insecure 0.9%
people (15.8%). Nearly half of its population 14.9%
is “Stressed” (phase 2). Following the Ebola
crisis in 2014-16, Sierra Leone remains fragile
35.3%
to internal and external shocks. In 2019,
8.3M
economic shocks were the main driver of food
insecurity. The national currency depreciated
by 10% compared to 2018 levels (CILSS, 2019).
48.9%
Sierra Leone also recorded a decline of
15% in its cereal production, compared to
the five-year average, due to unfavourable Phases of food insecurity Partially inaccessible zones Not analysed
weather conditions, increasing the country’s Phase 1: Minimal Phase 2: Stressed Phase 3: Crisis Phase 4: Emergency Phase 5: Famine
dependency on imported foodstuffs. Many
small-scale farming households adopted Source: Cadre harmonisé national analysis, Freetown, Sierra Leone, March 2020. Map: © CILSS.
negative coping strategies such as reduced
or irregular food consumption, consumption Severe acute malnutrition (SAM) of children
of seeds meant for planting, etc. According to under five years of age reached a peak
the FAO, in March 2020, 60% of households in June 2020; some 88 500 children were
spent over 65% of their income on food. admitted for SAM treatment (Page 22).
20 Maps & Facts: Food and Nutrition Crisis 2020 © Sahel and West Africa Club Secretariat (SWAC/OECD)MALNUTRITION
ACUTE MALNUTRITION Map 8. Global acute malnutrition in the Sahel and West Africa, November 2020
Acute malnutrition persists throughout the
region, particularly in Sahelian countries where
the prevalence of global acute malnutrition
(GAM) regularly exceeds a threshold of 10%
(labelled “high”, WHO). In early 2020, more than
8.1 million GAM cases were expected among
children under 5 years of age in these countries,
including an estimated 2.5 million severe
acute malnutrition (SAM) cases. According to
revised estimates (UNICEF/WFP, May 2020),
the number of GAM cases could increase by
20% in the context of the Covid-19 pandemic
(socio-economic impact on households and
food systems, as well as a reduced coverage
of basic nutrition services). According to
UNICEF estimates, the coverage of nutrition
services during the early phase of the pandemic Acceptable: < 5 % Poor: 5 < 10% Serious: 10< 15 % Critical: > 15% Not analysed
was reduced by approximately 30%. These
disruptions have reached a much higher level Source: CH Technical Committee, November 2020, including national representatives and partners (AFD,
in countries under lockdown measures and in ACF, CILSS, ECOWAS, EU, FewsNet, Save the Children, Oxfam, UNICEF, USAID and WFP). Map: © CILSS.
conflict-affected countries, where nutrition
services were sometimes completely disrupted. the nutritional situation of millions of women curative services to ensure the continuity of
Massive population displacements, limited and children. While key stakeholders in the nutritional services, disruptions are already
access to basic social services and increasingly nutrition sector have adapted preventive and being observed.
restricted humanitarian access have worsened
This text was prepared on the basis of a contribution from UNICEF/West And Central Africa Regional Office.
© Sahel and West Africa Club Secretariat (SWAC/OECD) Maps & Facts: Food and Nutrition Crisis 2020 21Malnutrition
NEW ADMISSIONS OF MALNOURISHED CHILDREN
Figure 8. Admissions, moderate and severe acute malnutrition, January-August 2020
According to data collected by CILSS from
seven Sahelian and coastal countries, more Children
than a million malnourished children were 400 000 379 300
admitted for moderate and severe acute 350 000
304 490
malnutrition treatment between January 300 000
and August 2020. The majority of cases were 250 000
recorded in Chad, Niger and Nigeria. Coastal 200 000
countries such as Benin, The Gambia, Ghana, 150 000 121 400
96 280
Senegal and Togo had less than 10 000 new 100 000
54 860 56 380
admissions. However, improving the 50 000 21 600
reporting process of nutritional data within 0
Burkina Faso Chad Mali Mauritania Niger Nigeria* Sierra Leone
national health information systems remains
a major challenge in most of these countries. Moderate Acuteacute
Moderate Malnutrition (MAM)
malnutrition (MAM) SevereSevere Acute(SAM)
acute malnutrition Malnutrition (SAM) *Partial coverage
Source: CILSS (2020), Impact of the Covid-19 pandemic on food and nutrition security, No. 1-5, author’s
DEFINITIONS calculations. Figure: © SWAC/OECD.
The weight and height of children under 59 months are used as proxy measures for the general health of the entire population.
Weight-for-height (WFH - wasting) provides the clearest picture of acute malnutrition in a population at a specific point in time.
Moderate Acute Malnutrition (MAM) Severe Acute Malnutrition (SAM) Global Acute Malnutrition (GAM)
is identified by moderate wasting: is identified by severe wasting: is the presence of both MAM and SAM
WFH < -2 z-score and > 3 z-score for children WFH < -3 z-score for children 0-59 months in a population. High prevalence rates
0-59 months (or for children 6-59 months, (or for children 6-59 months, MUAC < 115 mm) outside of the seasonal norm are
MUAC < 125 mm and > 115 mm). or the presence of bilateral pitting edema. particularly worrisome. A GAM rate of
more than 10% indicates an emergency.
Source: WHO, UNHCR, IFRC, WFP (2000), The management of nutrition in major emergencies.
22 Maps & Facts: Food and Nutrition Crisis 2020 © Sahel and West Africa Club Secretariat (SWAC/OECD)Malnutrition
MORBIDITY AND MALNUTRITION IN NIGERIA
From 1 June to 20 July 2020, the Government across northern Nigeria. Figure 9 illustrates Table 3.
of Nigeria reported some 311 000 new child increasing rates of malnutrition during the Ü Morbidity & malnutrition in Nigeria Ü
admissions across the 16 analysed states and country’s typical seasonal food insecurity.
1 June - 20 July 2020, number of admission cases
the Federal Capital Territory (FCT) (Table 3). Limited food availability during the lean
STATE MORBIDITY SAM MAM
The states of Jigawa (42%), Borno (23%) and season reduces the purchasing power of
Adamawa 7 948 1 141 1 197
Niger (16%) counted the highest levels of caregivers and affects their capacity to
Bauchi 4 968 1 954 229
morbidity. The majority of health facilities access nutritious and safe quality foods for
Benue 387 56 37
in charge of treatment of children with their children.
Borno 54 881 7 740 8 630
acute malnutrition remained operational FCT 758 339 101
Figure 9. Admissions, moderate and severe acute malnutrition, Nigeria*, January-August 2020 Gombe n/a 2 253 n/a
Jigawa 100 565 4 076 n/a
Children 112 522 Kaduna n/a 2 737 n/a
Kano 22 245 17 514 497
100 000 Katsina n/a n/a n/a
74 527 74 224 Kebbi 2 291 1 439 1 206
80 000 Niger 38 770 2 060 n/a
Plateau 2 138 28 371
60 000
Sokoto n/a 1 620 7 896
43 219
Taraba 1 735 n/a n/a
40 000
Yobe n/a 9 952 1 151
20 000 Zamfara n/a n/a n/a
Total 236 686 52 909 21 315
0
Source: Government of Nigeria, CILSS, FAO (2020).
January-May June July August Impact of Covid-19 on food and nutrition security
Moderate Acute Malnutrition (MAM) Severe Acute Malnutrition (SAM) in the 16 Cadre harmonisé States of Nigeria and FCT,
*Partial coverage report No. 4, July 2020.
Source: CILSS (2020), Impact of the Covid-19 pandemic on food and nutrition security, No. 1-5, Figure: © SWAC/OECD.
© Sahel and West Africa Club Secretariat (SWAC/OECD) Maps & Facts: Food and Nutrition Crisis 2020 23Malnutrition
FEWER ADMISSIONS DESPITE HIGH LEVELS OF SEVERE ACUTE MALNUTRITION
Although the full impact of Covid-19 on the Map 9. SAM admission trends, annual variation (2019), January-September 2020
nutritional situation is not yet known, significant
disruptions of nutritional services have already
been observed. For example, vitamin A
supplementation coverage, targeting children BURKINA FASO
aged 6-59 months, decreased by 75% in the first MAURITANIA
semester of 2020 compared to the same period
MALI NIGER
in 2019. According to 2020 nutrition survey data CHAD
from Burkina Faso and Niger, the nutritional
situation has clearly deteriorated in these
countries. In the six Sahelian countries (Burkina
SENEGAL BENIN
Faso, Chad, Mali, Mauritania, Niger and Senegal), a
total of 718 629 children (6-59 months) with severe NIGERIA
acute malnutrition were admitted in specialised SIERRA LEONE
health facilities for SAM treatment from January LIBERIA TOGO Not analysed
to September 2020. This represents about half of
the estimated number of expected SAM cases in - 100 to -70% -70 to -40%-70 to -40%
- 100 to -70%
-40 to 0%
-40 to 0%
0-40%
0-40%
> 40-80% > 80%
> 40-80% > 80%
2020 (UNICEF/WFP, May 2020). According to data
Source: National ministries of health and sanitation, October 2020. Map: © UNICEF.
from national ministries of health, the number
of SAM admissions in the six Sahelian countries resulted in movement restrictions, cancellations is needed to maintain, scale up and accelerate
has decreased by 10% compared to the same of certain mass activities, as well as a reduced the delivery of services for the benefit of the most
period in 2019. Mauritania is the only country frequentation of health services by community vulnerable populations. More than ever, it is vital
that recorded an increase (+ 5.8%) of new SAM members for fear of being contaminated. More to strengthen multi-sectoral approaches aimed
admissions. The Sahel’s downward trend could analysis needs to be conducted in order to at protecting the nutritional status of women and
be explained by the direct effects of Covid-19- better understand these trends. In response to children in order to prevent any deterioration in
related preventive measures, which have the new realities, an operational paradigm shift their nutritional situation.
This text was prepared on the basis of a contribution from UNICEF/West And Central Africa Regional Office.
24 Maps & Facts: Food and Nutrition Crisis 2020 © Sahel and West Africa Club Secretariat (SWAC/OECD)Malnutrition
PERSISTING CHRONIC MALNUTRITION
Map 10 . Prevalence of stunting (% of children, 0-5 years)
Nearly 20 million children under 5 years
of age suffer from chronic malnutrition. 2000-06
While the prevalence rate has decreased 2000-06
in some countries, the absolute number of
stunted children has increased more than MAURITANIA
35%
anywhere else in the world. About one-third MALI
38% NIGER
of adolescent girls have their first baby SENEGAL
50%
CHAD
16% 41%
before the age of 18, and about half of them THE GAMBIA
BURKINA FASO
22%
suffer from anaemia. Early marriage and the GUINEA- GUINEA
35%
BENIN
BISSAU 35% NIGERIA
high number of pregnancies contribute to 41%
SIERRA LEONE CÔTE
38%
TOGO 38%
D’IVOIRE GHANA 24%
increasing the malnutrition that is transmitted 40%
LIBERIA 34% 22%
from generation to generation. Other 39%
forms of malnutrition (overweight, obesity,
diet-related non-communicable diseases) are 2014-19
2014-19
amplifying existing challenges. Malnutrition
is a chronic situation in the region, which MAURITANIA
requires interventions addressing the 22.8%
MALI
26.9% NIGER
structural causes. In the Banjul Declaration 48.5% CHAD
SENEGAL
(December 2018), RPCA members call for a THE GAMBIA
18.8% 39.8%
13.6% BURKINA FASO
strong mobilisation of all stakeholders to take GUINEA- GUINEA
24.9%
BISSAU BENIN
long-term measures to reverse negative and 27.6%
30.3% 32.2% NIGERIA
SIERRA LEONE CÔTE TOGO 36.8%
destructive nutritional trends, based on a 29.5%
D’IVOIRE GHANA 23.8%
21.6% 17.5 %
strong focus on prevention, multi-sectoral LIBERIA
30.1%
and community-level approaches and
sustainable financing for nutrition. Acute < 20% 20 < 30% 30 < 40% ≥ 40%
and chronic malnutrition need to be tackled
simultanously. Sources: UNICEF, WHO, World Bank Group (2020), Joint Child Malnutrition Estimates, 2020 edition;
UNICEF, WHO, World Bank (2016); Global Report on Nutrition 2016; Map: © SWAC/OECD.
© Sahel and West Africa Club Secretariat (SWAC/OECD) Maps & Facts: Food and Nutrition Crisis 2020 25PASTORAL SITUATION
PASTORAL COMMUNITIES UNDER STRAIN
Pastoral communities were already facing Map 11. Fodder production anomalies compared to the 20-year average
many challenges long before the Covid-19
outbreak. These include significant fodder
shortages in Mauritania and Senegal, and in
parts of Mali and Niger as well as competition
with farmers over access to land, water
and resources. The security crisis disrupts
pastoral activities in the Liptako-Gourma area
and the Lake Chad basin with the closure of
markets, reduced access to pastures, and
limited transhumance, triggering massive Cross-border trans-
displacement of pastoralists to peri-urban humance prohibited
areas. With the Covid-19 pandemic, the pastoral - 50 – -25 -25 – -10 -10 – 10 10 – 25 25 – 50 50 – 100 Inaccessible zones
situation has deteriorated further. Market Source: CILSS (2020), Impact of the Covid-19 pandemic on food & nutrition security, no. 1, April. Map: © CILSS.
closure and public movement restrictions
heavily impacted pastoral and agro-pastoral to strengthen existing early warning systems, up together with Action Against Hunger (ACF) a
communities. They were among the hardest set-up new monitoring tools and co-ordinate monitoring tool, which provided weekly updated
hit by the Covid-19 crisis and strongly depend responses. For example, the Association for and analysed the economic impact of Covid-
on external support. One out of four pastoral the Promotion of the Livestock in the Sahel and 19-related measures on pastoral communities
communities received some kind of support the Savannah (APESS) conducted an analysis in 11 countries. On a positive note, the new
during the lean season. Mauritania launched in 12 member countries to identify trends situation also showed that distance learning is
a special agro-pastoral programme worth negatively affecting the agro-pastoral sector. working. This might offer new opportunities for
EUR 4.1 million. RPCA members mobilised The Réseau Billital Maroobé (RBM) network set education in pastoral communities in the future.
26 Maps & Facts: Food and Nutrition Crisis 2020 © Sahel and West Africa Club Secretariat (SWAC/OECD)Pastoral situation
BIOMASS SITUATION Map 12. Biomass production anomaly at the end of the rainy season, October 2019
While biomass was in generally good supply
across the countries of the Gulf of Guinea, it
was scarce in Sahelian countries. Some regions
in Nigeria (Adamawa, Central zone, Northern
zone, Southern zone) also crossed the warning
threshold. The situation was worse in Mauritania
and Senegal, which suffered from serious biomass
shortages for the fourth consecutive year. An
analysis by ACF, GNAP and RBM in February 2020,
showed that soils in 84% of southern Mauritania
and 49.6% of northern Senegal are bare, with no
grass for grazing. In addition, wildfires destroyed
the scarce viable grazing land, thus exacerbating Source: Action Against Hunger (2019), October. Map: © ACF.
the vulnerability of pastoral households. Biomass Map 13. Biomass production anomaly at the end of the rainy season, October 2020
production in the Sahelian strip has now
recovered. The heavy rains in July/August 2020
(Page 36) had a positive impact on biomass
production. Nearly all countries of the Sahelian
strip reached a surplus of biomass production
compared to 2019 levels (Map 13). This is good
news for pastoralists who can expect a shorter
pastoral lean season. However, there were once
again significant biomass deficits in Mauritania
and parts of Burkina Faso. The renewal or
reconstitution of herds takes time. A single good
year will not be sufficient to help recover dry spots
in Mauritania and Senegal.
© Sahel and West Africa Club Secretariat (SWAC/OECD)
Source: Action Against Hunger (2020), October. Map: © ACF.
Maps & Facts: Food and Nutrition Crisis 2020 27Pastoral situation
ACCESS TO GRAZING LAND
Due to persistent insecurity, access to grazing Map 14. Accessibility and transhumance, June 2020
land in the pastoral areas of most Sahelian
countries was very difficult, particularly
in the Liptako-Gourma area and the
Boko Haram‑affected areas. Several areas have
become completely inaccessible and exceed
the warning threshold of 75%. During the early
lean season, access to grazing land was still
possible in some areas of Niger (Goudoumaria,
Manesora, Ngourti), Chad (Batha Est, Fitri
Bourkou, Lac and Kanem) and Mali. In Chad,
the extreme southern part next to the border
with the Central African Republic was the only
area that benefited from abundant grazing
land. As of June 2020, access to grazing land
became extremely difficult in many parts of
Burkina Faso, Mauritania, Niger, Nigeria (states
of Benue, Niger and Yobe) and some areas of
Senegal. Access to pasture has improved
overall with the beginning of the rainy season. Source: CILSS (2020), Impact of the Covid-19 pandemic on food & nutrition security, no. 3, June. Map: © CILSS.
28 Maps & Facts: Food and Nutrition Crisis 2020 © Sahel and West Africa Club Secretariat (SWAC/OECD)Pastoral situation TRANSHUMANCE ‑ REDUCED SEASONAL MOBILITY Border closures and country-internal Map 15. Movement restrictions and livestock concentration movement restrictions disrupted the region’s typical seasonal migration of transhumant herders and livestock between Sahelian and coastal areas, and within countries. While many transhumant herders had already left their home areas in the search of grazing land, their return has been complicated due to Covid‑19‑related movement restrictions. Cross- border transhumant populations needed support to return to their home communities in order to mitigate the risk of animal diseases and to prevent potential inter-community conflicts. In July 2020, some transhumant herders were still blocked in a host country due to border closures and insecurity. This was the case of some 150 transhumant herders with nearly 10 000 heads of cattle from eastern Burkina Faso, who were stuck at the border area of Togo (Kodjoare, Mandouri, Sources: Action Against Hunger and Réseau Billital Maroobé (2020), newsletter, June. Map: © ACF/RBM. Sagbeiebou). In June 2020, transhumance remained prohibited in nearly all parts to high concentration of livestock in many host communities. Long before Covid-19, of Niger, and disrupted in Burkina Faso, border areas (eastern Burkina Faso, northern the 2019-20 pastoral season was marred Ghana, Nigeria (states of Benue, Niger and Côte d’Ivoire, southern Mauritania, southern by Nigeria’s closure of its land borders with Plateau), Mauritania and Senegal. The ban on Niger, border areas between Benin, Burkina Benin and Niger, and Benin’s ban on cross- transhumance between wilayas of Mauritania Faso and Niger), increasing the risk of resource border transhumance, which started in has been lifted. Movement restrictions led degradation, animal diseases and conflict with December 2019. © Sahel and West Africa Club Secretariat (SWAC/OECD) Maps & Facts: Food and Nutrition Crisis 2020 29
AGGRAVATING FACTORS
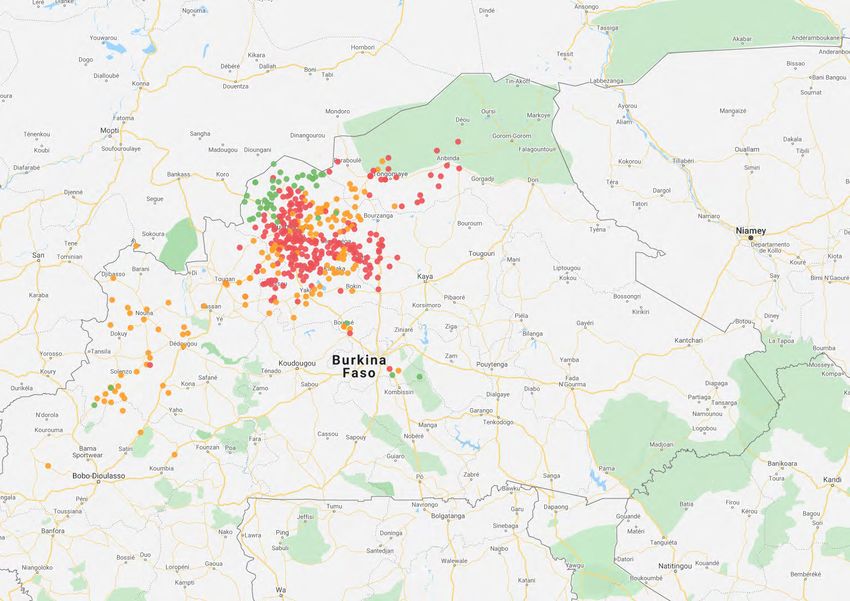
INSECURITY Map 16. Food & nutrition insecurity and violent events
Insecurity was and continues to be an
aggravating factor of food and nutrition
insecurity in the region. Acutely food insecure
populations are concentrated in the conflict-
affected areas in the Liptako-Gourma area
and the Lake Chad basin (Pages 14 & 16).
Moreover, many food insecure areas are hard
to reach, which makes it difficult to analyse
the situation and to deliver assistance.
Humanitarian access became even more
difficult facing additional logistics hurdles,
which impeded the timely delivery of urgent
humanitarian and food assistance. However,
many of these areas are chronically fragile
(Page 18) and have been food insecure for
the past decades, well before the eruption of
violence. Beyond emergency aid, these fragile
areas require structural investments.
Sources: Cadre harmonisé analysis, March 2020, June update; ACLED, November 2020. Map: © WFP.
30 Maps & Facts: Food and Nutrition Crisis 2020 © Sahel and West Africa Club Secretariat (SWAC/OECD)Aggravating factors
DISPLACEMENT
Figure 10.
The persistent security crisis triggered Number of internally displaced persons in Burkina Faso, Mali & Niger, June 2020
massive internal displacements, notably
in Burkina Faso, weakening or destroying
people’s livelihoods and undermining the IDPs in Burkina Faso, Mali & Niger IDPs in the Liptako-Gourma area
preparation of the next agricultural campaign.
Many farmers had to flee and abandon their
farms. In June 2020, the Liptako-Gourma area
counted some 715 000 internally displaced
people and 107 000 refugees, placing
additional pressure on already fragile host
communities. Burkina Faso alone recorded
nearly 1 million IDPs as of August 2020.
This situation directly impacts agricultural
activities and livestock. Satellite imagery
analysis of the World Food Programme (WFP)
revealed significant cropland losses in the
Liptako-Gourma area.
Source: ALG, WFP (2020), Conflits persistants, pertes de terres agricoles et insécurité alimentaire récurrente
dans la région du Liptako-Gourma. Figure: © WFP.
© Sahel and West Africa Club Secretariat (SWAC/OECD) Maps & Facts: Food and Nutrition Crisis 2020 31You can also read