DANGEROUS BY DESIGN 2021 - National Complete Streets Coalition - Smart Growth America
←
→
Page content transcription
If your browser does not render page correctly, please read the page content below
DANGEROUS
 BY DESIGN
                    2021

National Complete
Streets Coalition
2

Smart Growth America advocates for people who want to live and work in              This project was made possible by:
great neighborhoods. We envision a country where no matter where you live,
or who you are, you can enjoy living in a place that is healthy, prosperous, and                            Nelson\Nygaard Consulting Associates is
resilient. Learn more at www.smartgrowthamerica.org.                                                        an internationally recognized firm committed to
                                                                                                            developing transportation systems that promote
The National Complete Streets Coalition, a program of Smart Growth                                          vibrant, sustainable, and accessible communities.
America, is a non-profit, non-partisan alliance of public interest organizations    We plan and design connected complete streets that put people first. Learn
and transportation professionals committed to the development and                   more at www.nelsonnygaard.com.
implementation of Complete Streets policies and practices. A nationwide
movement launched by the Coalition in 2004, Complete Streets is the                                       The Centers for Disease Control and Prevention
integration of people and place in the planning, design, construction, operation,                         provided support for data analysis and synthesis used
and maintenance of transportation networks.                                                               in the report under cooperative agreement OT18-1802
                                                                                                          supporting the Active People, Healthy NationSM
Smart Growth America project team: The primary author was Rayla Bellis.                                   Initiative, a national initiative led by the CDC to help
Becca Buthe conducted all analyses. Becca Buthe and Martina Guglielmone                                   27 million Americans become more physically active by
created the maps and figures throughout this report, except for graphics on                               2027. Learn more: https://www.cdc.gov/physicalactivity/
pp. 10 and 13 by Brendan Rahman of Nelson/Nygaard. Design and editorial by          activepeoplehealthynation/index.html. The findings and conclusions in this
Stephen Lee Davis.                                                                  report are those of the authors and do not necessarily represent the official
                                                                                    position of the Centers for Disease Control and Prevention.

                                                                                    Table of contents
                                                                                    4     Executive summary
                                                                                    7     Introduction
                                                                                    12    Speed kills
                                                                                    14    Addressing the problem—what can be done?
                                                                                    16    How does speed get prioritized over safety?
                                                                                    17    What we saw in 2020
                                                                                    20    The most dangerous places to walk in the United States
                                                                                    26    The most vulnerable populations
                                                                                    29    Conclusion

                                                                                    31    Appendix A: Methodology
                                                                                    32    Appendix B: All tables and data
Our current
                                 approach to
                            addressing the rising
                              number of people
                              struck and killed
                              while walking has
                             been a total failure.

                               It needs to be
                              reconsidered or
                            dropped altogether.
Courtesy of Angie Schmitt
4

                       Between 2010 and 2019, drivers struck and killed                                       The number of people struck and killed each year
                       53,435 people while walking throughout the United                                      has grown by 45 percent between 2010 and 2019,

EXECUTIVE              States, more than 14 people per day on average.                                        and 2018 and 2019 saw the highest numbers of
                                                                                                              pedestrian deaths since 1990.*

SUMMARY                It has been more than a decade since the first edition
                       of Dangerous by Design, and the problem has only                                       Our streets are getting more dangerous—this edition
                       gotten worse: drivers strike and kill thousands of                                     finds that almost every single state in the U.S. has
                       people walking every year, and the annual death                                        grown more dangerous for people walking since
                       count continues to climb with each new edition of                                      the last edition of Dangerous by Design. (49 of
                       this report.                                                                           50)

                         Pedestrian
                            fatalities
                          are up 45
                             percent
                                from
                            2010 to
                               2019

                       *Note: NHTSA released a report in December 2020 with fatality numbers in 2018 and 2019 (6,374 and 6,205) that differ compared to the raw Fatality
   National Complete   Analysis Reporting System (FARS) data used in Dangerous by Design (6,283 and 6,237). Finding no way to reproduce NHTSA’s numbers within the com-
   Streets Coalition   prehensive FARS data, Dangerous by Design 2021 includes the numbers found in that raw, publicly accessible data. This discrepancy does not impact
                       the overall trend in rising fatalities, and will be corrected if NHTSA releases updated raw data that are accessible to the public. View NHTSA’s report: https://
                       crashstats.nhtsa.dot.gov/Api/Public/ViewPublication/813060.
                                                                                                                                                DANGEROUS BY DESIGN 2021
5

                                                                                     while often ignoring the role of roadway design in these deaths. Meanwhile the
                                                                                     death count has continued to climb year after year. States and localities cannot
                                                                                     simply deploy the same playbook and expect this trend to change—they need
                                                                                     a fundamentally different approach to the problem. They need to acknowledge
                                                                                     that their approach to building and operating streets and roads is contributing
                                                                                     to these deaths.

                                                                                       This problem continues to get worse.
                                                                                      49 states and 84 of the 100 largest metro
  Photo from Jackson, MS courtesy of Dr. Scott Crawford                              areas have become more dangerous compared
                                                                                     to the decade of data covered in Dangerous by
  This report also highlights ongoing disparities in which groups of people are at
  greatest risk of dying while walking. Older adults, Black or African American
                                                                                                      Design 2019.
  and American Indian or Alaska Native people, and people in low-income
  communities continue to be disproportionately represented in fatal crashes
                                                                                     It is past time for policymakers to take responsibility for stopping
  involving people walking.
                                                                                     these preventable deaths. With discussions currently underway about the
                                                                                     next reauthorization of our federal transportation bill, federal policymakers
  We know many of the factors responsible for these deaths. Policymakers
                                                                                     in Congress have an opportunity—and an obligation—to act now to make
  are choosing not to address them. We continue to design and operate streets
                                                                                     streets safer for everyone. Congress should create policy to change how we
  that prioritize the speedy movement of vehicles at the expense of safety for all
                                                                                     fund, design, and measure the success of our streets to prioritize the safety
  people who use them. There are core tenets of acceptable roadway design
                                                                                     of all people who use them, especially people walking and traveling actively.
  that actively put people at risk and increase the likelihood that people walking
                                                                                     The Complete Streets Act of 2021, which would do many of these things, was
  and moving actively using assistive devices such as wheelchairs, walkers, sight
                                                                                     reintroduced in this Congress in February 2021. It should be supported and
  canes, prosthetics, and scooters will continue to pay the price. These street
                                                                                     wholly incorporated into the next transportation authorization.
  design practices can also set drivers up to fail by making mistakes easier and
  the consequences of them more deadly, even when following the rules.
                                                                                     The U.S. Department of Transportation has an equal responsibility to
                                                                                     ensure these changes take place by instructing states to set targets to reduce
  Our current approach to addressing these deaths needs to be
                                                                                     injuries and fatalities, improving current national data, and changing the
  reconsidered or dropped altogether—it is not working. Many states
                                                                                     standards that contribute to hostile conditions for people walking in federal
  and localities have spent the last ten years focusing on enforcement, running
                                                                                     manuals for roadway design and operations. USDOT also needs to set better
  ineffectual education campaigns, or blaming the victims of these crashes,
                                                                                     motor vehicle safety standards that protect people walking. Traffic fatalities

DANGEROUS BY DESIGN 2021
6

  overall have declined thanks partially to better safety standards for vehicle       Stephen Lee Davis / Smart Growth America

  occupants, but federal decision-makers have failed to protect people walking
  from the impacts of larger and larger personal vehicles like SUVs. There is no
  shortage of other concrete, tangible actions that the new leadership at USDOT
  could take right now, many of which were outlined in Smart Growth America’s
  transition recommendations (see p.15). President Biden’s talented team at
  USDOT has much to do if they want to turn their words on safety into action.

  We also call on states, the main builders and managers of our transportation
  system, to take responsibility for the safety of people walking on their streets.
  They must go beyond the ineffective education campaigns that have failed to
  stem the tide of fatalities, and make fundamental changes to how they design
  roads. We have to stop thinking that we can educate or enforce our way out of
  a problem largely created and exacerbated by streets designed to treat people
  outside of a car as afterthoughts at best and with outright neglect or hostility
  at worst. And we call on all levels of government—states, regions, and
  localities—to prioritize protecting the most vulnerable people using our streets.

  This ten-year increase in deaths is a failure of our government at
  nearly all levels. We have been producing this report for more than a decade.
  During those ten-plus years, this report has documented the slow, steady,
  and terrifying increase in the number of people struck and killed while walking
  each year in this country—even as overall traffic fatalities have been trending
  downward.

  We are tired and saddened to produce yet another edition of this report
  without any positive change to show for it. We must do more to reduce
  the number of people that die while walking every day on our roadways, and
  more to protect older adults, Black or African American and American Indian or
  Alaska Native people walking, and people walking in lower income areas. This
  is a matter of life and death. We hope the next edition of Dangerous by Design
  will tell a different story, but without some fundamental changes in the near
  term, the problem will only get worse, and thousands of Americans will pay
  with their lives.

DANGEROUS BY DESIGN 2021
7

                    Introduction                                                Our current approach to addressing these
                                                                                deaths is not working.
                    Throughout the United States between 2010 and
DANGEROUS           2019, drivers struck and killed 53,435 people
                                                                                Many states and localities have spent the last ten
                                                                                years focusing on enforcement, running ineffectual
                    while walking, more than 14 people per day on
BY DESIGN           average. The number of people struck and killed
                                                                                education campaigns, or blaming the victims of these
                                                                                crashes, while ignoring or actively distracting people
                    each year has been on a steady and inexorable rise
                                                                                from the role of roadway design in these deaths.
                    over this decade, growing by 45 percent between
                                                                                States and localities cannot simply deploy the same
                    2010 and 2019.1 2018 and 2019 saw the highest
                                                                                playbook and expect this trend to change—they
                    numbers of pedestrian deaths since 1990.2,3
                                                                                need a fundamentally different approach to the
                                                                                problem. They need to acknowledge that their
                    If these statements feel familiar, it’s because they are.
                                                                                approach to building and operating streets and roads
Our approach        It has been more than a decade since the first edition
                                                                                contributes to these deaths.
                    of Dangerous by Design, and the problem has only
to building         been getting worse. Drivers strike and kill thousands
                                                                                Like previous editions, this report ranks the most
and operating       of people while walking every year, and the annual
                    death count continues to climb with each new edition
                                                                                dangerous states and metropolitan areas for people
streets and         of this report. Over the years, we have compared
                                                                                walking across the United States, using a metric that
                                                                                allows us to fairly compare states and metro areas to
                    the magnitude of those deaths to everything from a
roads is directly   jumbo jet crashing every month to more than sixteen
                                                                                one another. It also exposes continued disparities in
                                                                                which groups of people are at greatest risk of dying
contributing to     times the deaths caused by natural disasters. We are
                                                                                while walking: older adults, Black or African American
                    running out of comparisons.
these deaths.                                                                   and American Indian or Alaska Native people, and
                                                                                people walking in low-income communities. This
                    We would love to stop releasing Dangerous by
                                                                                report calls on leaders at the federal, state, and local
                    Design because policymakers have finally heard the
                                                                                level to do more to ensure streets are designed and
                    urgent need and taken action to fix the problem.
                                                                                operated to protect the safety of all people who use
                    Yet our streets are only getting more dangerous.
                                                                                them.
                    Unlike our last report in 2019 when 13 states were
                    improving, forty-nine out of fifty states in the U.S.
                    became more dangerous for people walking since
                    the last edition of this report using our “Pedestrian
                    Danger Index” (PDI) metric, which puts these deaths
                    in the context of states’ populations and walking
                    rates.

                                                                                                         DANGEROUS BY DESIGN 2021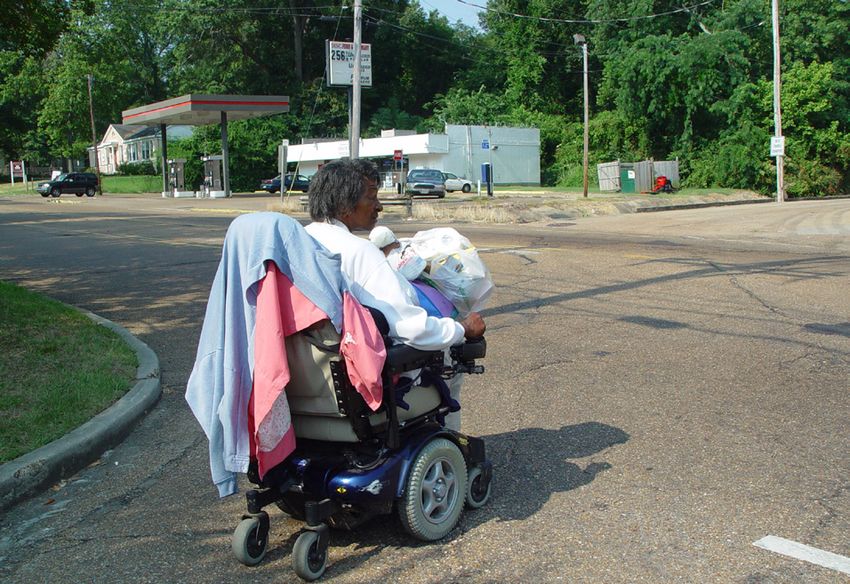
8

  The number of people struck and killed while walking has                          The impacts of COVID-19 on traffic safety
  grown by 45 percent over the last decade
                                                                                    While the federal government has only released national data on
                                                                                    pedestrian deaths through 2019 at the time of this report, we know
                                                                                    the COVID-19 pandemic has profoundly impacted daily travel,
                                                                                    particularly in the early stages of lockdown in early 2020. Driving
                                                                                    initially declined significantly as people followed stay-at-home orders;
                                                                                    but with fewer cars on the road, speeding went up. All of the 25
                                                                                    largest metro areas in the U.S. saw an increase in average travel
                                                                                    speeds early in the pandemic, some by as much as 65 percent.4

                                                                                    While we don’t yet know the full consequences of that
                                                                                    speeding for people walking, we know the rate of traffic deaths
                                                                                    overall skyrocketed even as driving plummeted. The National
                                                                                    Safety Council estimates a 24 percent spike in (all) traffic fatality rates
                                                                                    in 2020—the biggest increase in 96 years—a year when miles driven
                                                                                    overall was down 13 percent.5 One way to take this is that typical
                                                                                    levels of congestion and delay on our roads—which transportation
                                                                                    agencies typically try to eliminate at almost any cost—are perhaps
                                                                                    placing a crucial role in preventing thousands more traffic fatalities, for
                                                                                    people walking and driving. Put another way, for states and metros
                                                                                    that are unwilling to commit to designing roads for safety over speed,
   It’s long past time for policymakers to                                          congestion might be their most effective (though accidental) safety
  take responsibility for these preventable                                         tool. See page 17 for a closer look at what we know about 2020.
                    deaths

  Every single one of these deaths is tragic—even more so because many are
  avoidable. Policymakers have allowed this trend to continue. This report may
  sound like a broken record, but it hasn’t always been this way. The national
  surge in pedestrian deaths is a relatively recent phenomenon. The number of
  people fatally struck while walking decreased steadily for three decades before
  starting to rise at an alarming rate beginning in 2009.

DANGEROUS BY DESIGN 2021                                                                                                          Stephen Lee Davis / Smart Growth America
9

                                                                                                         This staggering increase of people fatally struck has far outpaced
                                                                                                         motor vehicle occupant deaths. While the number of people struck
                                                                                                         and killed by drivers while walking increased by 45 percent between
                                                                                                         2010 and 2019, driver and passenger fatalities increased by just 3.7
                                                                                                         percent.6

                                                                                                         This isn’t a clear byproduct of any major shift in how people travel—
                                                                                                         especially not a change in walking. The percent of people walking to
                                                                                                         work dropped slightly and total annual vehicle miles traveled (VMT)
                                                                                                         increased by only 9.6 percent.7

                                                                                                         National travel surveys from 2009 and 2017—the closest available
                                                                                                         years—show that walking as a share of all trips held steady at around
                                                                                                         10.5 percent.8

                   Photo of Southside Dr. & Kenwood in Louisville, Kentucky courtesy of Wakeley/Flickr   We know many of the factors responsible for these deaths.
                                                                                                         Policymakers are choosing to ignore them. We continue to design
                                                                                                         streets that are dangerous for all people, especially people walking and
                                                                                                         moving actively using assistive devices such as wheelchairs, walkers,
   From 2010 to 2019:                                                                                    sight canes, prosthetics, and scooters. Yet no matter how many times
                                                                                                         we (and countless other advocates and researchers) say it, federal and
                                                                                                         state decision-makers have failed to change the policies, standards,
                                                                                                         and funding mechanisms that produce roads that prioritize high
                                                                                                         speeds for cars over safety for all people. In doing so, policymakers are
                                                                                                         choosing to let these deaths continue.
      Pedestrian      Traffic deaths                Walking as a
                      among motor                                                Vehicle miles
       deaths                                    share of total trips              traveled
    increased by   vehicle occupants               stayed steady
                     increased by                                               increased by
                                                      around

      45%              3.7%                        10.5%                           9.6%
                                                     *From 2009-2017

DANGEROUS BY DESIGN 2021
10

  The federal government has failed                       Percent U.S. annual market share of new
  to act when it comes to the deadly                      vehicles, by type
  impacts of ever-larger vehicles

  We know more people are driving trucks and
  SUVs (sport utility vehicles), which are two
  to three times more likely than smaller
  personal vehicles to kill people walking in
  the event of a crash.9 Recent research from
  the University of Wisconsin-Milwaukee found
  the share of pedestrian deaths involving trucks,
  vans, and SUVs has increased from 22 to 44
  percent since the mid-1980s.10 The size of larger
  vehicles has also increased dramatically over the
  past several decades: pickup trucks in particular
  are nearly 1,256 pounds (32 percent) heavier
  than they were in 1990.11

  The National Transportation Safety
  Administration issued recommendations in 2018                   The graphic above shows the change in the makeup of the US
  to revise motor vehicle safety standards to better           vehicle fleet. At the top right, a comparison of truck sizes from 20
  protect pedestrians, but federal policymakers                 years ago vs more recent models, and the height of a new 2021
  have so far failed to make changes.12 This is                  truck model on display at the Washington Auto Show. Below, a
                                                           simple graphic shows why people struck by larger vehicles are more
  directly contributing to the deaths of people
                                                          likely to die in a collision. Top, Flickr photo by Norman Walsh, bottom
  walking, but it also sets drivers up to make
                                                                                        Stephen Lee Davis / Smart Growth America
  mistakes that bring devastating impacts to them:
  failing to see a child walking until it is too late
  because of the vehicle size, or killing a person
  walking in a crash that could otherwise have
  resulted in injury with a smaller, safer vehicle. For
  every pedestrian killed, at least three people are
  forever changed: a victim who dies, the people
  who loved them, and the person who has to live
  with the knowledge that they killed someone.

DANGEROUS BY DESIGN 2021
11
An alarming number of states have abdicated their responsibility
to improve safety, suggesting that the rising death count is a
consequence of factors outside their control. Beginning in 2018, the
federal government required states to set a combined target for the number
of non-motorized deaths and serious injuries, which includes people walking,
biking, using wheelchairs, and riding scooters and other non-motorized
vehicles. In that first year—shown in the graphic below—18 states accepted
the current trend line and set targets for more people traveling outside a vehicle
to be killed and injured compared to the most recent year of data reported at
the time. And unfortunately, six of those states exceeded those grim targets
to increase fatalities and serious injuries in 2018.13 In 2020, more states threw
their hands up at the problem: 20 states set “safety” targets for more deaths
and serious injuries than the previous year.14 These states need to accept the
role their roadway design practices play in these deaths and actively participate
in the solution, starting with setting performance targets to reduce the number
Courtesy of Andy Boenau
of people killed while walking and funding projects to make it happen.
In 2018, 18 states set targets for more people to die Courtesy of Angie Schmitt
DANGEROUS BY DESIGN 202112
Speed kills deadly impacts. A recent research scan from the Journal of Planning Education
and Research indicates street design and other physical characteristics of the
surrounding environment prime drivers’ expectations about potential conflicts
Designing roads If hit by a car
or hazards and risk response, playing a direct role in many of the human errors
for high speeds traveling:
that result in crashes.16
dramatically
increases the
likelihood that 20 MPH 5%
a person struck The illustrations on the following page explain how roadway design
while walking will contributes to the preventable deaths of people walking and how better
be killed. At 40 design can shape driver behavior, lower speeds, and make people safer.
miles per hour,
30 MPH 45%
85 percent of
crashes involving a Good design also means less enforcement
person walking are 40 MPH 85%
fatal.15 Designing Designing roads for slower speeds that are self-enforcing also reduces the
National Traffic Safety Board (2017) Reducing Speeding-Related Crashes Involving Passenger Vehicles.
streets for slower Available from: https://www.ntsb.gov/safety/safety-studies/Documents/SS1701.pdf
need to rely on law enforcement, which can pose disproportionate financial
speeds is directly and legal burdens on lower-income people. This also saves money and
connected to prevents potentially deadly encounters with police for Black and Brown people.
improving safety and reducing deaths. Designing to prioritize the safety of people walking also helps mitigate risky
pedestrian behavior and can make the “crime” of jaywalking obsolete. Our
Lower speeds save lives, and good design reduces both goal with design should be to make dangerous behavior difficult and
safe behavior easy.
speed and driver error
Safer design can even make distracted driving collisions less deadly.
It’s not just about the presence or lack of sidewalks and crosswalks—other
While some media outlets have pointed to distracted driving as a potential
aspects of roadway design lead directly to higher speeds and more deadly
cause of rising deaths among people walking, recent research from Ohio State
streets. Most drivers have experienced that momentary shock of looking down
indicates road design plays an important role in curbing the most dangerous
at their speedometer and discovering they are well above the posted speed
consequences of distracted driving by reducing the severity of those crashes. It
limit. Drivers follow visual cues and the majority drive at a speed that feels safe.
finds crashes involving a distracted driver are less severe in urban areas where
The “design” speed of a road may be far higher than the speed limit.
street design and other visual cues are more likely to encourage slow speeds
and awareness of people walking, particularly certain states like Florida, North
Conventional wisdom used by federal and state safety offices attributes most
Carolina and North Dakota. It also finds these crashes are more severe when
crashes to driver or pedestrian error, but rarely to designer error. Yet good
high speeds are involved.17
design leads to better driving behavior, fewer mistakes, and mistakes with less
DANGEROUS BY DESIGN 202113 Dangerous by design Streets that have wide lanes that allow room for mistakes, lack high-visibility crosswalks, have wide intersections that encourage drivers to make turns without slowing, and have long distances between intersections, encourage higher speeds—regardless of how low speed limits are set. Yet people will cross even in dangerous conditions when the nearest safe crosswalk requires a long detour, especially when there are destinations or transit stops along the road. Safer by design 1 While important to lower speed limits, safe design gives drivers other visual cues to slow down. 2 Narrower travel lanes naturally slow traffic, 3 high-visibility, signalized crosswalks make drivers more aware of pedestrians, and extended curbs shorten the distance required to cross the street. 4 Decreasing the distance between intersections also helps reduce speeds. 5 Adding signalized crosswalks in the middle of long blocks slows traffic and provides valuable new connections where people already want to walk. 6 Eliminating right turn “slip” lanes in favor of right-angle turns produces slower, safer turns and shorter crossing distances for pedestrians. (See p.16) DANGEROUS BY DESIGN 2021
14

  Addressing the problem—what can be done                                             there is a considerable delay in its release; we don’t know how many people
                                                                                      died in a given year for a full year afterwards.
  Federal policymakers in Congress have an opportunity—and an
                                                                                      In addition, the disability data reported by FARS is incomplete, and
  obligation—to act now to make streets safer for all people, with discussions
                                                                                      inappropriately groups wheelchair and scooter users with skateboarders, roller
  currently underway about the next reauthorization of our federal transportation
                                                                                      skaters, baby carriages, and more. We also need standards for better race and
  bill. Congress should create policy that changes how we fund, design,
                                                                                      ethnicity data at the time of crashes, which are often missing or inadequately
  and measure the success of streets nationwide to make safety our highest
                                                                                      recorded. And after years of leaving it out, FARS has finally moved toward
  priority, especially the safety of the most vulnerable people. The next federal
                                                                                      including national injury data—a longstanding gap—but those data are not yet
  transportation reauthorization bill should incorporate a focus on safety over
                                                                                      comprehensive.
  speed throughout all federal programs. The INVEST Act passed by the House
  of Representatives in June of 2020 was a great start.18 This isn’t just about
                                                                                      If we don’t fully understand who is being killed and where in great detail, how
  safety—our federal policy and fundings systems should prioritize investments
                                                                                      will we ever comprehensively address this problem?
  that improve access to jobs and necessities for everyone, including those who
  cannot drive or afford a vehicle, and making streets safer for people walking is
  a necessary step to doing that. And Congress must hold states accountable
  for making reductions in serious injuries and fatalities.

  Congress should also pass the Complete Streets Act, which sets aside
  funding for complete streets technical assistance, planning, and construction.
  Any reauthorization or infrastructure legislation must include a strong federal
  Complete Streets policy that requires state departments of transportation to
  consistently plan for and construct projects for all people who use the street,
  including the most vulnerable, and that opens the door for more innovative,
  flexible design guidance.

  We also need more and better data on the street conditions where fatalities
  occur, the demographics of the victims, and other conditions of the crash.
  While we know some of the factors likely responsible for this decade’s sharp
  increase in fatalities of people walking—like the increasing share of SUVs and
  larger vehicles on the road—limitations and inconsistencies in the data prevent
  a fuller picture. More research is needed to identify all the factors behind this
  terrible trend. At the national level, the Fatality Analysis Reporting System        Photo of Jackson, MS,
  (FARS) is the most comprehensive dataset on traffic fatalities we have, but          courtesy of Dr. Scott Crawford

DANGEROUS BY DESIGN 2021
15
The U.S. Department of Transportation (USDOT) has an equal
responsibility to ensure these changes take place. We recently released
recommendations for President Biden’s administration with immediate actions
USDOT should take: requiring that states stop setting negative injury and
fatality targets, improving current national data, and updating federal manuals
for roadway design and operations to change standards that contribute to
hostile conditions for people walking.19 The National Highway Traffic Safety
Administration (NHTSA) should also update its guidance and approach to
deprioritize traffic enforcement and revise vehicle safety standards to better
protect pedestrians. USDOT has substantial authority to act, and many of
these steps are actions the agency could and should have taken years ago.
Failing to act is consenting to the result.
States must implement performance measures to reduce the number of
people killed while walking. One way to make safety a higher priority is to
deprioritize or get rid of roadway design metrics focused exclusively on
minimizing how often cars need to slow down. This emphasis on reducing Photo courtesy of Andy Boenau
traffic “delay” as the number one goal produces some of the most dangerous
roads—roads where drivers travel at high speeds, aren’t expecting to need to
slow down, and aren’t looking for people walking. States can also provide their
engineers with the most up-to-date training and education on implementing
Complete Streets and update policies and decision-making frameworks to
support Complete Streets.
And all levels of government—states, regions, and localities—should
Failing to act is
prioritize projects that bring the greatest benefits to those who are
suffering disproportionately. Traffic deaths impact every community in the
United States, but this report shows that people living across the southern
consenting to
more preventable
continental United States, older adults, people of color, and low-income
communities bear a larger share of this harm.
deaths.
DANGEROUS BY DESIGN 202116
How does speed get prioritized over safety? We already know how to design a safer intersection, but all the embedded
practices of the agencies in charge prioritize keeping cars moving by default.
Slip lanes are found everywhere across the country in rural, urban and
Slip lanes, those short right-turning lanes at intersections that allow vehicles to
suburban areas, designed and built with federal money and guidance over the
turn without slowing down, demonstrate how we could improve safety through
last 50 years. Better education and enforcement will not fix this problem.
design, if safety were truly the highest priority. Slip lanes were created to solve
one specific set of problems: vehicle speed and delay.
Even the Federal Highway Administration (FHWA) knows efforts to make slip
lanes “safer” will always be limited, because their created purpose—keeping
They were borne of the simple realization by traffic engineers that cars turning
traffic moving—is fundamentally opposed to safety for people walking:
right—even on a green light—can produce congestion because slowing down
“While right-turn slip lanes are generally a negative facility from the pedestrian
to a safe turning speed in a travel lane can delay traffic traveling straight. Slip
perspective due to the emphasis on easy and fast vehicle travel, they can be
lanes prioritize vehicle speed over the safety of everyone who uses the road
designed to be less problematic.”20
by 1) increasing the distance required to cross a street, 2) putting people
walking into the very spots that can have the worst visibility for a driver, and 3)
A small change to a road in Arlington, Virginia (noted on the following page) is
encouraging drivers not to slow down when approaching an intersection and a
a great example of prioritizing safety over speed. Unfortunately, Arlington is in
crosswalk—the precise moment they should be the most careful.
the minority. Most states and cities will not change their practices unless
Congress and USDOT sends a directive that the lives of people who die
For drivers turning right in the images below, all the design cues are directing
as a result of traffic fatalities are more important than a few seconds of
them to blaze through their turn right into the precise spot where engineers
delay.
have said that a pedestrian should “safely” cross.
Stephen Lee Davis / Smart Growth America
DANGEROUS BY DESIGN 202117
What we saw in 2020
The coronavirus pandemic has had unprecedented impacts on daily life,
including the trips people take for work and leisure. And while the federal
government likely won’t release full 2020 national data on people struck and
killed while walking until late 2021, new data estimates and broader highway
safety trends paint a troubling picture.
During lockdown, traffic fatality rates shot up, even as driving dropped
precipitously. The fatality rate from April-June increased by 32 percent to its
Before highest level in 15 years, according to data from the National Highway Traffic
Safety Administration (NHTSA). While the overall number of traffic deaths
(including motor vehicle occupants, people walking, and others) decreased
Back in 2009, this slip lane in Arlington, VA made it possible for drivers to zoom onto a
slightly during that period compared to the same three months of 2019, driving
neighborhood street without so much as a tap on the brakes, right into a crosswalk. But
dropped by 26 percent.21 Once the initial stage of lockdown ended and driving
changes were subsequently made to narrow the lanes, eliminate the the slip lane, convert
the right turn into a sharper turn that requires drivers to slow down before turning, and move
began to increase back toward pre-COVID levels, the raw number of traffic
the crosswalk to the safest and shortest point of the intersection where pedestrians will be fatalities also began to climb again, increasing 13.1 percent in July-September
the most visible. Perhaps there’s some additional vehicle delay today as cars now have to compared to the same three months in 2019, according to a later NHTSA
slow down to turn right, but that’s what it looks like in practice to prioritize safety over vehicle report.22
speed or delay. Imagery from Google Street View.
With fewer drivers and less congestion on the road, speeding went up.
A number of states and cities reported higher instances of speeding in the first
few months of the pandemic, and preliminary national research supports those
findings. A report from INRIX found average speeds increased in all 25 of the
largest metropolitan areas in the U.S during April-July 2020, in some cases by
nearly 65 percent, like in Philadelphia and San Francisco.23 This is likely a factor
in the sharp rise in the traffic fatality rate early in the pandemic—and something
that designing roads for slower speeds could have helped prevent.
The trend for the full year tells a similar story: driving went down and
traffic fatality rates spiked. The National Safety Council is estimating the
biggest increase in traffic fatality rates in 96 years in 2020—a 24 percent
spike—during a year when miles driven overall was down 13 percent. This
After
DANGEROUS BY DESIGN 202118
shows that typical levels of congestion and delay on our roads—which
transportation agencies typically try to eliminate at almost any cost—is perhaps
playing a crucial role in preventing thousands more deaths of people driving
or walking. Put another way, for the states and metros that are unwilling to
commit to prioritizing safety over speed and a holistic approach to safety,
congestion might be the most effective (and unintentional) safety tool that they
have.
There’s no clear story yet about people killed while walking in 2020.
While we don’t have national data on people killed while walking in 2020,
some state departments of transportation, like Massachusetts and Washington
State, provide publicly available safety data portals with relatively current
information.24,25 Several others—Connecticut, Colorado, Louisiana, and
Washington, DC—offered preliminary crash data from 2020 at our request.
These states all deserve recognition for their transparency and willingness to be
a partner in addressing the problem.
These states’ combined data don’t tell a clear story yet. In most of them,
preliminary data show that the raw number of people struck and killed while
walking over the first ten months of the year remained similar in 2020 to 2019,
though there are exceptions: the number of people killed while walking in
Louisiana spiked in 2020, while people killed while walking dropped nearly
in half in Massachusetts. However, significant data cleaning occurs between
initial police reports and the final numbers released in FARS. These preliminary
death counts are subject to change and it is difficult to draw final conclusions.
Congress and USDOT should actively seek ways to speed the sharing of these
data, as 9-10 months is too long to wait for it.
These pedestrian deaths will also need to be taken in the context of other
changes to travel behavior in 2020, including where and how frequently
people walked in 2020. And it will be crucial to dig into who the victims of
these crashes were in 2020, whether the same groups continue to be most
vulnerable, and whether any disparities grew even more pronounced as work Buford Highway in the Atlanta,
Georgia metro area. Stephen Lee
and leisure trips shifted during the pandemic. Davis / Smart Growth America
DANGEROUS BY DESIGN 202119
Oakland, CA was one city that piloted approaches the intersection of Avenal and Bancroft avenues, using traffic cones and
signage to create a temporary median and upgraded crosswalks to rapidly
to make streets safer during COVID
reduce the risk of traffic crashes. Between May and July, the city installed
14 additional projects.
At the beginning of the pandemic, a number of local governments
partially or fully closed certain segments of streets to vehicles to
In October, again in response to community feedback, the city kicked
provide more space for residents to safely exercise outdoors and move
off another new phase of the Slow Streets program and partnered with
around the city. While many cities focused on closing residential streets Oakland-based artist Jonathan Brumfield to make the purpose of the
to traffic to improve safety for exercise and play, the City of Oakland’s temporary installations clearer and the installations themselves more
“Slow Streets” program stands out for also emphasizing safe access attractive and reflective of the surrounding neighborhoods. Oakland
to essential places, addressing high-crash streets, and focusing on received funding support for Blumfield’s time through Smart Growth
vulnerable communities. America’s ongoing Arts & Transportation Rapid Response initiative, which
seeks to pair transportation agencies with artists to develop creative
Oakland initially launched their Slow Streets Program in April 2020 to solutions to COVID-related transportation challenges.26
support physical activity and reduce overcrowding on trails, parks, and
sidewalks during the pandemic by closing over 20 miles of streets to
motor vehicles. After implementation, the city set out to evaluate the
program and gather feedback from residents.
City staff heard that traffic safety is a more important issue during
COVID-19 than creating space for physical activity for many
Oaklanders, especially those in East Oakland and in high priority
neighborhoods where fewer workers are able to telecommute. In
response, the City launched a new stage of the program, “Slow
Streets: Essential Places,” in May, installing temporary intersection
improvements to support safe access to grocery stores, food
distribution sites, and Covid-19 test sites. The city overlaid these
essential places with its High Injury Network, where just 6 percent
of city streets account for over 60 percent of severe and fatal traffic
crashes, as well as the highest-priority neighborhoods according to
equity indicators like race and income. Oakland installed its first Slow
Streets: Essential Places project near a neighborhood grocery store at
DANGEROUS BY DESIGN 202120
Flickr photo by Andrew Bossi
The most dangerous places to walk in the
The 2021 calculations include traffic deaths that occurred between 2010 and
United States 2019 from the Fatality Analysis Reporting System (FARS). Mode share and
population data are taken from the U.S. Census Bureau’s 2019 American
Our “Pedestrian Danger Index” (PDI) calculates how deadly it is for people Community Survey five-year estimates. For PDI by race, and ethnicity, we use
to walk in a state or metropolitan area based on the number of people killed walking rates from the American Community Survey Public Use Microdata
by drivers while walking, controlling for the number of people that live in that Sample (PUMS). Consult the Appendix for a more detailed description of our
state or metro area and the share of people that walk to work. Among limited methodology.
datasets about walking, the share of people who walk to work is the best
nationally available approximation of the total number of people who walk This report calculates PDI for all 50 states and for the 100 largest metropolitan
for all trips. This approach allows for a balanced comparison by accounting statistical areas (MSAs) nationwide (inclusive of the Washington, D.C. region),
for places that may have higher numbers of fatalities simply as a function of highlighting the places that are especially deadly for people walking. Since
higher numbers of people traveling on foot overall. For example, the New York the previous edition of Dangerous by Design, which looked at traffic deaths
City metropolitan area saw the largest number of people struck and killed between 2008 and 2017, states have gotten worse. In our 2019 report, 13
while walking between 2010-2019 by a large margin, yet also has a very large states got less deadly compared to the previous edition, but this time PDI
population and incredibly high rates of walking to work. PDI allows us to fairly scores have increased in 84 of the top 100 MSAs and forty-nine out of
compare it to a metropolitan area like Orlando, which also has fairly high fatality fifty states. In the remaining state, Rhode Island, it stayed the same.
numbers but a lower population and far lower rates of walking to work.
DANGEROUS BY DESIGN 202121 The graphic on this page highlights the top twenty most dangerous states for people walking based on PDI scores. Nine of the top ten most dangerous states fall across the southern continental U.S., as do many of the top twenty most dangerous states. Much of the growth and development in southern states occurred after World War II as car ownership became widespread, and those states still face that legacy today in the form of spread out, driving-scale development with wider roads and long blocks. Those conditions make it more dangerous to travel outside a car and more difficult to make design changes that improve safety. The ten most dangerous states for people walking in this report are the same ten states that topped the list in Dangerous by Design 2019, although some rankings within the top ten have shifted (consult Appendix A for a comparison of rankings). While improving safety requires a long-term commitment to retrofitting infrastructure and changing the practices that lead to these dangerous roads, any state can make immediate progress today. There is no excuse not to take action now. DANGEROUS BY DESIGN 2021
22

  The graphic on this page shows the ten states that    Top photo by the National Complete Streets Coalition,
  saw the biggest increases in PDI since Dangerous        middle photo by Stephen Lee Davis / Smart Growth
  by Design 2019. PDI scores for these states rose        America, and the bottom photo by BikeWalk KC on
                                                                                                      Flickr.
  by anywhere from 13.4 to 32.2 points, meaning
  these places have become even more dangerous
  for people walking since the last report. These are
  noteworthy large increases, reflecting an increase
  in the number of deaths in 2018 and 2019 in many
  cases. As of Dangerous by Design 2019, which
  analyzed deaths from 2008-2017, the states with
  the largest change in PDI scores since the prior
  2016 report ranged from 7.9 to 24.5 points.

DANGEROUS BY DESIGN 2021
23 The graphic on this page shows the PDI scores for the top twenty most dangerous metropolitan areas for people walking. Once again, seventeen of those twenty most dangerous metro areas are located within southern states. Research has consistently linked the sprawling growth patterns common in many of those states to higher rates of both traffic-related deaths for people walking and traffic-related deaths overall.27,28 Nine of the twenty most dangerous MSAs are in Florida. DANGEROUS BY DESIGN 2021
24

  Eighty-four of the 100 largest metropolitan areas
  grew more dangerous for people walking since
  the previous edition of Dangerous by Design. The                 In Jackson, MS, the metro area with the fifth-
  graphic above shows the metropolitan areas that            biggest increase in PDI since the 2019 report, every
  experienced the worst increases. These regions               improvement in conditions (as seen in the top and
  saw PDI scores climb by as much as 77 points,              middle photos at right) is countered by hundreds of
  meaning the decade from 2010 to 2019 was              other streets and sidewalks that are woefully insufficient
                                                       to allow for safe travel by all people who need to use the
  much more dangerous on average for people
                                                         road, as with the bottom image. Moments of progress
  walking in these places compared to the decade
                                                      are worth celebrating, but scattered, small fixes will fail to
  between 2008 and 2017.                              keep up with the scale and scope of the probem. Photos
                                                                                 submitted by Dr. Scott Crawford.

DANGEROUS BY DESIGN 2021
25
Some Florida cities are becoming safer, but the state has lost the momentum
This example from Hollywood Blvd. in Broward
safer, but statewide progress has County, FL shows some of the simple
and political will needed to truly implement that
stalled interventions that are proven to enhance
change, and people walking continue to pay
safety: bulbouts, mid-block crossings,
the price with their lives.
For many years, Florida has topped the list of additional lighting, narrower lanes, and others.
most dangerous states in the U.S. for people Photo courtesy of the Broward MPO. On the other hand, four of the most dangerous
walking, with scores of metropolitan areas in metropolitan areas in Florida (and in the
Florida consistently falling within the top twenty country) have improved slightly in PDI scores
most dangerous cities. Despite that, recent since Dangerous by Design 2019 (Appendix A
editions of this report have applauded Florida has all changes in PDI scores). This is a good
state leaders’ recognition of the problem and trend, but hold your applause—all four still rank
efforts to improve safety for people walking. in the top 11. Orlando, Lakeland-Winterhaven,
In 2014, the state adopted a Complete Jacksonville, and Cape Coral-Fort Myers saw
Streets policy and the Florida Department of the largest drops in PDI scores since the last
Transportation (FDOT) initially took ambitious edition. Those drops suggest those cities have
steps to implement the policy, launching major made some strides in recent years in making
updates to its design standards and planning streets less dangerous for people walking.
statewide training for roadway engineers.
For example, Orlando has taken steps to
Policies intended to save lives should be address the city’s safety problem by developing
measured by their success, and Florida’s a Vision Zero resolution and action plan to
effort has failed to live up to its billing. eliminate serious injuries and fatalities and
Undoing the damage caused by decades installing traffic calming projects, though the
spent building dangerous roads and car-scale improvements weren’t enough to move it
development takes continuous and ongoing down from the top spot for most dangerous
commitment. While it makes sense not to see metro area. Other Florida regions topping the
dramatic improvements immediately, progress list of most dangerous MSAs have also seen
should be evident at some point. But Florida some success reducing speeding and crashes
has continued to grow more dangerous for through design changes on specific high-crash
people walking. In fact, the state saw one of the corridors. But no city will be able to do it on
largest increases in PDI score since Dangerous their own because FDOT owns and operates
by Design 2019. FDOT may have taken some many of the roads in those metro areas.
important initial steps and clearly continues Orlando and other Florida cities need the state
to have champions working to make streets to be a stronger partner.
DANGEROUS BY DESIGN 202126
The most vulnerable populations Older adults
As the graphic on this page shows, people between ages 50 and 65, and
All people do not experience the benefits and burdens of transportation policy
people over 75, are overrepresented in deaths involving people walking.30
and funding decisions equally. Low-income households are significantly less
Our nation’s population is becoming older on average. According to the
likely to have access to a vehicle and also less likely to live in communities
U.S. Census Bureau projections, one in five Americans will be over age 65
where they can reach daily needs safely and affordably outside a car.
by 2030.31 We must devote greater attention to the needs of older adults
Structural racism has guided many of the decisions made about housing and
when we design our streets. A 2018 survey from the National Aging and
transportation for decades. The construction of the National Highway System
Disability Transportation Center found that older adults who give up driving
disproportionately carved through communities of color.29 “Urban renewal”
face substantial barriers to getting around and often face physical isolation,
projects have displaced more than a million Americans and continue to harm
frustration, and feel dependent and trapped. Forty percent of the non-driving
Black and Brown communities today.
older adult survey respondents cited access and availability of affordable
transportation as a barrier.32
Many of these same disparities persist when it comes to who is most
vulnerable to being struck and killed while walking. Though people of all ages,
races, ethnicities, and income levels suffer the consequences of dangerous Pedestrian fatalities per 100,000 people by age (2010-2019)
street design, some neighborhoods and groups of people bear a larger share
of the burden.
Older adults, Black or African American and
American Indian or Alaska Native people, and people
walking in low-income communities continue to
be disproportionately represented in fatal crashes
involving people walking.
To round out this analysis of the most vulnerable populations, we also wanted
to analyze disparities for people living with different disabilities, but as noted
on page 14, the data is incredibly incomplete on this count and makes
conclusions difficult. Better data is urgently needed.
DANGEROUS BY DESIGN 202127 People of color Relative pedestrian danger by race and ethnicity (2010-2019) People of color, especially Black or African American and American Indian or Alaska Native people, continue to die while walking at higher rates compared to White, Non-Hispanic, Asian, and Pacific Islander people. The graphic on the top illustrates these inequities, controlling for differences in population and walking rates.33,34 Structural racism in policy and funding decisions has perpetuated these disparities. Implicit bias may also play a role. Research by the University of Nevada found that drivers are significantly more likely to yield to a white pedestrian in a crosswalk than to a Black pedestrian.35 Low-income communities While there are no national data on household income of people Pedestrian fatalities per 100,000 people by census tract MHI (2010- struck and killed while walking, we know where individuals were 2019) walking at the time of death—and as the bottom graphic shows, people die while walking at much higher rates in lower-income communities compared to higher-income areas.36 Low-income communities are significantly less likely to have sidewalks, marked crosswalks, and street design to support safer, slower speeds.37 It is likely that many of the people walking in these lower-income census tracts are also lower-income themselves. People in rural areas Unlike past editions, this edition of Dangerous by Design examines the relative danger to people walking in urban communities and rural communities in the U.S. While more people are struck and killed while walking in urban areas than rural areas, people in DANGEROUS BY DESIGN 2021
28

  rural areas are struck and killed at about the same rates when controlling for
  population: 1.7 pedestrian deaths for every 100,000 people in rural areas
  versus 1.6 pedestrian deaths for every 100,000 people in urban areas.

  While we can’t readily draw a comparison that accounts for differences in
  walking rates between urban and rural areas using available national data,
  past research indicates people do not universally walk more in urban areas
  than rural areas. The time spent walking and share of trips taken by walking in
  urban versus rural areas varies substantially between regions of the U.S. and
  purposes of the walking trip (walking for leisure or traveling to work, stores, and
  services).38

  What we do know is that people walking in areas designated as “rural” face
  unique dangers. Small town main streets are often also state highways that
  carry significant regional and truck traffic (and the state departments of
  transportation that manage those highways are often resistant to changes
  that slow down traffic.) Rural roads are less likely to be designed with people
  walking in mind, often lacking sidewalks and safe options to cross the street,
  but that doesn’t mean people in rural areas don’t walk. More than one million
  households in primarily rural counties in the U.S. do not have access to a
  vehicle.39

  We need better data and better geographic designations to help us understand
  the needs and dangers faced by people walking in communities outside major
  metro areas. The “urban” and “rural” dichotomy in many national datasets is a
  false one. Exurban communities that are developed but relatively low-density
  face distinct safety challenges that differ from the safety challenges of their truly
  rural counterparts, which differ from the challenges in small town centers.

                                                                                          Flickr photo by BikeWalk KC

DANGEROUS BY DESIGN 2021
29
Conclusion Endnotes
We are tired and saddened to produce yet another edition of this report that 1 All pedestrian fatality data for the report are from: National Highway Traffic Safety
Administration. (2019). Fatality Analysis Reporting System. Available from https://www.
reads so much like every other edition. We continue to mourn the increase
nhtsa.gov/research-data/fatality-analysis-reporting-system-fars.
in pedestrian deaths, especially while many of the steps needed to reverse 2 ibid
this trend are well-known. We must do more to reduce the number of people 3 As of Dangerous by Design 2019, FARS reported 5,977 pedestrian fatalities
that die while walking every day on our roadways and more to protect older nationwide in 2017. That number has since been revised to 6,075 reflected in this
report, correcting what initially appeared to be a modest decrease in deaths between
adults, Black or African American and American Indian or Alaska Native
2016 and 2017.
people walking, and people walking in lower income areas. Policymakers 4 INRIX (2020). COVID-19 Effect on Collisions on Interstates and Highways in the US.
have disregarded this problem for too long and failed to change how we fund, Available from: https://inrix.com/covid-19-transportation-trends/.
design, operate, maintain, and measure the success of our roads. They have 5 National Safety Council (2021, March). Motor Vehicle Deaths in 2020 Estimated to be
Highest in 13 Years, Despite Dramatic Drops in Miles Driven. Available from: https://
failed to make vehicles safer for people walking. Despite what they claim about
www.nsc.org/newsroom/motor-vehicle-deaths-2020-estimated-to-be-highest.
safety, they continue to prioritize moving cars at high speeds. People walking— 6 Traffic fatality data are also from: National Highway Traffic Safety Administration. (2019).
especially those most vulnerable to being struck and killed—continue to pay Fatality Analysis Reporting System. Available from https://www.nhtsa.gov/research-
the price. data/fatality-analysis-reporting-system-fars.
7 Federal Highway Administration Office of Highway Policy Information. (2010-2019).
Traffic Volume Trends. Available from https://www.fhwa.dot.gov/policyinformation/
Once again, we call on policymakers at all levels of government to address travel_monitoring/tvt.cfm?CFID=155109069&CFTOKEN=ba8220edbb4df7d8-
this problem. We call on federal policymakers in Congress and the U.S. 451D1313-E4BB-A7B8-9C92DA99DADAE665.
Department of Transportation to finally take action and establish safety as 8 Federal Highway Administration. (2009; 2017). National Household Travel Survey. See
Table 9b, available from https://nhts.ornl.gov/assets/2017_nhts_summary_travel_
a higher priority. We call for binding, enforceable requirements for states
trends.pdf.
to reduce—and eventually eliminate—deaths and serious injuries on our 9 National Highway Traffic Safety Administration. (2015). New Car Assessment Program.
roadways. We call for funding dedicated to safer street projects that specifically Available from https://www.federalregister.gov/documents/2015/12/16/2015-31323/
serve the needs of people walking, of older adults, of people of color, and new-car-assessment-program.
10 Schneider, R.J. (2020). United States Pedestrian Fatality Trends, 1977 to 2016.
of low-income communities. We call for federally endorsed street design
Transportation Research Record. 2020; 2674(9):1069-1083. Available from: https://
standards that put the safety of vulnerable users first and foremost. We call on doi.org/10.1177/0361198120933636.
states and localities to take responsibility for the safety of people walking on 11 Oak Ridge National Laboratory. (2019). Transportation Energy Data Book, Edition 38.
their streets and change how they design roads. See page 117. Available from: https://info.ornl.gov/sites/publications/Files/Pub132663.
pdf.
12 National Transportation Safety Board. (2018). Highway Special Investigation Report
This is a matter of life and death. We fervently hope the next edition of Pedestrian Safety, NTSB/SIR-18/03. Available from: https://www.ntsb.gov/news/
Dangerous by Design will tell a different story. events/Documents/2018-DCA15SS005-BMG-abstract.pdf/.
13 Smart Growth America. (2019). Dangerous by Design 2019 https://
smartgrowthamerica.org/dangerous-by-design-2019/.
DANGEROUS BY DESIGN 2021You can also read