The stratospheric Brewer-Dobson circulation inferred from age of air in the ERA5 reanalysis
←
→
Page content transcription
If your browser does not render page correctly, please read the page content below
Atmos. Chem. Phys., 21, 8393–8412, 2021
https://doi.org/10.5194/acp-21-8393-2021
© Author(s) 2021. This work is distributed under
the Creative Commons Attribution 4.0 License.

The stratospheric Brewer–Dobson circulation inferred from age of
air in the ERA5 reanalysis
Felix Ploeger1,2 , Mohamadou Diallo1 , Edward Charlesworth1 , Paul Konopka1 , Bernard Legras3 , Johannes C. Laube1 ,
Jens-Uwe Grooß1 , Gebhard Günther1 , Andreas Engel4 , and Martin Riese1
1 Institute for Energy and Climate Research: Stratosphere (IEK–7), Forschungszentrum Jülich, Jülich, Germany
2 Institute for Atmospheric and Environmental Research, University of Wuppertal, Wuppertal, Germany
3 Laboratoire de Météorologie Dynamique, UMR8539, IPSL, UPMC–ENS–CNRS–Ecole Polytechnique, Paris, France
4 Institute for Atmospheric and Environmental Sciences, Goethe University Frankfurt, Frankfurt, Germany

Correspondence: Felix Ploeger (f.ploeger@fz-juelich.de)

Received: 9 December 2020 – Discussion started: 12 January 2021
Revised: 26 April 2021 – Accepted: 27 April 2021 – Published: 2 June 2021

Abstract. This paper investigates the global stratospheric         lar, the shallow BDC branch accelerates in both reanalyses,
Brewer–Dobson circulation (BDC) in the ERA5 meteorolog-            whereas the deep branch accelerates in ERA5 and deceler-
ical reanalysis from the European Centre for Medium-Range          ates in ERA-Interim.
Weather Forecasts (ECMWF). The analysis is based on sim-
ulations of stratospheric mean age of air, including the full
age spectrum, with the Lagrangian transport model CLaMS
(Chemical Lagrangian Model of the Stratosphere), driven            1   Introduction
by reanalysis winds and total diabatic heating rates. ERA5-
based results are compared to results based on the preced-         The Brewer–Dobson circulation (BDC) is the global trans-
ing ERA-Interim reanalysis. Our results show a significantly       port circulation in the stratosphere that controls the trans-
slower BDC for ERA5 than for ERA-Interim, manifesting              port of chemical species and aerosol (e.g. Holton et al., 1995;
in weaker diabatic heating rates and higher age of air. In         Butchart, 2014). Changes in the BDC induce changes in ra-
the tropical lower stratosphere, heating rates are 30 %–40 %       diatively active trace gas species and hence may cause radia-
weaker in ERA5, likely correcting a bias in ERA-Interim. At        tive effects on climate. Therefore, BDC changes need to be
20 km and in the Northern Hemisphere (NH) stratosphere,            reliably represented in atmospheric models.
ERA5 age values are around the upper margin of the un-                The BDC is characterized by upwelling motion in the trop-
certainty range from historical tracer observations, indicat-      ics, poleward transport in the stratosphere, and downwelling
ing a somewhat slow–biased BDC. The age trend in ERA5              above middle and high latitudes. In addition, a mesospheric
over the 1989–2018 period is negative throughout the strato-       circulation branch transports air masses from the summer to
sphere, as climate models predict in response to global warm-      the winter pole. As pointed out by Haynes et al. (1991), the
ing. However, the age decrease is not linear but steplike, po-     BDC is mechanically driven by atmospheric waves propa-
tentially caused by multi-annual variability or changes in the     gating upwards from the troposphere and breaking at upper
observations included in the assimilation. During the 2002–        levels in the stratosphere where they deposit their momen-
2012 period, the ERA5 age shows a similar hemispheric              tum and cause the driving force. From a conceptual point of
dipole trend pattern as ERA-Interim, with age increasing in        view, the BDC can be divided into a residual mean mass cir-
the NH and decreasing in the Southern Hemisphere (SH).             culation and additional two-way eddy mixing (e.g. Neu and
Shifts in the age spectrum peak and residual circulation tran-     Plumb, 1999; Garny et al., 2014), which are both related to
sit times indicate that reanalysis differences in age are likely   the breaking of atmospheric waves. The residual circulation
caused by differences in the residual circulation. In particu-     and eddy mixing both affect trace gas distributions in a com-
                                                                   plex manner (e.g. Minganti et al., 2020). The climatological

Published by Copernicus Publications on behalf of the European Geosciences Union.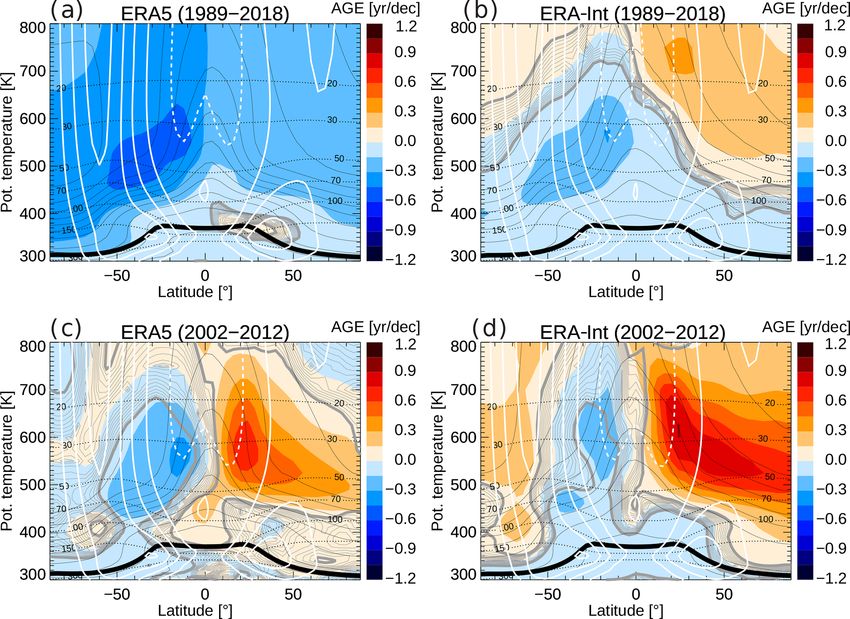
8394                                                                           F. Ploeger et al.: BDC and age of air in ERA5

structure of the BDC shows two main circulation branches:         no consensus has been reached amongst reanalyses, includ-
a shallow branch at lower levels (below about 20 km) which        ing ERA-Interim reanalysis from the ECMWF (Dee et al.,
causes rapid transport to high latitudes (transport timescales    2011), JRA-55 from the Japanese Meteorological Agency
of months), and a deep branch above with much longer trans-       (Kobayashi et al., 2015), and MERRA-2 from the National
port timescales of a few years (e.g. Plumb, 2002; Birner and      Aeronautics and Space Administration (Gelaro et al., 2017)
Bönisch, 2011; Lin and Fu, 2013).                                 concerning decadal age of air and BDC changes.
   Diagnosing the BDC and estimating its strength is a chal-         Very recently, the ECMWF released its newest-generation
lenging task due to the fact that the BDC is a zonal mean cir-    reanalysis product ERA5 (Hersbach et al., 2020). Compared
culation and that the mean vertical velocities are very slow      with its predecessor ERA-Interim, ERA5 is based on an im-
(less than 1 mm/s). In models, these slow velocities can be       proved forecast model version and improved data assimila-
computed (e.g. within the transformed Eulerian mean, TEM,         tion system (see Sect. 2.2 for further details). Case studies
framework, Andrews et al., 1987) but are likely affected by       on stratospheric and tropospheric transport indicate improve-
model numerics. For observations, the circulation strength        ments in the representation of physical processes, like con-
needs to be deduced from trace gas measurements. A com-           vection, in ERA5 (e.g. Li et al., 2020). Recently, Diallo et al.
mon diagnostic for the speed of the BDC is the stratospheric      (2021) analysed the ERA5 residual mean mass circulation of
age of air (Waugh and Hall, 2002). Due to atmospheric mix-        the BDC, its variability and trend, based on transformed Eu-
ing processes, a given air parcel in the stratosphere is char-    lerian mean (TEM) calculations. The present paper can be
acterized by a multitude of different transit times through       seen as being complementary, as it investigates the represen-
the stratosphere, defining the age spectrum (Hall and Plumb,      tation of the BDC in ERA5 in terms of stratospheric age of
1994). The first moment of the age spectrum defines the           air from transport model simulations and compares results
mean age of air. Due to its definition of being an average        to the previous ERA-Interim reanalysis. For this reason, we
transit time, mean age may give ambiguous results, whereas        carry out simulations of stratospheric age of air with the La-
the age spectrum is able to resolve the information on differ-    grangian CLaMS (Chemical Lagrangian Model of the Strato-
ent processes (Waugh and Hall, 2002).                             sphere) model over the 1979–2018 period driven by either
   Despite its crucial effects on atmospheric composition and     ERA5 or ERA-Interim reanalysis meteorology. Simulation
climate, no common understanding of long-term changes in          of the stratospheric age spectrum with CLaMS allows one
the BDC with increasing greenhouse gas levels has been            to attribute differences between the reanalyses to processes.
reached yet. On the one hand, climate models show a ro-           The main research questions are as follows:
bust strengthening and acceleration of the BDC with climate
change (e.g. Butchart et al., 2010), manifesting in an increase     1. How strong and fast is BDC transport in ERA5 com-
in tropical upwelling and a decrease in global mean age of air.        pared with ERA-Interim?
On the other hand, atmospheric trace gas measurements from
                                                                    2. How has the BDC (and age of air) changed over recent
balloon soundings in the Northern Hemisphere (NH) mid-
                                                                       decades?
latitudes show a non-significant long-term BDC trend over
the last few decades (Engel et al., 2009, 2017; Fritsch et al.,     3. How good is the agreement with age of air derived from
2020). Moreover, satellite measurement from the Michelson              trace gas observations?
Interferometer for Passive Atmospheric Sounding (MIPAS)
show no globally homogeneous mean age change over the             The analysis presented here contributes to the Processes And
2002–2012 period but a more detailed pattern with increas-        their Role in Climate (SPARC) Reanalysis Intercomparison
ing age in the NH and decreasing age in the Southern Hemi-        Project (S-RIP) (Fujiwara et al., 2017) and can be regarded
sphere (SH) (Stiller et al., 2012; Haenel et al., 2015).          as a follow-up of the analyses presented by Chabrillat et al.
   Coming along with improvements in model physics and            (2018) and Ploeger et al. (2019), where the BDC in ERA-
data assimilation systems, meteorological reanalyses have         Interim, JRA-55, and MERRA-2 reanalysis was compared in
been used more intensively for trend investigations in re-        terms of age of air. Here, we discuss the ERA5 results within
cent years. With transport driven by European Centre for          the context of the other reanalyses. For better comparabil-
Medium-Range Weather Forecasts (ECMWF) ERA-Interim                ity, we also present ERA-Interim results from Ploeger et al.
reanalysis, modelling studies have shown a weak increase in       (2019), although for an extended period, and juxtapose them
mean age in the NH middle stratosphere, qualitatively con-        with the new ERA5 results.
sistent with balloon observations (e.g. Diallo et al., 2012;         In a first step, in Sect. 2, the CLaMS model and age spec-
Monge-Sanz et al., 2012). However, more recent efforts com-       trum calculation are described as well as ERA5 reanalysis
bining different newest-generation reanalysis data sets have      data. A particular focus is laid on the ERA5 diabatic heating
shown a large dependency of BDC trend estimates on the            rate which is used to drive CLaMS model transport. There-
reanalysis used, for both residual circulation (Abalos et al.,    after, Sect. 3 presents the results related to the climatological
2015; Miyazaki et al., 2016) and age of air diagnostics           structure of the BDC, showing that ERA5 has a substantially
(Chabrillat et al., 2018; Ploeger et al., 2019). In particular,   slower BDC than ERA-Interim. Section 4 presents BDC and

Atmos. Chem. Phys., 21, 8393–8412, 2021                                             https://doi.org/10.5194/acp-21-8393-2021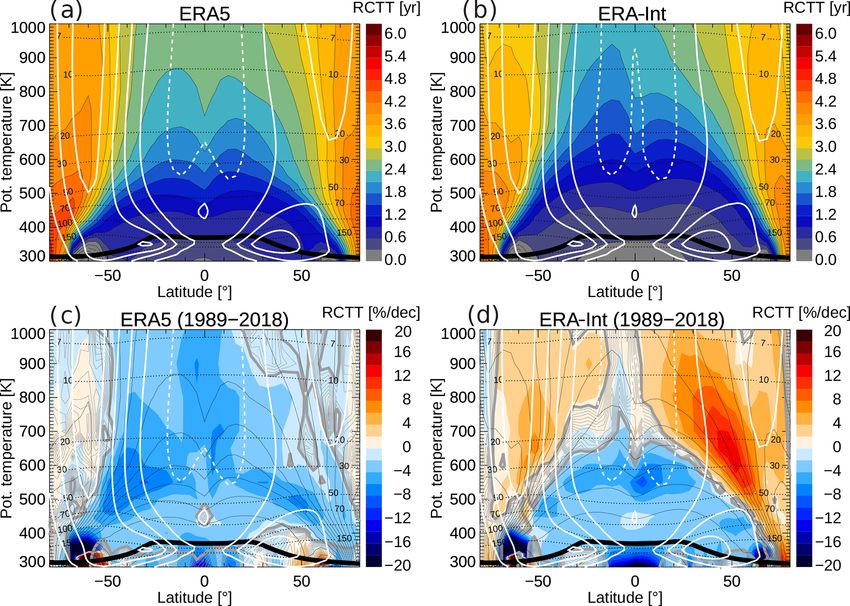
F. Ploeger et al.: BDC and age of air in ERA5                                                                                8395

age of air trends, showing a globally negative long-term trend     pulse duration of 1 month, and a pulse frequency of 2 months.
for ERA5 and a stronger variability compared with ERA-             The value of the age spectrum at transit time τi is then related
Interim. A comparison to age of air observations is presented      to the mixing ratio χi of the tracer pulsed at t − τi and sam-
in Sect. 5. The results are placed into the context of previous    pled at r (e.g. Li et al., 2012):
studies in the discussion in Sect. 6, and final conclusions are
summarized in Sect. 7.                                             G(r, t, τi ) = χi .                                         (1)

                                                                   Therefore, the use of 60 pulse tracers in the model with a
                                                                   pulse frequency of 2 months allows for the calculation of the
2     Data and method
                                                                   age spectrum over 10 years along the transit time axis (e.g.
                                                                   Ploeger et al., 2019). Mean age 0 is the average stratospheric
In this study, the BDC is investigated based on age of air cal-
                                                                   transit time and is defined as the first moment of the age spec-
culated with the CLaMS model driven by ERA5 and ERA-
                                                                   trum:
Interim reanalysis data. In the following, Sect. 2.1 describes
the CLaMS model and age of air calculation, and Sect. 2.2                      Z∞
briefly describes the ERA5 reanalysis with focus on the vari-      0(r, t) =     dτ τ G(r, t, τ ).                             (2)
ables used.
                                                                               0

2.1    Age of air simulations with the Chemical                       The two model simulations driven by either ERA5 or
       Lagrangian Model of the Stratosphere (CLaMS)                ERA-Interim cover the 1979–2018 period. Preceding 10-
                                                                   year spin-up simulations have been carried out by repeating
The CLaMS model is a Lagrangian chemistry transport                the meteorology of 1979. To eliminate the influence of this
model, with the transport scheme based on the calculation          spin-up on the age spectra, we focus on the 1989–2018 pe-
of 3D air parcel trajectories (which represent the model grid      riod (for most parts of the paper) when all memory of the
points) and a parameterization of small-scale atmospheric          spin-up in the 10-year-long age spectra is lost. As the model
mixing (McKenna et al., 2002; Konopka et al., 2004). This          age spectrum is truncated at 10 years, the respective mean
mixing parameterization is controlled by the shear in the          age will be biased low if no correction for the spectrum tail is
large-scale flow (via a critical Lyapunov exponent); thus,         taken into account. Therefore, throughout this paper, we con-
in regions of large flow deformations, strong mixing oc-           sider mean age calculated from an additional “clock tracer”
curs. The forward trajectory calculation is driven by offline      in CLaMS – a chemically inert tracer with linearly increasing
meteorological data. In this paper, we will use ERA5 and           mixing ratios at the surface (e.g. Hall and Plumb, 1994). This
ERA-Interim reanalysis data, which are further described in        clock-tracer mean age experienced a longer spin-up (mini-
Sect. 2.2.                                                         mum of 20 years at the beginning of the period considered in
   In the vertical direction CLaMS uses an isentropic ver-         1989) and is therefore higher compared with the spectrum-
tical coordinate which makes the model particularly well-          based mean age.
suited for the stratosphere, where diabatic transport is gen-         Note that, compared with Ploeger et al. (2019), small
erally weaker than adiabatic transport (e.g. McKenna et al.,       quantitative differences can occur due to the different periods
2002). Strictly speaking, the vertical coordinate in CLaMS         considered as well as due to the use of different mean age cal-
is a hybrid potential temperature which follows orography at       culation methods (clock-tracer-based versus spectrum-based
the surface and transforms smoothly into potential tempera-        methods; for a quantification of these differences, see Ploeger
ture θ above; thus, it equals θ above the σ = 0.3 surface (with    and Birner, 2016, their Figs. 4 and A1). Another difference to
σ = p/psurf ) and therefore throughout the stratosphere (e.g.      the simulations by Ploeger et al. (2019) concerns the cross-
Mahowald et al., 2002; Pommrich et al., 2014). The cross-          isentropic vertical velocities. Ploeger et al. (2019) added a
isentropic vertical velocity (also termed diabatic vertical ve-    constant correction term to the vertical velocity to correct for
locity in the following) is calculated from the reanalysis total   missing balance in the annual mean cross-isentropic mass
diabatic heating rate (see Sect. 2.2 for further details).         flux on a given θ level, as suggested by Rosenlof (1995)
   A calculation of the fully time-dependent stratospheric age     and implemented in CLaMS by Konopka et al. (2010). Here,
of air spectra has been implemented in CLaMS, based on             we do not include this mass correction and use the “raw”
multiple tracer pulses, as described by Ploeger et al. (2019)      reanalysis heating rate to simplify interpretation and repro-
and references therein. The age spectrum G(r, t, τ ) at a point    ducibility with other studies. For most of the results including
r in the stratosphere and time t is the distribution of transit    this annual mean mass balance causes no significant change.
times τ from the surface (or from the tropopause in some           However, it causes a clearer age decrease in the SH for mean
studies) to r. For the age spectrum calculation in CLaMS,          age trends after about 2002 (see Sect. 4).
chemically inert model tracers are pulsed in the orography-
following lowest model layer (approximately the boundary
layer) in the tropics (30◦ S–30◦ N) with a unit mixing ratio, a

https://doi.org/10.5194/acp-21-8393-2021                                                 Atmos. Chem. Phys., 21, 8393–8412, 2021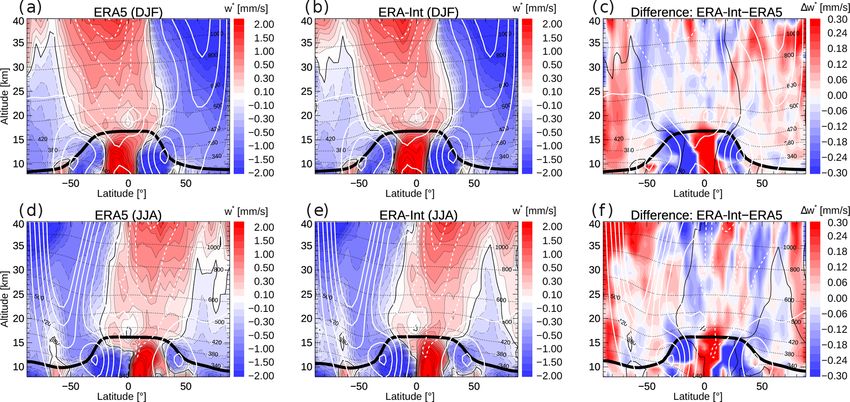
8396                                                                          F. Ploeger et al.: BDC and age of air in ERA5

2.2    ERA5 reanalysis                                            was described by Ploeger et al. (2010). In the following, we
                                                                  illustrate the similar (but not identical) procedure for ERA5.
The newest-generation ERA5 reanalysis from the European              Temperature tendencies are only available from the ERA5
Centre for Medium-Range Weather Forecasts (ECMWF) is              forecast data, which is stored twice per day (06:00 and
the successor of the previous ERA-Interim reanalysis (Dee         18:00 UTC) with forecast steps ranging between 1 and 18 h
et al., 2011). ERA5 is now available from 1979 to 2020 with       (1 h increments). These temperature tendencies have to be
production lagging real time by about 2 months. For the pro-      interpreted differently compared with ERA-Interim, as they
duction of ERA5, 4D-Var data assimilation of the ECMWF            are “mean rates”, representative of the interval between the
Integrated Forecast System (in cycle CY41R2) was used             actual time and the previous post-processing time. For in-
(Hersbach et al., 2020). The horizontal resolution is about       stance, the forecast data at 06:00 UTC with a 5 h forecast
30 km (T639). In the vertical, the pressure range from the        step are the mean tendency between 10:00 and 11:00 UTC.
surface to 0.01 hPa is covered with 137 hybrid levels. The        Temperature tendencies are provided in K/s (Kelvin per sec-
output frequency for ERA5 data is hourly. Due to a cold bias      ond). The CLaMS preprocessor assigns the forecast variables
in the lower stratosphere, the reanalysis data have been re-      to the reanalysis data set at the later time (here 11:00 UTC).
placed for the 2000–2006 period with the updated data set         This induces a time uncertainty of 0.5 h, which is negligible
named ERA5.1 (Simmons et al., 2020). For the present pa-          for the purpose of this paper.
per, we carried out CLaMS simulations driven by both the             Here, we did not use the hourly ERA5 data to drive model
previous (termed ERA5.0 in the following) and the corrected       transport; data subsampled in time are used instead. There-
ERA5.1 data (for simplicity, termed ERA5 in this paper), and      fore, the temperature tendencies have to be averaged appro-
we discuss the effects of the bias correction on the strato-      priately, as they represent accumulations since the previous
spheric BDC (Sect. 6). Further details on ERA5 can be found       post-processing time and not since the last forecast date. Oth-
in Hersbach et al. (2020).                                        erwise, sampling errors will occur. Hence, for the present
   For better comparability between the ERA5- and ERA-            case of using only 00:00, 06:00, 12:00, and 18:00 UTC data,
Interim-driven model simulations as well as for reasons re-       we average all tendency data sets within 6 h windows around
lated to practicability (storage and memory space), we use        each date. For instance, the mean tendency averaged over
6-hourly (00:00, 06:00, 12:00, and 18:00 UTC) ERA5 data           10:00–15:00 UTC (from forecast data at 06:00 UTC with 4–
with a truncated 1◦ × 1◦ horizontal resolution, downscaled        9 h steps, see above) is assigned to the reanalysis data at
using direct transformation from T1279 to 1◦ × 1◦ with auto-      12:00 UTC.
matic truncation to T213 as provided by the ECMWF MARS
processing system. However, we maintain the full vertical
resolution, as the necessary meteorological data are inter-       3   Climatological view on the stratospheric circulation
polated from the reanalysis fields on native ECMWF model
levels onto the Lagrangian CLaMS air parcels. Hence, the          As described in Sect. 2, CLaMS uses diabatic heating rates
ERA5 data to drive the CLaMS model in this study have             for driving vertical transport in the model. The climatologi-
137 hybrid ECMWF model levels; ERA-Interim data have              cal cross-isentropic (or diabatic) vertical velocity dθ/dt cal-
60 levels.                                                        culated from the diabatic heating rate for winter and sum-
   Of particular importance for the CLaMS model calcula-          mer seasons from ERA5 and ERA-Interim, and the respec-
tions is the reanalysis temperature tendency variable (dia-       tive differences, are shown in Fig. 1a–f. Overall, both re-
batic heating rate) which is used for deducing diabatic verti-    analyses show very similar distributions and seasonality for
cal velocity. Both ERA5 and ERA-Interim provide five tem-         dθ/dt. Diabatic tropical upwelling maximizes in boreal win-
perature tendencies: the mean temperature tendencies due to       ter (December–February, DJF), somewhat shifted into the
short-wave and long-wave radiation for both clear-sky and         summer subtropics, and the extratropical downwelling max-
all-sky conditions as well as the mean temperature tendency       imizes in the respective winter hemisphere. Further, heat-
due to all parameterizations (including the above-mentioned       ing rates show a double-peak structure above the tropical
radiative contributions, latent heat release, and turbulent and   tropopause with a minimum above the Equator. However,
sensitive heating). From the temperature tendency due to          quantitatively, clear differences also occur between the two
parameterizations (the total diabatic heating rate Qtot ), the    reanalyses, showing larger diabatic velocities (heating rates)
cross-isentropic vertical velocity dθ/dt for driving CLaMS        in the lower stratosphere (positive differences below about
transport is calculated as                                        600 K; Fig. 1c, f) in ERA-Interim and smaller heating rates
dθ    θ                                                           above. In particular, the zoomed view in Fig. 1g–i reveals that
   =      Qtot ,                                           (3)    in the 400–430 K layer (30◦ N–30◦ S) in ERA-Interim shows
dt   cp T
                                                                  about 40 % larger total diabatic heating rates than in ERA5.
where T is temperature, θ is the potential temperature, and cp    Furthermore, in the lowest tropical tropopause layer (TTL)
is the specific heat capacity at constant pressure. The calcu-    around the level of zero radiative heating (about 350 K), total
lation of cross-isentropic vertical velocity for ERA-Interim      diabatic heating rates are much weaker in ERA5 than ERA-

Atmos. Chem. Phys., 21, 8393–8412, 2021                                            https://doi.org/10.5194/acp-21-8393-2021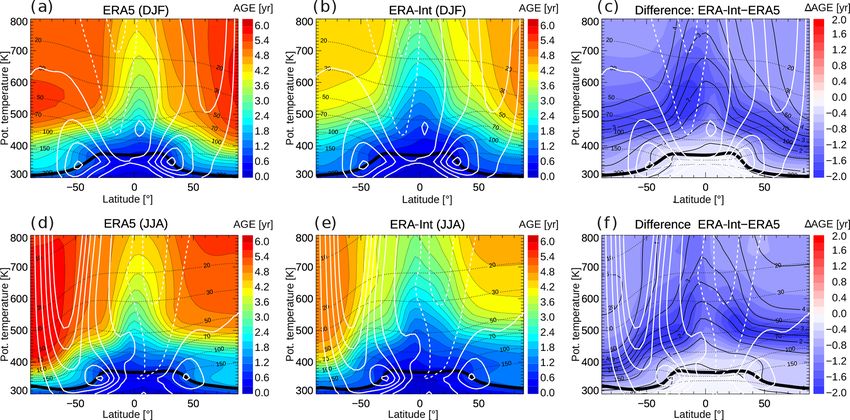
F. Ploeger et al.: BDC and age of air in ERA5                                                                                 8397

Interim, even showing no continuous upwelling in the an-           ence at about 22 km). Hence, the reanalysis differences in
nual mean in a shallow layer around 350 K (Fig. 1i). How-          upwelling in the TTL as diagnosed from w ∗ are qualitatively
ever, it should be noted that seasonal ERA5 heating rate av-       similar to those diagnosed from heating rates (up to 30 %–
erages show very weak zonal mean upwelling from the tro-           40 %, see Fig. 1). Above about 20 km, however, upwelling
posphere into the stratosphere in small latitude bands, which      from heating rates shows larger differences than upwelling
vanishes in the annual mean due to seasonal shifts. This much      from w ∗ . Downwelling differences are larger in the summer
weaker upwelling in the TTL and tropical lower stratosphere        than winter hemisphere, similar to the case of dθ/dt.
causes stronger restrictions on large-scale advective upward          The integrated effect of BDC transport in the two reanal-
transport in ERA5 and appears to correct an overestima-            yses is shown from climatological mean age of air for win-
tion in ERA-Interim (see Sect. 6). The heating rate differ-        ter and summer in Fig. 3. The general characteristics of the
ence below the tropopause will also affect the simulations         stratospheric mean age distribution are evident for both re-
of mean age, which is defined with respect to the surface          analyses, with age increasing with both altitude and latitude:
in this study. Another difference between the two reanaly-         low age in the tropical upwelling region and high age in ex-
ses concerns heating rates in the summertime stratosphere          tratropical downwelling regions. The oldest air is found in
above about 700 K (about 20 hPa), where ERA5 shows up-             the winter hemisphere, and it is even older in the SH dur-
ward velocities whereas ERA-Interim shows downward ve-             ing JJA compared with the NH during DJF. The summertime
locities. The upward velocities in ERA5 in that region are         lowest stratosphere (below about 450 K) is characterized by a
more consistent with the residual circulation vertical veloc-      “flushing” with young air (e.g. Hegglin and Shepherd, 2007;
ity (Fig. 2), which is further discussed below.                    Bönisch et al., 2009), which is strongest in the NH during
   Diallo et al. (2021) analysed the ERA5 BDC based on the         JJA. A particular feature in this region is an age inversion
TEM residual circulation vertical velocity, a common mea-          in the summertime NH with younger air (around 400 K) lo-
sure of the strength of the BDC (e.g. Andrews et al., 1987,        cated above older air (around 350 K), which is also appar-
Eq. 3.5.1b):                                                       ent in both reanalyses. This “eave structure” (i.e. younger
                                     !                             air above older air) in the summertime lower stratosphere
  ∗             1              v0θ 0                               age distribution has been recently discussed by Charlesworth
w =w+                ∂φ cos φ          ,                   (4)
             a cos φ           ∂z θ                                et al. (2020) and has been shown to depend critically on the
                                                                   numerics of the model transport scheme.
where the overline denotes the zonal mean and primes fluc-            Clear quantitative differences between ERA5 and ERA-
tuations therefrom (due to eddies), w is the vertical velocity     Interim age are evident in Fig. 3c and f, with significantly
in log-pressure z coordinates, a is the Earth’s radius, φ is       older air shown for ERA5. The largest differences of up
latitude, and v is the latitudinal wind component. Here, we        to about 2 years (equivalent to about 50 %–75 %) occur in
briefly recapitulate a few findings from that paper for ease of    the lower stratospheric regions where the climatological age
comparison to the heating-rate-based results.                      distribution (black contours) shows the strongest gradients.
   Figure 2 shows w∗ calculated from ERA5 and ERA-                 These differences indicate a downward shift of the locations
Interim during boreal winter (December–February, DJF) and          of the strongest age gradients and stronger gradients in ERA5
summer (June–August, JJA) and the respective reanalysis            compared with ERA-Interim.
differences, for comparison with the diabatic vertical veloc-         To gain deeper insight into transport processes and their
ity, calculated from the reanalysis diabatic heating rate. Over-   differences in the two reanalyses, we consider stratospheric
all, the w∗ distributions and seasonal differences for both re-    age spectra at the 400 and 600 K potential temperature levels,
analyses are very similar. Moreover, for w∗ , both reanalyses      which are representative of the shallow and the deep BDC
show stronger tropical upwelling in boreal winter, which is        branch respectively (see Fig. 2 for a relation between po-
somewhat shifted into the summer subtropics, and stronger          tential temperature and altitude levels). Figure 4 shows the
downwelling in the respective winter hemisphere. In particu-       CLaMS model age spectra at 400 K versus latitude for ERA5
lar in the winter hemisphere, contours of negative w ∗ repre-      and ERA-Interim for winter and summer. The spectra from
senting downwelling are very close for both reanalyses. Also       both reanalyses show similar overall characteristics and sea-
in the deep tropics close to the Equator around the 18 km          sonality, caused by known characteristics of BDC transport.
level (about 420 K potential temperature, 70 hPa pressure), a      The multi-modal spectrum shape, arising from the season-
minimum in upwelling (and even downwelling in JJA) oc-             ality in upward transport into the stratosphere and in the
curs similarly in both data sets. Minor differences between        strength of transport barriers, clearly emerges for both cases
ERA5 and ERA-Interim concern downward velocities in the            and appears strongest for middle-latitude and high-latitude
summer hemisphere and a stronger upwelling in the tropi-           spectra, which is consistent with previous studies (e.g. Rei-
cal lower stratosphere in ERA-Interim. In their Fig. 2, Diallo     thmeier et al., 2007; Li et al., 2012). In the tropics, age spec-
et al. (2021) showed that tropical upwelling differences in        tra are narrower and have a younger peak in boreal winter,
w∗ in the tropical lower stratosphere amount to about 40 %         indicating faster upwelling during that season. Weaker latitu-
at around 15 km and decrease above this level (zero differ-        dinal gradients in the summer hemisphere, especially in the

https://doi.org/10.5194/acp-21-8393-2021                                            Atmos. Chem. Phys., 21, 8393–8412, 2021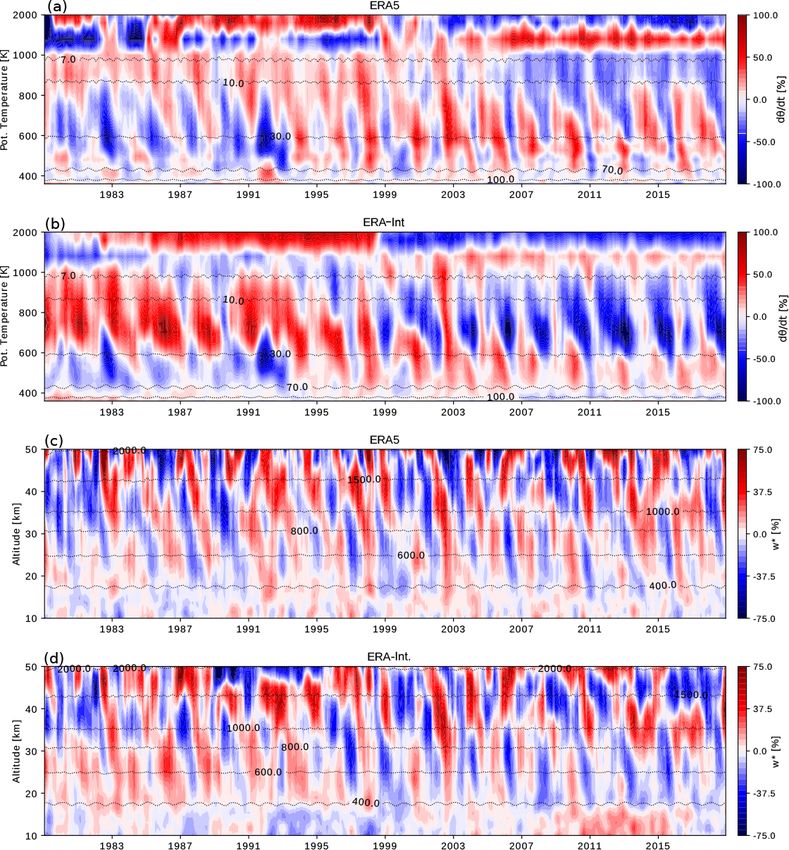
8398 F. Ploeger et al.: BDC and age of air in ERA5
Figure 1. Diabatic vertical velocity dθ/dt climatology (1979–2018), calculated from the total diabatic heating rate, for boreal winter
(December–February, DJF) from (a) ERA5, (b) ERA-Interim, and (c) the difference ERA-Interim minus ERA5. Panels (d)–(f) are the
same but for boreal summer (June–August, JJA). Panels (g)–(i) show a zoomed in view of the tropical lower stratosphere annual mean heat-
ing rates. Note the different colour scale for the difference plots. Heating rate contours are highlighted in black (dashed for negative values).
The thin black contour in the difference plot shows the zero contour from ERA-Interim. White contours show zonal wind (in ±10 m/s steps;
easterly wind dashed), the thin dashed black lines show pressure levels, and the thick black line shows the (WMO lapse rate) tropopause.
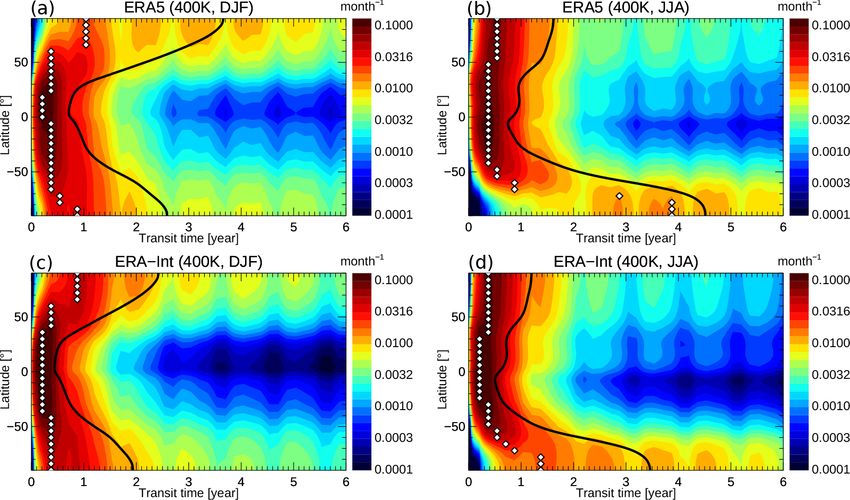
NH during JJA, are a sign of stronger mixing in summer. The higher fraction of young air at high latitudes for ERA-Interim
flushing of the summertime lower stratosphere with young than for ERA5.
air can be seen from the extent of the young air peak to high Similar conclusions hold for the age spectrum comparison
latitudes in the summer hemisphere (e.g. Fig. 4b, d). at 600 K (Fig. 5). While the general spectrum characteristics
Closer inspection reveals differences between ERA5 and are similar for ERA5 and ERA-Interim, clear detailed differ-
ERA-Interim age spectra. In the tropics, the main spectrum ences occur in the spectrum shape. ERA5 spectra are shifted
peak is broader and is shifted to larger transit times for towards older transit times and show an older peak compared
ERA5, which is related to slower tropical upwelling com- with ERA-Interim, as found similarly at the lower 400 K
pared with ERA-Interim. At high latitudes this shift of ERA5 level. In the tropics, these differences are particularly clear
age spectra towards older transit times is even clearer, indi- with the shift of the spectrum peak to older ages in ERA5
cating slower transport along the BDC and a stronger con- compared with ERA-Interim indicating slower residual cir-
finement of polar regions in ERA5. The clearest differences culation upwelling (e.g. Li et al., 2012; Ploeger and Birner,
occur in the SH polar vortex during winter (JJA) where the 2016). This slower residual circulation upwelling is consis-
modal age (transit time of the largest spectrum peak) for tent with the weaker diabatic heating rates in the TTL and
ERA5 is at about 4 years, whereas the modal age occurs lower tropical stratosphere in Fig. 1. Moreover, the larger ex-
at 1.4 years for ERA-Interim. Hence, there is a significantly tent of the youngest spectrum peak towards high latitudes in
the summer hemisphere (e.g. in the NH during JJA in Fig. 5b
Atmos. Chem. Phys., 21, 8393–8412, 2021 https://doi.org/10.5194/acp-21-8393-2021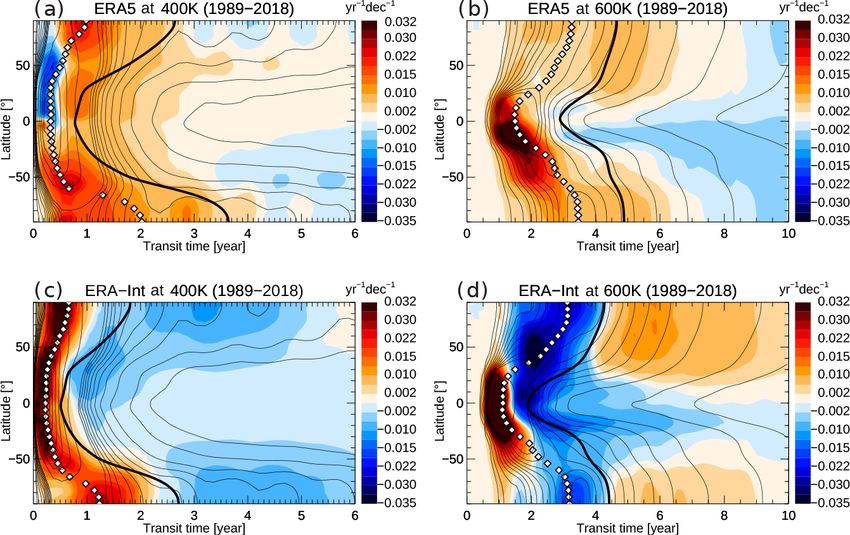
F. Ploeger et al.: BDC and age of air in ERA5                                                                                        8399

Figure 2. Residual circulation vertical velocity w∗ climatology (1979–2018) for boreal winter (December–February, DJF) from (a) ERA5,
(b) ERA-Interim, and (c) the difference ERA-Interim minus ERA5. Panels (d)–(f) are the same but for boreal summer (June–August, JJA).
Note the different colour scale for the difference plots. Circulation contours are highlighted in black (dashed for negative values). White
contours show zonal wind (in ±10 m/s steps; easterly wind dashed), the thin dashed black lines show potential temperature levels, and the
thick black line shows the (WMO lapse rate) tropopause. The y axis is log-pressure altitude.

Figure 3. Mean age climatology (1989–2018) for boreal winter (December–February, DJF) from ERA5 (a), ERA-Interim (b), and the
difference (c). Panels (d)–(f) are the same but for boreal summer (June–August, JJA). White contours show zonal wind (in ±10 m/s steps;
easterly wind dashed), the thin dashed black lines show pressure levels, and the thick black line shows the (WMO lapse rate) tropopause.

https://doi.org/10.5194/acp-21-8393-2021                                                  Atmos. Chem. Phys., 21, 8393–8412, 2021
8400                                                                                 F. Ploeger et al.: BDC and age of air in ERA5

Figure 4. Age spectra at 400 K (1989–2018 climatology) from ERA5 for boreal winter (a) and summer (b). Panels (c) and (d) are the same
but for age spectra from ERA-Interim. The black contour shows mean age (calculated as the first moment of spectra), and the white diamonds
show modal age (peak of the spectrum).

and in the SH during DJF in Fig. 5c) shows faster transport            increasing age. These differences will be further discussed in
of young air towards the pole in ERA-Interim than in ERA5.             Sect. 6.
                                                                          For the shorter period from 2002 to 2012, both reanalyses
                                                                       show qualitatively similar mean age changes, with increas-
4   Circulation and age changes over (multi-)decadal                   ing age in the NH and decreasing age in the SH (Fig. 6c,
    timescales                                                         d). Detailed differences concern a weaker NH age increase
                                                                       and a stronger SH age decrease in ERA5 compared with
Trends in mean age over the entire 30-year period from 1989            ERA-Interim. In the lowest tropical and subtropical strato-
to 2018 and over the 2002–2012 period are shown in Fig. 6.             sphere, ERA5 shows significantly increasing age, although
The trends are calculated from linear regression of the desea-         non-significant changes in some regions, compared with de-
sonalized time series (after subtracting the mean annual cy-           creasing age or insignificant trends in ERA-Interim in this
cle at each grid point). The regression did not attempt to ex-         region. Hence, changes in the shallow BDC branch over
tract any signals of interannual variability such as the Quasi-        this short period are not consistent between the two reanal-
Biennial Oscillation, the El Niño–Southern Oscillation, or             yses. The small quantitative differences for the 2002–2012
volcanic influence. The standard deviation from the regres-            ERA-Interim age trends compared with recent publications
sion provides a 1σ range for assessing the significance of             of CLaMS-simulated mean age (e.g. Stiller et al., 2017) are
the calculated trends. Even over 30 years, the trend values            related to the use of clock-tracer-based versus age-spectrum-
are still affected by decadal variability, as will be discussed        based mean age and to the updates in the model configuration
at the end of this section. Nevertheless, for simplicity, we use       (e.g. exclusion of annual mean cross-isentropic mass balance
the term “trend” in this paper but note that our results concern       here), as explained in Sect. 2.1.
changes over 30 years and not over centennial timescales, as              Trends in the age spectrum provide more detailed informa-
is often the case for climate model experiments.                       tion about changes in transport processes and are presented
   Evidently, ERA5 shows a negative age trend throughout               in Fig. 7 for the 1989–2018 period (for the two levels of 400
the stratosphere over the longer period, with the strongest de-        and 600 K). ERA5 age spectra show a shift of the spectrum
creases of up to −0.5 years per decade in the SH subtropics            peak towards a younger age for most regions, as indicated
and mid-latitudes. In the SH and in the lowest stratosphere            by comparatively strong positive spectrum trends at transit
(below about 450 K), this negative age trend qualitatively             times shorter than the modal age (indicating an increase in
agrees with the trend from ERA-Interim. In particular in the           the mass fraction of young air). Such a decrease in modal
NH above about 500 K, however, the signs of the trends in              age can be interpreted as an acceleration of the residual cir-
the two reanalyses are inverse, with ERA-Interim showing

Atmos. Chem. Phys., 21, 8393–8412, 2021                                                   https://doi.org/10.5194/acp-21-8393-2021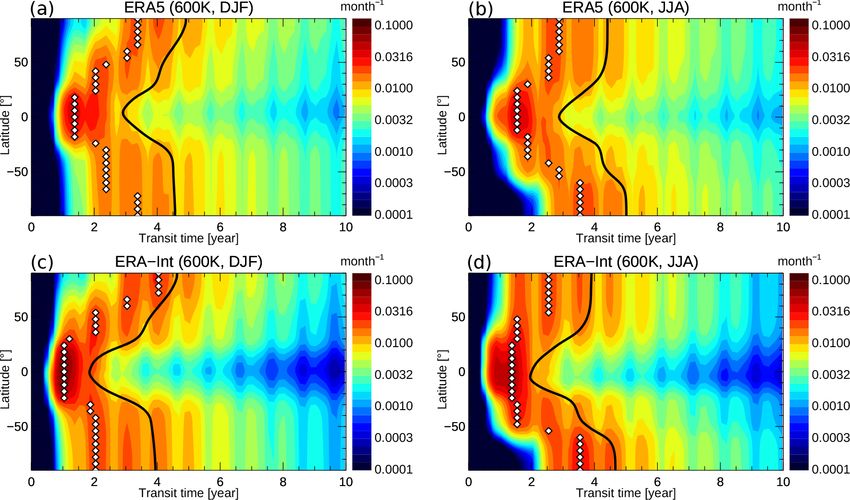
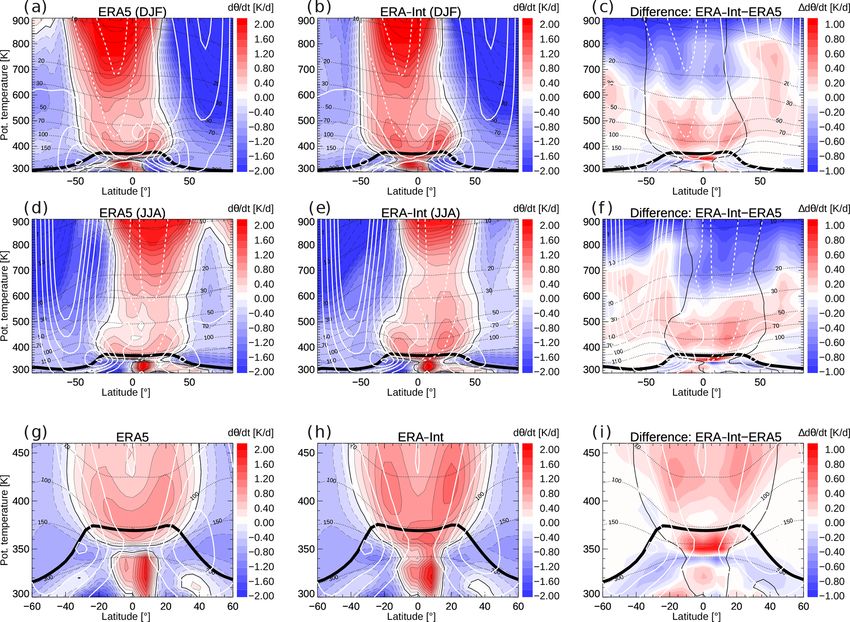
F. Ploeger et al.: BDC and age of air in ERA5                                                                                        8401

Figure 5. Same as Fig. 4 but at 600 K.

Figure 6. Mean age trends for the 1989–2018 period from ERA5 (a) and ERA-Interim (b). Panels (c) and (d) are the same but for the
2002–2012 period. Black contours (solid) show the climatological mean age, the thin dashed black lines show pressure levels, the white
contours show zonal wind (in ±10 m/s steps; easterly wind dashed), and the thick black line shows the tropopause. The significance of the
linear trend, measured in multiples of the standard deviation σ , is shown as grey contours (the 2σ contour is thick, and the contours then
decrease with a 0.2 step – shown by thin lines).

https://doi.org/10.5194/acp-21-8393-2021                                                  Atmos. Chem. Phys., 21, 8393–8412, 2021
8402                                                                            F. Ploeger et al.: BDC and age of air in ERA5

culation, at least in the tropics and in the winter hemisphere     deep branch of the residual circulation clearly differ between
extratropics (e.g. Li et al., 2012; Ploeger and Birner, 2016).     the reanalyses, with a weakly strengthening deep branch in
In the tropics and SH, this modal age shift and residual cir-      ERA5 and a weakening deep branch in ERA-Interim.
culation acceleration is clearest. In the NH in a shallow layer       Figure 9 provides further insights into the temporal evo-
around the 400 K level between 0 and 50◦ N, the age changes        lution of mean age at three different locations in the strato-
are different, with a decrease in the young air fraction (tran-    sphere. The three locations have been chosen to be represen-
sit times shorter than modal age) causing weak positive mean       tative of the tropical lower stratosphere, and the NH and SH
age changes (cf. Figs. 7a and 6a).                                 subtropical stratosphere regions of strong mean age trends
   The clearest difference with respect to ERA-Interim re-         (cf. Figs. 6 and 9). In the tropical lower stratosphere (450 K
garding structural age spectrum changes emerges at middle          and 10◦ S–10◦ N; Fig. 9a), the relative difference between
and high latitudes at upper levels (here 600 K; Fig. 7b, d). On    ERA5 and ERA-Interim is large and the variability in ERA5
the one hand, ERA5 shows a shift of the spectrum to younger        mean age is significantly stronger than in ERA-Interim. At
ages, although not as clear as in the tropics and in the SH. On    the higher levels, the variability in mean age in the two re-
the other hand, ERA-Interim shows a decrease in the fraction       analyses is more comparable in magnitude. From a qual-
of air younger than about 4 years old and an increase in the       itative point of view, the variability is similar at all loca-
fraction of older air. This increased fraction of air older than   tions, with coinciding ups and downs in the age time series,
about 4 years old in ERA-Interim indicates a deceleration          caused by factors such as modulations in the BDC related to
of the deep branch of the residual circulation. The different      the Quasi-Biennial Oscillation, QBO, or El Niño–Southern
spectrum changes in ERA5 and ERA-Interim cause the in-             Oscillation, ENSO (e.g. Calvo et al., 2010; Konopka et al.,
verse mean age changes in the two reanalyses (Fig. 6) and          2016). A particularly striking feature is the anomalously high
are related to different trends in the deep BDC branch, as         mean age following the year 1991, which is even higher for
evident from further analysis of the residual circulation (see     ERA5 than ERA-Interim. This significant increase in strato-
below).                                                            spheric mean age in reanalyses has been related to the Mt.
   Changes in the structure of the residual circulation are        Pinatubo eruption in June 1991 (Diallo et al., 2017).
further investigated using residual circulation transit times         While Fig. 6 suggests a clear decrease in ERA5 mean age
(RCTTs), the pure transit time for (hypothetical) air parcels      throughout the global stratosphere, the time series in Fig. 9
in the 2D residual circulation flow (e.g. Birner and Bönisch,      show that this decrease is not a simple linear trend over the
2011). Here, the RCTTs have been calculated in isentropic          30 years considered. In fact, outside the tropics, mean age
coordinates using the same reanalysis diabatic heating rates       appears to increase before about 1991 in both hemispheres
as in the full CLaMS simulation for calculating vertical mo-       as well as in the NH after about the year 2000. During the
tion (e.g. Ploeger et al., 2019). RCTTs cannot be easily com-      1990s, mean age decreases in ERA5. These steplike changes
pared to mean age, as differences between both quantities are      are evident in both reanalyses. In the early 1990s, these age
related to mixing effects (e.g. Garny et al., 2014; Dietmüller     changes are likely related to the Pinatubo eruption (i.e. true
et al., 2017). Figure 8 shows the climatology and percent-         atmospheric variability), whereas at the end of the 1990s,
age trend in RCTTs for the 1989–2018 period for ERA5 and           they could be related to changes in the observing system as-
ERA-Interim. Comparison of climatological RCTTs shows              similated by the reanalyses (see Sect. 6 and Chabrillat et al.,
substantially longer transit times for ERA5 than for ERA-          2018). In particular in the NH (Fig. 9c), the negative age
Interim (up to 40 % longer in the lower stratosphere), which       trend in ERA5 during the 1989–2018 period appears to be
is consistent with the slower circulation in ERA5 as already       related to the strongly increased age values at the beginning
diagnosed from heating rates, w ∗ , and age of air. The trends     of the period. Further discussion of these steplike changes in
in RCTTs in Fig. 8c and d indicate differences between the         the age of air time series is presented in Sect. 6.
reanalyses regarding changes in the structure of the BDC. In
the lower stratosphere below about 600 K, both reanalyses
show consistent changes, with decreasing RCTTs indicating          5   Comparison to trace gas observations
a strengthening of the shallow residual circulation branch. In
the tropical lower stratosphere, the residual circulation ac-      Climatological reanalysis mean age at 20 km altitude is com-
celerates by about 2.4 % per decade in ERA5 and 2.2 % per          pared to mean age from CO2 and SF6 trace gas measure-
decade in ERA-Interim, as diagnosed from the RCTT trend            ments in Fig. 10. Comparison is made to data from in situ
(20◦ N–20◦ S, 450 K average, approximately 70 hPa). Clear          observations onboard the NASA ER-2 aircraft (as compiled
differences emerge at higher levels and also at higher lati-       by Waugh and Hall, 2002; see the references therein for a de-
tudes and, hence, appear in atmospheric regions of the deep        tailed description of the data). It should be noted that we con-
circulation branch. In these regions, ERA5 still shows de-         sider this data set as an observational climatological bench-
creasing RCTTs; this change becomes insignificant at high          mark here, as similarly done in other model comparisons
latitudes. ERA-Interim, on the other hand, shows increasing        (e.g. Chabrillat et al., 2018; Diallo et al., 2012), although the
RCTTs, which is clearest in the NH. Hence, changes in the          ER-2 flights were carried out during the 1992–1997 period,

Atmos. Chem. Phys., 21, 8393–8412, 2021                                              https://doi.org/10.5194/acp-21-8393-2021
F. Ploeger et al.: BDC and age of air in ERA5                                                                                        8403

Figure 7. Age spectrum trend for the 1989–2018 period from ERA5 at 400 K (a) and at 600 K (c). Panels (c) and (d) are the same but for
ERA-Interim. The thin black contours show annual mean age spectra, the thick black contour shows mean age (calculated as the first moment
of spectra), and the white diamonds show modal age (peak of the spectrum). Note the different x axis scales for the two levels.

Figure 8. Residual circulation transit times (RCTTs) from ERA5 (a) and ERA-Interim (b) and their trends over the 1989–2018 period (c,
d). The thin black lines in panels (c) and (d) show climatological RCTT contours (in 0.3 year steps). The white contours show zonal wind
(in ±10 m/s steps; easterly wind dashed), the thin dashed black lines show potential temperature levels, and the thick black line shows the
(WMO lapse rate) tropopause. The significance of the linear trend, measured in multiples of the standard deviation σ , is shown as grey
contours (the 2σ contour is thick, and the contours then decrease with a 0.2 step – shown by thin lines).

https://doi.org/10.5194/acp-21-8393-2021                                                  Atmos. Chem. Phys., 21, 8393–8412, 2021
8404 F. Ploeger et al.: BDC and age of air in ERA5
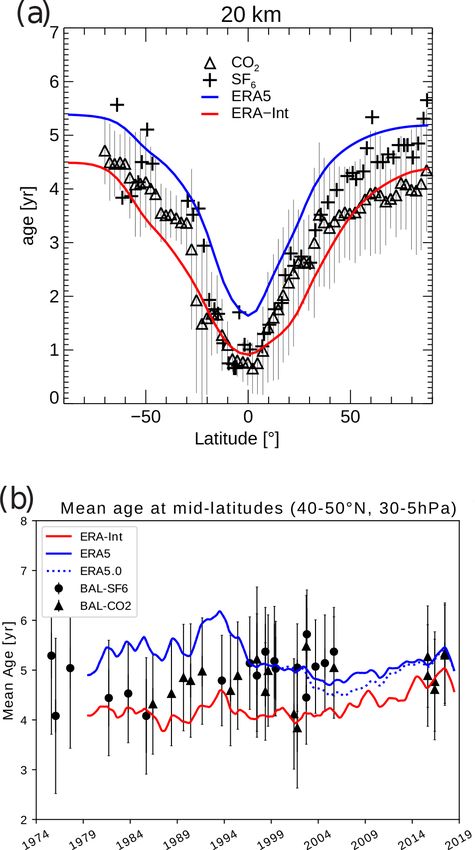
Figure 9. Mean age time series from ERA5 and ERA-Interim in Figure 10. (a) Mean age of air at 20 km at different latitudes from in
the (a) tropics at 450 K and 10◦ S–10◦ N, in the (b) SH subtropics situ observations (black symbols, from Waugh, 2009), from ERA5
at 500 K and 30–50◦ S, and in the (c) SH subtropics at 600 K and (blue) and ERA-Interim (red) driven CLaMS simulations. (b) Mean
30–50◦ N. The blue dotted line shows mean age from the sensitiv- age time series in the NH middle latitudes (40–50◦ N and 30–5 hPa,
ity model simulation driven by the uncorrected ERA5.0 data (see approximately 600–1200 K for reanalyses). Coloured lines show
text). Data have been deseasonalized by applying a 12-month run- the mean age from reanalyses (smoothed with a 12-month running
ning mean. mean), and black symbols show the mean age from the balloon-
borne observations of Engel et al. (2017), with error bars represent-
ing the uncertainty of the observations.
whereas the model data in Fig. 10a are a climatology over
the 1989–2018 period. In general, uncertainties in observa- ham Elvidge et al. (2018) showed that the SF6 -based mean
tional mean age estimates are related to non-linearities and age may be biased high even outside of the polar vortex. On
imperfect knowledge in tropospheric growth rates, sampling the other hand, the ERA5 age data show a steeper latitudinal
issues, chemistry effects, and measurement errors (Waugh gradient in the subtropics which agrees slightly better with
and Hall, 2002). The mean age deduced from observed SF6 the steep gradient in the age observed in situ compared with
is higher than mean age deduced from CO2 , which is consis- ERA-Interim.
tent with the existence of a significant SF6 chemical sink in Figure 10b presents a comparison of mean age time se-
the mesosphere (Ray et al., 2017). The latitudinal age distri- ries in the NH middle stratosphere (model data averaged
bution in ERA-Interim agrees well with the in situ data (best over 40–50◦ N, 30–5 hPa) with the balloon-borne observa-
for CO2 -based mean age), whereas the higher ERA5 mean tions of Engel et al. (2017). The observational uncertainty
age values are just at the upper margin of the uncertainty range includes uncertainty related to the sampling (repre-
range of the in situ SF6 -based observations. Recently, Leed- sentativeness), tropospheric mixing ratios, the age spectrum
Atmos. Chem. Phys., 21, 8393–8412, 2021 https://doi.org/10.5194/acp-21-8393-2021F. Ploeger et al.: BDC and age of air in ERA5 8405
parameterization used, and the absolute measurement error
(for details, see Engel et al., 2009). The comparison again
shows that ERA5 age is at the upper edge of the observa-
tional uncertainty range before about 1997, whereas ERA-
Interim is at the lower edge (Fig. 10b). Regarding the trend,
the more gradual increase in ERA-Interim mean age appears
to compare better to the observed data than the temporal evo-
lution of ERA5 mean age. In particular the strong decrease
in ERA5 age in the mid-1990s is not present in the obser-
vations. Although computing a linear trend for a time series
with a steplike change (such as that for ERA5) is question-
able, for completeness we note the trend values from a sim-
ple linear regression over the 1989–2018 period for ERA5
(−0.13 ± 0.01 years per decade, where the error is the 1σ
standard deviation range from the regression) and for ERA-
Figure 11. Difference in mean age between model and Geophys-
Interim (0.15 ± 0.01 years per decade). The trend value for
ica aircraft observations for ERA5 (red) and ERA-Interim (black).
ERA-Interim agrees with the value stated by Engel et al.
Shown are frequency distributions of the mean age differences
(2017), although the observational trend is not significant. (bin size of 0.1 year) taken in the extratropical lower stratosphere,
Furthermore, Fritsch et al. (2020) recently showed that the about 350–480 K (for details on the measurements, see Laube et al.,
calculated value for the observed mean age trend depends 2020). The grey shading shows the mean uncertainty range of the
critically on the estimated age spectrum shape, and it ap- observations (±0.78 years), the red and black symbols show the
proaches zero for more recent parameter settings suggested mean differences, and the error bars show their standard deviation
by (Hauck et al., 2019). Hence, the comparison between the (1σ ) range. The numbers in the legend are the mean difference val-
ERA-Interim and the observed trend values should not be ues (in years) and the percentage of data outside this uncertainty
over-interpreted, especially given the differences between the range.
single data points of the two time series in Fig. 10b.
Figure 11 further compares the reanalysis mean age to
in situ observations from Geophysica high-altitude aircraft tional 1σ range. Hence, ERA5 mean age appears to be bi-
flights in the NH lower stratosphere (for a detailed descrip- ased somewhat high in the lower stratosphere. However, the
tion of the measurement data, see Laube et al., 2020). The 1σ ranges of the mean ERA5 difference (0.43 years, also for
observations were taken during five measurement campaigns ERA-Interim) and the observational uncertainty overlap (see
over the 2009–2017 period in the NH lower stratosphere Fig. 11), and the mean ERA5 bias in age here is not sig-
(about 350–480 K potential temperature). Mean age has been nificant at the 66 % confidence level. Moreover, recent stud-
calculated from measured mixing ratios of CF4 , C2 F6 , C3 F8 , ies have indicated even higher uncertainties for observational
CHF3 , and HFC-125. The observational uncertainty range mean age estimates (Hauck et al., 2019; Fritsch et al., 2020),
has been estimated following (Engel et al., 2009), consid- and the considered Geophysica observations are only from
ering uncertainties related to non-linearities in tropospheric five campaigns localized in time and space, such that it is un-
mixing ratios, age spectrum parameterization, and measure- clear whether the differences found can be considered as a
ment errors, summing up to an overall uncertainty range of global bias.
±0.78 years (to be interpreted as 1σ range). The model out-
put has been sampled along the measurement flight coordi-
nates such that no representativeness errors need to be in- 6 Discussion
cluded. Figure 11 shows the distribution of differences be-
tween the model and observational mean age for mean ages Recent studies have stated a substantial uncertainty in the cli-
higher than 1 year (to exclude the tropopause region, where matological strength and trends of the stratospheric BDC and
the uncertainty in both the observational and model mean age age of air in current-generation reanalyses (e.g. Abalos et al.,
is large, which is related to air entering across the extratrop- 2015; Miyazaki et al., 2016; Chabrillat et al., 2018; Ploeger
ical tropopause). For ERA-Interim, the figure shows that the et al., 2019). Among the reanalyses considered, JRA-55 was
model bias distribution, estimated as the difference between shown to have the fastest BDC and MERRA-2 was shown
simulated and observed mean age, is largely within the obser- to have the slowest BDC, with ERA-Interim-based results
vational uncertainty range (shown as grey shading in Fig. 11, in between. In the present study, we find the BDC in ERA5
only 21 % of data are outside this range). For ERA5, on the to be significantly slower and age of air significantly higher
other hand, the bias distribution is shifted to mean age dif- than in ERA-Interim (e.g. Figs. 1 and 3).
ferences of around 1 year and is skewed towards even higher It is currently unclear whether the representation of the
values, such that 56 % of the data are outside the observa- BDC in ERA5 is improved compared with the older reanal-
https://doi.org/10.5194/acp-21-8393-2021 Atmos. Chem. Phys., 21, 8393–8412, 20218406 F. Ploeger et al.: BDC and age of air in ERA5 yses. In the tropical lower stratosphere, the weaker heating The globally negative age of air trend in ERA5 over rates in ERA5 are consistent with slower residual circula- the 1989–2018 period agrees qualitatively with results from tion upwelling found by Diallo et al. (2021), and they appear climate model simulations, showing an accelerating BDC to correct the 30 %–40 % high bias in ERA-Interim heating and decreasing mean age over multi-decadal timescales in rates in the tropical tropopause layer (TTL) found in previous response to increasing greenhouse gas concentrations. In studies (e.g. Ploeger et al., 2012; Schoeberl et al., 2012). On the tropical lower stratosphere, the residual circulation up- the other hand, the minimum in tropical upwelling around welling increase of 2.4 % per decade in ERA5, as inferred the level of zero radiative heating (around 350 K) is much from RCTTs, even agrees quantitatively with climate model more pronounced for ERA5 than for ERA-Interim, with heat- predictions of 2 % per decade to 3 % per decade (e.g. ing rates even showing a gap in annual mean upwelling in a Butchart, 2014). In the lower tropical stratosphere, the resid- shallow layer, similar to the case in the MERRA-2 reanaly- ual circulation acceleration in ERA-Interim is similar (see sis (e.g. compare Fig. 1 in this paper with Fig. 5 of Ploeger Sect. 4). However, this acceleration of the residual circula- et al., 2019). In a recent paper, Wright et al. (2020) linked dif- tion reaches substantially higher values in ERA5, whereas ferences in reanalysis diabatic heating rates to differences in the deep BDC branch decelerates in ERA-Interim (Fig. 8). the representation of clouds. They argued that the upwelling In a recent study, Diallo et al. (2021) compared the resid- gap in ERA5 and MERRA-2 is likely caused by higher cloud ual circulation in ERA5 and ERA-Interim based on residual water content in these two reanalyses and the related radia- circulation vertical velocity w ∗ and stream function. They tive effects. Indeed, seasonal means of ERA5 heating rates showed, using these standard circulation metrics, that the also show upwelling at the lower TTL levels, but it is very BDC in ERA5 is significantly slower than in ERA-Interim, confined regionally and much weaker than for ERA-Interim. which is consistent with the findings here based on age of Hence, while the representation of tropical upwelling seems air and the diabatic circulation (heating rate based). Further- to be improved in ERA5 in the tropical lower stratosphere more, they related the weaker residual circulation to weaker and upper TTL (about 100–50 hPa), it is unclear whether gravity wave drag at the upper flanks of the subtropical jets in the very weak total diabatic heating rates in the upper tro- ERA5 compared with ERA-Interim. Moreover, differences posphere and lower TTL (200–100 hPa) are realistic. Above in trends in w ∗ were shown to likely be caused by differences the TTL and in the NH stratosphere, age of air in ERA5 in gravity wave drag. Given the qualitatively similar results is at the upper edge of the uncertainty range of in situ ob- between age of air and residual circulation regarding both servations (Fig. 10a). In particular in the NH lower strato- the weaker climatological BDC and more negative trends in sphere, comparison to Geophysica aircraft in situ observa- ERA5, it seems likely that reanalysis differences between tions from Laube et al. (2020) shows that ERA5 mean age ERA5 and ERA-Interim in age of air are mainly caused by is biased somewhat high and the ERA5 BDC somewhat too the differences in residual circulation and that mixing differ- slow (Fig. 11). Hence, all comparisons to observational data ences only play an amplifying role (as suggested for different presented here indicate that the slow ERA5 BDC is at the up- data by Garny et al., 2014). The clear differences in the age per margin of the observational uncertainty range. However, spectrum peaks (modal ages; cf. Figs. 4, 5, and 7) corroborate these differences are not significant due to the large obser- the idea that residual circulation differences cause the mean vational uncertainty range and the fact that the observations age differences. An investigation of mixing in ERA5 based considered are highly localized in time and space. Hence, it on the computation of effective diffusivity (e.g. Haynes and is unclear whether the high age and slow BDC in ERA5 rep- Shuckburgh, 2000), as has been realized for other reanaly- resents a global bias. ses recently (e.g. Abalos et al., 2017), could shed more light Comparison of age of air trends shows a similar hemi- on the role of mixing processes for age of air differences be- spheric dipole pattern over the 2002–2012 period for ERA5 tween the reanalyses. as for ERA-Interim, which was argued by Stiller et al. (2017) A closer look shows that the decrease in mean age in to agree qualitatively with the structural circulation change ERA5 is not simply linear, particularly in the NH. Mean age observed by MIPAS. This observed increase in age in the time series even show weak increases before about 1991 and NH and decrease in age in the SH has not been found for after about 2000 as well as a decrease in between. Although “non-ECMWF” reanalyses to date (Chabrillat et al., 2018; these steplike changes are also visible in ERA-Interim to Ploeger et al., 2019). Regarding the long-term trend in the some degree, they are much more distinct in ERA5. It is un- NH, ERA5 and ERA-Interim show differences. While ERA- clear whether these changes in mean age can be explained Interim shows weakly increasing age of air, more consistent by known factors of multi-annual to decadal variability or with non-significant trend values from balloon-borne in situ whether they are related to changes in the observations in- observations (Engel et al., 2017; Fritsch et al., 2020), ERA5 cluded in the reanalysis assimilation system. To investigate shows decreasing age. Overall, the agreement with strato- potential discontinuities in the reanalysis, Fig. 12 presents spheric age of air observations appears slightly better for tropical mean (30◦ N–30◦ S) anomaly time series for total di- ERA-Interim compared with ERA5, although with both re- abatic vertical velocity and residual circulation vertical ve- analyses within the observational uncertainty range. locity w ∗ . Above about 1000 K potential temperature (about Atmos. Chem. Phys., 21, 8393–8412, 2021 https://doi.org/10.5194/acp-21-8393-2021
You can also read