Unexpected long-range transport of glyoxal and formaldehyde observed from the Copernicus Sentinel-5 Precursor satellite during the 2018 Canadian ...
←
→
Page content transcription
If your browser does not render page correctly, please read the page content below
Atmos. Chem. Phys., 20, 2057–2072, 2020
https://doi.org/10.5194/acp-20-2057-2020
© Author(s) 2020. This work is distributed under
the Creative Commons Attribution 4.0 License.

Unexpected long-range transport of glyoxal and formaldehyde
observed from the Copernicus Sentinel-5 Precursor satellite during
the 2018 Canadian wildfires
Leonardo M. A. Alvarado1 , Andreas Richter1 , Mihalis Vrekoussis1,2,4 , Andreas Hilboll1 ,
Anna B. Kalisz Hedegaard3,1 , Oliver Schneising1 , and John P. Burrows1
1 Institute of Environmental Physics (IUP), University of Bremen, Bremen, Germany
2 Center  of Marine Environmental Sciences (MARUM), University of Bremen, Bremen, Germany
3 Institute of Atmospheric Physics, German Aerospace Center (DLR), Oberpfaffenhofen-Wessling, Germany
4 Energy, Environment and Water Research Center, The Cyprus Institute, Nicosia, Cyprus

Correspondence: Leonardo M. A. Alvarado (lalvarado@iup.physik.uni-bremen.de)

Received: 29 July 2019 – Discussion started: 29 August 2019
Revised: 14 December 2019 – Accepted: 21 January 2020 – Published: 25 February 2020

Abstract. Glyoxal (CHOCHO) and formaldehyde (HCHO)               cates that effective lifetimes of 20 h and more are needed to
are intermediate products in the tropospheric oxidation of       explain the observations of CHOCHO and HCHO if they de-
the majority of volatile organic compounds (VOCs). CHO-          cay in an effective first-order process. FLEXPART used in
CHO is also a precursor of secondary organic aerosol (SOA)       the study calculates accurately the transport. In addition an
in the atmosphere. CHOCHO and HCHO are released from             exponential decay, in our case assumed to be photochemi-
biogenic, anthropogenic, and pyrogenic sources. CHOCHO           cal, of a species along the trajectory is added. We have used
and HCHO tropospheric lifetimes are typically considered         this simple approach to test our assumption that CHOCHO
to be short during the daytime at mid-latitudes (e.g. several    and HCHO are created in the fires and then decay at a con-
hours), as they are rapidly removed from the atmosphere by       stant rate in the plume as it is transported. This is clearly not
their photolysis, oxidation by OH, and uptake on particles or    the case and we infer that CHOCHO and HCHO are either
deposition. At night and at high latitudes, tropospheric life-   efficiently recycled during transport or continuously formed
times increase to many hours or even days. Previous stud-        from the oxidation of longer-lived precursors present in the
ies demonstrated that CHOCHO and HCHO vertical column            plume, or possibly a mixture of both. We consider the best
densities (VCDs) are well retrieved from space-borne ob-         explanation of the observed CHOCHO and HCHO VCD in
servations using differential optical absorption spectroscopy    the plumes of the fire is that they are produced by oxidation
(DOAS). In this study, we present CHOCHO and HCHO                of longer-lived precursors, which were also released by the
VCDs retrieved from measurements by TROPOMI (TROPO-              fire and present in the plume.
spheric Monitoring Instrument), launched on the Sentinel-
5 Precursor (S5P) platform in October 2017. We observe
strongly elevated amounts of CHOCHO and HCHO during
the 2018 fire season in British Columbia, Canada, where a        1   Introduction
large number of fires occurred in August. CHOCHO and
HCHO plumes from individual fire hot spots are observed          Formaldehyde (HCHO) is produced by the oxidation of
in air masses travelling over distances of up to 1500 km,        both methane (CH4 ) and other volatile organic com-
i.e. much longer than expected for the relatively short tropo-   pounds (VOCs). Glyoxal (CHOCHO) is the smallest alpha-
spheric lifetime expected for CHOCHO and HCHO. Com-              dicarbonyl formed by the oxidation of many VOCs contain-
parison with simulations by the particle dispersion model        ing two or more carbon atoms. Although both CHOCHO and
FLEXPART (FLEXible PARTicle dispersion model) indi-              HCHO, which are known as OVOCs (oxygenated volatile

Published by Copernicus Publications on behalf of the European Geosciences Union.
2058                              L. M. A. Alvarado et al.: Unexpected long-range transport of glyoxal and formaldehyde

organic compounds) have similar rates of reaction with the        Columbia (BC) in Canada was one of the most affected areas.
hydroxyl radical (OH) in the troposphere, the photolysis fre-     The 2018 season is the worst on record, with 6826 fires be-
quency of HCHO, which absorbs and is photolysed in the            ing detected and an area of approximately 22 500 km2 of land
ultraviolet-A (UV-A), is significantly smaller than that of       burned (Natural Resources Canada, 2018). These fires emit-
CHOCHO, which absorbs in the blue. As a result, the at-           ted many different pollutants into the atmosphere, e.g. CO,
mospheric lifetime of HCHO is longer than that of CHO-            NOx , VOC, OVOC, O3 , SO2 , CO2 , HONO, CH3 COO2 NO2
CHO (Atkinson, 2000). Both species are short-lived during         (PAN), and other toxic species, as well as aerosols (Urbanski
daytime due to their rapid removal by photolysis and re-          et al., 2018). During the transport of plumes from fires, pho-
action with OH radicals (Atkinson, 2000; Volkamer et al.,         tochemical transformation of emitted species occurs. Over-
2007). These processes are the major sinks of CHOCHO and          all, polluted air is transported to regions where the plumes
HCHO, contributing about 69 % and 96 %, respectively. The         are dispersed. CHOCHO and HCHO column amounts are
remaining part of HCHO is removed by deposition (4 %),            observed by remote sensing from satellite using differential
while for CHOCHO 22 % is removed by secondary organic             optical absorption spectroscopy (DOAS) on measurements
aerosol (SOA) formation and 8 % by deposition (Stavrakou et       of the radiances backscattered from the Earth’s surface and
al., 2009a, b). Additionally, HCHO and probably also CHO-         atmosphere. The global maps of CHOCHO and HCHO re-
CHO during the night are removed by reaction with nitrate         trieved from SCIAMACHY, GOME-2, and OMI show en-
(NO3 ) radicals (Atkinson, 2000). CHOCHO and HCHO play            hanced CHOCHO and HCHO over tropical rain forests but
a key role in tropospheric chemistry because they act as tem-     also over other regions with high isoprene emissions. In addi-
porary reservoirs releasing carbon monoxide (CO) and HOx          tion, hot spots of CHOCHO and HCHO from fire emissions
(OH and hydroperoxyl, HO2 ) free radicals, which partici-         can be detected over large wildfires (Wittrock et al., 2006;
pate in catalytic cycles creating and destroying tropospheric     Vrekoussis et al., 2009, 2010; Lerot et al., 2010; Chan Miller
ozone (O3 ).                                                      et al., 2014; Alvarado et al., 2014; De Smedt et al., 2008,
   The slant and vertical column densities of HCHO were           2012, 2015, 2018).
first observed from space using measurements from the                In this study, we present novel observations of CHOCHO
GOME instrument (e.g. Burrows et al., 1999, and references        and HCHO retrieved from the high spatial resolution obser-
therein). These columns were later used to estimate the emis-     vations by TROPOMI (TROPOspheric Monitoring Instru-
sion strength of precursor VOCs (Palmer et al., 2003; Ab-         ment) on board the Sentinel-5 Precursor (S5P) platform. On
bot et al., 2003). The simultaneous observation of CHOCHO         7 August 2018, strongly elevated amounts of CHOCHO and
and HCHO (Wittrock et al., 2006) enabled an improved as-          HCHO were observed over British Columbia and attributed
sessment of atmospheric VOC levels, and the knowledge of          to being predominantly from fires. Surprisingly, these ele-
the ratio of CHOCHO to HCHO (RGF ) (Vrekoussis et al.,            vated levels of CHOCHO and HCHO were not limited to
2010) provides some differentiation of source types. Stud-        the vicinity of the fires. The fire plumes, which contain both
ies have used HCHO, partly in combination with CHOCHO             CHOCHO and HCHO, remained visible for several days
to estimate the biogenic isoprene emissions (Fu et al., 2007;     and appeared to travel long distances from the sources. We
Stavrakou et al., 2009a, b, c; Liu et al., 2012; Marais et al.,   have used forward simulations of atmospheric transport of
2012). This is the largest natural source of CHOCHO (Guen-        air masses calculated using FLEXPART (FLEXible PARTi-
ther et al., 2006; Fu et al., 2007). The amount of biogenically   cle dispersion model) (Pisso et al., 2019). The simulations
emitted VOCs depends on several factors including, amongst        include an effective first-order loss, which determines the
others, the plant species and weather conditions (e.g. tem-       mean effective lifetime of the tracer. Those tracers emit-
perature and humidity) (Guenther et al., 2000). In urban and      ted over the fire hot spots with long effective lifetimes re-
rural regions, there are also contributions to the amounts of     produce best the evolution of the plumes of CHOCHO and
CHOCHO from human activities, such as from fossil fuel            HCHO for most of the fire events, and thus provide esti-
production, distribution, and combustion: the largest anthro-     mates of the effective lifetimes of CHOCHO and HCHO in
pogenic source of VOC precursors of CHOCHO being mo-              the plumes, as is described in the sections below. The RGF
tor vehicle emissions due to either evaporation or incomplete     provides knowledge about their sources in the plume. CO and
combustion of fuel (Kansal, 2009). Globally, 55 % of CHO-         nitrogen dioxide (NO2 ) have respectively longer and shorter
CHO is produced by biogenic precursors, 27 % is from an-          lifetimes with respect to reaction with OH, and smoke and
thropogenic emissions, and the remaining 18 % is from pyro-       aerosol are also transported in the plumes from fires. Con-
genic emissions (Stavrakou et al., 2009b). Fires and vehicle      sequently, the retrieved vertical column densities of CO and
exhausts are thought to be the only two sources which di-         NO2 from TROPOMI and true-colour images from the VI-
rectly emit CHOCHO (Stavrakou et al., 2009b; Zhang et al.,        IRS (Visible Infrared Imaging Radiometer Suite) instrument
2016).                                                            on board NPP (Suomi National Polar-orbiting Partnership),
   In August 2018, unusually high temperatures caused se-         which measures nearly simultaneously with TROPOMI, are
vere drought in some areas of North America and resulted          used as complementary information in our interpretation of
in the outbreak of many wildfires: the province of British

Atmos. Chem. Phys., 20, 2057–2072, 2020                                            www.atmos-chem-phys.net/20/2057/2020/
L. M. A. Alvarado et al.: Unexpected long-range transport of glyoxal and formaldehyde                                       2059

the apparent enhanced lifetime of CHOCHO and HCHO in             2.3   CHOCHO retrieval from TROPOMI
the plume.                                                             measurements

                                                                 In recent years, several improvements in the retrieval of
2     Methods                                                    CHOCHO have been reported. In 2014, Chan Miller et
                                                                 al. (2014) and Alvarado et al. (2014) presented new CHO-
2.1    CHOCHO and HCHO observations
                                                                 CHO retrieval algorithms applied to OMI measurements.
The differential optical absorption spectroscopy (DOAS)          These studies, similar to previous studies on GOME2-A data,
method has been successfully applied to retrieve atmospheric     introduced approaches to reduce interference by other ab-
columns of trace gases having fingerprint narrow absorption      sorbers, such as liquid water and NO2 . In this study, an
bands in the solar spectral range from space-borne instru-       optimized retrieval algorithm for CHOCHO was developed,
ments (e.g. Burrows et al., 1999). As noted above, there are     building on the heritage from the OMI CHOCHO retrieval
several studies describing retrievals of OVOCs and their use     presented by Alvarado et al. (2014) and extended and ap-
for the identification of VOC sources and their emissions        plied to S5P measurements. Previous studies have shown
(Burrows et al., 1999; Palmer et al., 2001; Wittrock et al.,     that cross-correlations between reference cross sections, as
2006; Kurosu et al., 2007; Vrekoussis et al., 2009, 2010;        well as instrumental structures and shifts in the wavelength
Lerot et al., 2010; De Smedt et al., 2008, 2012, 2015, 2018;     calibration, can introduce systematic errors in the retrieval.
Hewson et al., 2013; González Abad et al., 2015; Chan Miller     As a result, a strong dependence on the fitting window was
et al., 2014; Alvarado et al., 2014, 2015). Algorithms for the   identified in the retrieved CHOCHO slant column densities
retrieval of HCHO and CHOCHO have been developed for             (SCDs) (Chan Miller et al., 2014; Alvarado et al., 2014). In
measurements from the SCanning Imaging Absorption spec-          this study, a fitting window from 433 to 465 nm was chosen,
troMeter for Atmospheric CHartographY (SCIAMACHY)                which is slightly larger than windows used in previous in-
(Burrows et al., 1995; Bovensmann et al., 1999), the Ozone       vestigations (Vrekoussis et al., 2010; Alvarado et al., 2014).
Monitoring Instrument (OMI) (Levelt et al., 2006), and the       This fitting window, which enables the liquid water absorp-
second Global Ozone Monitoring Experiment on MetOp-A             tion to be retrieved, leads to a reduction in the number of
and -B (GOME2-A and -B) (Munro et al., 2016), which in           negative CHOCHO SCDs over oceanic regions in compar-
combination provide a continuous dataset covering a period       ison to a shorter fitting window (e.g. 434–458 nm), as well
of more than 20 years. In this study, measurements from          as a reduction in the residuals. The wavelength range se-
TROPOMI on board the Sentinel-5 Precursor (Veefkind et           lected covers the strong absorption bands of CHOCHO (452–
al., 2012) are used to retrieve atmospheric column amounts       457 nm), which have already been used in the past to retrieve
of CHOCHO and HCHO. A brief instrument description and           CHOCHO from ground- and ship-based DOAS configura-
relevant details of the retrieval of CHOCHO and HCHO are         tions as well as from satellites (Sinreich et al., 2007, 2010;
given below.                                                     Wittrock et al., 2006; Vrekoussis et al., 2009, 2010; Lerot
                                                                 et al., 2010; Chan Miller et al., 2014; Alvarado et al., 2014;
2.2    TROPOMI                                                   Behrens et al., 2019). In order to optimize the quality of the
                                                                 retrievals, a row-dependent daily mean Pacific spectrum from
The TROPOspheric Monitoring Instrument (TROPOMI) on              the region 50◦ S, 160◦ E to 50◦ N, 135◦ W is used as a back-
board the Copernicus Sentinal-5 Precursor satellite was          ground spectrum (Alvarado, 2016), which is computed by
launched on 13 October 2017. It has a spectral range in          averaging over the whole latitude range (50◦ S to 50◦ N) for
the UV–Vis–NIR–SWIR, covering wavelengths from 270               each across-track viewing direction independently. In addi-
to 500 nm in the UV–Vis (ultraviolet to visible), from 675       tion, the mean CHOCHO SCD over the region 30◦ S, 150◦ W
to 775 nm in the NIR (near-infrared), and a band from            to 30◦ N, 150◦ E is computed each day and subtracted from
2305 to 2385 nm in the SWIR (shortwave infrared). These          all SCDs to correct for possible offsets. A summary of the
bands allow for the observation of several relevant atmo-        selected absorption cross sections, and other parameters used
spheric species, including CHOCHO, HCHO, NO2 , and CO.           in the retrieval as well as a list of the species included in the
TROPOMI provides nearly global coverage each day at a            retrieval, is shown in Table 1.
spatial resolution which in August 2018 was 3.5 km × 7 km           SCDs depend on observation geometry. Vertical column
(7 km × 7 km in the SWIR). The Equator crossing time is          densities (VCDs) are derived from the SCDs by use of so-
13:30 LT (ascending node). Similar to OMI, TROPOMI is            called air mass factors (AMFs), which depend on the trace-
a nadir-viewing imaging spectrograph, employing a two-           gas profile, surface albedo, aerosols, clouds, and on solar
dimensional CCD (charge-coupled device): one dimension           zenith angle and measurement geometry. As the focus of
collecting the spectral information and the other being used     this study is the observation of CHOCHO in biomass burn-
for the spatial information. TROPOMI on board the S5P            ing emissions, a simple CHOCHO profile with a Gaussian
satellite provides data since November 2017 (Veefkind et al.,    distribution having its maximum peak at the altitude of the
2012).                                                           aerosol layer is used (see Fig. 1a). This is based on the as-

www.atmos-chem-phys.net/20/2057/2020/                                             Atmos. Chem. Phys., 20, 2057–2072, 2020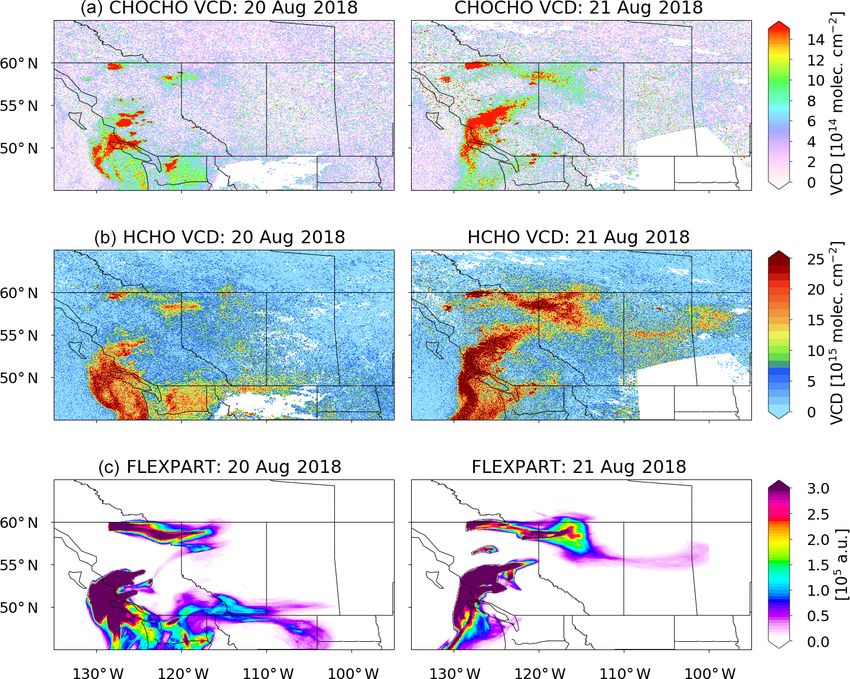
2060                                 L. M. A. Alvarado et al.: Unexpected long-range transport of glyoxal and formaldehyde

Table 1. Summary of retrieval parameters of CHOCHO and HCHO from S5P with the respective absorption cross sections used.

       Parameters                                         Formaldehyde (HCHO)          Glyoxal (CHOCHO)
       Fitting window                                     323.5–361 nm                 433–465 nm
       Polynomial                                         5 coefficients               5 coefficients
       Cross sections used
       HCHO (Meller and Mootgat, 2000)                    Yes (298 K)                  No
       CHOCHO (Volkamer et al., 2005b)                    No                           Yes (296 K)
       NO2 (Vandaele et al., 1998)                        Yes (220 K)                  Yes (220, 2294 K)
       O4 (Thalman and Volkamer, 2013)                    Yes (293 K)                  Yes (293 K)
       O3 (Serdyuchenko et al., 2014)                     Yes (223, 243 K)             Yes (223 K)
       BrO (Fleischmann et al., 2004)                     Yes (223 K)                  No
       H2 O (Rothman et al., 2013)                        No                           Yes (296 K)
       Liquid water (Mason et al., 2016)                  No                           Yes (280 K)
       Ring effect                                        Ring cross section calculated by SCIATRAN model (Vountas et al., 1998)
       Non-linear          ozone absorption effects,      Yes                          No
       two pseudo absorption cross sections
       (O3 · λ + (O3 )2 ) from Taylor expansion
       (Puk, ı̄te et al., 2010)
       Iterative spike removal (Richter et al., 2011)     Applied
       Intensity offset correction                        Linear offset (I/I0)
       Background spectrum                                Pacific region (50◦ N, 135◦ W to 50◦ S, 160◦ )

Figure 1. (a) CHOCHO and HCHO profiles assumed in the computation of AMFs (air mass factors). (b) CALIPSO profile of aerosol
extinction coefficients (kext ), averaged over for all latitudes and longitudes of panel (c), excluding cloudy scenes. (c) Top panel: example
of CALIPSO aerosol profile extinction coefficients retrieved at a wavelength of 532 nm. Aerosol and cloud optical depths (AOD and COD,
respectively) are shown as a function of latitude and longitude for every single profile. Bottom panel: colour-coded kext for every latitude
and longitude in the selected region. Purple spots represent cloudy scenes. The black line depicts the aerosol layer height.

sumption that CHOCHO is found at the same location as the                  The computations have been performed on a daily basis, as-
main plume of aerosol and other trace gases. The altitude                  suming a single scattering albedo of 0.92 and a homogenous
of the aerosol layer was estimated from profiles retrieved                 distribution of aerosols characterized by the mean profile in
by the Cloud-Aerosol Lidar and Infrared Pathfinder Satel-                  the whole region of study. The latter is computed from the
lite Observation (CALIPSO) (Vaughan et al., 2004) (Fig. 1b).               average of all aerosol profiles taken over the region after re-
These aerosol extinction coefficient (kext ) profiles retrieved at         moving cloud-contaminated pixels (see Fig. 1c). Clouds are
532 nm are also used in the calculation of the AMFs by the                 not explicitly accounted for in the CHOCHO and HCHO re-
radiative transfer model SCIATRAN (Rozanov et al., 2013).                  trievals, but data are filtered for the presence of clouds using

Atmos. Chem. Phys., 20, 2057–2072, 2020                                                      www.atmos-chem-phys.net/20/2057/2020/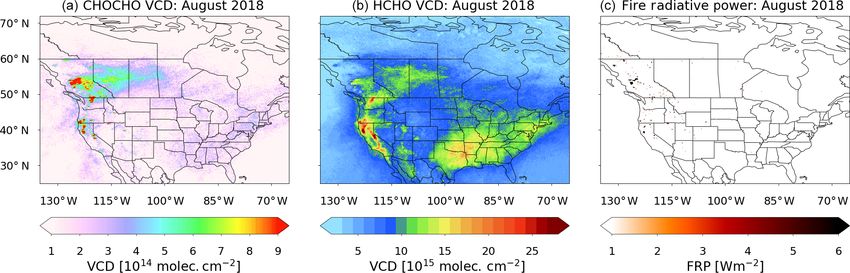
L. M. A. Alvarado et al.: Unexpected long-range transport of glyoxal and formaldehyde                                              2061

an intensity criterion corresponding to a cloud radiance frac-
tion of about 50 %.

2.4   HCHO retrieval from TROPOMI measurements

The accuracy of DOAS retrievals of HCHO is limited by
cross-correlations with strong absorbers in the UV (e.g. O3 )
and the signal-to-noise ratio of the radiance spectra mea-
sured by the instrument. Here, an updated and optimized ver-
sion of the formaldehyde retrieval developed by Wittrock et
al. (2006) and Vrekoussis et al. (2010) is used, which ap-
plies a slightly larger fitting window extending from 323.5
to 361 nm, resulting in a reduction in the noise of the re-
trieved slant column densities. At wavelengths shorter than
336 nm, interference with O3 is observed due to the small
optical depth of HCHO, which is about 3 orders of mag-
nitude smaller. This effect is compensated by applying the
method described by Puk, ı̄te et al. (2010), which consists of      Figure 2. (a) Example fit for CHOCHO from a single measurement
adding two additional pseudo cross sections to the fit (λσO3        of S5P taken at latitude 53.0◦ and longitude 125.6◦ W on 10 Au-
and σO2 3 ) (Puk, ı̄te et al., 2010; De Smedt et al., 2008, 2015,   gust 2018 and for a solar zenith angle of 39.3◦ . (b) Example fit for
2018). The cross sections of interfering species are included       HCHO from a single measurement of S5P taken at latitude 59.1◦
in the fit as listed in Table 1. In a manner similar to the         and longitude 109.0◦ W on 10 August 2018 and for a solar zenith
retrieval of CHOCHO, a synthetic ring spectrum (Vountas             angle of 44.6◦ . The black line depicts the scaled differential cross
et al., 1998) is used to account for the ring effect and a          section and the red line the fit. The SCD values for this example are
row-dependent daily mean Pacific spectrum from the region           9.3 × 10¹⁵ molec. cm−2 for CHOCHO and 4.6 × 10¹⁶ molec. cm−2
50◦ S, 135◦ W to 50◦ N, 16◦ E is used as background spec-           for HCHO, respectively. The detection limit for a single measure-
                                                                    ment from S5P is estimated to be 5.0 × 10¹⁴ molec. cm−2 and
trum. A latitude-dependent offset correction based on SCDs
                                                                    4.5 × 10¹⁵ molec. cm−2 for CHOCHO and HCHO, respectively.
from longitudes between 180◦ E and 160◦ E is applied to the
data. As for CHOCHO, VCDs are computed using AMFs,
assuming a Gaussian shape for the distribution of HCHO at
the layer where the aerosols are located in the plume. Fig-         plumes. However, performing simulations for tracers hav-
ure 2a and b show examples of CHOCHO and HCHO fit re-               ing different mean lifetimes yields a valuable piece of in-
sults for 10 August 2018 compared to the differential ref-          formation in order to understand the observed plume evolu-
erence cross section for a single measurement. For an in-           tion. An effective mean lifetime can be estimated by com-
dividual CHOCHO measurement, the detection limit is of              paring the observed behaviour of the CHOCHO and HCHO
the order of 5 × 10¹⁴ molec. cm−2 , which is about 10 times         with FLEXPART simulations of different assumed tracer
smaller than the columns detected from emissions of the             lifetimes.
wildfires over the British Columbia region of Canada. For              In FLEXPART, the effective mean lifetime τ of an emitted
HCHO, the detection limit is an order of magnitude higher           tracer is treated as exponential decay with a given half-life
(4.5×10¹⁵ molec. cm−2 ). The detection limit of a single S5P        (t0.5 ); τ can then be calculated according to τ = t0.5 / ln(2).
measurement in this study has been estimated in a manner            As part of this study, FLEXPART simulations were carried
similar to that explained in Alvarado et al. (2014).                out with half-life times of 2, 4, 6, 8, 10, 12, 14, 16, 18, and
                                                                    20 h, corresponding to effective mean lifetimes of ∼ 2.9, 5.8,
2.5   Simulation of tracer transport with FLEXPART                  8.7, 11.5, 14.4, 17.3, 20.2, 23.1, 26.0, and 28.9 h, respec-
                                                                    tively. As emission rates from wildfires are highly uncertain,
In order to simulate the transport of emissions from the            the emission fluxes from the Canadian wildfires are assumed
Canadian wildfires, forward simulations with version 10.3           to be proportional to fire radiative power (FRP; see below
of the FLEXible PARTicle dispersion model (FLEXPART)                for more details). The emissions, prescribed in the model,
(Stohl et al., 2005; Pisso et al., 2019) have been performed.       are taken from the Global Fire Assimilation System (GFAS)
The model was driven by using hourly wind fields from               daily FRP and plume height data (Rémy et al., 2017). Sim-
the ECMWF (European Centre for Medium-Range Weather                 ulations were performed on a daily basis for the period 6 to
Forecasts) ERA5 reanalysis (C3S) at 0.25◦ horizontal res-           23 August 2018. For each day, all fires from the GFAS data,
olution. As a transport model, FLEXPART does not simu-              which had an FRP of more than 3 W cm−2 , were gridded to a
late the complete set of chemical transformations leading to        0.350◦ horizontal pattern. The model was then run forward in
the observed lifetimes of trace gases in the biomass burning        time for 120 h, releasing the tracer for the first 24 h (the full

www.atmos-chem-phys.net/20/2057/2020/                                                 Atmos. Chem. Phys., 20, 2057–2072, 2020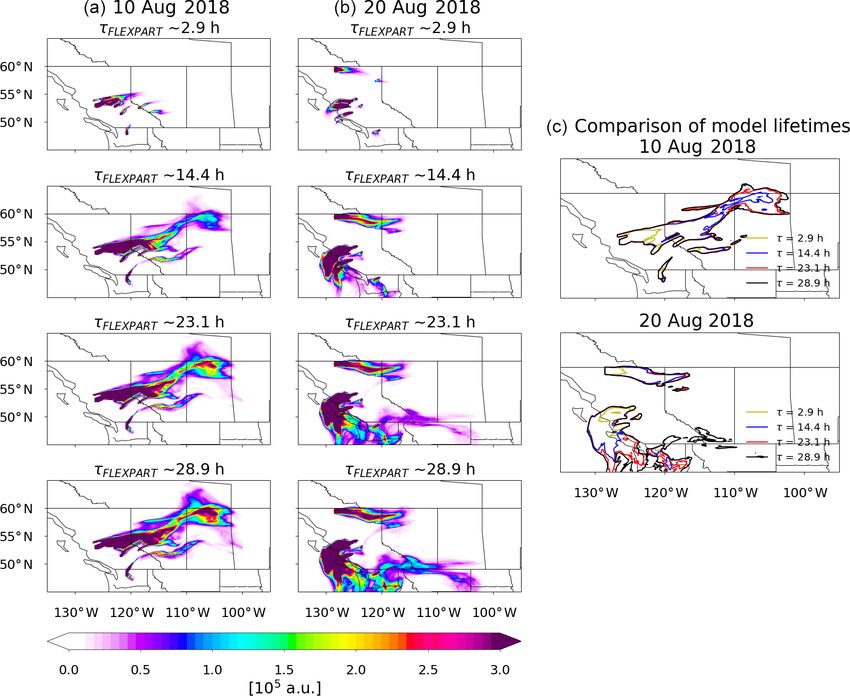
2062                               L. M. A. Alvarado et al.: Unexpected long-range transport of glyoxal and formaldehyde

Figure 3. Monthly average of CHOCHO (a) and HCHO (b) VCDs retrieved from TROPOMI on S5P for August 2018 and over North
America (a, b). Panel (c) shows the integrated FRP (fire radiative power) from MODIS for the same period.

UTC day) from each of the 0.350◦ grid cells, assuming no            gion but extend over large parts of Canada, where only a
temporal variation throughout the day. Vertically, the emis-        few fires were observed. In order to investigate the sources
sions within the grid cells were evenly distributed over the        of CHOCHO and HCHO and their distributions, 24 h assim-
range of mean altitude of maximum injection heights given           ilation data of fire radiative power from the Global Fire As-
by the GFAS data for the respective grid cell. The output           similation System (Kaiser et al., 2012) are analysed. Briefly,
of the simulation contains gridded mass concentrations for          FRP is a measure of outgoing radiant heat from fires, mea-
each time step. Here, a grid with a horizontal resolution of        sured in units of watt per square centimetre (W cm−2 ) and
0.03125◦ was chosen to match the resolution of the grid-            retrieved from space by the MODerate resolution Imaging
ded satellite observations. Hourly output from the simulation       Spectroradiometer (MODIS) on board of the Terra and Aqua
was recorded and then vertically integrated to yield simulated      satellites (Justice et al., 2002). The assimilated FRP spa-
tracer columns. In a post-processing step, for one specific         tially aggregates all valid fire and non-fire observations from
mean lifetime, all simulation results (i.e. simulations for all     both MODIS instruments onto a horizontal resolution of
fires on all days) were aggregated into one dataset. While the      0.1◦ × 0.1◦ and computes the total FRP sums for each grid
absolute tracer column density from the model output can-           bin (Justice et al., 2002). The FRP is also used as input in the
not be simply compared to the measurements, a comparison            FLEXPART simulation as described in Sect. 2.5 as a proxy
of the plume patterns and relative distribution between satel-      for emission strength. Figure 3c shows a monthly-average
lite observation and model output gives an indication about         FRP map over North America for August 2018.
the meaningfulness of the prescribed mean lifetime. At this            The highest CHOCHO VCD values are found over the lo-
point, the aggregated model output for one effective mean           cations of the most intense fires, as intuitively expected. The
lifetime consists of hourly latitude–longitude grids of ver-        HCHO distribution over the fire regions is similar to that of
tical tracer columns throughout the whole study period. For         CHOCHO but with some differences in the relative distribu-
comparison to the satellite observations, the hourly time slice     tion. In addition, enhanced CHOCHO and HCHO columns
closest to the time of overpass at 53◦ N was chosen.                are also apparent over the south-eastern US, where large iso-
                                                                    prene emissions occur. CHOCHO and HCHO are also de-
                                                                    tected in plumes crossing central and eastern Canada, where
3   Results and discussion                                          no fires are identified in the FRP map. This pattern is best
                                                                    explained by the transport of CHOCHO and HCHO emanat-
During August 2018, a high-temperature anomaly led to the           ing from the wildfires. However, CHOCHO and HCHO have
outbreak of many fires in the Canadian western province of          been reported to have short atmospheric lifetimes of about
British Columbia, resulting in the emission of large quanti-        ∼ 2.2 and ∼ 4.0 h during daytime, respectively (Atkinson,
ties of particles and trace gases that in turn affected air qual-   2000; Volkamer et al., 2005a). Assuming that the lifetime in
ity in the region. As shown in Fig. 3a and b, the monthly           the plume is similar to that observed at the ground, we expect
average of CHOCHO and HCHO vertical columns from S5P                that CHOCHO would be removed reasonably close to the fire
show strongly enhanced values over the fire region, suggest-        sources. HCHO would be transported further, but we also ex-
ing that these fires were a large, direct, and/or indirect source   pect that it would be transported no more than approximately
of CHOCHO and HCHO. Surprisingly, the CHOCHO and                    twice as far as CHOCHO.
HCHO enhancements are not limited to the main fire re-

Atmos. Chem. Phys., 20, 2057–2072, 2020                                              www.atmos-chem-phys.net/20/2057/2020/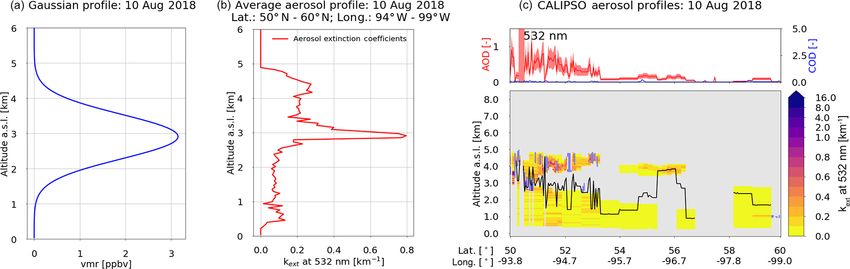
L. M. A. Alvarado et al.: Unexpected long-range transport of glyoxal and formaldehyde 2063
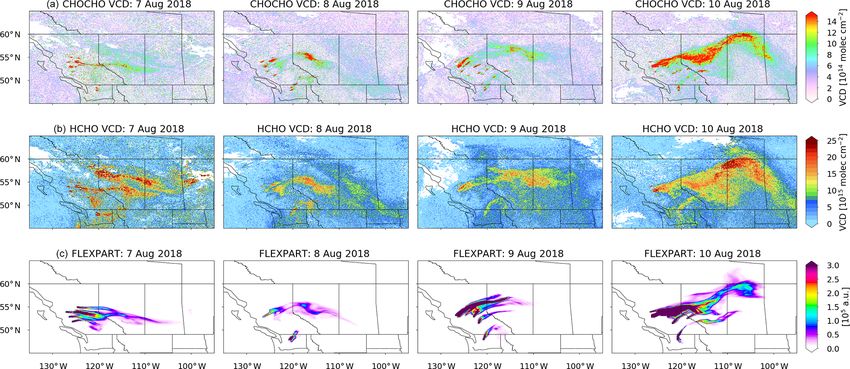
Figure 4. (a, b) Daily CHOCHO and HCHO VCDs retrieved from S5P measurements for the period 7 to 10 August 2018. (c) Distribution
of a tracer with a lifetime of 14.4 h simulated with FLEXPART for the same period. The CHOCHO in the plume decreases on average from
3 × 10¹⁵ to 3 × 10¹⁴ molec. cm−2 , while the HCHO has a different variation in the plume, but at the end of the plume it decreases from
3 × 10¹⁶ to 1 × 10¹⁶ molec. cm−2 . The FLEXPART tracer column decreases from 3 × 10⁶ to 0.3 × 10⁶ for this specific effective lifetime of
14.4 h.
Earlier studies by Wittrock et al. (2006) and Vrekoussis et calculated for the period when CHOCHO and HCHO plumes
al. (2009, 2010) showed that CHOCHO is also observed over are observed (see Fig. 4b), assuming an effective lifetime
oceanic regions, where no CHOCHO source is expected. The of 14.4 h. The latter is significantly longer than lifetimes
potential of (a) a long-range transport of CHOCHO and/or of CHOCHO and HCHO found in the literature. On the
of CHOCHO precursors from continental areas and (b) hav- other hand, the simulated pattern of air masses follows the
ing an unknown oceanic CHOCHO source were discussed as same distinctive path as CHOCHO and HCHO VCDs. The
a possible explanation in part of these observations, but no tracer simulated with FLEXPART spreads over the same
firm conclusions could be drawn so far. In the present study, area as CHOCHO, providing evidence for the transport of
with the support of the simulations using FLEXPART, evi- CHOCHO and HCHO and their precursors over continental
dence of long-range transport of CHOCHO and HCHO or its Canada. This is more evident for the second period of inter-
precursors from biomass burning emissions is investigated. est in this study, which extends from 20 to 21 August 2018
In this context, the transport of CHOCHO and HCHO dur- (see Fig. 7). While the spatial match of plume and model is
ing two fire plume episodes form different periods (7–10 and good in this example, it is clear from the figure that an ef-
20–21 August 2018) are discussed below. fective lifetime of 14.4 h does not describe fully the extent of
CHOCHO and HCHO transported. Using shorter effective
3.1 CHOCHO and HCHO emissions from the British lifetimes for CHOCHO and HCHO, taken form the litera-
Columbia wildfires: 7–10 and 20–21 August 2018 ture, would not reproduce the observations. However, both
lifetimes depend on conditions in the plume: on the diurnal
Figure 4a shows daily maps of CHOCHO and HCHO VCDs photolysis and OH diurnal cycles as well as on wet/dry de-
over Canada for the period 7 to 10 August 2018. The most position processes and other oxidants. Consequently, com-
intense wildfires are found on 7 August 2018 and remain de- parisons of FLEXPART simulations with different effective
tectable until 10 August 2018. Both CHOCHO and HCHO lifetimes were performed for 2 selected days, as is shown in
plumes are detected on the first day of the fire. The CHO- Sect. 3.2.
CHO and HCHO distributions then change from day to day.
However, a large plume is clearly visible on 10 August 2018. 3.2 Effective lifetimes of CHOCHO and HCHO in the
Enhanced CHOCHO and HCHO columns are found at a dis- plume
tance of up to ∼ 1500 km from the fires, indicating transport
over long distances. Figure 5 shows the results of FLEXPART simulations as-
To investigate possible transport pathways, forward sim- suming effective lifetimes for a surrogate chemical species
ulations of the atmospheric transport with FLEXPART were of ∼ 2.9, 14.4, 23.1, and 28.9 h for 10 and 20 August 2018.
www.atmos-chem-phys.net/20/2057/2020/ Atmos. Chem. Phys., 20, 2057–2072, 2020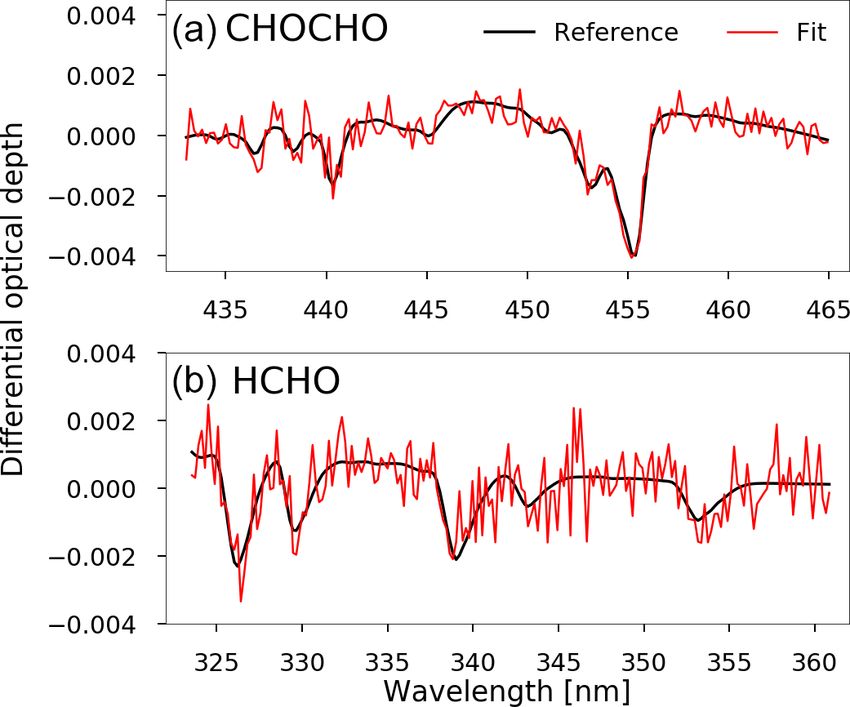
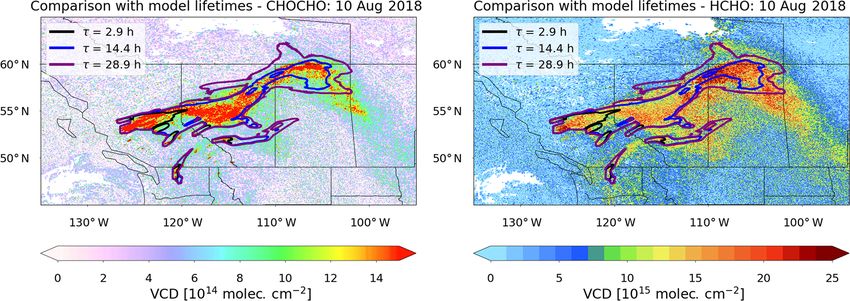
2064                               L. M. A. Alvarado et al.: Unexpected long-range transport of glyoxal and formaldehyde

Figure 5. Daily maps of air masses simulated with FLEXPART for 10 and 20 August 2018 are shown (a, b) for selected effective lifetimes
(∼ 2.9, 14.4, 23.1, and 28.9 h). (c) Contour plots of simulations for the same lifetimes are compared for 10 and 20 August 2018.

From this figure, it is clear that only for the simulations hav-     over the ocean, where no sources are expected, and up to the
ing effective lifetimes of 23.1 h or more, a significant fraction    point at which the plume disperses after being transported
of the tracer emitted is present at the end of the plume as ob-      over a distance of about ∼ 600 km from the fires.
served in the measurements. This is also illustrated in Fig. 6,         The observed behaviour of the CHOCHO and HCHO
depicting CHOCHO and HCHO maps for 10 August 2018.                   plumes is in contrast to the short atmospheric lifetimes result-
On top of these maps, contour lines are shown for the simu-          ing from their rapid removal by photolysis and reaction with
lated air masses assuming effective lifetimes of ∼ 2.9, 14.4,        OH. In addition, CHOCHO oligomerizes and thus is a source
and 28.9 h. It is evident that in both cases the tracer distribu-    of SOA formation (Schweitzer et al., 1998; Jang et al., 2002;
tions simulated with longer effective lifetimes better describe      Liggio et al., 2005; Kroll et al., 2005; Loeffler et al., 2006;
the observed distribution of CHOCHO and HCHO.                        Volkamer et al., 2007; Fu et al., 2007; Myriokefalitakis et al.,
   Figure 7a, b, and c present a second comparison of daily          2008; Stavrakou et al., 2009a, c). The simplest explanation
maps of CHOCHO and HCHO VCDs with a FLEXPART                         of the observations of CHOCHO and HCHO is that, during
tracer having an effective lifetime of 28.9 h for 20 and 21 Au-      the fire events, both species are transported and/or produced
gust 2018. It is evident that, again, the tracer follows the         during transport over long distances, resulting in an effective
distribution of CHOCHO and HCHO observations, similar                lifetime of about 28.9 h. This would imply the transport of
to the first period studied (see Fig. 4). However, on 20 and         VOC precursors of CHOCHO and HCHO.
21 August 2018, the CHOCHO and HCHO plumes spread

Atmos. Chem. Phys., 20, 2057–2072, 2020                                                www.atmos-chem-phys.net/20/2057/2020/
L. M. A. Alvarado et al.: Unexpected long-range transport of glyoxal and formaldehyde                                    2065

Figure 6. Daily maps of CHOCHO and HCHO VCD retrieved from S5P for 10 August 2018 compared with FLEXPART tracer simulations
having three different lifetimes (∼ 2.9, 14.4 , and 28.9 h).

   One reason for the longer-range transport of the CHOCHO          of HCHO being a precursor of SOA formation, and, as
and HCHO plumes is the injection of the biomass burning             the shape of the plumes for both trace gases is similar, a
emissions into the free troposphere, where high wind speeds         similar mechanism is expected for both. Also, evidence
favour transport over long distances. This is a well-known          for the release of CHOCHO following the formation of
effect that has also been observed for NO2 in GOME-2 data           oligomers in the aerosol phase is limited (Kroll et al.,
(Zien et al., 2014). However, even at high wind speeds, the         2005, and references therein).
short lifetime of these species would result in much smaller,
dispersed plumes than the ones observed. There are three          – Reason 3 is that the plume could contain CHOCHO
possible explanations for this apparent contradiction:              and HCHO precursors, i.e. VOCs, which are slowly ox-
                                                                    idized, releasing CHOCHO and HCHO along the tra-
  – Reason 1 is that the lifetimes of CHOCHO and HCHO
                                                                    jectory. If true, this would result in an apparent increase
    could be significantly longer than expected in these
                                                                    in lifetime. In order to better assess the CHOCHO and
    biomass burning plumes if the OH mixing ratio and UV
                                                                    HCHO spatial distribution seen on 10 August 2018, two
    and visible radiation within the plume is much lower
                                                                    additional TROPOMI retrievals have been taken into ac-
    than outside the plume. There is, however, no indication
                                                                    count. These are column-averaged dry air mole frac-
    that this should be the case; on the contrary, OH levels in
                                                                    tions of CO, retrieved by the algorithm described in
    the biomass burning plume are expected to be enhanced
                                                                    Schneising et al. (2019), and the NO2 VCD retrieved
    (Folkins et al., 1997), leading to a reduction of the ex-
                                                                    using an algorithm similar to the one described for the
    pected CHOCHO and HCHO lifetimes. In this context,
                                                                    GOME-2 instrument (Richter et al., 2011) and using
    it is interesting to investigate the NO2 VCD observed.
                                                                    AMF calculated following the same approach as the
    The NO2 plumes coming from the biomass burning are
                                                                    one described before for CHOCHO and HCHO (see
    shown in Fig. 8d. During daytime, NO2 is removed in
                                                                    Sect. 2.3). The CO plume shows a similar spatial pattern
    the gas phase by reaction with OH. Provided sufficient
                                                                    to those of CHOCHO and HCHO (see Fig. 8e). As CO
    O3 is present, the photolysis of NO2 produces NO and
                                                                    is a relatively long-lived tracer of fire emissions, having
    O which react respectively with O3 to make NO2 and
                                                                    a lifetime with respect to OH of months, this supports
    oxygen molecules to make O3 . This is known as a “null
                                                                    the fire origin of the plume. As noted above, NO2 is re-
    cycle”. NO2 appears to decay relatively rapidly in the
                                                                    moved by OH faster than CHOCHO and HCHO. The
    plumes coming from the fires. Our assumption that oxi-
                                                                    NO2 VCD enhancements, in contrast to those of CHO-
    dation and photolysis of CHOCHO and HCHO are rel-
                                                                    CHO and HCHO, are limited to the proximity of the
    atively rapid is thus not contradicted by the NO2 decay
                                                                    fire hot spots (see Fig. 8d). This behaviour agrees with
    in the fire plumes.
                                                                    that assumed for a molecule with a short atmospheric
  – Reason 2 is that there could be an efficient recycling          lifetime. A true-colour image from the Visible Infrared
    process between the gas and aerosol phase, resulting            Imaging Radiometer Suite (VIIRS) clearly shows the
    in the observed extended effective lifetimes of CHO-            distribution of smoke and aerosols produced because
    CHO and HCHO. However, this reason is considered                of the emission from the fires being transported and
    unlikely, because there is not yet any strong evidence          transformed (Fig. 8f). The distribution of the aerosol

www.atmos-chem-phys.net/20/2057/2020/                                           Atmos. Chem. Phys., 20, 2057–2072, 2020
2066 L. M. A. Alvarado et al.: Unexpected long-range transport of glyoxal and formaldehyde
Figure 7. (a, b) Daily CHOCHO and HCHO VCDs retrieved from S5P measurements for the period from 20 to 21 August 2018. (c) Tracer
distribution simulated with FLEXPART for the same period assuming a lifetime of 28.9 h. Enhanced CHOCHO columns spread over the
ocean in a pattern similar to that simulated by the model tracer.
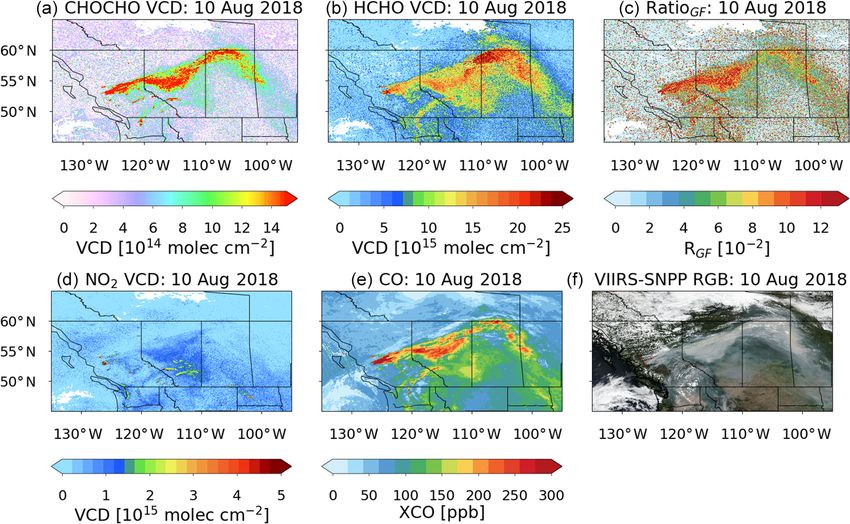
appears qualitatively to be similar to the CHOCHO, indication of enhanced primary emissions of CHOCHO rel-
HCHO, and CO distributions. We infer that the trans- ative to those of HCHO from fires. Lower RGF values are
ported plumes are mixtures of CO, CHOCHO, HCHO, found closer to the end of the plume, implying a decreas-
aerosol, and presumably other pollutants released by the ing production of CHOCHO relative to that of HCHO dur-
fire. It is interesting to note that CHOCHO and CO fol- ing the transport of polluted air in the plume. Another po-
low mainly the main plume, while the HCHO distri- tential explanation would be the mixing of air from differ-
bution is more diffuse and shows enhanced values also ent origins, having lower CHOCHO and/or higher HCHO
over regions where a thinner aerosol plume is visible in concentrations, during the plume transport. This is, however,
the VIIRS image. This distribution may possibly orig- not confirmed by the observed CO behaviour, which shows a
inate from other unidentified fires or another unknown similar spatial distribution to CHOCHO and HCHO.
source, which is not included in our FLEXPART simu- The comparison of retrieved S5P columns and FLEX-
lations. PART tracer simulations discussed is based on a number of
simplifications. The observational conditions of the biomass
As additional information, the ratio of CHOCHO to HCHO, burning plumes are complex, and aerosol scattering and ab-
RGF , is presented in Fig. 8c. Larger values of RGF are found sorption impact on the sensitivity of the retrievals. While this
close to the location of the wildfires as already reported in is taken into account by using air mass factors for elevated
previous publications (Vrekoussis et al., 2010). This is an plumes positioned at altitudes derived from CALIPSO ob-
Atmos. Chem. Phys., 20, 2057–2072, 2020 www.atmos-chem-phys.net/20/2057/2020/L. M. A. Alvarado et al.: Unexpected long-range transport of glyoxal and formaldehyde 2067
Figure 8. Panels (a), (b), (d), and (e) show the CHOCHO, HCHO, NO2 , and CO columns, respectively, retrieved from S5P measurements
for 10 August 2018. Note that CO columns are unfiltered and only represent a qualitative description of the plume. The AMFs used for
CHOCHO, HCHO, and NO2 are appropriate for the biomass burning plume only. Panel (c) depicts the calculated CHOCHO-to-HCHO ratio
(RGF ) for the same day. Panel (f) shows a true-colour image of the aerosol distribution from VIIRS for 10 August 2018.
servations, there remains considerable uncertainty with re- longer-lived precursors and/or efficient recycling processes
spect to absolute values. Aerosol loading and optical proper- in the plume as discussed above.
ties will vary along the plume and thus will the retrieval sen-
sitivities. This is not modelled explicitly in this study. How-
ever, the differences apparent between the spatial distribu- 4 Summary and conclusions
tions of CHOCHO and NO2 , which are retrieved in similar
spectral regions, provide evidence for the fact that measure- The retrieval of CHOCHO and HCHO VCDs from measure-
ment sensitivity does not explain the differences in the ob- ments of TROPOMI on board the Sentinel-5 Precursor satel-
served VCD plume patterns. Another crucial simplification lite is reported. This will extend the datasets already available
is the assumption of constant fire emissions and the propor- from the SCIAMACHY, GOME-2, and OMI instruments.
tionality of FRP and emission strength in the FLEXPART The advantage of the high spatial resolution and low noise
simulations. In reality, fire emissions will also depend on the of TROPOMI for studying specific geophysical phenomena
type of biomass burned, the age of the fire, the time of the is well demonstrated in the features and plumes seen in the
day, and the environmental conditions, and this will have an CHOCHO, HCHO, CO, and NO2 VCDs.
effect on the trace-gas distribution along the plume, which re- In this case study, the satellite data show clear evidence
flects both chemical transformation and the history of emis- for pyrogenic emissions of CHOCHO and HCHO during
sions. Modelling of this time evolution is complex, if possi- the wildfire season in summer 2018 in British Columbia,
ble at all, and out of the scope of this study. However, the Canada. The spatial and temporal pattern of the highest re-
observation that both CHOCHO and HCHO are present in trieved CHOCHO and HCHO VCDs are associated with
the biomass burning plume after extended time periods and areas having high fire radiative power, as identified in the
over long distances is robust and is best explained by the re- MODIS fire data products. This indicates that, in these areas,
lease of CHOCHO and HCHO from the transformation of pyrogenic emissions are the dominant source of CHOCHO
and HCHO. In addition to local enhancements of NO2 , CHO-
CHO, and HCHO, close to the fires, extended plumes of el-
www.atmos-chem-phys.net/20/2057/2020/ Atmos. Chem. Phys., 20, 2057–2072, 20202068 L. M. A. Alvarado et al.: Unexpected long-range transport of glyoxal and formaldehyde
evated CHOCHO and HCHO VCD are observed downwind available upon request (contact person is Leonardo M. A. Alvarado,
from the fires. This is in contrast to the behaviour of NO2 , lalvarado@iup.physik.uni-bremen.de).
which is also transported but is short lived. The spatial and
temporal CHOCHO and HCHO distribution observed from
satellite follows a similar pattern to that of CO, which is long Author contributions. LMAA, AR, and JPB prepared the article
lived, and that simulated by FLEXPART, initialized by tracer with the contribution of all authors, and they developed the glyoxal,
emissions starting at known fire locations. Enhanced CHO- formaldehyde, and NO2 retrievals for TROPOMI measurements.
MV, AH, and ABKH designed and performed the FLEXPART sim-
CHO and HCHO concentrations were found in the S5P data
ulations of the air masses assuming different effective lifetimes. OS
up to 1500 km from their sources.
developed the CO retrieval and provided the CO data for the com-
In order to obtain reasonable agreement between the parison with glyoxal and formaldehyde products.
model results and the measurements, an effective tracer life-
time of more than 20 h and up to 28.9 h needs to be assumed
in the FLEXPART simulations. This is significantly longer Competing interests. The authors declare that they have no conflict
than the anticipated lifetimes of CHOCHO and HCHO. The of interest.
transport of CHOCHO and HCHO along the length of the
plume could be associated with these trace gases being lifted
from the boundary layer into the free troposphere, where Special issue statement. This article is part of the special is-
high wind speeds lead to rapid transport. The long apparent sue “TROPOMI on Sentinel-5 Precursor: first year in operation
lifetime of CHOCHO and HCHO in the transported plumes (AMT/ACPT inter-journal SI)”. It is not associated with a confer-
could be explained by a real increase in their lifetime in the ence.
plume because of photochemical conditions in the plume,
which we consider unexpected. Based on our current knowl-
edge, the most probable explanation of the apparent long life- Acknowledgements. This study was funded by the University of
time of CHOCHO and HCHO would be formation within Bremen. Copernicus Sentinel-5P lv1 data from 2018 were used in
this study. This publication contains modified COPERNICUS Sen-
the plume caused by the oxidation of a mixture of longer-
tinel data (2018). We thank the Copernicus Atmosphere Monitor-
lived emitted VOC precursors (e.g. methanol, ethanol, acety-
ing Service (CAMS) GFAS team for providing the GFASv1.0 FRP
lene, aromatics, glycolaldehyde, ethylene, etc.), that form and injection height products. FLEXPART simulations were con-
CHOCHO and HCHO at different rates. Further research is ducted on the University of Bremen’s high-performance computing
needed to investigate how frequent such fire-related long- cluster Aether, funded by DFG within the scope of the Excellence
range transport events of VOCs are. The chemical mecha- Initiative. VIIRS and CALIPSO data were obtained from the NASA
nism of the formation of CHOCHO and HCHO in the plumes Langley Research Center Atmospheric Science Data Center. FLEX-
downwind of the fires needs to be identified. The assessment PART simulation results were generated using Copernicus Climate
of the number of such fires events and their relevance for tro- Change Service Information (ERA5).
pospheric O3 and aerosol production downwind of the fires, This is, in part, preparatory work for the analysis of the data from
as well as air quality, is required. the DFG SPP HALO EMeRGe project, which has one focus on
biomass burning and the long-range transport of such plumes. We
thank Abram Sanders (European Organisation for the Exploitation
of Meteorological Satellites, Darmstadt) for providing support in
Data availability. The Global Fire Assimilation System data are
the preparation of CALIPSO data for the computation of CHOCHO
available in the database of the Copernicus Atmosphere Mon-
and HCHO AMFs.
itoring Service (https://apps.ecmwf.int/datasets/data/cams-gfas/,
last access: 7 November 2018). The CALIPSO Cloud and
Aerosol Lidar Level 2 Aerosol Profile Version 3-40 Product
(CAL_LID_L2_05kmAPro-Prov-V3-40) data are available at Financial support. The article processing charges for this open-
the NASA Langley Research Center Atmospheric Science Data access publication were covered by the University of Bremen.
Center (https://search.earthdata.nasa.gov/search/granules?p=
C1356785530-LARC_ASDC&tl=1566319789!4!!, last access:
29 March 2019). The Suomi NPP Visible Infrared Imaging Review statement. This paper was edited by Robert McLaren and
Radiometer Suite (VIIRS) true-colour images are available reviewed by two anonymous referees.
at the NASA Langley Research Center Atmospheric Sci-
ence Data Center (https://go.nasa.gov/38SJDxH, last access:
19 June 2019). The FLEXPART simulations, level 2 and
level 3, of CHOCHO and HCHO are available at the Institute
of Environmental Physics of the University of Bremen (http: References
//www.iup.uni-bremen.de/doas/data/glyoxal/S5P/alvarado_2020/,
last access: 28 January 2020). The underlying data of the figures are Abbot, D. S., Palmer, P. I., Martin, R. V., Chance, K. V., Jacob,
D. J., and Guenther, A.: Seasonal and interannual variability of
North American isoprene emissions as determined by formalde-
Atmos. Chem. Phys., 20, 2057–2072, 2020 www.atmos-chem-phys.net/20/2057/2020/L. M. A. Alvarado et al.: Unexpected long-range transport of glyoxal and formaldehyde 2069 hyde column measurements from space, Geophys. Res. Lett., 30, De Smedt, I., Stavrakou, T., Hendrick, F., Danckaert, T., Vlem- 1886, https://doi.org/10.1029/2003GL017336, 2003. mix, T., Pinardi, G., Theys, N., Lerot, C., Gielen, C., Vigouroux, Alvarado, L. M. A.: Investigating the role of glyoxal using satel- C., Hermans, C., Fayt, C., Veefkind, P., Müller, J.-F., and Van lite and MAX-DOAS measurements, PhD, University of Bre- Roozendael, M.: Diurnal, seasonal and long-term variations of men, Bremen, available at: http://nbn-resolving.de/urn:nbn:de: global formaldehyde columns inferred from combined OMI and gbv:46-00105347-16 (last access: 28 August 2019), 2016. GOME-2 observations, Atmos. Chem. Phys., 15, 12519–12545, Alvarado, L. M. A., Richter, A., Vrekoussis, M., Wittrock, F., https://doi.org/10.5194/acp-15-12519-2015, 2015. Hilboll, A., Schreier, S. F., and Burrows, J. P.: An improved gly- De Smedt, I., Theys, N., Yu, H., Danckaert, T., Lerot, C., Comper- oxal retrieval from OMI measurements, Atmos. Meas. Tech., 7, nolle, S., Van Roozendael, M., Richter, A., Hilboll, A., Peters, 4133–4150, https://doi.org/10.5194/amt-7-4133-2014, 2014. E., Pedergnana, M., Loyola, D., Beirle, S., Wagner, T., Eskes, H., Alvarado, L. M. A., Richter, A., Vrekoussis, M., Wittrock, F., van Geffen, J., Boersma, K. F., and Veefkind, P.: Algorithm theo- Hilboll, A., Schreier, S. F., and Burrows, J. P.: Investigating the retical baseline for formaldehyde retrievals from S5P TROPOMI Link Between Glyoxal and Biogenic Activities, in: Towards an and from the QA4ECV project, Atmos. Meas. Tech., 11, 2395– Interdisciplinary Approach in Earth System Science, edited by: 2426, https://doi.org/10.5194/amt-11-2395-2018, 2018. Lohmann, G., Meggers, H., Unnithan, V., Wolf-Gladrow, D., Fleischmann, O. C., Hartmann, M., Burrows, J. P., and Orphal, Notholt, J., and Bracher, A., pp. 59–65, Springer International J.: New ultraviolet absorption cross-sections of BrO at at- Publishing, Cham, Germany, https://doi.org/10.1007/978-3-319- mospheric temperatures measured by time-windowing Fourier 13865-7_7, 2015. transform spectroscopy, J. Photochem. Photobiol. A, 168, 117– Atkinson, R.: Atmospheric chemistry of VOCs and NOx , At- 132, https://doi.org/10.1016/j.jphotochem.2004.03.026, 2004. mos. Environ., 34, 2063–2101, https://doi.org/10.1016/S1352- Folkins, I., Wennberg, P. O., Hanisco, T. F., Anderson, J. 2310(99)00460-4, 2000. G., and Salawitch, R. J.: OH, HO2 , and NO in two Behrens, L. K., Hilboll, A., Richter, A., Peters, E., Alvarado, L. biomass burning plumes: Sources of HOx and implications M. A., Kalisz Hedegaard, A. B., Wittrock, F., Burrows, J. P., for ozone production, Geophys. Res. Lett., 24, 3185–3188, and Vrekoussis, M.: Detection of outflow of formaldehyde and https://doi.org/10.1029/97GL03047, 1997. glyoxal from the African continent to the Atlantic Ocean with Fu, T.-M., Jacob, D. J., Palmer, P. I., Chance, K., Wang, Y. X., Bar- a MAX-DOAS instrument, Atmos. Chem. Phys., 19, 10257– letta, B., Blake, D. R., Stanton, J. C., and Pilling, M. J.: Space- 10278, https://doi.org/10.5194/acp-19-10257-2019, 2019. based formaldehyde measurements as constraints on volatile Bovensmann, H., Burrows, J. P., Buchwitz, M., Frerick, J., Noël, organic compound emissions in east and south Asia and im- S., Rozanov, V. V., Chance, K. V., and Goede, A. P. H.: plications for ozone, J. Geophys. Res.-Atmos., 112, D06312, SCIAMACHY: Mission Objectives and Measurement Modes, https://doi.org/10.1029/2006JD007853, 2007. J. Atmos. Sci., 56, 127–150, https://doi.org/10.1175/1520- González Abad, G., Liu, X., Chance, K., Wang, H., Kurosu, 0469(1999)0562.0.CO;2, 1999. T. P., and Suleiman, R.: Updated Smithsonian Astrophysi- Burrows, J. P., Hölzle, E., Goede, A. P. H., Visser, H., and Fricke, cal Observatory Ozone Monitoring Instrument (SAO OMI) W.: SCIAMACHY – scanning imaging absorption spectrome- formaldehyde retrieval, Atmos. Meas. Tech., 8, 19–32, ter for atmospheric chartography, Acta Astronaut., 35, 445–451, https://doi.org/10.5194/amt-8-19-2015, 2015. https://doi.org/10.1016/0094-5765(94)00278-T, 1995. Guenther, A., Geron, C., Pierce, T., Lamb, B., Harley, P., Burrows, J. P., Weber, M., Buchwitz, M., Rozanov, V., and Fall, R.: Natural emissions of non-methane volatile or- Ladstätter-Weißenmayer, A., Richter, A., DeBeek, R., ganic compounds, carbon monoxide, and oxides of nitro- Hoogen, R., Bramstedt, K., Eichmann, K.-U., Eisinger, M., gen from North America, Atmos. Environ., 34, 2205–2230, and Perner, D.: The Global Ozone Monitoring Experiment https://doi.org/10.1016/S1352-2310(99)00465-3, 2000. (GOME): Mission Concept and First Scientific Results, Guenther, A., Karl, T., Harley, P., Wiedinmyer, C., Palmer, P. J. Atmos. Sci., 56, 151–175, https://doi.org/10.1175/1520- I., and Geron, C.: Estimates of global terrestrial isoprene 0469(1999)0562.0.CO;2, 1999. emissions using MEGAN (Model of Emissions of Gases and Chan Miller, C., Gonzalez Abad, G., Wang, H., Liu, X., Kurosu, Aerosols from Nature), Atmos. Chem. Phys., 6, 3181–3210, T., Jacob, D. J., and Chance, K.: Glyoxal retrieval from the https://doi.org/10.5194/acp-6-3181-2006, 2006. Ozone Monitoring Instrument, Atmos. Meas. Tech., 7, 3891– Hewson, W., Bösch, H., Barkley, M. P., and De Smedt, I.: Char- 3907, https://doi.org/10.5194/amt-7-3891-2014, 2014. acterisation of GOME-2 formaldehyde retrieval sensitivity, At- De Smedt, I., Müller, J.-F., Stavrakou, T., van der A, R., Eskes, mos. Meas. Tech., 6, 371–386, https://doi.org/10.5194/amt-6- H., and Van Roozendael, M.: Twelve years of global obser- 371-2013, 2013. vations of formaldehyde in the troposphere using GOME and Jang, M., Czoschke, N. M., Lee, S., and Kamens, R. M.: SCIAMACHY sensors, Atmos. Chem. Phys., 8, 4947–4963, Heterogeneous Atmospheric Aerosol Production by Acid- https://doi.org/10.5194/acp-8-4947-2008, 2008. Catalyzed Particle-Phase Reactions, Science, 298, 814–817, De Smedt, I., Van Roozendael, M., Stavrakou, T., Müller, J.-F., https://doi.org/10.1126/science.1075798, 2002. Lerot, C., Theys, N., Valks, P., Hao, N., and van der A, R.: Im- Justice, C. O., Giglio, L., Korontzi, S., Owens, J., Morisette, J. T., proved retrieval of global tropospheric formaldehyde columns Roy, D., Descloitres, J., Alleaume, S., Petitcolin, F., and Kauf- from GOME-2/MetOp-A addressing noise reduction and instru- man, Y.: The MODIS fire products, Remote Sens. Environ., mental degradation issues, Atmos. Meas. Tech., 5, 2933–2949, 83, 244–262, https://doi.org/10.1016/S0034-4257(02)00076-7, https://doi.org/10.5194/amt-5-2933-2012, 2012. 2002. www.atmos-chem-phys.net/20/2057/2020/ Atmos. Chem. Phys., 20, 2057–2072, 2020
2070                                 L. M. A. Alvarado et al.: Unexpected long-range transport of glyoxal and formaldehyde

Kaiser, J. W., Heil, A., Andreae, M. O., Benedetti, A., Chubarova,          calibration, and level 1 data processing – an overview, Atmos.
  N., Jones, L., Morcrette, J.-J., Razinger, M., Schultz, M. G.,            Meas. Tech., 9, 1279–1301, https://doi.org/10.5194/amt-9-1279-
  Suttie, M., and van der Werf, G. R.: Biomass burning emis-                2016, 2016.
  sions estimated with a global fire assimilation system based           Myriokefalitakis, S., Vrekoussis, M., Tsigaridis, K., Wittrock, F.,
  on observed fire radiative power, Biogeosciences, 9, 527–554,             Richter, A., Brühl, C., Volkamer, R., Burrows, J. P., and Kanaki-
  https://doi.org/10.5194/bg-9-527-2012, 2012.                              dou, M.: The influence of natural and anthropogenic secondary
Kansal, A.: Sources and reactivity of NMHCs and VOCs in                     sources on the glyoxal global distribution, Atmos. Chem. Phys.,
  the atmosphere: A review, J. Hazard. Mater., 166, 17–26,                  8, 4965–4981, https://doi.org/10.5194/acp-8-4965-2008, 2008.
  https://doi.org/10.1016/j.jhazmat.2008.11.048, 2009.                   Natural Resources Canada: Canadian Wildland Fire In-
Kroll, J. H., Ng, N. L., Murphy, S. M., Varutbangkul, V., Fla-              formation System, Archived reports, available at:
  gan, R. C., and Seinfeld, J. H.: Chamber studies of sec-                  http://cwfis.cfs.nrcan.gc.ca/report/archives?year=2018&month=
  ondary organic aerosol growth by reactive uptake of sim-                  08&day=29&process=Submit (last access: 12 April 2019),
  ple carbonyl compounds, J. Geophys. Res., 110, D23207,                    2018.
  https://doi.org/10.1029/2005JD006004, 2005.                            Palmer, P. I., Jacob, D. J., Chance, K., Martin, R. V., Spurr, R. J. D.,
Kurosu, T. P., Chance, K., and Volkamer, R.: Measurements of                Kurosu, T. P., Bey, I., Yantosca, R., Fiore, A., and Li, Q.: Air
  HCHO, CHOCHO, and BrO from the Ozone Monitoring In-                       mass factor formulation for spectroscopic measurements from
  strument on EOS AURA, in: Proceedings of Envisat Sympo-                   satellites: Application to formaldehyde retrievals from the Global
  sium, ESA earthnet online, Montreux (Switzerland), available              Ozone Monitoring Experiment, J. Geophys. Res.-Atmos., 106,
  at: https://earth.esa.int/envisatsymposium/proceedings/sessions/          14539–14550, https://doi.org/10.1029/2000JD900772, 2001.
  3G1/507603ch.pdf (last access: 28 August 2019), 2007.                  Palmer, P. I., Jacob, D. J., Fiore, A. M., Martin, R. V.,
Lerot, C., Stavrakou, T., De Smedt, I., Müller, J.-F., and                  Chance, K., and Kurosu, T. P.: Mapping isoprene emis-
  Van Roozendael, M.: Glyoxal vertical columns from GOME-                   sions over North America using formaldehyde column ob-
  2 backscattered light measurements and comparisons with                   servations from space, J. Geophys. Res.-Atmos., 108, 4180,
  a global model, Atmos. Chem. Phys., 10, 12059–12072,                      https://doi.org/10.1029/2002JD002153, 2003.
  https://doi.org/10.5194/acp-10-12059-2010, 2010.                       Pisso, I., Sollum, E., Grythe, H., Kristiansen, N. I., Cas-
Levelt, P. F., van den Oord, G. H. J., Dobber, M. R., Malkki, A.,           siani, M., Eckhardt, S., Arnold, D., Morton, D., Thomp-
  Visser, H., Vries, J. de, Stammes, P., Lundell, J. O. V., and Saari,      son, R. L., Groot Zwaaftink, C. D., Evangeliou, N., Sode-
  H.: The ozone monitoring instrument, IEEE T. Geosci. Remote,              mann, H., Haimberger, L., Henne, S., Brunner, D., Burkhart,
  44, 1093–1101, https://doi.org/10.1109/TGRS.2006.872333,                  J. F., Fouilloux, A., Brioude, J., Philipp, A., Seibert, P., and
  2006.                                                                     Stohl, A.: The Lagrangian particle dispersion model FLEX-
Liggio, J., Li, S.-M., and McLaren, R.: Reactive uptake of glyoxal          PART version 10.4, Geosci. Model Dev., 12, 4955–4997,
  by particulate matter, J. Geophys. Res.-Atmos., 110, D10304,              https://doi.org/10.5194/gmd-12-4955-2019, 2019.
  https://doi.org/10.1029/2004JD005113, 2005.                            Puk, ı̄te, J., Kühl, S., Deutschmann, T., Platt, U., and Wagner, T.:
Liu, Z., Wang, Y., Vrekoussis, M., Richter, A., Wittrock, F.,               Extending differential optical absorption spectroscopy for limb
  Burrows, J. P., Shao, M., Chang, C.-C., Liu, S.-C., Wang,                 measurements in the UV, Atmos. Meas. Tech., 3, 631–653,
  H., and Chen, C.: Exploring the missing source of glyoxal                 https://doi.org/10.5194/amt-3-631-2010, 2010.
  (CHOCHO) over China, Geophys. Res. Lett., 39, L10812,                  Rémy, S., Veira, A., Paugam, R., Sofiev, M., Kaiser, J. W., Marenco,
  https://doi.org/10.1029/2012GL051645, 2012.                               F., Burton, S. P., Benedetti, A., Engelen, R. J., Ferrare, R., and
Loeffler, K. W., Koehler, C. A., Paul, N. M., and De Haan, D.               Hair, J. W.: Two global data sets of daily fire emission injec-
  O.: Oligomer Formation in Evaporating Aqueous Glyoxal and                 tion heights since 2003, Atmos. Chem. Phys., 17, 2921–2942,
  Methyl Glyoxal Solutions, Environ. Sci. Technol., 40, 6318–               https://doi.org/10.5194/acp-17-2921-2017, 2017.
  6323, https://doi.org/10.1021/es060810w, 2006.                         Richter, A., Begoin, M., Hilboll, A., and Burrows, J. P.: An im-
Marais, E. A., Jacob, D. J., Kurosu, T. P., Chance, K., Murphy, J.          proved NO2 retrieval for the GOME-2 satellite instrument, At-
  G., Reeves, C., Mills, G., Casadio, S., Millet, D. B., Barkley,           mos. Meas. Tech., 4, 1147–1159, https://doi.org/10.5194/amt-4-
  M. P., Paulot, F., and Mao, J.: Isoprene emissions in Africa in-          1147-2011, 2011.
  ferred from OMI observations of formaldehyde columns, At-              Rothman, L. S., Gordon, I. E., Babikov, Y., Barbe, A., Chris
  mos. Chem. Phys., 12, 6219–6235, https://doi.org/10.5194/acp-             Benner, D., Bernath, P. F., Birk, M., Bizzocchi, L., Boudon,
  12-6219-2012, 2012.                                                       V., Brown, L. R., Campargue, A., Chance, K., Cohen, E. A.,
Mason, J. D., Cone, M. T., and Fry, E. S.: Ultraviolet (250–550 nm)         Coudert, L. H., Devi, V. M., Drouin, B. J., Fayt, A., Flaud,
  absorption spectrum of pure water, Appl. Optics, 55, 7163–7172,           J.-M., Gamache, R. R., Harrison, J. J., Hartmann, J.-M., Hill,
  https://doi.org/10.1364/AO.55.007163, 2016.                               C., Hodges, J. T., Jacquemart, D., Jolly, A., Lamouroux, J.,
Meller, R. and Moortgat, G. K.: Temperature dependence of the ab-           Le Roy, R. J., Li, G., Long, D. A., Lyulin, O. M., Mackie,
  sorption cross sections of formaldehyde between 223 and 323 K             C. J., Massie, S. T., Mikhailenko, S., Müller, H. S. P., Nau-
  in the wavelength range 225–375 nm, J. Geophys. Res., 105,                menko, O. V., Nikitin, A. V., Orphal, J., Perevalov, V., Per-
  7089–7101, https://doi.org/10.1029/1999JD901074, 2000.                    rin, A., Polovtseva, E. R., Richard, C., Smith, M. A. H.,
Munro, R., Lang, R., Klaes, D., Poli, G., Retscher, C., Lind-               Starikova, E., Sung, K., Tashkun, S., Tennyson, J., Toon, G. C.,
  strot, R., Huckle, R., Lacan, A., Grzegorski, M., Holdak, A.,             Tyuterev, V. G., and Wagner, G.: The HITRAN2012 molecu-
  Kokhanovsky, A., Livschitz, J., and Eisinger, M.: The GOME-               lar spectroscopic database, J. Quant. Spectrosc. Ra., 130, 4–50,
  2 instrument on the Metop series of satellites: instrument design,        https://doi.org/10.1016/j.jqsrt.2013.07.002, 2013.

Atmos. Chem. Phys., 20, 2057–2072, 2020                                                     www.atmos-chem-phys.net/20/2057/2020/
You can also read