Restoring the top-of-atmosphere reflectance during solar eclipses: a proof of concept with the UV absorbing aerosol index measured by TROPOMI - Recent
←
→
Page content transcription
If your browser does not render page correctly, please read the page content below
Atmos. Chem. Phys., 21, 8593–8614, 2021
https://doi.org/10.5194/acp-21-8593-2021
© Author(s) 2021. This work is distributed under
the Creative Commons Attribution 4.0 License.

Restoring the top-of-atmosphere reflectance during solar eclipses:
a proof of concept with the UV absorbing aerosol index measured
by TROPOMI
Victor Trees1,2 , Ping Wang1 , and Piet Stammes1
1 Royal   Netherlands Meteorological Institute (KNMI), De Bilt, the Netherlands
2 Delft   University of Technology, Delft, the Netherlands

Correspondence: Victor Trees (victor.trees@knmi.nl)

Received: 10 November 2020 – Discussion started: 18 December 2020
Revised: 22 April 2021 – Accepted: 22 April 2021 – Published: 8 June 2021

Abstract. During a solar eclipse the solar irradiance reach-       instrument on the same day but outside the Moon shadow. No
ing the top of the atmosphere (TOA) is reduced in the Moon         indication of local absorbing aerosol changes caused by the
shadow. The solar irradiance is commonly measured by Earth         eclipses was found. We conclude that the correction method
observation satellites before the start of the solar eclipse and   of this paper can be used to detect real AAI rising phenom-
is not corrected for this reduction, which results in a decrease   ena during a solar eclipse and has the potential to restore any
in the computed TOA reflectances. Consequently, air qual-          other product that is derived from TOA reflectance spectra.
ity products that are derived from TOA reflectance spectra,        This would resolve the solar eclipse anomalies in satellite
such as the ultraviolet (UV) absorbing aerosol index (AAI),        air quality measurements in the penumbra and antumbra and
are distorted or undefined in the shadow of the Moon. The          would allow for studying the effect of the eclipse obscuration
availability of air quality satellite data in the penumbral and    on the composition of the Earth’s atmosphere from space.
antumbral shadow during solar eclipses, however, is of par-
ticular interest to users studying the atmospheric response
to solar eclipses. Given the time and location of a point on
the Earth’s surface, we explain how to compute the obscura-        1   Introduction
tion during a solar eclipse, taking into account wavelength-
dependent solar limb darkening. With the calculated obscura-       Earth observation satellite spectrometer instruments are de-
tion fractions, we restore the TOA reflectances and the AAI        signed to measure the particles and gases in the Earth’s atmo-
in the penumbral shadow during the annular solar eclipses          sphere. They rely upon the reflectance of the incident sun-
on 26 December 2019 and 21 June 2020 measured by the               light on the top of the atmosphere (TOA) at various wave-
TROPOMI/S5P instrument. We compare the calculated ob-              lengths in the UV, visible, near-infrared, and shortwave-
scuration to the estimated obscuration using an uneclipsed         infrared spectral domains. These TOA reflectances are cal-
orbit. In the corrected products, the signature of the Moon        culated through the division of the measured Earth radiance
shadow disappeared, but only if wavelength-dependent solar         by the measured solar irradiance. During a solar eclipse, the
limb darkening is taken into account. We find that the Moon        solar irradiance reaching TOA is reduced as the Moon blocks
shadow anomaly in the uncorrected AAI is caused by a re-           (part of) the sunlight, reducing the Earth radiance. Because
duction of the measured reflectance at 380 nm, rather than         the solar irradiance is commonly measured before the start
a colour change of the measured light. We restore common           of the eclipse, the atmosphere measurements are distorted in
AAI features such as the sunglint and desert dust, and we          the shadow of the Moon or, after raising an eclipse flag, un-
confirm the restored AAI feature on 21 June 2020 at the Tak-       defined.
lamakan Desert by measurements of the GOME-2C satellite               Since the start of the nominal operational mode of the
                                                                   TROPOMI spectrometer instrument on board the S5P satel-

Published by Copernicus Publications on behalf of the European Geosciences Union.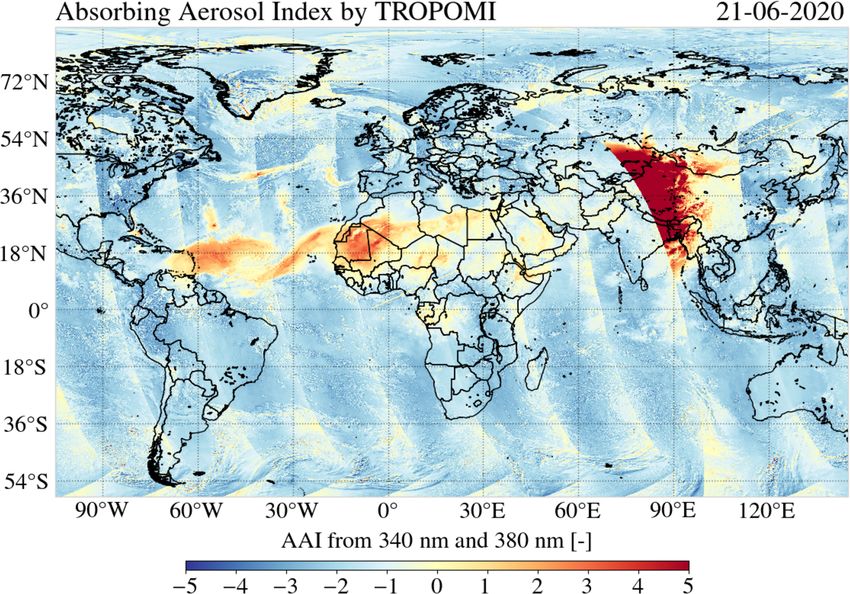
8594 V. Trees et al.: Restoring the top-of-atmosphere reflectance during solar eclipses
lite in May 2018, seven solar eclipses occurred, six of Wuebbles and Chang, 1979). Although similar information
which have been measured by TROPOMI. An example of could be obtained during sunrise and sunset, Wuebbles and
an air quality product of TROPOMI that suffers from the Chang (1979) pointed out that the relatively short time du-
Moon shadow is the ultraviolet (UV) absorbing aerosol in- rations of solar eclipses allow for a more clear identification
dex (AAI). The AAI is a qualitative measure of absorb- of the major photochemical cycles in the stratosphere, due
ing aerosols in the atmosphere such as desert dust, volcanic to the smaller bias from atmospheric transport, mixing, and
ash, and anthropologically produced soot and can be used to interfering chemical reactions throughout the diurnal cycle.
daily and globally track the aerosol plumes from dust storms, Ground-based measurements, however, are taken at a sin-
forest fires, volcanic eruptions, and biomass burning. The gle location. Being able to restore satellite data in the Moon
AAI is retrieved from TOA reflectance measurements at two shadow would allow for studying the effect of solar eclipses
wavelengths in the UV range; hence the AAI may directly be on the Earth’s atmosphere from space at various locations
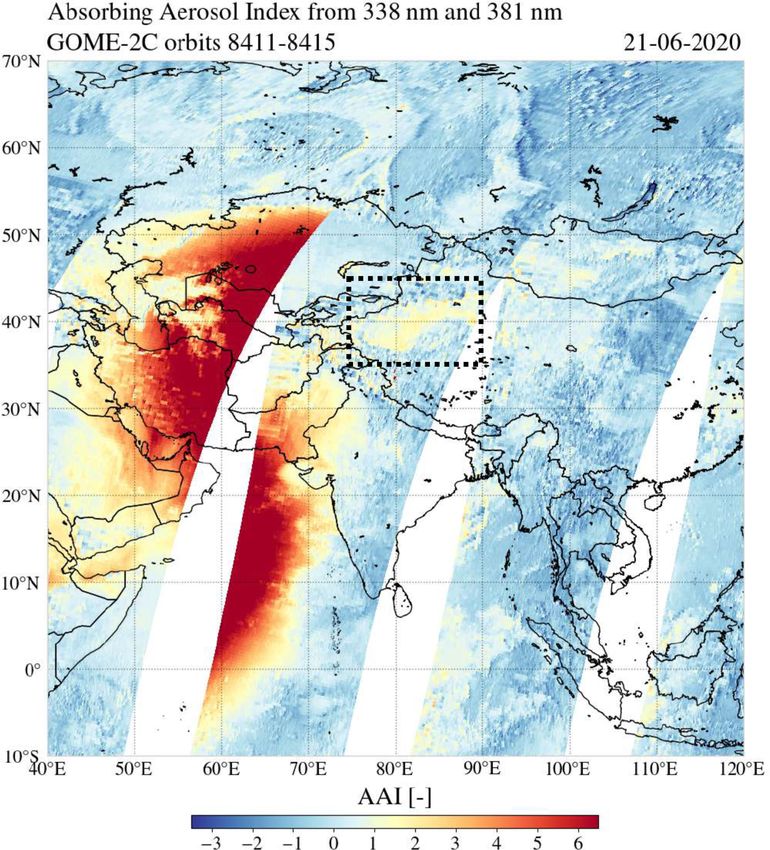
affected by the obscuration during a solar eclipse. Figure 1 with the same instrument.
is a near-global AAI map on 21 June 2020, using TOA re- The geometry of the Moon shadow on the Earth’s sur-
flectance measurements at 340 and 380 nm by TROPOMI. face is an astronomical well-understood problem, and pre-
Dust aerosol plumes over the Atlantic Ocean originating dictions of the eclipse time, location, and local eclipse cir-
from the Sahara can be identified through the AAI increase cumstances can be done with high accuracy (Espenak and
of ∼ 2 to ∼ 4 points relative to their surrounding regions. In Meeus, 2006; Meeus, 1989). The eclipse obscuration at a
western China an AAI larger than 5 is measured, which is point in the shadow can be approximated by the fraction of
caused by the shadow of the Moon. TROPOMI data contain the area of the apparent solar disc occulted by the Moon (Sei-
an eclipse flag indicating the eclipse occurrence at a ground delmann, 1992). Montornès et al. (2016) approximated the
pixel. For satellite instruments that do not contain an eclipse eclipse obscuration by the fraction of the solar disc diameter
flag, such as the GOME-2 instrument, these eclipse anoma- occulted by the Moon in order to correct the TOA solar ir-
lies propagate into anomalies in temporal average maps, po- radiance in the Advanced Research Weather and Forecasting
tentially resulting in false conclusions about the mean aerosol (WRF-ARW) model and modelled a local surface tempera-
effect in that time period.1 ture response of ∼ −1 to ∼ −3 K, with a time lag between
The reduction of the solar irradiance during an eclipse ∼ 5 and ∼ 15 min after the instant of maximum obscuration.
might influence the photochemical activity, and therefore the Such wavelength-independent approximations of the eclipse
composition, of the Earth’s atmosphere. Measurements of the obscuration fraction based on the overlapping discs indeed
speed and significance of this atmospheric response could could work well to estimate the shortwave fluxes, depend-
contribute to the understanding of the sensitivity of plane- ing on the desired accuracy. If the spectral variation in the
tary atmospheres to (variations in) their solar or stellar illu- measured light is to be studied, however, the wavelength de-
mination and could possibly be used to verify atmospheric pendence of the eclipse obscuration fraction, caused by solar
chemistry models. Ground-based measurements during so- limb darkening, cannot be neglected. Koepke et al. (2001)
lar eclipses of local ozone column fluctuations have been provided the formulae to compute the eclipse obscuration
taken using Dobson and Brewer spectrophotometers, but the fraction for total eclipses taking into account solar limb dark-
reported results are contradictory (see, e.g. Bojkov, 1968; ening if the relative position and apparent dimensions of the
Mims and Mims, 1993; Chakrabarty et al., 1997, 2001). lunar and solar discs are known. They showed that the error
Zerefos et al. (2000) pointed out the importance of solar in the solar irradiance close to total obscuration may become
limb darkening and the direct to diffuse irradiance on the 30 % at 1500 nm and 60 % at 310 nm if solar limb darkening
ozone column retrieval, but also the change in effective tem- is not taken into account.
perature in the ozone layer or other atmospheric conditions Emde and Mayer (2007), Kazantzidis et al. (2007), and
(different cloudiness, solar zenith angle and turbidity) may Ockenfuß et al. (2020) performed extensive 3-D radiative
have influenced the measurements (Winkler et al., 2001). Un- transfer modelling of total solar eclipses, taking into account
ambiguous increases in local NO2 concentration have been solar limb darkening. Their work gives insight into the spec-
measured from the ground during solar eclipses resulting tral behaviour of sunlight reaching a ground sensor located
from the reduced photodissociation of NO2 in the strato- in or close to the total Moon shadow and the importance
sphere (see, e.g. Gil et al., 2000; Adams et al., 2010). Un- of the various 3-D radiative transfer components. Emde and
like ozone, NO2 reacts on a timescale of several minutes di- Mayer (2007) pointed out that solar eclipses provide excel-
rectly responding to the eclipse obscuration (Herman, 1979; lent opportunities to test 3-D radiative transfer codes against
measurements because, unlike broken cloud fields, the Moon
1 An example of a monthly average AAI map of the GOME-2 shadow’s geometry is well-defined.
satellite instrument that is distorted by a solar eclipse can be found In this paper, we present a method to restore the TOA
on https://d1qb6yzwaaq4he.cloudfront.net/airpollution/absaai/ reflectance as measured by Earth observation satellites in
GOME2B/monthly/images/2019/GOME-2B_AAI_map_201912. the penumbra and antumbra of solar eclipses, by combin-
png, last access: 22 February 2021. ing accurate eclipse predictions with the computation of the
Atmos. Chem. Phys., 21, 8593–8614, 2021 https://doi.org/10.5194/acp-21-8593-2021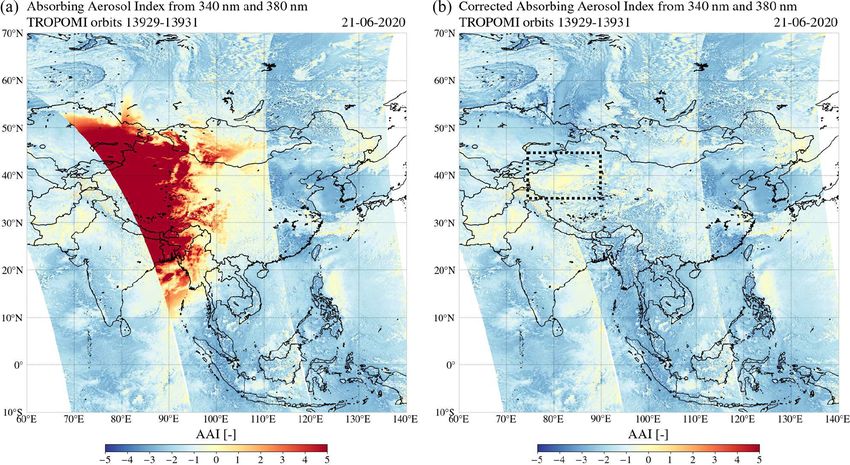
V. Trees et al.: Restoring the top-of-atmosphere reflectance during solar eclipses                                              8595

                                                                  Figure 2. Schematic sketch of a satellite retrieving the top-of-
                                                                  atmosphere reflectance during a solar eclipse. I is the measured ra-
                                                                  diance reflected by the atmosphere–surface system, fo is the eclipse
Figure 1. The absorbing aerosol index from the 340 and 380 nm
                                                                  obscuration fraction, and E0 is the uneclipsed solar irradiance.
wavelength pair by TROPOMI on 21 June 2020. The anomaly cen-
tred at western China is caused by the shadow of the Moon.
                                                                  2.1   Solar irradiance correction
eclipse obscuration fraction taking into account wavelength-      The spectral TOA reflectance of an atmosphere–surface sys-
dependent solar limb darkening. We apply this method to the       tem as measured by a satellite is defined as
TOA reflectances measured by the TROPOMI/S5P satellite
instrument in the penumbra during the annular solar eclipses                       π I (λ)
on 26 December 2019 and 21 June 2020, and we show how             R meas (λ) =              ,                                     (1)
                                                                                  µ0 E0 (λ)
the calculated obscuration fraction can be compared to the
estimated obscuration fraction from measurements in an un-        where I is the radiance reflected by the atmosphere–surface
eclipsed orbit. With the restored TOA reflectances, we com-       system in W m−2 sr−1 nm−1 and E0 is the extraterrestrial so-
pute a corrected version of the AAI and analyse the features      lar irradiance perpendicular to the beam in W m−2 nm−1 . The
that were otherwise hidden in the shadow of the Moon.             units nm−1 indicate that both I and E0 depend on wave-
   This paper is structured as follows. In Sect. 2, we explain    length λ. Also, I depends on the viewing zenith angle θ , the
the method to restore the measured TOA reflectance during a       solar zenith angle θ0 , the viewing azimuth angle ϕ, and the
solar eclipse. In Sect. 3, we show the results of applying this   solar azimuth angle ϕ0 . Furthermore, we use the definitions
method to the eclipsed TROPOMI orbits during the annular          µ = cos θ and µ0 = cos θ0 . I is measured by TROPOMI con-
solar eclipses on 26 December 2019 and 21 June 2020. In           tinuously at the dayside of the Earth. E0 is measured by
Sect. 4, we discuss the limits of the method and the points       TROPOMI near the North Pole once every 15 orbits, which
of attention for future applications. In Sect. 5, we summarize    is approximately once every calendar day.
the results and state the most important conclusions of this         During a solar eclipse, the solar irradiance reaching TOA
paper.                                                            is reduced, as illustrated in Fig. 2. The fraction of the
                                                                  spectral irradiance E0 (λ) that is blocked by the Moon
                                                                  is the wavelength-dependent eclipse obscuration fraction,
2   Method                                                        fo (λ). The remaining spectral irradiance at TOA is [1 −
                                                                  fo (λ)]E0 (λ). We neglect the contribution of the Sun’s
Here, we explain the method to restore the measured TOA           corona2 . The intrinsic spectral reflectance of the atmosphere–
reflectance during a solar eclipse. We start with explaining      surface system (i.e. the fraction of the emerging radiance to
the situation of measuring the TOA reflectance during a so-       the incident irradiance) is then obtained by correcting the so-
lar eclipse and how these measurements can be restored with       lar irradiance:
the eclipse obscuration fraction (Sect. 2.1). Then, we ex-
plain the Moon shadow types (Sect. 2.2) and how we com-                                π I (λ)
                                                                  R int (λ) =                         .                           (2)
pute the eclipse obscuration fraction taking into account so-                   µ0 [1 − fo (λ)]E0 (λ)
lar limb darkening, knowing the local eclipse circumstances
(Sect. 2.3). In Sect. 2.4 and Appendix A we explain how we        If the optical properties of the atmosphere–surface system
compute the local eclipse circumstances from the measure-         are constant just before and during the eclipse, then R int is
ment time and location of a point on the Earth’s surface.            2 Emde and Mayer (2007) estimated that the radiance of the
                                                                  corona is approximately 5.9 × 10⁶ times smaller than the radiance
                                                                  originating from the centre of the solar disc.

https://doi.org/10.5194/acp-21-8593-2021                                              Atmos. Chem. Phys., 21, 8593–8614, 2021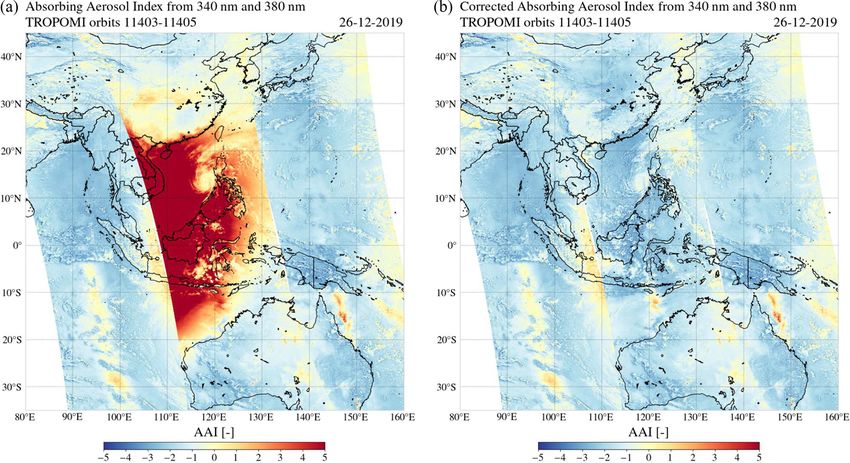
8596                                         V. Trees et al.: Restoring the top-of-atmosphere reflectance during solar eclipses

expected to be constant regardless of the eclipse conditions.
We compute R int from R meas by combining Eqs. (1) and (2):
              R meas (λ)
R int (λ) =              .                                     (3)
              1 − fo (λ)
Properties of the atmosphere–surface system can be derived
during a solar eclipse from the spectrum of R int . Note that
potential changes of the atmosphere–surface system that are
caused by the eclipse obscuration may affect R int , depending
on the significance and nature of these changes.
   We assume that the solar irradiance is randomly polar-
ized. Also, we neglect light travelling horizontally in the at-
mosphere from one ground pixel to the other. The impor-
tance of horizontal light travelling between adjacent pixels
is expected to increase with increasing fo , but will only be-
come significant close to totality (Emde and Mayer, 2007).
In Sect. 4, we reflect back on these assumptions.

2.2    Moon shadow types

The experienced obscuration fraction fo (λ) depends on the
location with respect to the position of the Sun and the Moon.
Figure 3 illustrates the shadow types that may be experi-             Figure 3. Sketch of the Moon shadow types that may occur during a
enced during a solar eclipse: (1) the umbra, where the lu-            solar eclipse (not to scale). In this example, an annular solar eclipse
                                                                      is experienced at the Earth’s surface.
nar disc fully occults the solar disc (fo (λ) = 1) during a
total eclipse; (2) the antumbra, where every part of the lu-
nar disc occults the solar disc but full obscuration is not
                                                                      Indeed, during an eclipse, the phase angle of the Moon ap-
reached (0 < fo (λ) < 1) during an annular eclipse; and (3)
                                                                      proaches 180◦ and, due to its solid composition, its near-
the penumbra, where only a part of the lunar disc occults
                                                                      spherical shape, and its optically insignificant exosphere, the
the solar disc (0 < fo (λ) < 1) during a partial, total, or an-
                                                                      apparent eclipsing Moon can be approximated by an opaque
nular eclipse. The Moon–Sun axis is often referred to as the
                                                                      circular disc. Not every part of the solar disc, however, con-
“shadow axis” as indicated in Fig. 3. The penumbra is always
                                                                      tributes equally to the total solar flux, as a result of darken-
present during an eclipse. Whether an umbra or an antumbra
                                                                      ing of the apparent solar disc toward the solar limb, which is
is present on the Earth’s surface depends on the distances to
                                                                      caused by the temperature decrease with height in the Sun’s
the Moon and the Sun, which vary in time as the Moon or-
                                                                      photosphere (Chitta et al., 2020). As the Moon covers dif-
bits the Earth and the Earth orbits the Sun, both in elliptical
                                                                      ferent parts of the solar disc during an eclipse, the relative
orbits.
                                                                      contributions of the solar limb and the solar disc centre to the
   In this paper, we do not study the umbra because Eq. (3)
                                                                      total brightness vary. Furthermore, because the emitted radi-
breaks down when fo (λ) = 1. The solar irradiance correction
                                                                      ance from the hot centre peaks at shorter wavelengths than
only applies to pixels located in the penumbra or antumbra,
                                                                      the emitted radiance from the cooler limb, the reduction of
and for which the signal-to-noise ratio is sufficient (we set the
                                                                      the solar irradiance during an eclipse is wavelength depen-
constraint R meas > 50σ , where σ is the 1 standard deviation
                                                                      dent (Koepke et al., 2001; Bernhard and Petkov, 2019).
of R meas ). It is important to note that the area in the penumbra
                                                                         We use the definition of the solar limb darkening function
on the Earth’s surface is always much larger than the area in
                                                                      of Koepke et al. (2001):
the (ant)umbra on the Earth’s surface, as will be shown in
Sect. 3.                                                                             I0 (λ, r)
                                                                      0(λ, r) =                 ,                                        (4)
                                                                                  I0 (λ, r = 0)
2.3    Obscuration fraction
                                                                      where I0 (λ, r = 0) is the radiance originating from the so-
In geometrical solar eclipse predictions, the eclipse obscura-
                                                                      lar disc centre and I0 (λ, r) is the radiance originating from
tion fo is commonly computed as the fraction of the solar
                                                                      the circle with radius r from the solar disc centre, with r
disc occulted by the lunar disc (see e.g. Seidelmann, 1992).3
                                                                      ranging from 0 (centre) to 1 (limb). Koepke et al. (2001) pa-
   3 The eclipse obscuration fraction should not be confused with     rameterized the function 0 by using the simple wavelength-
the eclipse magnitude, which is the fraction of the diameter of the   dependent formula of Waldmeier (1941) based on the tem-
solar disc occulted by the Moon.                                      perature of the Sun’s surface. We, instead, follow Ocken-

Atmos. Chem. Phys., 21, 8593–8614, 2021                                                  https://doi.org/10.5194/acp-21-8593-2021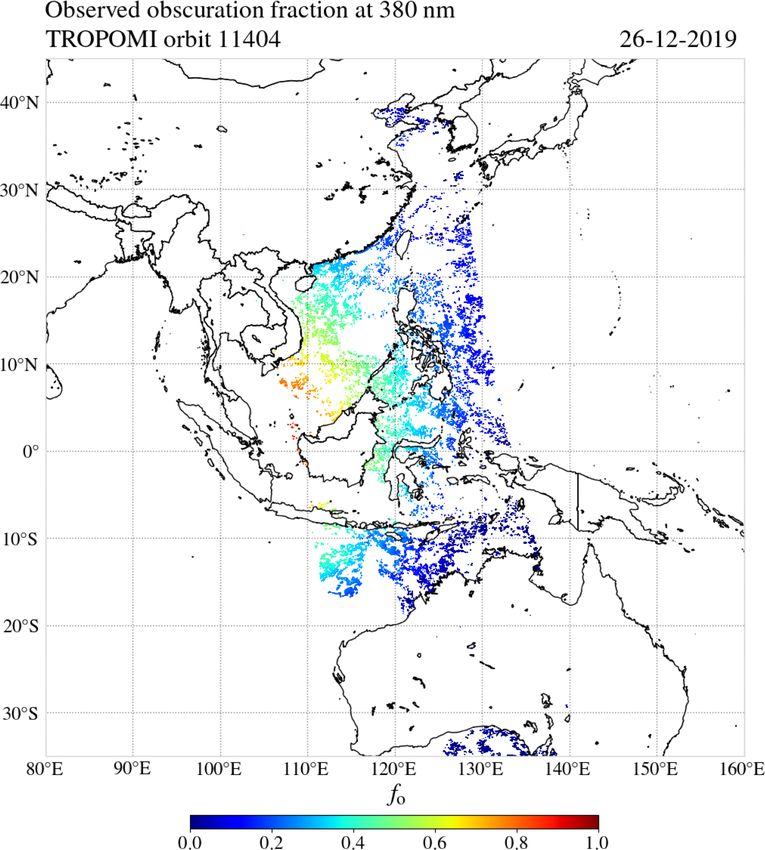
V. Trees et al.: Restoring the top-of-atmosphere reflectance during solar eclipses 8597
Figure 4. Definition of the heliocentric angle ψ used in Eq. (5) (not
to scale). Distance dSE is the geocentric Earth–Sun distance, and r
is the apparent distance on the solar disc from the solar disc centre.
All dimensions are per solar radius Rs . We neglect the effect of the
sphericity of the Sun on the apparent solar disc radius, such that
r = 1 for ψ = 90◦ .
Figure 5. Limb darkening function 0 for wavelengths ranging from
306 to 950 nm, using the limb darkening coefficients of Pierce and
fuß et al. (2020) employing the parametrization of Pierce Slaughter (1977) and Pierce et al. (1977), as a function of distance r
and Slaughter (1977) based on observations by the McMath– from the solar disc centre (where r = 0), with r = 1 the solar limb.
Pierce solar telescope, for which the limb darkening pre- The dashed line is the result without solar limb darkening taken into
dictions showed a better agreement with measurements of account (0 = 1).
the solar spectral irradiance during the total solar eclipse on
21 August 2017 (Bernhard and Petkov, 2019). Function 0 is
computed using the fifth-order polynomial the solar disc area (Koepke et al., 2001, Eq. 2.3):
Z1 Z2π
5
X E0 (λ) = I0 (λ, r = 0) · 0(λ, r) · rdα 0 dr
0(λ, r) = ak (λ)cosk (ψ(r)), (5)
k=0 0 0
Z1
where ak represents the limb darkening coefficients tabulated = 2π · I0 (λ, r = 0) · 0(λ, r) · rdr. (6)
by Pierce and Slaughter (1977) for wavelengths between
0
303.3 and 729.7 nm and by Pierce et al. (1977) for wave-
lengths between 740.4 and 2401.8 nm. Angle ψ is the helio- During an eclipse, the irradiance from the solar disc is re-
centric angle as illustrated in Fig. 4 and can be computed, duced by fo , resulting from the lunar disc overlapping the
for any r with 0 < r < 1, from the radius of the Sun, Rs = solar disc. At distance r from Cs , the angle of the sector of
695 700 km, and from the Earth–Sun distance, dSE , which we the solar disc that is occulted by the lunar disc is 2α (see
retrieve from a geocentric ephemeris of the Sun4 . We linearly Fig. 6). The solar irradiance that is blocked by the Moon is
interpolate 0 between the tabulated wavelengths in order to
Z1 Zα
compute 0 at the wavelengths of interest. In Fig. 5, 0 is plot-
ted against r. Solar limb darkening is most significant at the fo (λ)E0 (λ) = 2 I0 (λ, r = 0) · 0(λ, r) · rdα 0 dr
shortest wavelengths, for which the difference between the 0 0
hot centre and relatively cooler limb is most pronounced (see Z1
also Fig. 5 of Ockenfuß et al., 2020). α(r, X, rm )
= 2π · I0 (λ, r = 0) · 0(λ, r) · rdr.
Figure 6 is a sketch of the lunar disc occulting the solar π
0
disc during an annular solar eclipse. The dimensions of the (7)
discs are normalized by the solar disc radius, such that the
solar disc radius equals 1. The lunar disc radius is denoted The expression for α follows from the geometrical consider-
by rm . The solar disc and lunar disc centres are denoted by ation of the solar and lunar discs, based on X, r, and rm :
Cs and Cm , respectively. Area rdα 0 dr is a differential area
element of a circular ring with radius r centred at Cs . If no α(r, X, rm ) =
eclipse occurs, the expression for the irradiance from the so-
0 if r ≤ |X − rm | and X > rm ,
lar disc, E0 , follows from the integration of I0 (Eq. 4) over π
h 2 2 2i if r ≤ |X − rm | and X ≤ rm ,
−1 r +X −rm
cos 2·r·X if r > |X − rm | and r ≤ X + rm ,
4 Geocentric Ephemeris for the Sun, Moon and Planets Cour-
0 if r > |X − rm | and r > X + rm .
tesy of Fred Espenak, http://www.astropixels.com/ephemeris/sun/
(8)
sun2019.html, last access: 3 September 2020.
https://doi.org/10.5194/acp-21-8593-2021 Atmos. Chem. Phys., 21, 8593–8614, 2021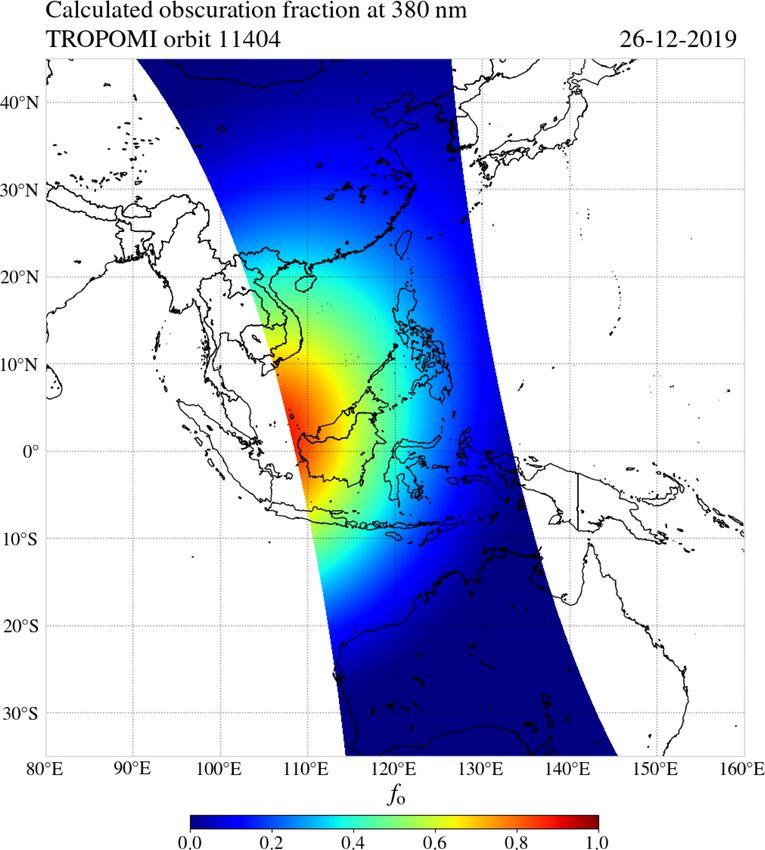
8598                                            V. Trees et al.: Restoring the top-of-atmosphere reflectance during solar eclipses

                                                                          Figure 7. The obscuration fraction fo as a function of Moon–Sun
                                                                          disc centre distance normalized to the solar disc radius, X, for wave-
                                                                          lengths ranging from 306 to 950 nm, using the limb darkening coef-
                                                                          ficients of Pierce and Slaughter (1977) and Pierce et al. (1977). The
                                                                          dashed line is the result without solar limb darkening taken into ac-
                                                                          count (0 = 1). The assumed value for rm is 0.97, corresponding to
                                                                          the instant of greatest eclipse during the annular solar eclipse on
                                                                          26 December 2019.

                                                                            The eclipse obscuration fraction is computed by combin-
                                                                          ing Eqs. (6) and (7):
Figure 6. Sketches of the lunar disc (centred at Cm ) occulting the                          R 1 α(r,X,rm )
solar disc (centred at Cs ) during an annular solar eclipse. Here, rm <                                       0(λ, r) · rdr
                                                                                              0      π
1, where rm is the radius of the lunar disc and the solar disc radius     fo (X, rm , λ) =        R1                          .             (9)
equals 1. X is the distance between Cm and Cs . For X < rm +1, the                                 0   0(λ, r) · rdr
lunar disc occults the solar disc. The eclipse obscuration fraction
fo increases with decreasing X. The annular phase occurs when
                                                                          Figure 7 shows fo as a function of X, for wavelengths rang-
X < 1 − rm (bottom sketch). Angle α is half the sector angle of the       ing from 306 to 950 nm, compared to the computations with-
solar disc occulted at distance r by the lunar disc.                      out limb darkening taken into account (0 = 1), for an as-
                                                                          sumed rm of 0.97 corresponding to the instant of greatest
                                                                          eclipse5 during the annular solar eclipse on 26 December
   Our expression for α slightly differs from the one of                  2019. The first point of contact occurs at X = 1 + rm = 1.97.
Koepke et al. (2001), who studied a total solar eclipse (rm ≥             As the disc centres move closer to each other, X decreases
1). Their expression is not valid during the annular phase                and fo increases. The differences with the results for 0 = 1
(X < 1−rm ) of an annular eclipse, where r can be larger than             are again most pronounced at the shortest wavelengths (see
X + rm while r > |X − rm | (see bottom sketch in Fig. 6), and             Fig. 5). During the starting phase of the eclipse, the Moon
therefore cannot be used to compute obscuration variations                occults the limb of the Sun and not taking into account so-
in the antumbra. Obscuration variations in the antumbra are               lar limb darkening results in a maximum overestimation of
most significant for annular eclipses with a relatively small             fo of 0.025 at 306 nm and X = 1.52. When the eclipse ap-
rm , for which the duration of the annular phase is relatively            proaches the annular phase, the Moon occults the centre
long. Equation (8) is valid in the umbra, penumbra, and an-               of the Sun, and not taking into account solar limb darken-
tumbra and thus can be used during all phases of any solar                ing results in a maximum underestimation of fo of 0.069
eclipse type.                                                             at 306 nm and X = 0.33. The annular phase occurs when
                                                                             5 The instant of greatest eclipse is the point in time when the
                                                                          shadow axis passes closest to Earth’s centre.

Atmos. Chem. Phys., 21, 8593–8614, 2021                                                       https://doi.org/10.5194/acp-21-8593-2021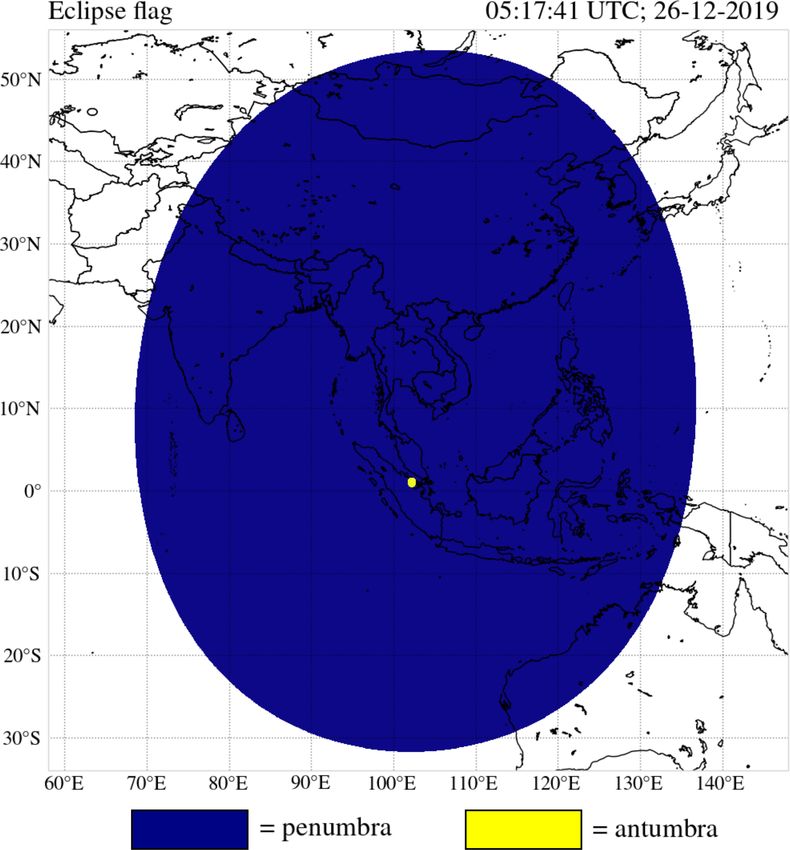
V. Trees et al.: Restoring the top-of-atmosphere reflectance during solar eclipses                                                8599

                                                                      surement time of a ground pixel at the Earth’s surface, i.e.

                                                                      X = X(δ, ϑ, h, t1 ),                                         (11)
                                                                      rm = rm (δ, ϑ, h, t1 ),                                      (12)

                                                                      where δ and ϑ are the ground pixel’s geodetic latitude and
                                                                      longitude, respectively, h is the height with respect to the
                                                                      Earth reference ellipsoid and t1 is the measurement time be-
                                                                      longing to the ground pixel. We transform δ, ϑ, and h to geo-
                                                                      centric coordinates in the so-called fundamental reference
                                                                      frame. The z axis of the fundamental reference frame is par-
                                                                      allel to the shadow axis, as illustrated in Fig. 8, which simpli-
                                                                      fies geometrical eclipse computations significantly. This idea
                                                                      was developed by Friedrich Wilhelm Bessel in the 19th cen-
                                                                      tury and has widely been employed to predict local circum-
                                                                      stances of solar eclipses (Chauvenet, 1863; Meeus, 1989;
                                                                      Seidelmann, 1992). Even in this era of digital computers it
                                                                      is the most powerful eclipse prediction technique6 . The ele-
                                                                      ments that define the orientation of the fundamental reference
                                                                      frame and the dimensions of the shadow are the so-called
Figure 8. Sketch of the fundamental reference frame (not to scale).   Besselian elements which are precomputed for every eclipse
The Moon shadow that is cast on the Earth’s surface has a com-        separately and published by NASA (Espenak and Meeus,
plicated shape, but the shadow on any plane parallel to the fun-      2006). For a certain value of z in the fundamental reference
damental plane (z = 0) has a circular shape, and the local eclipse    frame, the local eclipse circumstances solely depend on the
circumstances solely depend on the distance to the shadow axis.       ground pixel’s distance to the shadow axis. In Appendix A,
                                                                      we provide the recipe for the computation of X and rm from
                                                                      δ, ϑ, h, and t1 . We verified rm and the ground track of the
X < 1 − rm = 1 − 0.97 = 0.03. Note that, for total eclipses,          shadow axis (X = 0) on 26 December 2019 with the eclipse
totality would occur when X < rm − 1. The maximum ob-                 predictions by Fred Espenak, NASA/Goddard Space Flight
scuration for the ground-based observer, for a certain value          Center7 . The mean absolute differences between our results
of rm , is reached when the centres of the lunar disc and the         and the NASA results for rm , δ, and ϑ were 0.002, 0.015◦ ,
solar disc coincide (X = 0). From Eq. (8), we derive that if          and 0.089◦ , respectively.8
X = 0, α = π for 0 < r ≤ rm and α = 0 for r > rm . Given
rm , the maximum obscuration during an annular (rm < 1) or
                                                                      3   Results
a total (rm ≥ 1) eclipse is expressed by

                           R rm                                       Here, we present the results of our computations of the
                                   0(λ,r)·rdr
                       (
                           R0 1                 if   rm < 1,          eclipse obscuration fractions (Eq. 9) in the TROPOMI or-
fo (X = 0, rm , λ) =           0   0(λ,r)·rdr                  (10)   bits and the corresponding restored TOA reflectance spec-
                           1                    if   rm ≥ 1.          tra (Eq. 3) during the annular solar eclipses on 26 December
                                                                      2019 (Sect. 3.1) and 21 June 2020 (Sect. 3.2). With the re-
If 0 = 1, the maximum obscuration equals the area of the lu-          stored TOA reflectance spectra, we correct the UV absorb-
nar disc divided by the area of the solar disc: fo (X = 0) =          ing aerosol index (AAI) and analyse the results. We use the
πrm2 /π = 0.941 at the instant of greatest eclipse on 26 De-          example of 26 December 2019 to compare the calculated
cember 2019. At 306 nm, fo at X = 0 equals 0.982. Note that           obscuration fractions to the estimated obscuration fractions
fo for 0 = 1 is constant within the annular phase, while the          from observations in an uneclipsed orbit and to explain the
limb-darkened curves (coloured lines in Fig. 7) show varia-           AAI correction in detail. The example of 21 June 2020 is
tions in fo within the annular phase.
                                                                          6 For more details, see https://eclipse.gsfc.nasa.gov/SEcat5/
                                                                      beselm.html, last access: 13 August 2020.
2.4   Eclipse geometry                                                    7 See         https://eclipse.gsfc.nasa.gov/SEpath/SEpath2001/
                                                                      SE2019Dec26Apath.html, last access: 9 October 2020.
The lunar disc radius, rm , and the separation between the lu-            8 Fred Espenak rounded r to three decimal digits while our re-
                                                                                                    m
nar and solar disc, X, depend on the location on Earth with           sults were double precision numbers. The differences in δ and ϑ
respect to the position of the Moon and the Sun. X and rm             were of the order of magnitude 0.01◦ , which was the step size of
can be defined for each combination of location and mea-              the latitude–longitude grid that we used for this verification.

https://doi.org/10.5194/acp-21-8593-2021                                                Atmos. Chem. Phys., 21, 8593–8614, 2021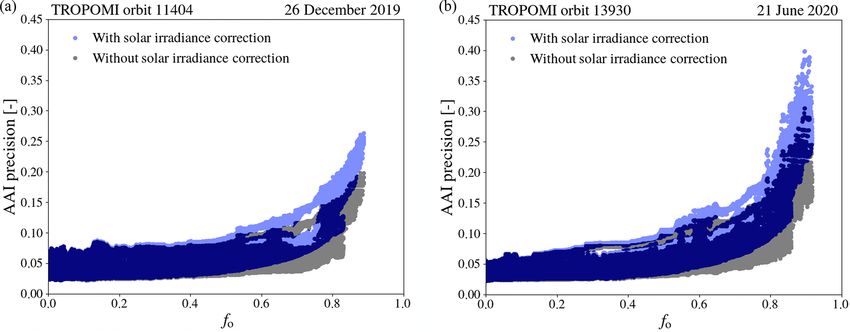
8600                                        V. Trees et al.: Restoring the top-of-atmosphere reflectance during solar eclipses

Figure 9. Moon shadow types at the instant of the greatest eclipse
during the annular solar eclipse on 26 December 2019.                Figure 10. The calculated eclipse obscuration fraction at 380 nm for
                                                                     the ground pixels in TROPOMI orbit 11 404.

discussed more qualitatively, in which we focus on the AAI
feature that we restore.                                             04:49:46 and 05:48:19 UTC. The left image in Fig. 11 shows
                                                                     the measured TOA reflectance (without solar irradiance cor-
3.1     Annular solar eclipse on 26 December 2019                    rection) at 380 nm on 26 December 2019, R380    meas , in three ad-

                                                                     jacent orbits over Southeast Asia. An apparent decrease in
On 26 December 2019, the Moon shadow during the annular                meas may be observed between 5◦ S and 25◦ N latitude, as
                                                                     R380
solar eclipse followed a path along parts of northeast Africa,       shown by the dark shade in orbit 11 404. Note that the bright-
Asia, and northwest Australia. Figure 9 shows the area on the        ening of the sky at larger viewing zenith angles, due to the
Earth’s surface that was located in the penumbra (in blue)           increase in multiple Rayleigh scattering, is also observed in
and in the antumbra (in yellow) at the instant of greatest           each orbit, manifesting itself as a subtle increase in R380    meas
eclipse, computed on a latitude–longitude grid with a step           toward the east and west edges of the swaths.
size of 0.05◦ . At the instant of greatest eclipse, the duration        Figure 10 shows fo at 380 nm that we calculated for
of the annular phase for a local observer at 1.0◦ N latitude         the ground pixels of the TROPOMI UVIS detector in or-
and 102.2◦ E longitude was 3 min and 40 s, while the com-            bit 11 404. The antumbra, in which fo at 380 nm peaks at
plete eclipse duration was 3 h, 51 min, and 13 s.9 We com-           0.976 (see Fig. 7), was not captured because the antumbra
pute that the penumbral shadow radius, perpendicular to the          was located slightly out of sight in the west. The maximum
shadow axis at the Earth’s surface, was 3537.3 km, while the         calculated fo for this orbit is 0.89 at 2.27◦ N latitude and
antumbral shadow radius, perpendicular to the shadow axis            108.12◦ E longitude. Figure 10 shows that the eclipse obscu-
at the Earth’s surface, was 53.7 km. The area in the antum-          ration in orbit 11 404 was not limited to the Gulf of Thai-
bra on the Earth’s surface was 0.02 % of the total area in the       land and the South China Sea: small obscuration fractions
shadow of the Moon (antumbra + penumbra) on the Earth’s              (0 < fo < 0.4) could be experienced in eastern China and the
surface.                                                             northwest coast of Australia.
                                                                        The right image in Fig. 11 shows the restored TOA re-
3.1.1    Restored TOA reflectance
                                                                     flectance at 380 nm, that is, after the correction for the eclipse
During the annular solar eclipse on 26 December 2019,                obscuration (Eq. 3) in orbit 11 404. The dark shade that could
TROPOMI measured the penumbra in orbit 11 404 between                be observed in the left image in Fig. 11, resulting from the
                                                                     decreased R380meas in the Moon shadow, has disappeared. The
  9 See                                                              appearance of the corrected R380 meas in orbit 11 404 is compa-
         https://eclipse.gsfc.nasa.gov/SEgoogle/SEgoogle2001/
SE2019Dec26Agoogle.html, last access: 9 September 2020.                                             meas
                                                                     rable to the appearance of R380 in orbits 11 403 and 11 405.

Atmos. Chem. Phys., 21, 8593–8614, 2021                                                 https://doi.org/10.5194/acp-21-8593-2021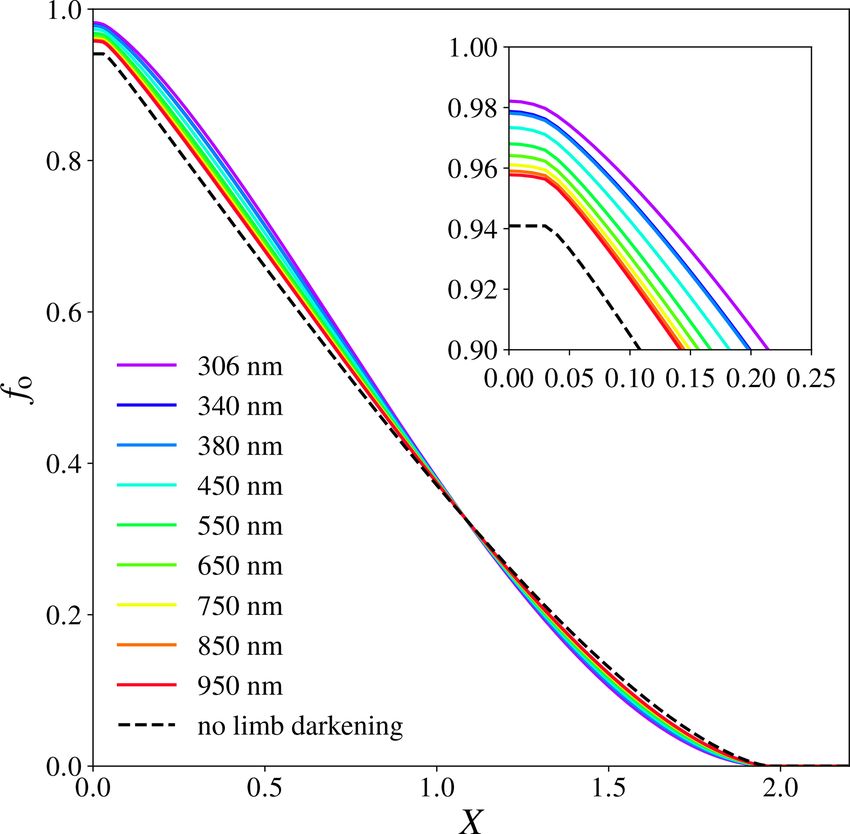
V. Trees et al.: Restoring the top-of-atmosphere reflectance during solar eclipses                                                      8601

Figure 11. The measured top-of-atmosphere reflectance at 380 nm by TROPOMI on 26 December 2019 at Southeast Asia in orbits 11 403–
11 405, uncorrected (a) and after the solar irradiance correction (b).

                                                                         To analyse the reflectance correction more quantitatively,
                                                                      Fig. 12 shows the average R380    meas per scan line10 in orbit

                                                                      11 404 against the mean latitude in the scan line (i.e. the av-
                                                                      erage of all pixel rows) and the corresponding average cal-
                                                                      culated fo at 380 nm. The dotted line represents R380  meas be-

                                                                      fore the solar irradiance correction, and the solid line repre-
                                                                              meas after the solar irradiance correction. The peak in
                                                                      sents R380
                                                                      both curves at 14◦ N is caused by the spiral cloud deck be-
                                                                      tween Vietnam and the Philippines, and the peak at 25◦ N
                                                                      latitude is caused by the cloud deck above southeast China
                                                                      (see Fig. 11). Before the solar irradiance correction, the low-
                                                                      est values are measured where fo is highest, between 3◦ S
                                                                      and 10◦ N latitude. After the solar irradiance correction, the
                                                                        meas curve is increased, but only at the latitudes where the
                                                                      R380
                                                                      Moon shadow resided.

                                                                      3.1.2   Comparison to the observed obscuration fraction

                                                                      The restored TOA reflectance during an eclipse that we
                                                                      showed in Sect. 3.1.1 can be considered the intrinsic re-
                                                                      flectance R int of the atmosphere–surface system, as ex-
                                                                      plained in Sect. 2.1. If the optical properties of the
Figure 12. The average solar irradiance corrected (solid line) and    atmosphere–surface system are not affected by the eclipse,
uncorrected (dotted line) measured top-of-atmosphere reflectance      Rint approximates the TOA reflectance as if there were no
at 380 nm by TROPOMI at 26 December 2019 in orbit 11 404 per
                                                                      eclipse. Consequently, the eclipse obscuration fo at 380 nm
scan line (top image), and the corresponding average calculated ob-
scuration fraction fo at 380 nm (bottom image).                          10 The line at the Earth’s surface perpendicular to the flight direc-
                                                                      tion defined by the satellite swath which is roughly oriented west–
                                                                      east.

https://doi.org/10.5194/acp-21-8593-2021                                                 Atmos. Chem. Phys., 21, 8593–8614, 2021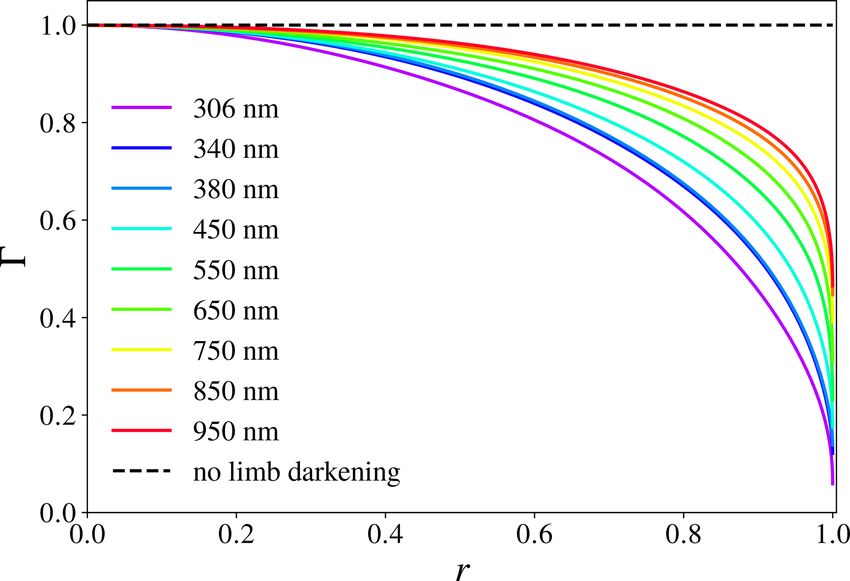
8602                                        V. Trees et al.: Restoring the top-of-atmosphere reflectance during solar eclipses

                                                                     Figure 14. The observed eclipse obscuration fraction by TROPOMI
                                                                     in orbit 11 404 on 26 December 2019 (grey diamond dots), com-
                                                                     pared to the calculated eclipse obscuration fraction at 380 nm in-
                                                                     cluding solar limb darkening (black solid line) and for 0 = 1 which
Figure 13. The observed eclipse obscuration fraction at 380 nm for   excludes solar limb darkening (black dashed line), per scan line in
the ground pixels in TROPOMI orbit 11 404 that passed the filters    pixel row 6.
described in Sect. 3.1.2.
                                                                       meas /R meas is expected to be approximately identical re-
                                                                     R340     380
can be estimated from the comparison of observations of              gardless of the eclipse conditions. Before estimating fo from
   meas inside and outside the Moon shadow and can be used
R380                                                                 observations, we therefore apply the filter
to verify the calculated fo at 380 nm from theory.                     meas              meas
   Orbit 11 403 (east of orbit 11 404) was not eclipsed and            R340                R340
                                                                         meas           −   meas             < 0.01.           (14)
preceded the eclipsed orbit 11 404. We compare each ground             R380                R380
                                                                                eclipse           no eclipse
pixel of orbit 11 404 to its equivalent in orbit 11 403, i.e. for
the same scan line and pixel row, such that differences in           Some cloudy pixels may pass the filter of Eq. (14), because
illumination and viewing geometry are negligible. That is,           clouds can alter the TOA reflectance spectra at both 340 and
we compute the observed fo at 380 nm as (see Eq. 3)                  380 nm. The cloud fraction product FRESCO (Koelemeijer
                            meas                                   et al., 2001; Wang et al., 2008) is available on the TROPOMI
                            R380 eclipse
fo (λ = 380 nm) ≈ 1 −  meas             ,                 (13)     UVIS grid but suffers from the eclipse. For this comparison,
                          R380 no eclipse                            we apply the simple cloud filter

where the label “eclipse” indicates orbit 11 404 and the label        meas           meas
                                                                     R340  · 0.95 > R380                                           (15)
“no eclipse” indicates orbit 11 403. We can compute Eq. (13)
for pixels that have a comparable atmosphere–surface sys-            to both orbits, which deletes the majority of the pixels with
tem. Therefore, we only compare ocean pixels, because, at            thick bright clouds. This filter is based on the fact that the
the latitudes where the eclipse was measured in orbit 11 404,        TOA reflectance over the cloud-free ocean generally de-
orbit 11 403 was mainly above the Pacific Ocean. Also, we            creases with increasing wavelength from 340 to 380 nm (see
only consider cloud-free pixels as the cloud types, and cloud        e.g. Tilstra et al., 2020, Fig. 1), while the presence of clouds
fractions in the two pixels will hardly be identical. In Fig. 7      may increase the TOA reflectance spectrum toward 380 nm.
we showed that the difference of fo between 340 and 380 nm              Figure 13 shows the observed fo at 380 nm, computed
is insignificant (the fo curves for 340 and 380 nm are virtu-        with Eq. (13), that passed the filters described in this section.
                                        meas /R meas should not
ally indistinguishable), so the ratio R340                           Note the good agreement with the calculated fo at 380 nm
                                                380
be affected by the eclipse for a constant atmosphere–surface         in Fig. 10. The missing values result mostly from land or
system. That is, if the atmosphere–surface system of the pixel       cloudy pixels in orbit 11 403 or 11 404. Between 0 and 10◦ N
in orbit 11 404 is approximately identical to the atmosphere–        latitude, at the very west side of the swath in orbit 11 404,
surface system of its equivalent pixel in orbit 11 403, the ratio    many pixels did not pass the filter of Eq. (14), which can be

Atmos. Chem. Phys., 21, 8593–8614, 2021                                                https://doi.org/10.5194/acp-21-8593-2021
V. Trees et al.: Restoring the top-of-atmosphere reflectance during solar eclipses 8603
3.1.3 Restored UV absorbing aerosol index
The AAI as derived by TROPOMI is computed from the ratio
of the measured reflectances at 340 and 380 nm and the ratio
of the modelled reflectances at those wavelengths, according
to (Herman et al., 1997; Torres et al., 1998)
" meas model #
R340 R340
AAI = −100 · log10 − log10 , (16)
R380 R380
where “meas” indicates the measured TOA reflectances and
“model” indicates the modelled TOA reflectances. The mod-
elled TOA reflectances are computed for a cloud-free and
aerosol-free atmosphere–surface model with the “Doubling-
Adding KNMI” (DAK) radiative transfer code (de Haan
et al., 1987; Stammes, 2001), version 3.1.1, taking into ac-
count single and multiple Rayleigh scattering and absorption
of sunlight by molecules in a pseudo-spherical atmosphere,
Figure 15. Similar to Fig. 14, but plotted against the disc centre including polarization. The Lambertian surface albedo As in
separation X. the model is assumed independent of wavelength λ and is
adjusted such that the model reflectance equals the measured
reflectance at 380 nm:
explained by the thin clouds that were present (see Fig. 11), model
R380 meas
(As ) = R380 . (17)
but also possibly by a difference in aerosol type and con-
centration or ocean colour with respect to the pixels in orbit The value of As that satisfies Eq. (17) is often referred to as
11 403. the “scene albedo” or the “Lambertian equivalent reflectance
Figure 14 shows the calculated fo at 380 nm (solid line) (LER)”. Because As is assumed wavelength independent,
and the observed fo at 380 nm (diamond dots) for pixel row it is also used to compute R340 model . More details about the
6 (out of 450, i.e. at the west side of the swath) and scan lines TROPOMI AAI algorithm can be found in Stein Zweers et al.
2000 to 3500. The dashed line is the calculated fo when so- (2018). For our solar eclipse application, it should be noted
lar limb darkening is not taken into account (0 = 1). Taking meas results in a smaller (spectrally flat) surface
that a lower R380
into account limb darkening in the calculation of fo results contribution in the model, which increases R340 model /R model
380
in a much better agreement with the observed fo at 380 nm. and increases the AAI.
This can also be concluded from Fig. 15, where we show The UV absorbing aerosol index (AAI) can be inter-
the calculated and observed fo at 380 nm for all pixels in preted as a comparison of the measured TOA reflectance UV
Fig. 13 plotted against the Moon–Sun disc centre distance colour to the TOA reflectance UV colour of a cloud-free and
normalized to the solar disc radius, X, computed for each of aerosol-free atmosphere–surface model. The AAI generally
those pixels.11 On the domain X < 0.5, the total mean ab- increases in the presence of absorbing aerosols and can, un-
solute difference between the observed and calculated fo at like the aerosol optical depth, also be computed when the
380 nm was 0.008, while the total mean absolute difference aerosol layer is above clouds. The AAI depends on various
between the observed and the calculated fo for 0 = 1 was parameters such as the aerosol optical depth (AOD), single-
0.053. The maximum underestimation of fo at 380 nm when scattering albedo (SSA), and aerosol layer height (ALH). For
using 0 = 1, with respect to fo at 380 nm when solar limb more details about the sensitivity of the AAI to atmosphere
darkening is taken into account, was 0.06 at 6.04◦ N latitude and surface parameters, we refer to Herman et al. (1997),
and 107.19◦ E longitude. Torres et al. (1998), de Graaf et al. (2005), Penning de Vries
et al. (2009), and Kooreman et al. (2020). In Appendix B we
11 The density of points increases with increasing X because the
provide an analysis of the precision of the AAI during the
solar eclipses studied in this paper.
Earth’s surface area for which a certain value of X applies increases
The left image in Fig. 16 shows the AAI measured by
with increasing X. Making the filter of Eq. (15) more strict (e.g.
meas · 0.75 > R meas ) decreases the scatter but also decreases the
R340
TROPOMI during the annular solar eclipse on 26 Decem-
380 ber 2019, in the three adjacent orbits over Southeast Asia
number of points. Another reason for the increasing scatter with in-
creasing X is that for low fo the compared pixels may have more considered in Sect. 3.1.1. We use a colour scale ranging
differences, resulting from natural variations, than caused by the ob- from AAI = −5 to AAI = 5. This range usually covers most
meas ]
scuration ([R380 meas aerosol events. Significantly elevated AAI values are mea-
eclipse /[R380 ]no eclipse in Eq. 13 and the impact
of its variations on fo are relatively large). sured at the location of the penumbra: in orbit 11 404,
https://doi.org/10.5194/acp-21-8593-2021 Atmos. Chem. Phys., 21, 8593–8614, 20218604 V. Trees et al.: Restoring the top-of-atmosphere reflectance during solar eclipses
Figure 16. The absorbing aerosol index from the 340 and 380 nm wavelength pair by TROPOMI on 26 December 2019 in Southeast Asia in
orbits 11 403–11 405, uncorrected (a) and after the solar irradiance correction (b).
most apparent between 20◦ S and 30◦ N latitude (see fo in was observed in the uncorrected AAI product has disap-
Fig. 10). The maximum AAI was 53.9 at 2.17◦ N latitude and peared. The mean of the corrected AAI in orbit 11 404 is
108.14◦ E longitude. The mean AAI in orbit 11 404 was 0.15. −1.58. At the location of the thick spiral cloud deck the
At the spiral cloud deck centred at 15◦ N latitude and 118◦ E AAI is closer to zero. We note that no significant absorbing
longitude, the AAI increase is less significant. Similarly, the aerosol events can be identified in Fig. 16. At 12◦ S latitude
clouds observed in Fig. 11 between 10◦ S and 0◦ N latitude, and 122◦ E longitude, an AAI increase is measured in the
and between 22 and 32◦ N, are located in the penumbra but corrected product, which could not be observed in the uncor-
show a less significant AAI increase. rected image. This feature is caused by the specular reflection
Outside the Moon shadow, in orbits 11 403 and 11 405, the off the sea surface, often called the sunglint (see also Fig. 11).
mean AAI is −1.52 and −1.48, respectively. At the locations The sunglint can also be observed in the middle of the swath
in orbit 11 404 where fo < 0.2, the mean AAI is also nega- of orbits 11 403 and 11 405, between 20 and 10◦ S latitude
tive (∼ −1.5). The negative mean AAI is partly caused by the and 34 and 5◦ S latitude, respectively. Kooreman et al. (2020)
scattering of light by cloud droplets, but also due to a radio- explain that, when a strongly anisotropic reflector such as the
metric calibration offset and degradation in the TROPOMI ir- sea surface is viewed from its reflective side, the AAI may
radiance data (Tilstra et al., 2020; Ludewig et al., 2020). The increase: the model assumes a Lambertian (isotropic reflect-
degradation in the irradiance leads to an increase in the de- ing) surface, which increases the relative importance of the
rived reflectance, decreasing the AAI values over time. The Rayleigh scattered light in the model and therefore computes
total AAI bias of ∼ −1.5 will be solved with the release of a higher R340 /R380 than is measured. From Eq. (16), it fol-
the version 2.0.0 TROPOMI level 1b processor, foreseen for lows that a deficit in the measured R340 /R380 results in an
the first half of 2021. The bias is expected to be independent increased AAI. Note that the shape and size of the apparent
of viewing geometry; hence, it will not affect the relative AAI sunglint may vary per orbit, as they depend on the roughness
values or the conclusions of this paper. of the sea surface (i.e. the wind speed), the presence of clouds
The right image in Fig. 16 is similar to the left image and aerosols, and the illumination and viewing geometries.
in Fig. 16, but then for the corrected AAI product. That In Fig. 17, we show the average R340 meas /R meas ,
380
is, in Eqs. (16) and (17), we replaced the measured TOA model model
R340 /R380 , As , and AAI of the pixels in the scan
reflectances, R340 meas and R meas , by the restored TOA re- lines of orbit 11 404, before the solar irradiance correction
380
int
flectances, R340 and R380int , which we computed with Eq. (3). (dotted line) and after the solar irradiance correction (solid
The red spot between 20◦ S and 30◦ N in orbit 11 404 that line). The average latitudes in the scan lines are also
Atmos. Chem. Phys., 21, 8593–8614, 2021 https://doi.org/10.5194/acp-21-8593-2021V. Trees et al.: Restoring the top-of-atmosphere reflectance during solar eclipses 8605
Figure 18. The AAI in pixel row 6 in orbit 11 404, 26 December
2019. The latitudes in the scan lines are indicated at the top. The
solid line is the result after the solar irradiance correction, and the
dotted line is the result after the solar irradiance correction when
solid limb darkening is not taken into account (0 = 1).
which is caused by the decrease in R380 meas by f (Fig. 12).
o
The maximum scan line average AAI is 10.7 in scan line
2672 (see bottom graph in Fig. 17). After the solar irradiance
correction, the AAI increase in the Moon shadow disap-
peared because R340 model /R model follows an approximately
380
meas /R meas , albeit with an offset ranging
similar pattern to R340 380
from −0.03 to −0.06, which was also observed outside the
Moon shadow. We conclude that the increased AAI between
20◦ S and 30◦ N latitude in orbit 11 404 before the solar
irradiance correction was caused by the relatively low As
used in the model due to the reduction of the measured
reflectance at 380 nm, rather than a UV colour change of the
measured TOA reflectance in the Moon shadow.
Figure 18 shows the AAI in the scan lines of orbit 11 404,
Figure 17. The scan line averages of (from top to bottom)
meas /R meas , R model /R model , A , and AAI in orbit 11 404, 26 De- but only for pixel row 6 (see Fig. 14). The solid line is
R340 380 340 380 s
the eclipse-corrected AAI and the dotted line is the eclipse-
cember 2019. The average latitudes in the scan lines are indicated
at the top. The dotted lines are the results before the solar irradi- corrected AAI but without taking into account limb darken-
ance correction, and the solid lines are the results after the solar ing (0 = 1). If solar limb darkening is not taken into account,
irradiance correction. The lines for the uncorrected and corrected the corrected AAI still shows an apparent increase between
meas /R meas overlap.
R340 380
14.9◦ S and 21.6◦ N latitude, with a maximum of AAI = 4.3
at 3.37◦ N latitude. Note that these are the latitudes at which
the fo was underestimated if 0 = 1 as we showed in Fig. 14,
caused by the Moon occulting different parts of the solar disc
shown. The fraction R340 meas /R meas is not affected by the during the eclipse (see Sect. 2.3). In line with the discus-
380
solar irradiance correction, which is expected from the sion of the previous paragraph, an underestimation of fo at
wavelength independence of fo between 340 and 380 nm 380 nm results, after the solar irradiance correction, in too
(see Fig. 7). Here, we did not detect signatures of sky colour meas and A , in too high R model /R model and, therefore,
low R380 s 340 380
changes in the measured UV reflectance due to secondary in too high AAI. We find a maximum overestimation of the
effects such as horizontally travelled light (see Sect. 4 for a AAI of 6.7 points in scan line 2671 and pixel row 4 when
detailed discussion). Before the solar irradiance correction, using 0 = 1. It can be concluded that not taking into ac-
model /R model is significantly higher than R meas /R meas
R340 count solar limb darkening would still result in a “red spot”
380 340 380
between 20◦ S and 30◦ N where the Moon shadow resided, anomaly in the AAI map. The opposite effect occurs at the
which increases the AAI. The high R340 model /R model is caused latitudes where fo was overestimated if 0 = 1 in Fig. 14:
380
by the relatively low As in the Moon shadow (Fig. 17), south from 14.9◦ S and north from 21.6◦ N latitude, the AAI
https://doi.org/10.5194/acp-21-8593-2021 Atmos. Chem. Phys., 21, 8593–8614, 20218606 V. Trees et al.: Restoring the top-of-atmosphere reflectance during solar eclipses
after the correction without limb darkening is slightly lower Global Ozone Monitoring Experiment-2 (GOME-2) instru-
than the AAI after the correction where limb darkening was ment on board the Metop-C satellite (referred to as “GOME-
taken into account. We conclude that, if the artificial Moon 2C” in what follows). Figure 21 shows the AAI measured
shadow signatures are to be removed in the corrected AAI by GOME-2C on 21 June 2020 in orbits 8411 to 8415 in
product, solar limb darkening cannot be neglected. the Middle East and western Asia, from the polarization
measurement detectors (PMDs) using λ = 338 nm and λ =
3.2 Annular solar eclipse on 21 June 2020 381 nm for the AAI retrieval (see Tuinder et al., 2019). In or-
der to show the eclipse location during the GOME-2C mea-
On 21 June 2020, the Moon shadow during an annular solar surements, we did not apply the solar irradiance correction to
eclipse could be experienced in the majority of Africa (from the GOME-2C data. Figure 21 shows that two GOME-2C or-
South Africa to Libya) and almost all parts of Asia. At the bits were affected by the eclipse: significantly elevated AAI
instant of greatest eclipse, rm was 0.994 and the duration of were measured in the shadow of the Moon in orbits 8413 and
the annular phase for a local observer at 30.5◦ N latitude and 8414. The location 36–42◦ N latitude and 78–86◦ E longitude
80.0◦ E longitude was 38 s, while the complete eclipse dura- was not eclipsed during the measurements of GOME-2C. In-
tion was 3 h, 26 min, and 53 s.12 We compute that the penum- deed, GOME-2C also measured an AAI increase of ∼ 1.5
bral shadow radius, perpendicular to the shadow axis at the points in this same area in northwest China. At this location,
Earth’s surface, was 3493.9 km, while the antumbral shadow the Taklamakan Desert is located. The Taklamakan Desert is
radius, perpendicular to the shadow axis at the Earth’s sur- the largest desert in China, about 960 km long and 420 km
face, was 10.5 km. The area in the antumbra on the Earth’s wide, and consists mostly of shifting sand dunes that reach
surface was 0.0008 % of the total area in the shadow of the elevations of 800 to 1500 m a.s.l. (Petrov and Alitto, 2019). It
Moon (antumbra + penumbra) on the Earth’s surface. is an important source for the global atmospheric dust budget
Figure 19 shows R380 meas by TROPOMI on 21 June 2020
and for dust storms in eastern Asia (Hu et al., 2020). Hence,
over Asia, before the solar irradiance correction (left image) we attribute this ∼ 1.5 point increase to the desert surface
and after the solar irradiance correction (right image). The and, possibly, desert dust aerosol.
shadow of the Moon was captured in orbit 13 930, as shown
meas between 10 and 55◦ N lat-
by the apparent decrease in R380
itude. Only the penumbra was captured. The antumbra was
located out of sight in the west of orbit 13 930. The maxi- 4 Discussion
mum calculated fo at 380 nm was 0.92 at 31.94◦ N latitude
and 82.51◦ E longitude. The eclipse obscuration theory provided in Sect. 2.3 applies
The left image in Fig. 20 shows the TROPOMI AAI in or- to any phase of any solar eclipse type. The TROPOMI or-
bits 13 929 to 13 931 over Asia, before the solar irradiance bits during the annular solar eclipses analysed in this paper
correction. Before the solar irradiance correction, the AAI did not capture the antumbra. The maximum fo at 380 nm
is significantly increased in the shadow of the Moon. The calculated in the TROPOMI orbits was 0.89 and 0.92 on
edge of the red spot in the uncorrected AAI in orbit 13 930 26 December 2019 and 21 June 2020, respectively, while
is shaped by the local cloudiness. For example, the AAI > 2 the annular phase for these eclipses at 380 nm occurred for
signature in Western Mongolia (40–50◦ N latitude and 90– fo > 0.976 and fo > 0.997, respectively. In this section, we
110◦ E longitude) is spatially correlated with low cloud frac- reflect back on the assumptions we made and we discuss
tion area. Note that this suppression of the eclipse anomaly some points of attention for potential future applications of
by clouds in the AAI product was also observed at the cloudy the solar irradiance correction to measurements closer to the
areas in the shadow of the Moon on 21 December 2019 (left (ant)umbra, and/or in the antumbra.
image of Fig. 16). In this paper, we assumed that the solar irradiance is ran-
The right image in Fig. 20 is similar to the left image domly polarized. Sunlight scattered in the Sun’s atmosphere
in Fig. 20, but after the solar irradiance correction. The red may become polarized. This linearly polarized spectrum is
spot between 10 and 55◦ N latitude in orbit 13 930 that was also known as the “second solar spectrum”, and its signifi-
observed in the uncorrected AAI product has disappeared. cance increases towards the solar limb (Stenflo and Keller,
In northwest China, a region of relatively high AAI values 1997). If there is no eclipse, this polarization cancels out due
appears in the corrected product: at 36–42◦ N latitude and to the symmetry, and only very small linear degrees of polar-
78–86◦ E longitude, the AAI is increased by ∼ 1.5 points. ization of the disc-integrated sunlight can be measured (on
Note that this AAI change is larger than the maximum stan- the order of 10−6 ; see Kemp et al., 1987, who attributed this
dard AAI error in orbit 13 930 of 0.40 (see Appendix B). polarization in their ground-based observations to multiple
We verify this AAI feature using AAI measurements of the scattering in the Earth’s atmosphere). During an eclipse, the
symmetry is broken; however, measurements show that a few
12 See https://eclipse.gsfc.nasa.gov/SEgoogle/SEgoogle2001/ arcseconds inside the solar limb the degree of polarization is
SE2020Jun21Agoogle.html, last access: 28 September 2020. lower than 0.01 and in most cases less than 0.001 (Stenflo,
Atmos. Chem. Phys., 21, 8593–8614, 2021 https://doi.org/10.5194/acp-21-8593-2021You can also read