CD4+ T cells from children with active juvenile idiopathic arthritis show altered chromatin features associated with transcriptional abnormalities
←
→
Page content transcription
If your browser does not render page correctly, please read the page content below
www.nature.com/scientificreports
OPEN CD4+ T cells from children
with active juvenile idiopathic
arthritis show altered
chromatin features associated
with transcriptional abnormalities
Evan Tarbell1,3,5,7, Kaiyu Jiang2,7, Teresa R. Hennon2, Lucy Holmes2, Sonja Williams2, Yao Fu4,
Patrick M. Gaffney4, Tao Liu1,3,6 & James N. Jarvis2,3*
Juvenile idiopathic arthritis (JIA) is one of the most common chronic diseases in children. While clinical
outcomes for patients with juvenile JIA have improved, the underlying biology of the disease and
mechanisms underlying therapeutic response/non-response are poorly understood. We have shown
that active JIA is associated with distinct transcriptional abnormalities, and that the attainment of
remission is associated with reorganization of transcriptional networks. In this study, we used a multi-
omics approach to identify mechanisms driving the transcriptional abnormalities in peripheral blood
CD4+ T cells of children with active JIA. We demonstrate that active JIA is associated with alterations in
CD4+ T cell chromatin, as assessed by ATACseq studies. However, 3D chromatin architecture, assessed
by HiChIP and simultaneous mapping of CTCF anchors of chromatin loops, reveals that normal 3D
chromatin architecture is largely preserved. Overlapping CTCF binding, ATACseq, and RNAseq data
with known JIA genetic risk loci demonstrated the presence of genetic influences on the observed
transcriptional abnormalities and identified candidate target genes. These studies demonstrate the
utility of multi-omics approaches for unraveling important questions regarding the pathobiology of
autoimmune diseases.
Juvenile idiopathic arthritis (JIA) is a broad term that describes a clinically heterogeneous group of diseases
characterized by chronic synovial hypertrophy and inflammation, with onset before 16 years of a ge1. JIA there-
fore represents an exclusion diagnosis that encompasses all forms of chronic childhood arthritis of an unknown
cause. The reported prevalence of the disease is between 16 and 150 per 100,000 in the developed world, making
it the most common rheumatic disease of childhood and one of the most common chronic illnesses in children2.
The causes of JIA are poorly understood, but both genetic and environmental factors are thought to play a
role. A genetic component has been inferred from twin and affected sibling studies where concordance between
monozygotic twins is between 25 and 40%3,4, and from numerous genome-wide association studies that demon-
strate more than 40 regions associated with JIA 5–9. Like many complex diseases, many of the identified genetic
variants that are associated with JIA are found outside of protein coding regions 8,10. It is possible that these
variants alter the function of genomic regulatory elements, such as enhancers and promoters, which control
gene expression and may contribute to disease initiation and progression. Our group has identified numerous
transcriptional differences between JIA patients with active disease, those in clinical remission, and healthy
controls in whole blood samples, peripheral blood mononuclear cells and neutrophils 11–15. In order to under-
stand JIA pathogenesis, we believe that it is necessary to understand the events that lead to the transcriptomic
alterations observed in children with JIA.
1
Department of Biochemistry, University at Buffalo Jacobs School of Medicine and Biomedical Sciences, Buffalo,
NY, USA. 2Department of Pediatrics, University at Buffalo Jacobs School of Medicine and Biomedical Sciences,
Buffalo, NY, USA. 3Genetics, Genomics, and Bioinformatics Program, University at Buffalo Jacobs School of
Medicine and Biomedical Sciences, Buffalo, NY, USA. 4Genes and Human Disease Research Program, Oklahoma
Medical Research Foundation, Oklahoma City, OK, USA. 5Enhanced Pharmacodynamics LLC, Buffalo, NY,
USA. 6Department of Biostatistics and Bioinformatics, Roswell Park Comprehensive Cancer Center, Buffalo, NY,
USA. 7These authors contributed equally: Evan Tarbell and Kaiyu Jiang. *email: jamesjar@buffalo.edu
Scientific Reports | (2021) 11:4011 | https://doi.org/10.1038/s41598-021-82989-5 1
Vol.:(0123456789)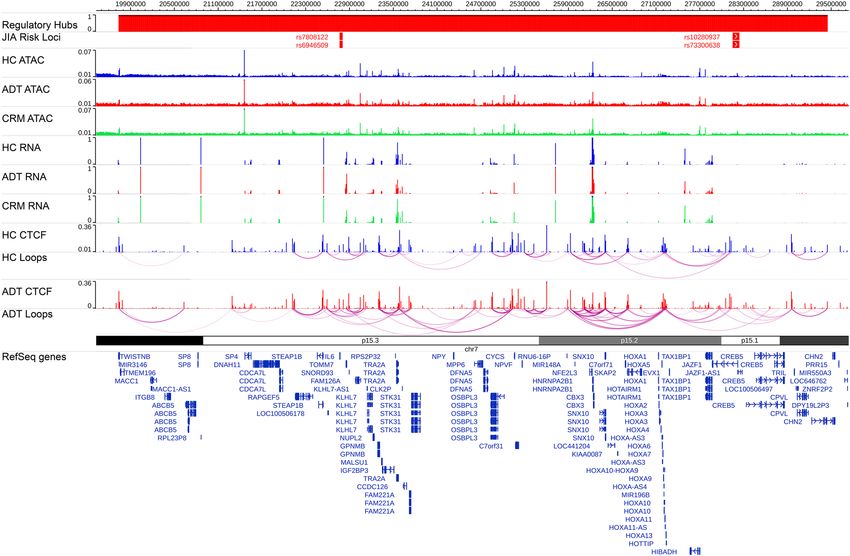
www.nature.com/scientificreports/
The control of transcription is a tightly choreographed process involving numerous cis- and trans- acting
factors. Modifications to histone proteins may facilitate the recruitment of nucleosome remodeling complexes,
which then evict nucleosomes and lead to remodeled c hromatin16. Accessible chromatin can then be bound by
sequence-specific transcription factors, which recruit co-factors, and mediate the three dimensional looping of
DNA to bring distal regulatory elements into close physical contact with proximal promoters 16–18.
The CCCTC-binding factor (CTCF) is a sequence specific DNA binding factor, known for its role in estab-
lishing and maintaining long-range, three-dimensional chromatin interactions19. It was first categorized as an
insulating factor, capable of preventing the interaction between enhancers and promoters in reporter constructs.
More recently, CTCF has been shown to help establish topologically associated domains (TADs) and is involved
in mediating promoter-enhancer interactions 20. Moreover, differential CTCF binding and the resulting differ-
ences in three-dimensional chromatin architecture have been implicated in disease pathogenesis for asthma and
chemically induced c ancers21–23.
Recent work has added an additional layer of complexity to transcriptional control. Transcriptional activa-
tion appears to occur within nuclear condensates, which contain high concentrations of transcription factors,
co-factors and the general transcriptional machinery24–28. Moreover, single cell chromatin conformation capture
studies have shown that one promoter or enhancer may interact simultaneously with multiple other promoters
and enhancers29,30. These data suggest that multiple regulatory elements physically interact with each other in a
hub-like complex, surrounded by high concentrations of transcription factors and transcriptional machinery 31.
Results
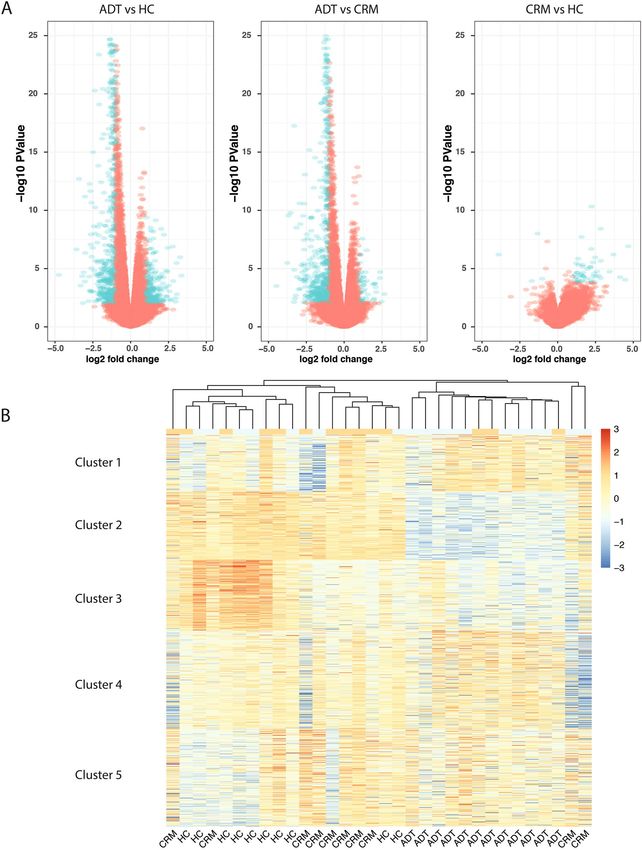
Widespread transcriptional changes in active disease and restoration with remission. We per-
formed RNA-seq on a cohort of 32 patients and healthy controls. This was a cross-sectional study that included
12 patients with active designated as having “active disease, treated” (ADT), 10 patients, who met the definition
of clinical remission on medication (CRM) 32–34, and 10 healthy controls (HC) (See “Methods”). We identified
19,691 genes that were expressed in any group (See methods). We performed differential gene expression analy-
sis on every pair of groups, identifying 693 genes that were differentially expressed in peripheral blood CD4+ T
cells between ADT and HC (Supp. Table 1), 533 genes that demonstrated expression differences between ADT
and CRM (Supp. Table 2), and 52 genes that were expressed differently between HC and CRM (Fig. 1A, Supp.
Table 3). Of interest was the small number of genes that reached a threshold for differential expression between
HC and CRM. We have previously noted that the attainment of clinical remission did not result in normalization
of neutrophil transcriptomes 11–15. In the CD4+ T-cells examined here, there was considerable normalization
between healthy controls and patients in remission. The pattern of differential expression between ADT and
CRM or between ADT and HC was very similar, with most of the genes identified as up-regulated in the ADT
group.
`We plotted all differentially expressed genes called between any pair of sample groups and used k-means
clustering on the normalized expression values to group the genes into different gene clusters (Fig. 1B, Supp.
Table 4). We also performed hierarchical clustering of the gene profiles of the individual samples. We find, as
expected based on the differential analysis, that the CRM and HC groups clustered together and discretely from
the ADT group. The gene clusters grouped into 5 distinct subgroups, representing different cellular functions
(Supp. Table 5). Cluster 1, which was characterized by increased expression in ADT compared to HC, is involved
in translation, indicating that in the active disease state, CD4+ T-cells are more active in their transcriptional
and translational processes. Cluster 2, representing genes that were identified as showing lower expression in
the ADT group compared the HC and CRM groups, were enriched for genes involved in signaling and response
to stimuli. Cluster 3, which is characterized by higher expression in HC samples compared to either CRM or
ADT samples, is enriched for genes involved in protein targeting and transport. Cluster 4, characterized by lower
expression in HC compared to ADT and CRM, is enriched for genes involved in immune activation. Cluster 5
contained genes that showed a wide variety of expression patterns across the samples but show a general increase
in expression in the ADT samples compared to the CRM and HC samples; this cluster is represented by genes
involved in chromatin organization and silencing.
Widespread differences in chromatin accessibility in active disease and remission
Having identified differentially expressed genes between the three conditions, we next sought to understand
how the regulatory networks were perturbed and contributed to the differences in transcription. We performed
the assay for transposase-accessible chromatin with sequencing 35 (ATAC-seq) on 6 HC, 5 ADT samples and
5 CRM samples, all of which were included in the RNAseq samples studied for gene expression. We identified
108,596 consistent peaks in our HC samples, 223941consistent peaks in our ADT samples and 103,612 consist-
ent peaks in our CRM samples (Fig. 2A; see “Methods”). Of these, 45,911 peaks were shared by all three groups,
indicating a significant level of chromatin reorganization associated with disease status. This data supports the
transcriptomic data, in that there are significant differences in the expression and regulation of genes between
JIA patients and healthy children. We also found considerable differences in the genomic accessibility of CRM
patients versus healthy controls, indicating a high level of chromatin reorganization in remission despite modest
changes in gene expression.
Genetic variation in CTCF binding sites affects transcription of adjacent genes but does
not seem crucial for the differences in expression data in active disease and healthy con-
trols. CTCF is a critical genomic architectural protein that, with the aid of cofactors such as the cohesion
complex, acts to mediate long-range chromatin interactions. These interactions are important for the establish-
ment of regulatory domain boundaries, for mediating promoter-enhancer interactions, and the in the formation
Scientific Reports | (2021) 11:4011 | https://doi.org/10.1038/s41598-021-82989-5 2
Vol:.(1234567890)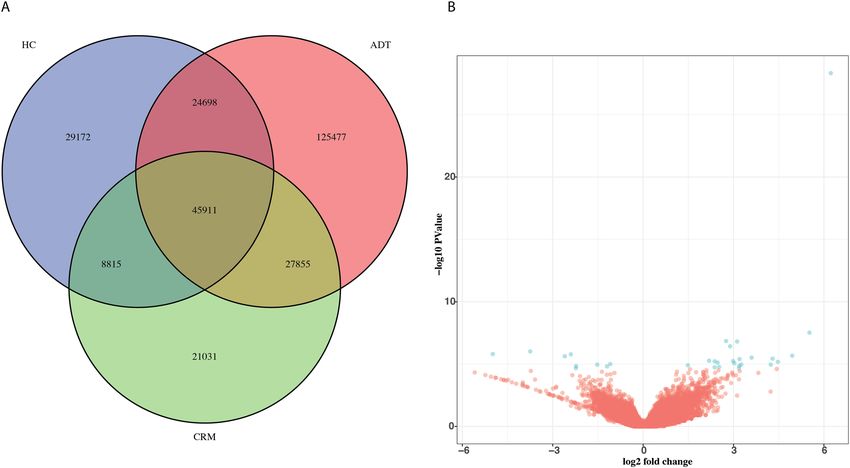
www.nature.com/scientificreports/
of insulator elements 20. There is also evidence that altered CTCF binding contributes to human disease 21–23.
We hypothesized that differential CTCF binding, and the perturbed three-dimensional architecture that would
result, may contribute to the transcriptional changes that we observed in the active disease. To test this hypoth-
esis, we performed CTCF ChIP-seq on 10 patients not included in the first ATACseq and RNAseq studies. These
included five ADT patients and 5 healthy controls. To directly investigate the three dimensional topology that
is mediated by CTCF, we performed CTCF HiChIP on 6 participants, including 3 ADT patients and 3 healthy
controls, of which one participant in each group was included in the CTCF ChIP-seq s tudies36. Using D iffBind37
to identify differential binding events, we identified 31 differentially bound CTCF sites using a threshold of
FDR ≤ 0.05 and log10(fold-change) > = 1 (Fig. 2B, Supp. Table 7). Moreover, none of these sites were located in
the LD blocks around JIA associated variants 9.
We further characterized two of the differentially bound CTCF sites, whose log10(counts per million) > 5 and
whose log10(fold-change) was > 4 (Supp. Table 7). Using HiChIP, we characterized a statistically significant gain
of binding event, located in the intergenic region between the promoters of LCOR and PIK3AP1 on chromo-
some 10 (Supp. Figure 1A), where CTCF binding occurred in some of the ADT group and not in the HC group.
The site showed binding of CTCF in three out of the five ADT samples and none of the healthy controls (Supp.
Figure 1B). The loops that were anchored on this site in the ADT patients interacted with several differentially
expressed genes (Supp. Figure 1C). To determine whether genetic variations may be driving the binding differ-
ences observed between the conditions, we performed Sanger s equencing38,39 on all samples across the identi-
fied locus. We found that all three ADT samples that had CTCF binding at the locus had a C allele at position
chr10:98549577, whereas every sample that did not show CTCF binding, including all 5 HC samples and 2 of
the 5 ADT samples, had the reference T allele at that location (Supp. Figure 1B). The gain of binding allele has
been previously annotated as rs7477274. These data indicate that CTCF binding at this site is driven primarily
by genetic variation.
We next identified a loss of binding event located in the promoter region of RNF135 on chromosome 17
(Supp. Figure 2A). The loops that are anchored on this site in healthy samples interact with the promoter regions
of the differentially expressed genes (Supp. Figure 2C) and non-differentially expressed genes. The three HC
samples that have CTCF binding at this site have a G allele at position chr17: 29297397, annotated as rs7221217
(Supp. Figure 2B), which was confirmed through Sanger sequencing. Of the three samples with CTCF binding,
two were homozygous and one was heterozygous (Supp. Figure 2B). The two HC samples without binding at
this site, as well as all five ADT samples that have no CTCF binding, were all homozygous with the reference A
allele (Supp. Figure 2B). This data indicates this loss of binding is mediated by genetic variation.
Overall, this data shows that differential CTCF binding and altered three-dimensional interactions occur and
are associated with genetic variants and with differentially expressed genes. However, the rarity of the events and
the fact that none occur in known JIA risk loci indicate it is unlikely to be a driving mechanism of transcriptional
aberrations in in CD4+ T-cells in JIA.
Identifying interaction domains with CTCF ChIP‑seq and HiChIP
Our profiling of the CD4+ T cell genome has yielded several features not previously recognized. We observed
widespread transcriptional differences in CD4+ T cells in the comparison between active JIA and healthy controls,
widespread changes in chromatin accessibility between all three conditions. We did not observe widespread
changes in CTCF binding and, therefore, in the three dimensional structure of the genome. We thus hypoth-
esize that due to the lack of three dimensional interaction differences, the variability in gene expression patterns
must be a function of the variability in the activity of regulatory elements. However, due to the small expression
changes observed between healthy controls and patients in remission and the widespread changes in accessibility
between those groups, we further hypothesize that only a small fraction of the regulatory variability accounts
for the differences in expression. We therefore focused next on previously identified JIA risk loci and employed
a novel method based on emerging models of gene regulation to identify the regulatory elements and genes
driving the observed genomic differences.
Recent studies, as noted previously, have suggested that transcription occurs within “regulatory hubs”, con-
taining high concentrations of transcriptional machinery, and multiple genomic regions that physically inter-
act with each o ther24–31. Additional studies have shown that genomic regulatory regions could simultaneously
interact with numerous other elements and gene r egions29–31. . Our data identify multiple regions connected to
one another through chains of CTCF-mediated loops (Fig. 3). These observations challenge the paradigm that
transcriptomic regulation is mediated exclusively by differential three-dimensional contacts31. Instead, numerous
regulatory elements and gene promoters interact together in regulatory hubs, with intra-hub regulation occur-
ring through a mechanism other than simple physical proximity. With this concept in mind, we attempted to
understand transcriptomic regulation by modeling the expression of a gene as a function of the accessibility of
all regulatory elements that physically interacted with the gene promoter and used feature selection to identify
elements contributing to variability in the gene’s expression (see methods).
Genome-wide association studies (GWAS) and genetic fine mapping studies have identified at least 46 genetic
loci that are associated or suggestively associated with JIA7,40. Linkage disequilibrium blocks, genomic regions
with highly correlated patterns of genetic heritability, are enriched for histone marks associated with regulatory
activity 9. We found that 33 out of 46 of LD blocks around previously identified JIA genetic risk loci7,9,40 had
regulatory elements and CTCF loop anchors located within them (Fig. 3). This indicates that some of the genetic
risk for JIA may act by affecting CD4+ T-cell function.
Starting with the 33 JIA risk loci that contained CTCF loop anchors, we identified the regulatory hubs of
which they were a part (Fig. 3) and predicted which regulatory elements controlled the gene’s expression (see
“Methods”). We then considered any regulatory element that was within the JIA associated LD block as a putative
Scientific Reports | (2021) 11:4011 | https://doi.org/10.1038/s41598-021-82989-5 3
Vol.:(0123456789)www.nature.com/scientificreports/
casual element, and that any genes that were predicted to be controlled by that element as putative target genes for
the JIA risk locus (Table 1). The total set of predicted target genes showed strong enrichment for gene ontology
(GO) terms such as antigen presentation and T cell regulation and proliferation, while differentially expressed
predicted target genes showed enrichment for cell signaling and gene regulation pathways (Supp.Tables 2–3).
This enrichment for immune system pathways supports our predictions for JIA target genes. We believe that these
putative targets and casual elements represent a starting point for understanding the genomic pathogenesis of JIA.
Discussion
In this study, we observed widespread changes in gene expression profiles and chromatin accessibility in CD4+ T
cells of patients with active JIA when we compared them to those of healthy controls. These differences reveal
several important features of JIA. The first is that the transcriptional abnormalities that are observed in other
cell types, such as neutrophils 11,14, PBMCs41 and whole blood samples 15 are present within the CD4+ T cell
compartment. It is likely that the abnormalities reflect differences within similar cell populations between disease
states, as opposed to differences in the proportions of naïve, memory or regulatory T cell subtypes, as evidenced
by recent work showing little change in cell subtype ratios between patients with JIA and controls42,43. Second,
the transcriptional differences reflect activation of peripheral blood immune components, which implicates
a global immune dysfunction, as opposed to an isolated process involving the joints or resident lymphocytes
within the s ynovium44.
We have shown that the CD4+ T cells of children with JIA display a three dimensional genomic architecture
that is similar to that in healthy children. Alterations in CTCF binding, and the corresponding changes in loop
structures, are observed and are associated with genetic variants, but are rare events that are not associated with
any known JIA genetic risk locus. These findings, combined with the widespread changes in chromatin acces-
sibility that we observed, point to a mechanism where disrupted regulatory elements may drive gene expression
changes, rather than a rewiring of the three dimensional genome.
These features pose a critical question to our understanding of JIA: does this activation of peripheral immune
cells simply reflect the brisk inflammatory milieu of the synovial tissues or is it an intrinsic immune dysfunc-
tion? Recently, researchers have observed an enhanced IFNγ signaling phenotype in the CD4+ T cells of active
JIA patients 43, suggesting that an intrinsic dysfunction is occurring. We provide further evidence of an intrinsic
dysfunction by showing that more than half of JIA associated genetic risk LD blocks contain T-cell specific
regulatory elements that physically interact with other regulatory elements and gene promoters. Leveraging this
feature allowed for the prediction of numerous putative target genes, which may have pathogenic roles in JIA.
One of the surprising findings from this work was the relative normalization in expression patterns that we
observed in CD4+ T cells from patients who have achieved clinical remission while on MTX and etanercept.
This stands in contrast to what we have observed in other cell populations, especially neutrophils 41. This leads
us to an interesting hypothesis concerning CD4+ T-cells in JIA and their role in the disease. We hypothesize
that CD4+ T-cells are “primed” for a hyper-inflammatory response, due to the effect of genetic variations on the
expression of our predicted target genes. When CD4+ T-cells interact with another cell type or with molecules
secreted by other cells, they initiate an inflammatory response, which progresses unchecked to an elevated level.
We hypothesize that pharmacological intervention acts by disrupting the extracellular signaling, returning the
CD4+ T-cells to a resting, but “primed” state, while other cell types remain altered.
We recognize that the present study has several limitations. The first is the fact that this is a cross-sectional
study and therefore it is not known whether the differences in chromatin organization that we observed change
through the course of disease progression or through treatment response. Another limitation of this study is the
small number of patients and the fact that the same assays were not performed on every subject. These limita-
tions largely reflect the constraints of undertaking translational studies in a pediatric population. Given the
limited sample volumes that can be obtained from children, investigators are limited in the number of studies
that can be performed on any individual patient sample. We are sanguine, however, that continued technologic
advances will allow us to perform more complex studies on larger groups of patients in the near future. However,
the validity of our approach is shown in the fact that that datasets from one group of participants corroborated
the inferences made with an independent set of participants.
Methods
Patients and patient samples. Patients were recruited from the pediatric rheumatology clinic at the
Women & Children’s Hospital of Buffalo. All children fit criteria for polyarticular-onset, rheumatoid factor-
negative JIA as established by the International League Against Rheumatism (ILAR) 45. Patients included 18
girls and 4 boys who ranged in age from 4 to 16 years. Children with JIA were classified as having active disease
on therapy (ADT) or clinical remission on medication (CRM) as determined by standard criteria 32–34. Children
with JIA were all taking combinations of methotrexate and the TNF inhibitor, etanercept. Samples were obtained
from children classified as ADT within 6 weeks after initiating therapy. All children classified as ADT had at least
4 warm, swollen joints. Samples obtained from children with CRM were obtained at the first clinic visit at which
CRM status was confirmed, typically 12–15 months after the initial diagnosis.
Healthy control (HC) children (n = 10) were recruited from the Hodge General Pediatrics Clinic of the
University at Buffalo Jacobs School of Medicine and Biomedical Sciences and ranged in age from 5 to 16 years
and included two boys and eight girls. Children were excluded if they had fever ≥ 38 °C within the previous
48 h, had another autoimmune disease (e.g., type 1 diabetes), or were taking either systemic glucocorticoids or
antibiotics for any reason.
University at Buffalo IRB approval was obtained for this study, and informed consent documents exe-
cuted with the parents of all patients and controls. For children over the age of 7 years, age-appropriate assent
Scientific Reports | (2021) 11:4011 | https://doi.org/10.1038/s41598-021-82989-5 4
Vol:.(1234567890)www.nature.com/scientificreports/
Feature chromosome Feature start Feature stop Feature name Target gene
chr1 154297035 154299035 ATP8B2 TRIM46
chr1 154322010 154323920 Peak_3422 LENEP
chr1 154322010 154323920 Peak_3422 PEAR1
chr1 154327990 154329950 Peak_3424 CRTC2
chr1 154352700 154353430 Peak_3426 SLC50A1
chr1 154355030 154363420 Peak_3427 EFNA1
chr1 154364920 154366710 Peak_3428 KIAA0907
chr3 46248832 46250832 CCR1 CCR2
chr3 46394234 46396234 CCR2 CCR1
chr3 46410632 46412632 CCR5 CXCR6
chr3 121813440 121820906 Peak_4095 LRRC58
chr3 46238451 46239841 Peak_4249 SMARCC1
chr3 46307161 46308651 Peak_4251 LARS2
chr3 46384411 46399021 Peak_4255 RTP3
chr3 46426891 46428451 Peak_4258 PTPN23
chr3 46442111 46444291 Peak_4261 NRADDP
chr3 46442111 46444291 Peak_4261 RTP3
chr3 46931478 46932061 Peak_4294 PTPN23
chr3 46931478 46932061 Peak_4294 RTP3
chr3 46967800 46974172 Peak_4299 PTPN23
chr3 119186784 119188784 POGLUT1 PARP9
chr3 119181529 119183529 TMEM39A GOLGB1
chr3 119181529 119183529 TMEM39A POLQ
chr5 131825465 131827465 IRF1 ACSL6
chr5 96220087 96239306 Peak_4706 CAST
chr5 96220087 96239306 Peak_4706 LNPEP
chr5 96244416 96249506 Peak_4707 ELL2
chr6 32406618 32408618 HLA-DRA HIST1H4H
chr6 32406618 32408618 HLA-DRA HLA-DMA
chr6 32406618 32408618 HLA-DRA HLA-DMB
chr6 32406618 32408618 HLA-DRA HLA-DOA
chr6 32406618 32408618 HLA-DRA HLA-DPA1
chr6 32406618 32408618 HLA-DRA HLA-DPB1
chr6 32406130 32408980 Peak_5195 PRRT1
chr6 32648860 32649480 Peak_5198 HLA-DMA
chr6 32648860 32649480 Peak_5198 HLA-DOA
chr7 28219075 28221075 JAZF1-AS1 CCDC126
chr11 36362500 36363860 Peak_298 ABTB2
chr11 36362500 36363860 Peak_298 COMMD9
chr11 36367840 36371740 Peak_299 CAPRIN1
chr11 36372980 36376021 Peak_300 PRR5L
chr11 36372980 36376021 Peak_300 TRAF6
chr12 6497390 6503150 Peak_808 POU5F1P3
chr14 69259631 69261472 ZFP36L1 KIAA0247
chr16 11376160 11381090 Peak_1171 RMI2
chr16 11400800 11410830 Peak_1173 RMI2
chr16 11424110 11425200 Peak_1175 RMI2
chr19 10449345 10451345 ICAM3 MIR199A1
chr19 10443314 10445314 RAVER1 ADAMTSL5
chr19 10443314 10445314 RAVER1 ANO8
chr19 10443314 10445314 RAVER1 AP3D1
chr19 10443314 10445314 RAVER1 ATP13A1
chr19 10443314 10445314 RAVER1 C19orf53
chr19 10443314 10445314 RAVER1 CACTIN
chr19 10443314 10445314 RAVER1 CARM1
chr19 10443314 10445314 RAVER1 CHERP
Continued
Scientific Reports | (2021) 11:4011 | https://doi.org/10.1038/s41598-021-82989-5 5
Vol.:(0123456789)www.nature.com/scientificreports/
Feature chromosome Feature start Feature stop Feature name Target gene
chr19 10443314 10445314 RAVER1 COLGALT1
chr19 10443314 10445314 RAVER1 DNM2
chr19 10443314 10445314 RAVER1 DOT1L
chr19 10443314 10445314 RAVER1 FAM32A
chr19 10443314 10445314 RAVER1 LPPR3
chr19 10443314 10445314 RAVER1 MAP2K7
chr19 10443314 10445314 RAVER1 MKNK2
chr19 10443314 10445314 RAVER1 PIP5K1C
chr19 10443314 10445314 RAVER1 RASAL3
chr19 10443314 10445314 RAVER1 RNF126
chr19 10443314 10445314 RAVER1 RPL36
chr19 10443314 10445314 RAVER1 RPS15
chr19 10443314 10445314 RAVER1 STK11
chr19 10443314 10445314 RAVER1 SUGP2
chr19 10443314 10445314 RAVER1 TMEM259
chr19 10443314 10445314 RAVER1 TYK2
chr19 10443314 10445314 RAVER1 UBA52
chr19 10443314 10445314 RAVER1 UQCR11
chr19 10443314 10445314 RAVER1 ZBTB7A
chr19 10490248 10492248 TYK2 ABHD17A
chr19 10490248 10492248 TYK2 ADAMTSL5
chr19 10490248 10492248 TYK2 ANO8
chr19 10490248 10492248 TYK2 AP3D1
chr19 10490248 10492248 TYK2 C19orf53
chr19 10490248 10492248 TYK2 CACTIN
chr19 10490248 10492248 TYK2 CACTIN-AS1
chr19 10490248 10492248 TYK2 CC2D1A
chr19 10490248 10492248 TYK2 CCDC130
chr19 10490248 10492248 TYK2 DNM2
chr19 10490248 10492248 TYK2 FAM32A
chr19 10490248 10492248 TYK2 MAP2K7
chr19 10490248 10492248 TYK2 PIP5K1C
chr19 10490248 10492248 TYK2 RASAL3
chr19 10490248 10492248 TYK2 RAVER1
chr19 10490248 10492248 TYK2 REXO1
chr19 10490248 10492248 TYK2 RFX1
chr19 10490248 10492248 TYK2 RNF126
chr19 10490248 10492248 TYK2 RPL36
chr19 10490248 10492248 TYK2 RPS15
chr19 10490248 10492248 TYK2 SBNO2
chr19 10490248 10492248 TYK2 STK11
chr19 10490248 10492248 TYK2 SUGP2
chr19 10490248 10492248 TYK2 TMEM259
chr19 10490248 10492248 TYK2 UBA52
chr19 10490248 10492248 TYK2 UQCR11
chr19 10490248 10492248 TYK2 WIZ
chr19 10490248 10492248 TYK2 ZNF414
chr22 30751626 30753626 CCDC157 THOC5
chr22 30751626 30753626 CCDC157 UQCR10
chr22 21914510 21916460 Peak_3818 PPIL2
chr22 21914510 21916460 Peak_3818 SDF2L1
chr22 30772430 30773260 Peak_3893 PISD
chr22 30782302 30784302 RNF215 EIF4ENIF1
chr22 30791929 30793929 SEC14L2 DUSP18
chr22 30791929 30793929 SEC14L2 FBXO7
chr22 30791929 30793929 SEC14L2 SELM
Continued
Scientific Reports | (2021) 11:4011 | https://doi.org/10.1038/s41598-021-82989-5 6
Vol:.(1234567890)www.nature.com/scientificreports/
Feature chromosome Feature start Feature stop Feature name Target gene
chr22 30791929 30793929 SEC14L2 THOC5
chr22 30791929 30793929 SEC14L2 UQCR10
chr22 30791929 30793929 SEC14L2 ZMAT5
Table 1. Putative casual regulatory elements and target genes. The results of the integrative approach to
identifying pathogenic targets. The chromosomal coordinates of the causal features are listed, along with
their putative target genes. Targets shown in italic are considered differentially expressed between any of the
conditions.
documents were also executed. All research procedures were carried out in compliance with the IRB-approved
protocol.
Blood was drawn into CPT tubes (Beckton-Dickinson # BD362761) and brought immediately to the pedi-
atric rheumatology research laboratory. Sample processing was begun within an hour of obtaining the sample.
CD4+ T cells. CD4+ T cells were purified from whole blood by negative selection using the StemSep™ Human
CD4+ T Cell Enrichment Kit (STEMCELL Technologies Inc., Vancouver, Canada) as previously described 46.
RNA purification and sequencing. Total RNA was extracted using TRIzol™ reagent and was further
purified using RNeasy MiniElute Cleanup kit, including a DNase digest as previously described 46. RNA was
quantified spectrophotometrically (Nanodrop, Thermo Scientific, Wilmington, DE) and assessed for quality by
capillary gel electrophoresis (Agilent 2100 Bioanalyzer; Agilent Technologies, Inc., Palo Alto, CA). cDNA librar-
ies were prepared for each sample using the Illumina TruSeq RNA Sample Preparation Kit following the manu-
facture’s recommended procedures. Libraries were sequenced using 100 base pair (bp) paired-end reads on the
Illumina HiSeq 2500 platform. Library construction and RNASeq were performed at the University at Buffalo
Genomics and Bioinformatics Core.
ATAC‑seq on CD4+ T cells. The assay for transposase-accessible chromatin sequencing (ATAC-seq) was
carried out according to Buenrostro’s protocol 47. To prepare nuclei, 50,000 CD4+ T cells were spun at 500 × g for
5 min, followed by a wash using 50 μL of cold 1 × PBS and centrifugation at 500 × g for 5 min. Cells were lysed
using cold lysis buffer (10 mM Tris–Cl, pH 7.4, 10 mM NaCl, 3 mM MgCl2 and 0.1% IGEPAL CA-630). Immedi-
ately after lysis, nuclei were spun at 500 × g for 10 min using a refrigerated centrifuge. Immediately following the
nuclei prep, the pellet was resuspended in the transposase reaction mix (25 μL 2 × TD buffer, 2.5 μL Transposase
(Illumina) and 22.5 μL of nuclease free water). The transposition reaction was carried out for 30 min at 37 °C.
Directly following transposition the sample was purified using a Qiagen Minelute kit. Following purification,
library fragments were amplified using 1 × NEBnext PCR master mix and 1.25 μM of PCR primer1 and Bar-
coded PCR Primer 2, using the following PCR conditions: 72 °C for 5 min, 98 °C for 30 s, followed by thermocy-
cling at 98 °C for 10 s, 63 °C for 30 s and 72 °C for 1 min. To reduce GC and size bias in our PCR we monitored
the PCR reaction using qPCR in order to stop amplification prior to saturation. To do this, the full libraries were
amplified for 5 cycles, after 5 cycles , 5 μl of PCR reaction was added 10 μl of the PCR cocktail with Sybr Green
at a final concentration of 0.6x. This reaction was run for 20 cycles, to determine the additional number of cycles
needed for the remaining 45 μl reaction. To calculate the additional number of cycles needed, we plotted linear
Rn versus cycle and to determine the cycle number that corresponded to one-third of the maximum fluorescent
intensity. The libraries were purified using AMPure XP beads yielding a final library 17.5 μl. Sequencing was
performed using 50 bp paired-end sequencing on the Illumina HiSeq 2500 platform at the University at Buffalo
Genomics and Bioinformatics Core.
ChIP‑seq for CTCF. The ChIP assay was carried out using a kit from Diagenode (Denville, NJ). Briefly,
Purified CD4+ T cells were fixed in 1% formaldehyde (J.T.Baker) in PBS for 10 min at room temperature, fol-
lowed by 5 min blocking in 125 mM glycine. Cells were rinsed two times in ice-cold PBS and pelleted (500 g,
10 min, 4 °C). All fixed cell pellets were stored at − 80 °C. Approximately four million cells were resuspended
in 0.5 ml of nuclei extraction buffer (5 mM PIPES pH 8; 85 mM KCl; 0.5% Igepal CA-630) supplemented with
Protease Inhibitor Cocktail (Cell Signaling Technologies). Cell suspensions were sonicated using Bioruptor Plus
(Diagenode) at low power with four cycles (15 s on and 30 s off). Samples were centrifuged (1000 g, 5 min, 4 °C)
and washed once in 1 ml of the nuclei extraction buffer. Isolated nuclei were resuspended in the shearing buffer
supplemented with Protease Inhibitor Cocktail and sonicated using Bioruptor Plus at high power with 25 cycles
(30 s on and 30 s off; water temperature 4 °C) to reach a fragment size distribution of 100–700 bp. ChIP reactions
were carried out in a final volume of 320 μl (70 ul washed Protein A-coated magnetic beads with antibody and
250 ul of sheared chromatin). 5 μl of sheared chromatin is stored at 4 °C as input sample. The antibody against
CTCF was acquired from Diagenode (Cat No C15410210, Lot No A2359-00234p). After immunoprecipitation
(IP) overnight at 4 °C, the beads were washed sequentially with different wash buffer, followed by incubation
with elution buffer. Finally, the decross-linked DNA was resuspended in 25 ul buffer. Then DNA-sequencing
was conducted using the Illumina HiSeq 2500 at the University at Buffalo Genomics and Bioinformatics Core.
Scientific Reports | (2021) 11:4011 | https://doi.org/10.1038/s41598-021-82989-5 7
Vol.:(0123456789)www.nature.com/scientificreports/
Figure 1. Attainment of clinical remission in JIA normalizes gene expression in CD4+ T-cells. (A) Volcano
plots for each of the pairwise comparisons of gene expression between groups. (B) Heatmap showing the
expression of all genes that were considered differentially expressed between any two groups. Kmeans clustering
was applied to separate genes into one of 5 clusters and hierarchal clustering was applied to cluster the groups.
Scientific Reports | (2021) 11:4011 | https://doi.org/10.1038/s41598-021-82989-5 8
Vol:.(1234567890)www.nature.com/scientificreports/
Figure 2. Chromatin re-arrangement occurs in the absence of three-dimensional changes. (A) Overlap between
the group-consistent accessible peaks identified in HC, ADT and CRM samples. (B) Volcano plot showing the
differences in CTCF binding affinity between 5 HC samples and 5 ADT samples. Blue dots represent sites whose
log10(fold-change) was at least 1 and whose FDR was less than or equal to 0.05.
HiChIP for CTCF. CD4+ T cells were cross-linked using 1% formaldehyde for ten minutes at room tempera-
ture and then quenched by 125 mM glycine for five minutes. Four million cross-linked cells per sample were
used in HiChIP assays as described in Mumbach et al., 2016 with some modifications 36. Briefly, nuclei were iso-
lated and subjected to in situ digestion using MboI for 4 h at 37 °C. The cutting sites were then filled and labeled
with dCTP, dGTP, dTTP and biotin-dATP. In situ proximity ligation was performed at room temperature over-
night. After fragmentation of the DNA by sonication for two minutes, chromatin was immunoprecipitated using
CTCF antibody (Cell Signaling, #3418S). DNA was eluted from the beads and purified by Zymo DNA Clean &
Concentrator Column. Streptavidin M-280 Dynabeads were used to capture biotin-labeled DNA fragments. The
sequencing libraries were generated on the streptavidin beads using the Nextera DNA Library Prep Kit.
Sanger sequencing. DNA from whole blood was purified using DNeasy Blood & Tissue Kit (Qiagen,
USA). DNA sequencing was performed in the Roswell Park Comprehension Cancer Institute.
Data processing: aligning high‑throughput sequencing reads to the reference genome. All
RNA-seq, ATAC-seq and ChIP-seq read files, in FASTQ format, were aligned to the hg19 reference genome
using bowtie248. All of the files were run through bowtie2 using default parameters. RNA-seq and ATAC-seq
data were run using paired-end mapping options (-1 and -2 options), while the CTCF ChIP-seq data was run
using the unpaired options (-U option). HiChIP raw reads (fastq files) were aligned to hg19 human reference
genome using HiC-Pro49, which was augmented with positions of Mbo1 restriction fragment cut sites for identi-
fying alignment end sites. The resulting SAM files, outputted by HiC-Pro or bowtie2, were converted into BAM
file formats using samtools 50.
Data processing: RNA‑seq analysis. After the data was aligned to the reference genome and converted
into BAM format, the RNA-seq data was used to create a count table for differential analysis. For every gene, the
number of RNA-seq reads for each sample mapping to that gene were counted using HT-Seq 51. HT-Seq was run
using default parameters, using the GENCODE 52 version-19 gene annotations. This count table was then used
as the input into the edgeR package for differential gene expression analysis 53.
Differential gene expression was identified using edgeR’s common dispersion protocol. A gene was considered
expressed if at least five samples had a counts-per-million (CPM) value of at least 1. 14,357 genes were consid-
ered expressed under these conditions, in any of the three groups. edgeR was then run on the remaining list of
expressed genes, first by calculating the normalization factors (calcNormFactors()), followed by calculating the
common and then tag-wise dispersions (estimateCommonDisp(), estimateTagwiseDisp()), followed by an exact
test and FDR correction (extactTest(), decideTestsDGE(,adjust.method = ”BH”,p.value = 0.05) to determine genes
that were differentially expressed.
Scientific Reports | (2021) 11:4011 | https://doi.org/10.1038/s41598-021-82989-5 9
Vol.:(0123456789)www.nature.com/scientificreports/
Figure 3. Identifying regulatory hubs. Snapshot showing the regulatory hub anchored on JIA risk variants
rs6946509, rs7808122, rs10280937 and rs73300638. Top row shows LD blocks of the risk variants, followed by
averaged ATAC-seq, RNA-seq, CTCF ChIP-seq signal across the three sample groups, as well as the HiChIP
loops for the healthy control and active disease groups, followed by differentially expressed genes and all RefSeq
genes.
The volcano plots for differential gene expression were made by plotting the fold-change and p-value for
every expressed gene, with genes whose p-value was ≤ 0.05 and whose log fold change was ≥ 1 colored blue and
those genes not matching these criteria colored red. The heat-map was created by identifying all genes that were
considered differentially expressed in any of the three pairwise comparisons (4783 genes were considered), and
clustering them based on their log CPM values into five clusters with k-means clustering. The individual samples
were clustered with hierarchal clustering. Genes belonging to the five individual clusters were used for GO term
analysis using GOrilla 54. GOrilla was run using the two gene set option, with the cluster genes as the input and
the total list of expressed genes as the background set.
Data processing: ChIP‑seq and HiChIP analysis. After the ChIP-seq data was aligned to the reference
genome and converted to BAM format, those BAM files were used as the input into MACS2 55 for identifying
CTCF binding sites. Each IP file had a matching input file that was used as inputs into MACS2. The q-value
threshold for reporting peaks from MACS2 was set to 0.05 (option –q 0.05), which is the default value. Once
peaks were called, those peaks were used as inputs into the DiffBind software37. For each sample, DiffBind takes
the ChIP BAM files, the control input BAM files and the peaks from MACS2 as inputs. In total, DiffBind identi-
fied 61 CTCF binding sites that were considered differentially bound (FDR ≤ 0.1). The volcano plot showing the
fold-change vs p-values (Fig. 2B) showed a possible artifact, evidenced by the diagonal line of points on the right
side of the figure. Due to this, none of those sites were included in any further analysis and were not character-
ized with additional assays.
HiC-Pro alignments, in BAM format, were input into H iChipper56 using mostly default parameters. Mbo1
restriction fragment cut sites and CTCF peaks generated above, that were present in at least one sample, were
input as anchor locating guides. Reads contributing to anchors were required to have a mapping quality of
MAPQ ≥ 20.
Once the HiChIP loops had been identified, several post processing steps were conducted. We first sought to
retain only those loops whose anchors were at valid, group-specific binding sites. To identify these we first took
all ADT or HC CTCF peaks from MACS2 and determined consensus peaks for each group by finding sites that
were considered peaks in at least 60% of samples in the group. Then every HiChIP loop, in each sample, was
Scientific Reports | (2021) 11:4011 | https://doi.org/10.1038/s41598-021-82989-5 10
Vol:.(1234567890)www.nature.com/scientificreports/
checked to see if both of its anchors were located at a consensus peak. If the loop was not anchored on both ends
at a consensus peak, it was removed from further analysis.
Data processing: ATAC‑seq analysis. The aligned BAM files for the ATAC-seq data were first subjected
to preprocessing steps to generate input files for peak calling. The unsorted BAM files were first sorted and then
indexed using samtools (samtools sort followed by samtools index) 50. Bedtools 57 was used to convert the sorted
and indexed BAM files into a bed file (bedtools bamtobed) and these bed files were then used to create a genome
wide bigwig file of read coverage, first with bedtools and then with UCSC’s bedGraphToBigWig tools (bedtools
genomecov –bga followed by bedGraphToBigWig). The sorted BAM files, the BAM index files and these BigWig
files were used as inputs into the ATAC-seq peak calling algorithm, HMMRATAC 58. Additionally, a genome
size file was downloaded from UCSC’s genome browser as was a list of blacklisted sites for the hg19 genome
annotation (wgEncodeDacMapabilityConsensusExcludable.bed with the –e option in HMMRATAC) 59,60.
HMMRATAC was run with the upper and lower range settings for finding candidate peaks to build the model,
set to 20 and 10 respectively (-u 20 and –l 10 options). For each sample, HMMRATAC outputted a peak file,
with the locations of every accessible region, the top 100,000 of which were kept for further analysis. Consistent
peaks were considered to be genomic regions that were identified as a peak in at least 60% of the group’s samples.
A total of 108,596 consistent HC peaks, 223,941 consistent ADT peaks and 103,612 consistent CRM peaks were
identified. GO term enrichment for any group of peaks was determined by using G REAT61, with default settings.
Data processing: identifying linkage disequilibrium blocks for JIA risk loci. Zhu et al. had previ-
ously identified the linkage disequilibrium blocks for 35 JIA risk associated SNPs 9. Additional risk loci have
been identified since and we aimed to incorporate those into our a nalysis7,40. Because the method used to iden-
tify the LD blocks from Zhu et al. is no longer maintained, we processed all JIA risk SNPs using SNiPA, using the
same settings for each SNP 62. Using the “Block Annotation” tool from the SNiPA suite, we ran each SNP using
the GRCh37 genome assembly, the 1000 Genomes, Phase 3 v5 variant set, set the population to European and
the genome annotation to Ensembl 87. Each block used an r2 of 0.8 to identify linkage disequilibrium.
Data processing: identifying interaction domains around JIA risk loci. ATAC-seq, ChIP-seq and
RNA-seq data was converted from raw BAM files into BigWig files and then merged together and averaged.
HiChIP loops were converted into a paired end BED format and filtered to keep only those loops with at least 2
reads supporting it. All of this data, along with a BED file of JIA risk associated LD blocks from Zhu et al. 9, was
then uploaded onto the WashU genome browser 63 for visualization. Starting with each LD block, we determined
whether the LD region contained a CTCF loop anchor. If not, then the LD block was considered to be inactive
in CD4+ T cells and was excluded from further analysis. If the LD blocks that contained one or more CTCF loop
anchors, we then determined all genomic regions that physically interacted with the block. We then determined
all regions that interacted with those anchors, and so forth, until we had identified all regions that could come
into close physically proximity to the LD block. An example of a positive region is shown in Fig. 3.
Data processing: determining enhancer‑TSS links within regulatory hubs. Having defined all
regulatory hubs that are anchored on a JIA risk associated locus, we sought to determine which enhancers
within a hub controlled the expression of which genes. Using HT-seq 51, we counted the number of RNA-seq
reads that mapped to each gene for each sample and the number of ATAC-seq reads that mapped to each identi-
fied peak for each matched sample, i.e. those samples where there was both RNA-seq and ATAC-seq data. We
then converted those read counts into log(Counts per million) using edgeR. Then, for each regulatory hub, we
constructed a matrix of the log(CPM) for RNA-seq reads for each gene in the hub and log(CPM) for ATAC-seq
reads for each peak in the hub. We then perform feature selection with B oruta64, modeling the expression of
every gene (Y) as a function of the expression level of all other genes in the hub (T) as well as the accessibility (A)
of all ATAC-seq peaks (P) within the hub.
T
P
Yi = Yt + Ap
1 1
Our modeling approach is similar to recent studies that have used the level of accessibility of regulatory ele-
ments to predict enhancer-promoter interactions65,66. Because of the stochastic nature of the Boruta algorithm,
we ran it 50 times per gene and only retained features that were considered significant in at least 95% of the
runs. Finally, we focused on those genes whose features were located within the JIA risk associated LD blocks.
Received: 14 May 2020; Accepted: 15 January 2021
References
1. Ravelli, A. & Martini, A. Juvenile idiopathic arthritis. Lancet (London, England) 369, 767–778. https://doi.org/10.1016/s0140
-6736(07)60363-8 (2007).
2. Singsen, B. H. Rheumatic diseases of childhood. Rheum. Dis. Clin. N. Am. 16, 581–599 (1990).
3. Ansell, B. M., Bywaters, E. G. & Lawrence, J. S. Familial aggregation and twin studies in Still’s disease. Juvenile chronic polyarthritis.
Rheumatology 2, 37–61 (1969).
Scientific Reports | (2021) 11:4011 | https://doi.org/10.1038/s41598-021-82989-5 11
Vol.:(0123456789)www.nature.com/scientificreports/
4. Prahalad, S. et al. Twins concordant for juvenile rheumatoid arthritis. Arthritis Rheum. 43, 2611–2612. https: //doi.org/10.1002/1529-
0131(200011)43:11%3c2611::aid-anr33%3e3.0.co;2-t (2000).
5. Ozen, S. et al. A pilot study for genome wide association study (GWAS) in patients with juvenile idiopathic arthritis (JIA) and
their parents. Pediatr. Rheumatol. 9, P152 (2011).
6. Thompson, S. D. et al. Genome-wide association analysis of juvenile idiopathic arthritis identifies a new susceptibility locus at
chromosomal region 3q13. Arthritis Rheum. 64, 2781–2791. https://doi.org/10.1002/art.34429 (2012).
7. Hinks, A. et al. Dense genotyping of immune-related disease regions identifies 14 new susceptibility loci for juvenile idiopathic
arthritis. Nat. Genet. 45, 664–669. https://doi.org/10.1038/ng.2614 (2013).
8. Wong, L., Jiang, K., Chen, Y. & Jarvis, J. N. Genetic insights into juvenile idiopathic arthritis derived from deep whole genome
sequencing. Sci. Rep. 7, 2657. https://doi.org/10.1038/s41598-017-02966-9 (2017).
9. Zhu, L. et al. Chromatin landscapes and genetic risk for juvenile idiopathic arthritis. Arthritis Res. Ther. 19, 57. https://doi.
org/10.1186/s13075-017-1260-x (2017).
10. Jiang, K. et al. Disease-associated single-nucleotide polymorphisms from noncoding regions in juvenile idiopathic arthritis are
located within or adjacent to functional genomic elements of human neutrophils and CD4+ T cells. Arthritis Rheumatol. (Hoboken,
N.J.) 67, 1966–1977, https://doi.org/10.1002/art.39135 (2015).
11. Jarvis, J. N. et al. Evidence for chronic, peripheral activation of neutrophils in polyarticular juvenile rheumatoid arthritis. Arthritis
Res. Ther. 8, R154. https://doi.org/10.1186/ar2048 (2006).
12. Knowlton, N. et al. The meaning of clinical remission in polyarticular juvenile idiopathic arthritis: Gene expression profiling
in peripheral blood mononuclear cells identifies distinct disease states. Arthritis Rheum. 60, 892–900. https://doi.org/10.1002/
art.24298(2009).
13. Jiang, K. et al. Whole blood gene expression profiling predicts therapeutic response at six months in patients with polyarticular
juvenile idiopathic arthritis. Arthritis Rheumatol. (Hoboken, N.J.) 66, 1363–1371, https://doi.org/10.1002/art.38341 (2014).
14. Jiang, K., Sun, X., Chen, Y., Shen, Y. & Jarvis, J. N. RNA sequencing from human neutrophils reveals distinct transcriptional differ-
ences associated with chronic inflammatory states. BMC Med. Genomics 8, 55. https://doi.org/10.1186/s12920-015-0128-7 (2015).
15. Jiang, K. et al. Whole blood expression profiling from the TREAT trial: Insights for the pathogenesis of polyarticular juvenile
idiopathic arthritis. Arthritis Res. Ther. 18, 157. https://doi.org/10.1186/s13075-016-1059-1 (2016).
16. Venters, B. J. & Pugh, B. F. How eukaryotic genes are transcribed. Crit. Rev. Biochem. Mol. Biol. 44, 117–141. https://doi.
org/10.1080/10409230902858785 (2009).
17. Dekker, J., Marti-Renom, M. A. & Mirny, L. A. Exploring the three-dimensional organization of genomes: Interpreting chromatin
interaction data. Nat. Rev. Genet. 14, 390–403. https://doi.org/10.1038/nrg3454 (2013).
18. Tsompana, M. & Buck, M. J. Chromatin accessibility: A window into the genome. Epigenet.Chromatin 7, 33. https://doi.
org/10.1186/1756-8935-7-33 (2014).
19. Ghirlando, R. & Felsenfeld, G. CTCF: Making the right connections. Genes Dev. 30, 881–891. https://doi.org/10.1101/gad.27786
3.116 (2016).
20. Merkenschlager, M. & Odom, D. T. CTCF and cohesin: Linking gene regulatory elements with their targets. Cell 152, 1285–1297.
https://doi.org/10.1016/j.cell.2013.02.029 (2013).
21. Schmiedel, B. J. et al. 17q21 asthma-risk variants switch CTCF binding and regulate IL-2 production by T cells. Nat. Commun. 7,
13426. https://doi.org/10.1038/ncomms13426 (2016).
22. Norton, H. K. & Phillips-Cremins, J. E. Crossed wires: 3D genome misfolding in human disease. J. Cell Biol. 216, 3441–3452. https
://doi.org/10.1083/jcb.201611001 (2017).
23. Rea, M., Gripshover, T. & Fondufe-Mittendorf, Y. Selective inhibition of CTCF binding by iAs directs TET-mediated reprogram-
ming of 5-hydroxymethylation patterns in iAs-transformed cells. Toxicol. Appl. Pharmacol. 338, 124–133. https: //doi.org/10.1016/j.
taap.2017.11.015 (2018).
24. Boehning, M. et al. RNA polymerase II clustering through carboxy-terminal domain phase separation. Nat. Struct. Mol. Biol. 25,
833–840. https://doi.org/10.1038/s41594-018-0112-y (2018).
25. Boija, A. et al. Transcription factors activate genes through the phase-separation capacity of their activation domains. Cell 175,
1842-1855.e1816. https://doi.org/10.1016/j.cell.2018.10.042 (2018).
26. Cho, W. K. et al. Mediator and RNA polymerase II clusters associate in transcription-dependent condensates. Science 361, 412–415.
https://doi.org/10.1126/science.aar4199 (2018).
27. Chong, S. et al. Imaging dynamic and selective low-complexity domain interactions that control gene transcription. Science https
://doi.org/10.1126/science.aar2555 (2018).
28. Sabari, B. R. et al. Coactivator condensation at super-enhancers links phase separation and gene control. Science https://doi.
org/10.1126/science.aar3958 (2018).
29. Allahyar, A. et al. Enhancer hubs and loop collisions identified from single-allele topologies. Nat. Genet. 50, 1151–1160. https://
doi.org/10.1038/s41588-018-0161-5 (2018).
30. Oudelaar, A. M., Davies, J. O. J., Downes, D. J., Higgs, D. R. & Hughes, J. R. Robust detection of chromosomal interactions from
small numbers of cells using low-input Capture-C. Nucleic Acids Res. 45, e184. https://doi.org/10.1093/nar/gkx1194 (2017).
31. Oudelaar, A. M. et al. A revised model for promoter competition based on multi-way chromatin interactions. bioRxiv 612275,
https://doi.org/10.1101/612275 (2019).
32. Wallace, C. A. The use of methotrexate in childhood rheumatic diseases. Arthritis Rheum. 41, 381–391. https: //doi.
org/10.1002/1529-0131(199803)41:3%3c381::aid-art2%3e3.0.co;2-3 (1998).
33. Wallace, C. A., Bleyer, W. A., Sherry, D. D., Salmonson, K. L. & Wedgwood, R. J. Toxicity and serum levels of methotrexate in
children with juvenile rheumatoid arthritis. Arthritis Rheum. 32, 677–681 (1989).
34. Wallace, C. A. et al. Trial of early aggressive therapy in polyarticular juvenile idiopathic arthritis. Arthritis Rheum. 64, 2012–2021.
https://doi.org/10.1002/art.34343 (2012).
35. Buenrostro, J. D., Giresi, P. G., Zaba, L. C., Chang, H. Y. & Greenleaf, W. J. Transposition of native chromatin for fast and sensitive
epigenomic profiling of open chromatin, DNA-binding proteins and nucleosome position. Nat. Methods 10, 1213–1218. https://
doi.org/10.1038/nmeth.2688 (2013).
36. Mumbach, M. R. et al. HiChIP: Efficient and sensitive analysis of protein-directed genome architecture. Nat. Methods 13, 919–922.
https://doi.org/10.1038/nmeth.3999 (2016).
37. Stark R, B. G. DiffBind: Differential binding analysis of ChIP-Seq peak data. Bioconductor. http://bioconductor.org/packages/relea
se/bioc/vignettes/DiffBind/inst/doc/DiffBind.pdf (2011).
38. Sanger, F. & Coulson, A. R. A rapid method for determining sequences in DNA by primed synthesis with DNA polymerase. J. Mol.
Biol. 94, 441–448 (1975).
39. Sanger, F., Nicklen, S. & Coulson, A. R. DNA sequencing with chain-terminating inhibitors. Proc. Natl. Acad. Sci. U.S.A. 74,
5463–5467 (1977).
40. McIntosh, L. A. et al. Genome-wide association meta-analysis reveals novel juvenile idiopathic arthritis susceptibility loci. Arthritis
Rheumatol. (Hoboken, N.J.) 69, 2222–2232, https://doi.org/10.1002/art.40216 (2017).
41. Jiang, K., Frank, M., Chen, Y., Osban, J. & Jarvis, J. N. Genomic characterization of remission in juvenile idiopathic arthritis.
Arthritis Res. Ther. 15, R100. https://doi.org/10.1186/ar4280 (2013).
Scientific Reports | (2021) 11:4011 | https://doi.org/10.1038/s41598-021-82989-5 12
Vol:.(1234567890)You can also read


