A pilot study of eDNA metabarcoding to estimate plant biodiversity by an alpine glacier core (Adamello glacier, North Italy) - Nature
←
→
Page content transcription
If your browser does not render page correctly, please read the page content below
www.nature.com/scientificreports
OPEN A pilot study of eDNA
metabarcoding to estimate plant
biodiversity by an alpine glacier
core (Adamello glacier, North Italy)
Claudio Varotto1, Massimo Pindo1, Elena Bertoni2, Christian Casarotto3, Federica Camin1,
Matteo Girardi1, Valter Maggi4 & Antonella Cristofori1*
Current biodiversity loss is a major concern and thus biodiversity assessment of modern ecosystems
is compelling and needs to be contextualized on a longer timescale. High Throughput Sequencing
(HTS) is progressively becoming a major source of data on biodiversity time series. In this multi proxy
study, we tested, for the first time, the potential of HTS to estimate plant biodiversity archived in the
surface layers of a temperate alpine glacier, amplifying the trnL barcode for vascular plants from eDNA
of firn samples. A 573 cm long core was drilled by the Adamello glacier and cut into sections; produced
samples were analyzed for physical properties, stable isotope ratio, and plant biodiversity by eDNA
metabarcoding and conventional light microscopy analysis. Results highlighted the presence of pollen
and plant remains within the distinct layers of snow, firn and ice. While stable isotope ratio showed a
scarcely informative pattern, DNA metabarcoding described distinct plant species composition among
the different samples, with a broad taxonomic representation of the biodiversity of the catchment
area and a high-ranking resolution. New knowledge on climate and plant biodiversity changes of large
catchment areas can be obtained by this novel approach, relevant for future estimates of climate
change effects.
The current biodiversity loss is a major concern on a planetary level and this issue is closely related to the ongoing
changes in c limate1. The urgency for biodiversity assessment of modern ecosystems is compelling and the need
for such results to be contextualized on a longer timescale is r ecognized2.
Conventionally, information about past variations in plant diversity is available from palynological sequences,
as well as from plant fossil/subfossil time series3. Such records are widespread, both spatially and temporally, and
therefore represent the main source of paleo-vegetational information on which estimates of past plant diversity
can be inferred4. In general, however, palynological approaches are affected by large imbalance in taxonomic
precision, which can often be limited to species aggregates, genera, families or even groups of families3. A new
opportunity for biodiversity assessment arose more recently with the application in ecology of high throughput
sequencing (HTS) to environmental DNA (eDNA)5. HTS of eDNA is progressively becoming a major source of
data on biodiversity time series, which can be used both in long-term monitoring, and paleoecological r esearch6.
HTS of eDNA is usually based on specific DNA sequences (called DNA barcodes;7), which generally allow
to reliably discriminate species when sufficiently long and/or informative genomic regions are chosen8. Among
the most commonly used DNA barcodes for plants, sequences of the rbcL, matk and ITS genes as well as the
trnH-psbA intergenic region have been widely u sed9–11. However, additional barcodes gained increasing atten-
tion as they provide an attractive compromise between information content (i.e. level of genetic variation),
length and efficiency of a mplification11,12. Among them, the trnL intron of the chloroplast genome has been
already widely used in diet studies based on faeces, food industry and forensic a pplications13. The short length
of the trnL region makes it especially useful for degraded DNA, like the one extracted from poorly conserved
samples and ancient specimens14. DNA sequencing techniques have been recently demonstrated to allow pollen
grain identification in complex environmental samples through DNA m etabarcoding15,16. The use of molecular
techniques in parallel or, sometimes, alternative to conventional light microscopy pollen analyses is, therefore,
becoming more and more common, and the recurrent conclusion is that results by the two different techniques
1
Research and Innovation Centre, Fondazione Edmund Mach, San Michele All’Adige, TN, Italy. 2Uppsala University,
Uppsala, Sweden. 3Geology Department, Science Museum (MUSE), Trento, Italy. 4Earth and Environmental
Sciences, University of Milano Bicocca, Milan, Italy. *email: antonella.cristofori@fmach.it
Scientific Reports | (2021) 11:1208 | https://doi.org/10.1038/s41598-020-79738-5 1
Vol.:(0123456789)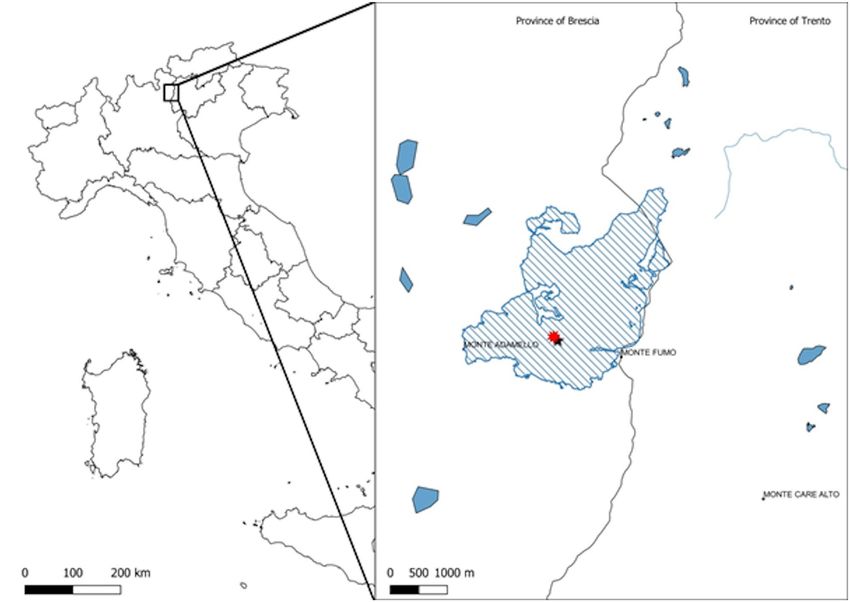
www.nature.com/scientificreports/
complement each other. Genetic data and morphological analyses of pollen and spores complement each other
due to different taxonomic resolution, often sampling spatial scales (regional for pollen vs local for DNA) and,
more generally, to different taphonomic processes affecting the archiving of DNA or pollen (production, transfer
and preservation processes)17,18. It has been proven that eDNA metabarcoding can be successfully applied to
different ecosystems: from water bodies to terrestrial environments. When targeting plant biodiversity, sev-
eral studies demonstrated the efficiency of estimating species content by eDNA analyses in aerial s amples15,16,
honey19 soil20 and lake s ediments21,22. A molecular approach to reconstruct past vegetation on the ice sheet of
Greenland was applied by Willerslev23, obtaining a record of past vegetation and invertebrates dating back to
450,000–800,000 years. Recent studies also applied eDNA metabarcoding to permafrost obtaining positive and
promising results24–26. As low temperatures favor a good preservation of DNA molecules, frozen matrices can be
ideal sources of eDNA for metabarcoding, provided no inhibitors of PCR amplification—e. g. humic acid—are
present27, like in the case of permafrost soils. Glacier ice, in particular, is potentially a very suitable matrix for
eDNA studies, as biological samples here contained are frozen, thus slowing down degradation, and glacier ice
is a simple and “clean” source constituted nearly exclusively by distilled, rain water and particulate matter, thus
minimizing drawbacks of DNA amplification due to inhibitors. However, to the best of our knowledge, no study
has been published testing the suitability of glaciers as sources of eDNA for assessments of plant biodiversity
by DNA metabarcoding. This is surprising, as glacier ice cores are potentially among the most adequate paleo-
archives to investigate past variations in biodiversity for at least two major reasons. First of all, with regard to the
last centuries, glaciers allow higher time resolution analyses than lakes or mires, due to the higher accumulation
rate of snow (meters per year;28) in comparison to sediment and peat (less than mm year-1 to cm year-1;29). Second,
studies on the pollen content of glaciers have already highlighted the high potential of these analyses in differ-
ent regions of the globe. Investigations by various authors have proven that pollen grains are valuable proxies
to detect seasonality in ice c ores30–36, while other studies have shown that pollen analyses of longer glacier time
series produce valid paleoecological d ata37–40. Third, glaciers have been proven to provide valuable climatic data,
as they are sensitive climate indicators that adjust their mass in response to climate c hange41. Regrettably, over
the last decades glaciers have already started to disappear due to the increase in atmospheric t emperature42–44.
The threat is particularly acute in the European Alps, where temperature is rising at twice the global rate45. This
situation creates both public and scientific concern, underlining the need for a detailed investigation of glacier
content. Ice core studies from the Alps already highlighted that alpine glaciers are capable of retaining useful
climatic information and long time s eries46–49, setting the base for further research aimed to rescue alpine ice
cores50. Investigating both, the biotic and abiotic component included in glaciers may provide the opportunity
to directly link paleo-environmental information (obtained by eDNA analyses) to climatic information (gained
from stable isotopes and geochemical proxies).
In this study, we present the results of a multi proxy case study, where we test the possibility to produce plant
diversity estimates based on eDNA analyses, by the P6 loop of the plastid DNA trnL (UAA) intron14 as a marker
for vascular plants, on the top surface layers of the Adamello Glacier (Italy). The results of the biotic component
are discussed also in the frame of classical glaciological proxies as stable isotopes ratios (Deuterium, Oxygen),
snow crystallography and glacier mass balance. This case study is the base for future research on deeper glacier
ice cores encompassing longer time spans.
Results
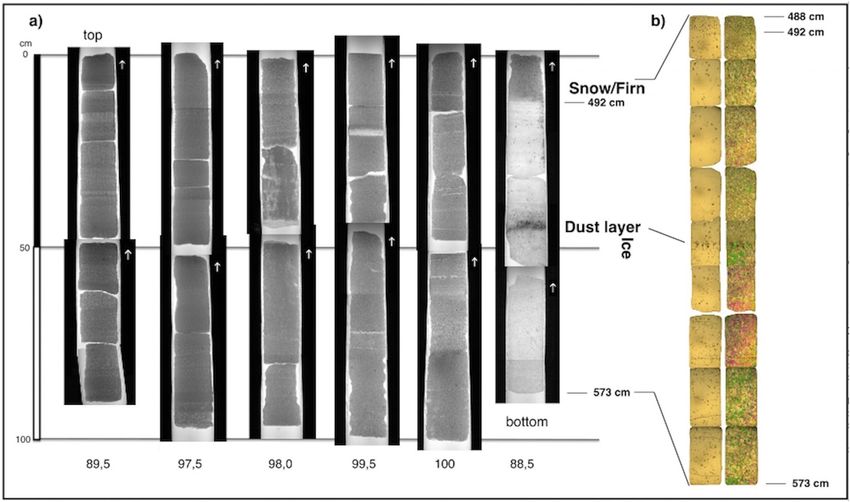
Visual stratigraphy of the ice core. The 573 cm of ADA15 core embodied the surface snow accumula-
tion and the upper part of ice/dense firn of the Pian di Neve, the accumulation basin of Adamello Glacier. Strati-
graphically, the upper 212 cm were characterized by single snowfalls showing texture changes (particularly in
grain size); the snow layers were clearly visible in the thin sections as variations in gray tones (under transmitted
light) (Fig. 1a).
At 212 cm-depth, a more complex snow facies started, containing ice lenses with vertical structures, probably
related to water percolation. These facies stopped at 245 cm-depth in a 5 cm-thick ice layer. This layer may be
originated by surface melting, in a period with high temperature or insolation, causing percolation of water in
the snowpack, and a freezing to ice within the snowpack at lower temperatures.
At a depth from 250 to 429 cm the snow facies were clearly similar to the top part, with some thin ice layers,
or lenses, along the core. Some differences could be observed in snow density, mainly due to the snow grain size.
At a 492 cm-depth a transition to the ice facies was visible. After 4–5 cm of dense firn, the bottommost 81 cm
of the core were represented by glacier ice, probably superimposed ice, related mostly to the complete percolation
and melting of snowpack. The dense firn, in transition to ice, showed vertical and elongated and/or dendritic
bubbles that represent the loss of porosity due to the formation of ice crystals. Below this small layer, there were
30 cm of ice with ice crystals of few mm in diameter and few bubbles, consistent with a strong recrystallization
of the snow/firn packs after strong melting. In-fact, at 522 cm-depth, a dark layer was present, related to high
accumulation of dust, representing probably a previous summer/spring glacier surface (Fig. 1b).
Below the dark level till the bottom of the core, glacier ice was present, with small crystals and more dispersed
bubbles. This facies of the glacier seems to be related to the ice metamorphism, transforming snow/firn to glacier
ice, even if we cannot exclude melting processes at this level (Fig. 1b).
Stable isotopes. Figure 2 shows the δ2H and δ18O values of melted ice. The δ18O values ranged between
around − 17 and − 8‰ and δ2H values between around − 140 and − 50‰.
By evaluating the data along the ice core depth, it was possible to observe some general trends and several
oscillations. Both δ2H and δ18O values had a general trend of increase from 5 to 207 cm of depth, then a drop
of values at 227 cm, and again a positive trend up to 427.5 cm, followed by a negative trend down to the bottom
Scientific Reports | (2021) 11:1208 | https://doi.org/10.1038/s41598-020-79738-5 2
Vol:.(1234567890)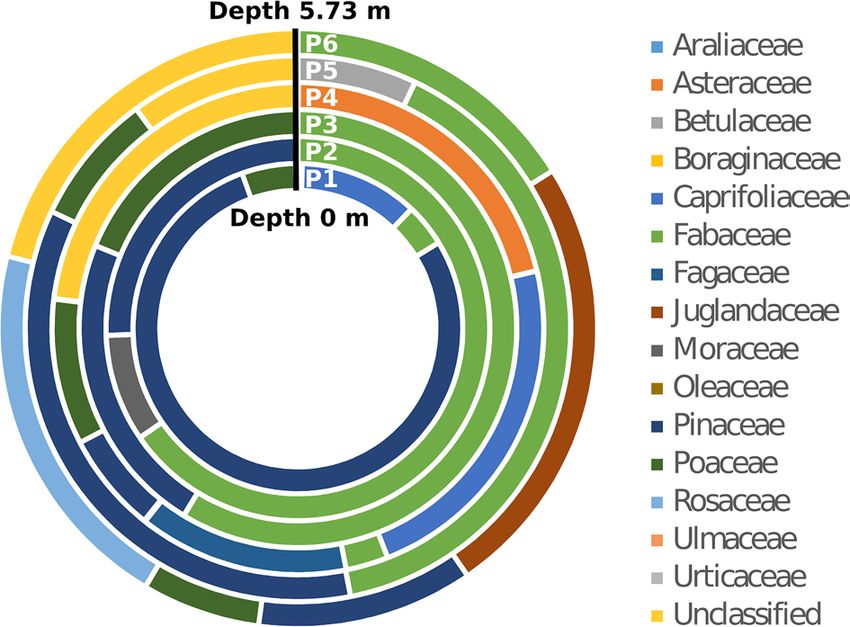
www.nature.com/scientificreports/

                                  Figure 1.  Ice core stratigraphy. (a) Visual stratigraphy of drilled ice core under transmitted light: below each
                                  section the total length of the single run is reported, from the top (upper left) to the bottom run (lower right).
                                  (b) Thin sections of the bottom part of the core with ice facies; on the left, the single polarizer images which
                                  highlight the air bubble size and density; on the right, crossed polarization filters which show ice crystal
                                  structure and size, and crystal boundaries. The sections correspond from left to right to DNA metabarcoding
                                  samples P1 to P6.

                                  Figure 2.  Stable isotope ratio. Values of δ18O‰ (in blue) and δ2H‰ (in black) concentration measured along
                                  the depth of the core.

Scientific Reports |   (2021) 11:1208 |                https://doi.org/10.1038/s41598-020-79738-5                                                      3

                                                                                                                                                Vol.:(0123456789)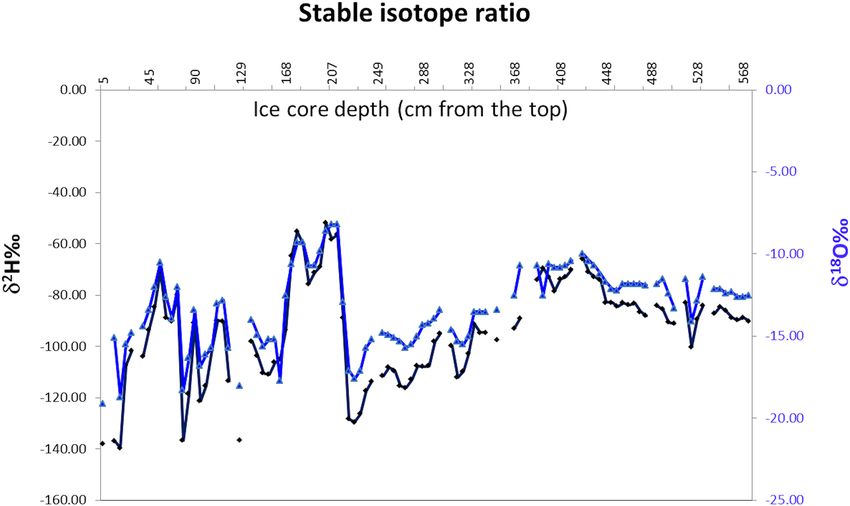
www.nature.com/scientificreports/
Figure 3. Pollen grains retrieved from the ice core and analysed by light microscopy. Pollen grains of Alnus (a),
Ambrosia (b), Artemisia (c) and Pinus (d).
Sample max
depth (cm)
50 114 182
Alnus 1 0 0
Cupressaceae/Taxaceae 61 1 2
Pinus 1 2 4
Corylus 2 0 0
Poaceae 7 8 5
Urticaceae 0 1 2
Polygonaceae 0 1 1
Ranunculaceae 0 2 0
Ostrya carpinifolia 0 0 1
Ulmus 0 0 1
Tilia 0 0 1
Quercus 3 2 1
Brassicaceae 0 1 0
Carpinus betulus 0 0 1
Unidentified 4 8 7
Table 1. Taxonomic assignment and counts from palynological analyses of three random 10-cm samples
from Adamello glacier core. Figures in the table are the number of pollen grains detected for each taxon in the
corresponding sample. Column headings show the relative depth of samples from the surface firn layer.
of the core, at 567.5 cm. From the top to 207 mm of ice core depth, several significant oscillations were evident
(covering up to around 70‰ for δ2H and more than 10‰ for δ18O). After the depth of 207 mm, these oscilla-
tions were much smaller.
Microscopical pollen analyses. Palynological analyses on three random samples confirmed the presence
of pollen grains within the ice core (Fig. 3; Table 1). In addition to pollen, various other debris were present in
the samples (Fig. 3), some likely of vegetal origin. The 14 identified pollen taxa belonged to a total of 10 families,
with the families of Cupressaceae and Taxaceae, characterized by pollen grains with the same morphological
characteristics, being the most represented. This winter pollen occurs in large amounts in the sample Bio-5, at
a depth of 50 cm from the surface, where the core should represent the early winter precipitation of 2015. The
other pollen taxa, dominated by Poaceae, are all compatible with the vegetation of the catchment area. Four
of the 10 families (Brassicaceae, Malvaceae, Polygonaceae and Ranunculaceae) were identified exclusively by
microscopical analyses and not by metabarcoding (see below).
Environmental DNA sequencing and data analysis. Raw reads from lllumina MiSeq showed a very
high accuracy, with an average Phred Quality Score of 40.9, corresponding to an Inferred Base Call Accu-
racy > 99.99%, which is a probability of incorrect base call of 1:10,00051 (Illumina Technical note: https://www.
illumina.com/documents/products/technotes/technote_Q-Scores.pdf).
Scientific Reports | (2021) 11:1208 | https://doi.org/10.1038/s41598-020-79738-5 4
Vol:.(1234567890)www.nature.com/scientificreports/
Figure 4. Taxonomy of plant families corresponding to the OTUs identified by metabarcoding of the trn-L
marker on firn core samples from Adamello glacier. Bar lengths represent in logarithmic scale (base 10) the
number of reads assigned to a specific family. Numbers above each bar are the number of OTUs identified. Tree
was visualized with FigTree software (http://tree.bio.ed.ac.uk/software/figtree/).
Sequencing of firn eDNA amplicons generated a total of 190,028 raw reads, 158,724 of which passed the qual-
ity filtering. After removal of singletons and chimeras, sequencing depth was from 16,948 to 37,471 reads per
sample (Supplementary Table S1). Samples were subjected to rarefaction (without replacement) at 16,948 reads
per sample, corresponding to the minimum number of reads per sample (sample PI2). Reads were clustered in a
total of 2339 OTUs, with a maximum of 1047 OTUs per sample (corresponding to the sample PI5). Sequencing
results are detailed in the Supplementary Table S1.
The obtained dataset was the basis for the following taxonomic assignment.
Taxonomic assignment of environmental DNA sequences. The data analysis of OTUs was per-
formed against the local reference database at a 99% similarity, resulting in 2164 OTUs (92.5%) taxonomically
assigned to a single plant taxa. Overall, Fabaceae, Pinaceae and Poaceae were the most represented plant families,
representing 69% of the total reads with a taxonomic assignment in the reference database. The taxonomic distri-
bution of the OTUs spanned the whole spermatophyta clade from gymnosperms to angiosperms (Fig. 4), repre-
senting a total of 10 orders. In gymnosperms only the Pinaceae family was represented, while in angiosperms a
higher number of families known to encompass species with anemophilous pollination was identified, spanning
both monocotyledons and dicotyledons. In dicotyledons, both rosids and fabids clades were represented. While
Pinaceae and Poaceae were identified also by light microscopy analyses, Fabaceae were identified exclusively by
DNA metabarcoding. The two families with the highest numbers of reads, Pinaceae and Fabaceae, encompassed
alone > 60% of the reads that could be identified. While in general the number of reads was often higher in fami-
lies with higher numbers of taxa (see, e.g. Poaceae, Fabaceae and Pinaceae), the Caprifoliaceae were represented
by only one genus (Lonicera; Fig. 4; Supplementary Table S2). In the case of sequences identified as Ficus carica,
a curated BlastN search was carried out to the NCBI nucleotide database, resulting in the high-confidence iden-
tification of the sequences as Broussonetia papyrifera (L.) Vent., an invasive species of Asian origin.
The overall diversity is shown in the doughnut chart of Fig. 5, where each sample is symbolized by a circle,
with the arch width proportional to the frequency of plant families. Plant biodiversity is clearly changing from
one sample to another, supporting the estimated different flowering periods and years, as suggested by conven-
tional light microscopy pollen analyses too.
When analyzed by Chao1 and Shannon diversity indices, the alpha diversity estimated for the samples resulted
in a large range of values. Both indices assigned a very high alpha diversity to samples PI3 and PI5 and low alpha
diversity for sample PI4 (Fig. 6).
Scientific Reports | (2021) 11:1208 | https://doi.org/10.1038/s41598-020-79738-5 5
Vol.:(0123456789)www.nature.com/scientificreports/
Figure 5. Doughnut chart showing plant diversity at family level at the six depths of the firn core. Relative
abundances of taxa are symbolized by the width of the corresponding arch. Unclassified represents plant taxa
with no blast hit in the reference database.
Figure 6. Alpha diversity by sample. The number of observed OTUs has been plotted for each sample, Chao1
and Shannon entropy diversity indices are reported. The bars are the standard errors as defined for the Chao1
model for estimating richness.
Scientific Reports | (2021) 11:1208 | https://doi.org/10.1038/s41598-020-79738-5 6
Vol:.(1234567890)www.nature.com/scientificreports/
The overall results (Supplementary Table S2) described 36 different plant taxa, with different taxonomic
resolution. eDNA metabarcoding, associated with high throughput sequencing, assigned taxonomy mostly to
the species level (21; 58.3%). In only one case the taxonomy was assigned to more than one species of the same
genus (2.8%); in three cases to the genus level (8.3%) and in other three to more than one genus in the same
family (8.3%). Assignments at the family level covered 8 cases (22.2%).
Discussion
In this study we tested whether metabarcoding of eDNA using the P6 loop of the plastid DNA trnL (UAA)
intron14 could be used as a proxy of vascular plant diversity when analyzing surface layers of the largest Ital-
ian glacier, the Adamello Glacier. The high sequence diversity of the trnL p6 loop r egion14 allowed us to use
a stringent cutoff of 99% sequence identity for the taxonomic assignment of the OTUs, higher than the 97%
adopted by similar studies (e.g.15,52). Despite the reduced length of the barcode marker sequence (138–152 bp,
depending on the taxa), such approach resulted in a higher accuracy of the taxonomic assignment, as com-
pared with that achievable by conventional palynology3. As expected, the two methods did not provide fully
overlapping taxonomic representations, as indicated by the method-specific identification of some of the taxa.
Palynological analyses by conventional light microscopy, however, were performed on a low number of samples,
since they aimed mainly at confirming the presence of pollen rather than to compare the two approaches, as
this has been extensively done in previous studies (reviewed in53). Additionally, as shown by the conventional
light microscopy analysis, glacier ice trapped, besides pollen grains, also plant remains, likely blown by wind
during storms54, which can further contribute to assess plant species composition of the surrounding area, and
to consider palynological and molecular analyses as complementary tools for biodiversity assessment53. Also
the taphonomic processes acting on the pollen grains in the ice archive can contribute, at least in part, to the
observed differences between the taxa identified by the two methods, although taphonomy of eDNA from glaciers
remains largely to be investigated. Compared to eDNA from lake sediments, where extracellular DNA has been
suggested to constitute the major c omponent18, extracellular DNA in the ice samples of a temperate glacier as
Adamello is expected to be a minor fraction for the following reasons: (1) repeated cycles of freezing and thawing
can mechanically degrade exposed DNA through c ryolysis55; (2) extracellular DNA in the ice cannot complex
with soil particles, which have been demonstrated to protect it from nuclease action17,56; (3) If dissolved in melt-
ing water, despite the low temperature, the DNA is exposed to hydrolysis, due to the low ionic strength and to
physical degradation due to UV e xposure18,57,58; (4) once dissolved in melting water extracellular DNA can be
diluted below the detection limit or completely removed through percolation. As the visual stratigraphy and
the stable isotope analyses we carried out suggest significant processes of meltwater percolation and refreezing
of the ice core, we suggest that the majority of DNA analyzed by metabarcoding is of intracellular origin, both
from pollen grain and plant debris. The lack of Cupressaceae and Taxaceae sequences from the metabarcod-
ing record is in line with this scenario, as for these families, the exine layer of pollen walls is known to be very
thin and easily broken59,60, causing the release of the pollen protoplast due to pollen bursting61. Once in the low
ionic strength meltwater, the protoplasts can undergo rupture by hypo-osmotic stress and release their DNA
extracellularly. Analogous taphonomic processes may differentially affect DNA preservation as well as transport
processes in different species, possibly causing a partially biased representation of the plant biodiversity of the
palynological catchment area.
In this study, eDNA was analyzed at six depth ranges, for a total length of about 6 m. The marked variations
among ice core fractions detected by both the palynological and the isotope ratio analyses suggested that the
investigated ice layers correspond to multiple seasons, possibly in the range between 4 to 6 years. The progressive
reduction of signal in the stable isotope ratio data suggested a possible modification in the solid precipitation after
the deposition, by processes of meltwater percolation and refreezing, which can reduce seasonal isotopic signals,
induce isotopic enrichment and introduce time gaps62. This could be the case for the sampled ice core described
by these analyses; deeper drilling in additional locations will allow to ascertain whether melt-affected ice is a
general feature of the Adamello glacier or if it is a local peculiarity at the drilling site. Due to these processes,
chemical signals are generally susceptible to various modifications which can affect the quality and quantity
of information when analyzed on temperate glaciers. Palynological analyses, on the contrary, demonstrated to
provide valuable information even when in temperate glaciers, where low latitude and climatic conditions do not
guarantee freezing temperatures all year l ong31, due to the stability of these biological particles in the ice layers.
In general, the taxonomic representation resulting from eDNA metabarcoding was surprisingly broad, reflect-
ing many plant species from the families of Betulaceae, Fagaceae, Oleaceae, Pinaceae, Poaceae and Urticaceae,
typical of the alpine habitats at different elevations within the palynological catchment area of the Adamello
glacier63. In our study, species accumulation curve reached saturation (see Supplementary Fig. S1), indicating the
exhaustive sampling of almost all species present in DNA samples. Moreover, taxonomic assignment after eDNA
metabarcoding was performed against a custom-made reference d atabase16, ensuring data quality by a robust set
of reference DNA sequences, as suggested b y64. The only OTU identified by eDNA metabarcoding which could
not directly be explained by the custom reference database used in this study, was the OTU initially identified
as Ficus carica, a mediterranean species, which does not spontaneously grow in the immediate proximity of the
glacier. Manual curation of the homology search, however, easily fixed the representativeness problem and iden-
tified the taxon as Broussonetia papyrifera, an invasive species, occasionally naturalized, and present in several
Italian regions, including Trentino, Alto-Adige and Lombardy, which surround the Adamello glacier65. Recently,
B. papyrifera has been recognized as a source of pollinoses in A sia66, and it is currently object of monitoring by
PollNet, the Italian network of aerobiological monitoring centres (http://www.snpamb iente .it/2019/05/10/primo
-studio -in-italia -sulla- distri buzio
ne-del-pollin
e-di-brouss oneti a-papyri fera/ downloaded at February 28, 2020).
The small size of B. papyrifera pollen, closely similar to Urticaceae pollen, explains its high dispersal ability. The
Scientific Reports | (2021) 11:1208 | https://doi.org/10.1038/s41598-020-79738-5 7
Vol.:(0123456789)www.nature.com/scientificreports/
Figure 7. Study area location in Italy, with the Adamello glacier (in blue stripes) and drilling site (red dot).
detection of B. papyrifera pollen on the Adamello glacier indicates the high potential of glacier ice as a proxy of
vascular plant diversity of the catchment area, including even alien/invasive species.
Nowadays the integration of the DNA metabarcoding and the morphological approaches represent the best
way to investigate the major part of the ecological sites67. Despite the accuracy of DNA metabarcoding analysis
is strictly related to the reference database used and its quantification capability is still under study68, the advan-
tages of the metabarcoding approach (overcoming the morphological approach limits, low cost and low time
consumption) make it a fundamental method for ecological s urvey6,53.
In conclusion, we demonstrated for the first time that a biological signal is archived in the accumulation
basin of the Adamello glacier and that eDNA metabarcoding is a feasible technique when applied to eDNA of
firn and ice of Alpine glaciers. Moreover, eDNA metabarcoding gives a high-ranking taxonomic resolution to
pollen signal, capable of disclosing plant biodiversity of the palynological catchment area, estimated by the traces
of pollen and plant remains archived in this Alpine temperate glacier. The potential of sampling glacier DNA
with eDNA metabarcoding will need to be further investigated in other glaciers and to different depths, to fully
exploit the wealth of information still contained in these important archives of natural plant biodiversity. The
relevance of this information on heavily endangered sites could improve existing knowledge on plant biodiversity
changes during the past in large catchment areas and on the link of these changes to distinct climatic condi-
tions, leading to results that could be applied on estimates of climate change effects on the future vegetational
composition of the ecosystem.
Methods
Study site. The drilling site (coordinates UTMWGS84, E 617616–N 5111704) is located on Pian di Neve, the
vast plateau that represents the accumulation basin of the Adamello Glacier which is situated between Brescia
and Trento provinces in the Adamello-Presanella group (Fig. 7). Recent seismic geophysical surveys estimated
the maximum thickness of the glacier (270 m;69) and the main directions of the glacial flows.
Adamello Glacier has been classified as a unique glacial u nit70 and comprises the six units in which the gla-
cier was divided in the Inventory of the Italian Glaciological C ommittee71: Miller Superiore (CGI n.600), Corno
Salarno (CGI n.603), Salarno (CGI n. 604), Adamello or Pian di Neve (CGI n.608), Adamè (CGI n.609) and
Mandrone (CGI n. 639). Considered in its entirety, Adamello Glacier can be classified as a Scandinavian summit
glacier72,73. More precisely, it should be classified as a plateau glacier with radial tongues.
Pian di Neve is a large accumulation area from which the different tongues originate, the main of which is
channeled towards the Val Genova (Mandrone Glacier). Pian di Neve plateau receives the contribution of other
Scientific Reports | (2021) 11:1208 | https://doi.org/10.1038/s41598-020-79738-5 8
Vol:.(1234567890)www.nature.com/scientificreports/
glacial flows originating from both the north (Corno Bianco) and the south-west (Corno di Miller, Corno di
Salarno and Cornetto di Salarno).
Adamello Glacier is fed by direct snowfall. In recent years the snow limit has often been placed at very high
altitudes and the entire central glacier sector, including Pian di Neve, has been found in ablation conditions.
The accumulation areas are reducing their size and are now concentrated in correspondence with the highest
cirques, both in the eastern and western glacier sectors. Moreover, the open morphology reduces the shading
effect due to the rocky ridges that delimit it.
Adamello Glacier is currently the largest glacier in the Italian Alps, with an area of 15.5 km2 in 2015 (data
downloadable at https://webgis.provincia.tn.it, update 2015 by Casarotto, C. and Trenti, A., accessed 28 April
2020). The total area of the glacier exceeded 30 k m2 in 186474; it was 17.97 km2 between the years 1959–196170,
18 km2 in 198775, 17.63 km2 in 199776 and 16.44 km2 in 2011 (orthophotos by Autonomous Province of Trento).
Mandrone Glacier has retreated about 2 km from 1820, at the end of the Little Ice Age. From 1984 to 2014 the
glacier front retreated 243 m, with an average annual shrinkage of about 8 m (data from the Italian Glaciological
Committee). Following this retreatment, the Adamello Glacier is fragmenting, leading to the isolation of glaciers
that remain localized in small glacial cirques.
As regards the only Trentino sector, the current area (2013) is 78.5 ha. In 1987 it was 141.6 ha, while in 2003 it
was 123.8 ha. The annual percentage reduction was 0.78% in the period 1987–2003 and then increased to 3.66%
in the decade 2003–2013. These data show that in the last period the annual reduction rate was 4 times higher
than in the previous period 1987–200377.
Ice core processing and visual stratigraphy. A 573 cm long core was drilled through the Adamello
glacier (Trentino, Italy) in March 2015, by a mechanical drill system (SIPRE type, USA), with a core diameter of
100 mm and length of approximately 60 cm for each section. The sampled core was cut at Eurocold Lab, Univer-
sity of Milano Bicocca, in 5 cm sections for the stable isotope ratio analysis, and 10 cm sections for environmen-
tal DNA (eDNA) analyses. Samples were stored at − 20 °C. Thin sections, 1 mm thick, were cut from the ice core
and placed between two crossed polarization filters. Size and orientation of the ice crystals were evaluated by the
different color of the crystals, due to the polarization of the light.
Stable isotope ratio. Samples were thawed at room temperature in hermetically sealed tubes. As described
in previous p apers78,79, the ratio 18O/16O of water was analysed using an isotope ratio mass spectrometer
(Isoprime, Manchester, UK) interfaced with an on-line automatic system that allows CO2/H2O equilibration
(Multiflow, Isoprime, Manchester, UK). For the analysis of ratio 2H/1H of water, 200 μl of water together with
Hokko bead platinum catalyst (Isoprime) were introduced into a reaction vessel, which was then attached to
the online automatic equilibration system and filled with He containing 10% of H 2. The ratios 18O/16O and
2 1 18 2
H/ H were expressed as delta per thousand (δ O and δ H‰), computed by comparing the isotope ratios of the
sample to those of the international reference standard V-SMOW (Vienna-Standard Mean Ocean Water, IAEA-
International Atomic Energy Agency, Vienna, Austria) on a scale normalized by assigning the consensus value
of − 55.5‰ to V-SLAP (Standard Light Antarctic Precipitation, water, IAEA). For calibration, working in-house
standards (tap water) calibrated against V-SMOW and V-SLAP were used. Analytical uncertainty (1 standard
deviation) of δ2H and δ18O analysis was < 2 and < 0.2 ‰, respectively.
Light microscopy pollen analysis. In order to verify the presence of pollen grains within the ice core,
random samples, about 35 ml each were concentrated and processed with a cetolysis80. Afterwards, pollen was
mounted on slides, coloured with basic fuchsin and analysed by light microscopy (400 × magnification) for the
identification of pollen grains by means of standard identification keys81, and comparison to a local pollen col-
lection (Fondazione Mach pollen reference collection) and to pollen atlas (http://pollini.iasma.it/polimage;82).
Environmental DNA sample processing and extraction. Ten cm-long samples were thawed in sterile
glass containers in a refrigerator for 24 h and subsampled for eDNA, as to be equally represented in the result-
ing composite samples. The six composite samples covered the entire length of the ice core, representing the
following relative depth from the top: 0–172 cm (PI1); 173–275 cm (PI2); 276–449 cm (PI3); 450–489 cm (PI4);
490–509 cm (PI5); 510–573 cm (PI6).
A 36 ml aliquot of each composite sample, together with a negative control, was individually concentrated
(Concentrator Plus, Eppendorf, Hamburg, Germany) to a final volume of 100 µl (6 to 7 h).
DNA extraction protocols were applied under a high performance Class II biosafety cabinet in a non-invasive
DNA laboratory, free from contaminant small DNAs. Details on the procedures and controls used to prevent
and identify contaminations are provided in Supplementary Methods. An automated high throughput (HTP),
magnetic-bead based isolation of genomic DNA was performed by NucleoMag Plant, (Macherey–Nagel, Düren,
Germany) and KingFisher Flex platform (Thermo Scientific, MA USA). Cell lysis was promoted by mechanical
disruption (Mixer Mill MM200, Retsch GmbH, Germany). In order to control contamination during extraction,
samples were loaded in plates, following a design where empty wells surrounded each sample (see Supplementary
methods). The final elution volume for all samples was 100 µl.
Library preparation and sequencing. Total eDNA was subjected to PCR amplification by targeting
a ~ 140-bp fragment of the P6 loop region within the chloroplast trnL (UAA) intron (Taberlet et al. 2007). The
specific chloroplast DNA primers set c pos. 49,325 (5′-CGAAATCGGTAGACGCTACG-3′) and h pos. 49,466
(5′-CCATTGAGTCTCTGCACCTATC-3′) were used, fitted with overhang Illumina adapters.
Scientific Reports | (2021) 11:1208 | https://doi.org/10.1038/s41598-020-79738-5 9
Vol.:(0123456789)www.nature.com/scientificreports/
Each sample (negative controls and blank included) was amplified by a 1 st round of PCR using 50 µl reaction
with 1 µM of each primer. More in detail, 10 µl of 5 × GO Taq Flexi Buffer and 2 µl forward and reverse prim-
ers, were used in combination with 5 µl of template DNA (5 ng/µl), 6 µl MgCl2 25 mM, 0.25 µl dNTP 40 mM
and 0.25 µl GO Taq Flexi [5U/µl]. PCR reactions were executed in triplicates by a Veriti 96 well thermal cycler
(Applied Biosystems, Foster City, CA, USA) at the following cycling conditions: initial denaturation step at 95 °C
for 2 min (one cycle); 40 cycles at 95 °C for 15 s, 52 °C for 15 s, 72 °C for 30 s; final extension step at 72 °C for
5 min (1 cycle).
The amplification products in triplicate were pooled, subsequently the amplicons library construction and the
high throughput sequencing were performed at the FEM Sequencing Platform using an Illumina MiSeq (MiSeq
Control Software 2.5.0.5 and Real-Time Analysis software 1.18.54.0).
Bioinformatics analysis. Raw reads were processed with the MICrobial Community Analysis software
MICCA v. 1.7.283 by setting the OTUs clustering at the 99% sequence similarity level and 75% query coverage,
and, subsequently, OTU classification was performed against the BioAir reference d atabase16. Chao1 and Shan-
non indices were estimated to calculate alpha diversity in terms of OTUs richness and diversity. Taxonomic tree
for the OTUs was reconstructed using the NCBI taxonomy and visualized in FigTree v. 1.4.4. Manual curation
of samples was carried out by BLAST analysis of selected sequences to the Nucleotide Database of the National
Center for Biotechnology Information (NCBI, 8600 Rockville Pike, Bethesda MD, 20894 USA).
Data availability
Raw sequences were deposited in the European Nucleotide Archive ENA-EMBL, under the accession number
PRJEB28043.
Received: 11 May 2020; Accepted: 13 November 2020
References
1. Millennium Ecosystem Assessment. Ecosystems and human well-being: Biodiversity synthesis (World Resources Institute, Wash-
ington, DC, 2005). http://www.millenniumassessment.org/documents/document.354.aspx.pdf (accessed 22 April 2020).
2. Willis, K. & Birks, H. What is natural? The need for a long-term perspective. Science 314(5803), 1261–1266. https: //doi.org/10.1126/
science.1122667 (2006).
3. Birks, H. J. B. et al. Does pollen-assemblage richness reflect floristic richness? A review of recent developments and future chal-
lenges. Rev. Palaeobot. Palynol. 228, 1–25. https://doi.org/10.1016/j.revpalbo.2015.12.011 (2016).
4. Li, K., Liao, M., Ni, J., Liu, X. & Wang, Y. Treeline composition and biodiversity change on the southeastern Tibetan Plateau during
the past millennium, inferred from a high-resolution alpine pollen record. Quat. Sci. Rev. 206, 44–55. https://doi.org/10.1016/j.
quascirev.2018.12.029 (2019).
5. Bálint, M. et al. Environmental DNA time series in ecology. Trends Ecol. Evol. 33, 945–957. https://doi.org/10.1016/j.
tree.2018.09.003 (2018).
6. Garlapati, D., Charankumar, B., Ramu, K., Madeswaran, P. & Ramana Murthy, M. V. A review on the applications and recent
advances in environmental DNA (eDNA) metagenomics. Rev. Environ. Sci. Biotechnol. 18, 389–411. https: //doi.org/10.1007/s1115
7-019-09501-4 (2019).
7. Hebert, P. D. N., Cywinska, A., Ball, S. L. & DeWaard, J. R. Biological identifications through DNA barcodes. Proc. R. Soc. B Biol.
Sci. 270, 313–321. https://doi.org/10.1098/rspb.2002.2218 (2003).
8. Kress, W. J. & Erickson, D. L. DNA barcodes: Genes, genomics, and bioinformatics. Proc. Natl. Acad. Sci. USA 105, 2761–2762.
https://doi.org/10.1073/pnas.0800476105 (2008).
9. CBOL Plant Working Group. A DNA barcode for land plants. Proc. Natl. Acad. Sci. USA 106, 12794–12797. https: //doi.org/10.1073/
pnas.0905845106 (2009).
10. China Plant BOL Group. Comparative analysis of a large dataset indicates that internal transcribed spacer (ITS) should be incor-
porated into the core barcode for seed plants. Proc. Natl. Acad. Sci. USA 108, 19641–19646. https://doi.org/10.1073/pnas.11045
51108(2011).
11. Li, X. W. et al. Plant DNA barcoding: From gene to genome. Biol. Rev. Camb. Philos. 90, 157–166. https: //doi.org/10.1111/brv.12104
(2015).
12. Fior, S. et al. Spatiotemporal reconstruction of the Aquilegia rapid radiation through next-generation sequencing of rapidly evolv-
ing cpDNA regions. New Phytol. 198, 579–592. https://doi.org/10.1111/nph.12163 (2013).
13. Staats, M. et al. Advances in DNA metabarcoding for food and wildlife forensic species identification. Anal. Bioanal. Chem. 408,
4615–4630. https://doi.org/10.1007/s00216-016-9595-8 (2016).
14. Taberlet, P. et al. Power and limitations of the chloroplast trnL (UAA) intron for plant DNA barcoding. Nucleic Acids Res. 35, e14.
https://doi.org/10.1093/nar/gkl938 (2007).
15. Kraaijeveld, K. et al. Efficient and sensitive identification and quantification of airborne pollen using next-generation DNA sequenc-
ing. Mol. Ecol. Resour. 15, 8–16. https://doi.org/10.1111/1755-0998.12288 (2015).
16. Leontidou, K. et al. DNA metabarcoding of airborne pollen: New protocols for improved taxonomic identification of environmental
samples. Aerobiologia 34, 63–74. https://doi.org/10.1007/s10453-017-9497-z (2018).
17. Parducci, L. et al. Ancient plant DNA in lake sediments. New Phytol. 214, 924–942 (2017).
18. Giguet-Covex, C. et al. New insights on lake sediment DNA from the catchment: Importance of taphonomic and analytical issues
on the record quality. Sci. Rep. 9, 1–21 (2019).
19. Bovo, S. et al. Shotgun metagenomics of honey DNA: Evaluation of a methodological approach to describe a multi-kingdom honey
bee derived environmental DNA signature. PLoS ONE 13, 1–19. https://doi.org/10.1371/journal.pone.0205575 (2018).
20. Yoccoz, N. G. et al. DNA from soil mirrors plant taxonomic and growth form diversity. Mol. Ecol. 21, 3647–3655 (2012).
21. Parducci, L. et al. Shotgun environmental DNA, pollen, and macrofossil analysis of lateglacial lake sediments from southern
Sweden. Front. Ecol. Evol. https://doi.org/10.3389/fevo.2019.00189 (2019).
22. Alsos, I. G. et al. Plant DNA metabarcoding of lake sediments: How does it represent the contemporary vegetation. PLoS ONE 13,
1–23. https://doi.org/10.1371/journal.pone.0195403 (2018).
23. Willerslev, E. et al. Ancient biomolecules from deep ice cores reveal a forested southern Greenland. Science 317, 111–114. https://
doi.org/10.1126/science.1141758 (2007).
Scientific Reports | (2021) 11:1208 | https://doi.org/10.1038/s41598-020-79738-5 10
Vol:.(1234567890)www.nature.com/scientificreports/
24. Willerslev, E. et al. Diverse plant and animal genetic records from holocene and pleistocene sediments. Science 300, 791–795
(2003).
25. Willerslev, E. et al. Fifty thousand years of Arctic vegetation and megafaunal diet. Nature 506, 47–51. https: //doi.org/10.1038/natur
e12921 (2014).
26. Zimmermann, H. et al. Sedimentary ancient DNA and pollen reveal the composition of plant organic matter in Late Quaternary
permafrost sediments of the Buor Khaya Peninsula (north-eastern Siberia). Biogeosciences 14, 575–596. https://doi.org/10.5194/
bg-14-575-2017 (2017).
27. Alaeddini, R. Forensic implications of PCR inhibition—A review. Forensic Sci. Int. Genet. 6, 297–305. https://doi.org/10.1016/j.
fsigen.2011.08.006 (2012).
28. Haeberli, W. & Alean, J. Temperature and accumulation of high altitude firn in the alps. Ann. Glaciol. 6, 161–163. https://doi.
org/10.3189/1985AoG6-1-161-163 (1985).
29. Bennett, K. D. & Buck, C. E. Interpretation of lake sediment accumulation rates. Holocene 26, 1092–1102. https://doi.
org/10.1177/0959683616632880 (2016).
30. Festi, D. et al. A novel pollen-based method to detect seasonality in ice cores: A case study from the Ortles glacier, South Tyrol,
Italy. J. Glaciol. 61, 815–824. https://doi.org/10.3189/2015JoG14J236 (2015).
31. Nakazawa, F. Application of pollen analysis to dating of ice cores from lower-latitude glaciers. J. Geophys. Res. 109, 168–170. https
://doi.org/10.1029/2004JF000125 (2004).
32. Nakazawa, F. et al. Dating of seasonal snow/firn accumulation layers using pollen analysis. J. Glaciol. 51, 483–490. https://doi.
org/10.3189/172756505781829179 (2005).
33. Nakazawa, F. et al. Establishing the timing of chemical deposition events on Belukha Glacier, Altai Mountains, Russia, using Pollen
analysis. Arctic Antarct. Alp. Res. 43, 66–72. https://doi.org/10.1657/1938-4246-43.1.66 (2011).
34. Nakazawa, F., Konya, K., Kadota, T. & Ohata, T. Reconstruction of the depositional environment upstream of Potanin Glacier,
Mongolian Altai, from pollen analysis. Environ. Res. Lett. 7, 035402. https://doi.org/10.1088/1748-9326/7/3/035402 (2012).
35. Santibañez, P. et al. Glacier mass balance interpreted from biological analysis of firn cores in the Chilean lake district. J. Glaciol.
54, 452–462. https://doi.org/10.3189/002214308785837101 (2008).
36. Uetake, J. et al. Biological ice-core analysis of Sofiyskiy glacier in the Russian Altai. Ann. Glaciol. 43, 70–78. https://doi.
org/10.3189/172756406781811925 (2006).
37. Andreev, A. A., Nikolaev, V. I., Boi’sheiyanov, D. Y. & Petrov, V. N. Pollen and isotope investigations of an ice core from
Vavilov ice cap, October revolution island, Severnaya Zemlya archipelago, Russia. Geogr. Phys. Quat. 51, 379–389. https://doi.
org/10.7202/033137ar (1997).
38. Liu, K. B., Reese, C. A. & Thompson, L. G. A potential pollen proxy for ENSO derived from the Sajama ice core. Geophys. Res. Lett.
34, 1–5. https://doi.org/10.1029/2006GL029018 (2007).
39. Reese, C. A., Liu, K. B. & Thompson, L. G. An ice-core pollen record showing vegetation response to Late-glacial and Holocene
climate changes at Nevado Sajama, Bolivia. Ann. Glaciol. 54, 183–190. https://doi.org/10.3189/2013AoG63A375 (2013).
40. Papina, T. et al. Biological proxies recorded in a Belukha ice core, Russian Altai. Clim. Past 9, 2399–2411. https://doi.org/10.5194/
cp-9-2399-2013 (2013).
41. Winkler, S. et al. An introduction to mountain glaciers as climate indicators with spatial and temporal diversity. Erdkunde 64,
97–118. https://doi.org/10.3112/erdkunde.2010.02.01 (2010).
42. Citterio, M. et al. The fluctuations of Italian glaciers during the last century: A contribution to knowledge about alpine glacier
changes. Geogr. Ann. Ser. A Phys. Geogr. 89, 167–184. https://doi.org/10.1111/j.1468-0459.2007.00316.x (2007).
43. Knoll, C. & Kerschner, H. A glacier inventory for South Tyrol, Italy, based on airborne laser-scanner data. Ann. Glaciol. 50, 46–52.
https://doi.org/10.3189/172756410790595903 (2009).
44. Diolaiuti, G., Bocchiola, D., D’agata, C. & Smiraglia, C. Evidence of climate change impact upon glaciers’ recession within the Ital-
ian Alps: The case of Lombardy glaciers. Theor. Appl. Climatol. 109, 429–445. https://doi.org/10.1007/s00704-012-0589-y (2012).
45. IPCC. Climate Change 2014: Synthesis Report. In Contribution of Working Groups I, II and III to the Fifth Assessment Report of the
Intergovernmental Panel on Climate Change (eds Core Writing Team, R.K. Pachauri and L.A. Meyer) 151 (IPCC, Geneva, 2014).
46. Maggi, V. et al. Variability of anthropogenic and natural compounds in high altitude-high accumulation alpine glaciers. Hydro-
biologia 562, 43–56. https://doi.org/10.1007/s10750-005-1804-y (2006).
47. Gabrielli, P. et al. Age of the Mt. Ortles ice cores, the Tyrolean Iceman and glaciation of the highest summit of South Tyrol since
the Northern Hemisphere Climatic Optimum. Cryosphere 10, 2779–2797. https://doi.org/10.5194/tc-10-2779-2016 (2016).
48. Bohleber, P. et al. Temperature and mineral dust variability recorded in two low-accumulation Alpine ice cores over the last mil-
lennium. Clim. Past 14, 21–37. https://doi.org/10.5194/cp-14-21-2018 (2018).
49. Rizzi, C., Finizio, A., Maggi, V. & Villa, S. Spatial–temporal analysis and risk characterisation of pesticides in Alpine glacial streams.
Environ. Pollut. 248, 659–666. https://doi.org/10.1016/j.envpol.2019.02.067 (2019).
50. Garzonio, R. et al. Mapping the suitability for ice-core drilling of glaciers in the European Alps and the Asian High Mountains. J.
Glaciol. 64, 12–26. https://doi.org/10.1017/jog.2017.75 (2018).
51. Bokulich, N. A. et al. Quality-filtering vastly improves diversity estimates from Illumina amplicon sequencing. Nat. Methods 10,
57–59. https://doi.org/10.1038/nmeth.2276 (2013).
52. Olds, B. P. et al. Estimating species richness using environmental DNA. Ecol. Evol. 6, 4214–4226. https: //doi.org/10.1002/ece3.2186
(2016).
53. Deiner, K. et al. Environmental DNA metabarcoding: Transforming how we survey animal and plant communities. Mol. Ecol. 26,
5872–5895. https://doi.org/10.1111/mec.14350 (2017).
54. Soons, M. B. & Ozinga, W. A. How important is long-distance seed dispersal for the regional survival of plant species?. Divers.
Distrib. 11, 165–172. https://doi.org/10.1111/j.1366-9516.2005.00148.x (2005).
55. Lyscov, V. N. & Moshkovsky, Y. S. DNA cryolysis. Biochim. Biophys. Acta 190, 101–110 (1969).
56. Pietramellara, G. et al. Extracellular DNA in soil and sediment: Fate and ecological relevance. Biol. Fertil. Soils 45, 219–235 (2009).
57. Lindahl, T. & Nyberg, B. Rate of depurination of native deoxyribonucleic acid. Biochemistry 11, 3610–3618 (1972).
58. Strickler, K. M., Fremier, A. K. & Goldberg, C. S. Quantifying effects of UV-B, temperature, and pH on eDNA degradation in
aquatic microcosms. Biol. Conserv. 183, 85–92 (2015).
59. Bortenschlager, S. Aspects of pollen morphology in the Cupressaceae. Grana 29, 129–137 (1990).
60. Kurmann, M. H. Pollen morphology and ultrastructure in the Cupressaceae. Acta Bot. Gall. 141, 141–147 (1994).
61. Chichiriccò, G. & Pacini, E. Cupressus arizonica pollen wall zonation and in vitro hydration. Plant Syst. Evol. 270, 231–242 (2008).
62. Moran, T., Marshall, S. J. & Sharp, M. J. Isotope thermometry in melt-affected ice cores. J. Geophys. Res. Earth Surf. 116, 1–10.
https://doi.org/10.1029/2010JF001738 (2011).
63. Baroni, C., Armiraglio, S., Gentili, R. & Carton, A. Landform-vegetation units for investigating the dynamics and geomorphologic
evolution of alpine composite debris cones (Valle dell’Avio, Adamello Group, Italy). Geomorphology 84, 59–79 (2007).
64. Coissac, E., Riaz, T. & Puillandre, N. Bioinformatic challenges for DNA metabarcoding of plants and animals. Mol. Ecol. 21,
1834–1847. https://doi.org/10.1111/j.1365-294X.2012.05550.x (2012).
65. Celesti-Grapow, L. et al. (eds) Flora vascolare alloctona e invasiva delle regioni d’Italia (Casa Editrice Università La Sapienza, Roma,
2010).
Scientific Reports | (2021) 11:1208 | https://doi.org/10.1038/s41598-020-79738-5 11
Vol.:(0123456789)www.nature.com/scientificreports/
66. Wu, P.-C., Su, H.-J., Lung, S.-C.C., Chen, M.-J. & Lin, W.-P. Pollen of Broussonetia papyrifera: An emerging aeroallergen associated
with allergic illness in Taiwan. Sci. Total Environ. 657, 804–810. https://doi.org/10.1016/j.scitotenv.2018.11.324 (2019).
67. Kelly, R. P. et al. Genetic and manual survey methods yield different and complementary views of an ecosystem. Front. Mar. Sci.
3, 1–11. https://doi.org/10.3389/fmars.2016.00283 (2017).
68. Baksay, S. et al. Experimental quantification of pollen with DNA metabarcoding using ITS1 and trnL. Sci. Rep. 10, 4202. https://
doi.org/10.1038/s41598-020-61198-6 (2020).
69. Picotti, S., Francese, R., Giorgi, M., Pettenati, F. & Carcione, J. M. Estimation of glacier thicknesses and basal properties using the
horizontal-to-vertical component spectral ratio (HVSR) technique from passive seismic data. J. Glaciol. 63, 229–248. https://doi.
org/10.1017/jog.2016.135 (2017).
70. Smiraglia, C. et al. The evolution of the Italian glaciers from the previous data base to the new Italian inventory. Preliminary
considerations and results. Geogr. Fis. e Din. Quat. 38, 79–87. https://doi.org/10.4461/GFDQ.2015.38.08 (2015).
71. Comitato Glaciologico Italiano & Consiglio Nazionale delle Ricerche. Catasto dei ghiacciai italiani. Anno geofisico 1957–1958.
Volume III—Ghiacciai della Lombardia e dell’Ortles-Cevedale. (Comitato Glaciologico Italiano, Torino, 1961).
72. Marson, L. Sui ghiacciai dell’Adamello – Presanella (alto bacino del Sarca – Mincio). Boll. Soc. Geogr. It. 7, 546–568 (1906).
73. Servizio Glaciologico Lombardo. Ghiacciai in Lombardia (Edizioni Bolis, Bergamo, 1992).
74. Payer, J. Originalkarte der Adamello-Presanella Alpen, scala di 1:56.000. In Pajer J. - Die Adamello-Presanella Alpen nach den
Forschungen und Aufnahmen, Petermanns Geogr. Mitt. Erganzungs-Hefte, 11 (17) (Gotha, 1865).
75. Bombarda, R. Il cuore Bianco. Guida ai ghiacciai del Trentino (Edizioni Arca, 1996).
76. Baroni, C., Carton, A. & Casarotto, C. I ghiacciai dell’Adamello. In: Itinerari Glaciologici sulle montagne italiane (ed. Comitato
Glaciologico Italiano) Vol. 3 (Società Geologica Italiana, Roma, 2017).
77. Bertoni, E. & Casarotto, C. Estensione dei ghiacciai trentini dalla fine della Piccola Età glaciale a oggi. Rilevamento sul terreno,
digitalizzazione GIS e analisi. (2015). Progetto finanziato dal Servizio sviluppo sostenibile e aree protette della PAT (rif. prot. n.
P001/0640691/29-2014-16 dd. 2/12/2014) (accessed on 27 April 2020). http://www.climatrentino.it/binary/pat_climaticamente/
osservatorio_trentino_clima/2014_Estensione_dei_ghiacciai_dalla_fine_della_Piccola_Et_Glaciale_a_oggi_MUSE_.1462456788
.pdf.
78. Abeni, F. et al. Hydrogen and oxygen stable isotope fractionation in body fluid compartments of dairy cattle according to season,
farm, breed, and reproductive stage. PLoS ONE 10(5), e0127391. https://doi.org/10.1371/journal.pone.0127391 (2015).
79. Bocchiola, D., Bombelli, G. M., Camin, F. & Ossi, P. M. Field study of mass balance, and hydrology of the West Khangri Nup Glacier
(Khumbu, Everest). Water 12(2), 433. https://doi.org/10.3390/w12020433 (2020).
80. Erdtman, G. The acetolysis method, A revised description. Svensk Bot. Tidskr. 54, 561–569 (1960).
81. Faegri, K. & Iversen, J. Textbook of Pollen Analysis (Wiley, London, 1989).
82. Bucher, E., Kofler, V., Vorwohl, G. & Zieger, E. Lo spettro pollinico dei mieli dell’Alto Adige (Laboratorio Biologico, Agenzia Pro-
vinciale per l’Ambiente, Laives, Bolzano. 2004).
83. Albanese, D. et al. MICCA: Aa complete and accurate software for taxonomic profiling of metagenomic data. Sci. Rep. 5, 9743
(2015).
Acknowledgements
The authors would gratefully acknowledge the Autonomous Province of Trento for the logistic help and Stefano
Banfi (University of Milano Bicocca) for the technical help during the 2015 field campaign. We also thank
Marco Filipazzi for the help in core sample preparation and Maria Cristina Viola (Fondazione Edmund Mach)
for the help with pollen counts. We are also grateful to Daniela Festi (Innsbruck University) and Cristiano
Vernesi (Fondazione Edmund Mach) for their actual and scientific support. Special thanks are due to the FEM
Sequencing platform staff.
Author contributions
C.V. contributed to data analysis and interpretation, preparation of figures and writing of the main manuscript
text. C.C., V.M. contributed to the conceptualization of the idea, design of the work, data acquisition and analysis,
writing of the manuscript and preparation of figures. E.B. contributed to the design of the work, data acquisi-
tion and writing of the manuscript. F.C., M.P. contributed to data acquisition and analysis and writing of the
manuscript. MG contributed to lab methodology. A.C. conceived and conceptualized the idea, designed the
work, contributed to data acquisition, analysis, curation and visualization, wrote the original draft, supervised
the study. All authors reviewed the manuscript.
Competing interests
The authors declare no competing interests.
Additional information
Supplementary Information The online version contains supplementary material available at https://doi.
org/10.1038/s41598-020-79738-5.
Correspondence and requests for materials should be addressed to A.C.
Reprints and permissions information is available at www.nature.com/reprints.
Publisher’s note Springer Nature remains neutral with regard to jurisdictional claims in published maps and
institutional affiliations.
Scientific Reports | (2021) 11:1208 | https://doi.org/10.1038/s41598-020-79738-5 12
Vol:.(1234567890)You can also read


