A regional spatiotemporal analysis of large magnitude snow avalanches using tree rings - Natural Hazards and Earth System Sciences
←
→
Page content transcription
If your browser does not render page correctly, please read the page content below
Nat. Hazards Earth Syst. Sci., 21, 533–557, 2021
https://doi.org/10.5194/nhess-21-533-2021
© Author(s) 2021. This work is distributed under
the Creative Commons Attribution 4.0 License.

A regional spatiotemporal analysis of large
magnitude snow avalanches using tree rings
Erich Peitzsch1,2 , Jordy Hendrikx2 , Daniel Stahle1 , Gregory Pederson1 , Karl Birkeland3,2 , and Daniel Fagre1
1 USGeological Survey Northern Rocky Mountain Science Center, 215 Mather Dr., West Glacier, Montana, MT 59936, USA
2 Snowand Avalanche Lab, Department of Earth Sciences, Montana State University, Bozeman, Montana, MT 59717, USA
3 USDA Forest Service National Avalanche Center, Bozeman, Montana, MT 59771, USA

Correspondence: Erich Peitzsch (epeitzsch@usgs.gov)

Received: 5 August 2020 – Discussion started: 20 August 2020
Revised: 16 December 2020 – Accepted: 23 December 2020 – Published: 5 February 2021

Abstract. Snow avalanches affect transportation corridors          than 40 % of the regional avalanche activity. Results empha-
and settlements worldwide. In many mountainous regions,            size the importance of sample size, scale, and spatial ex-
robust records of avalanche frequency and magnitude are            tent when attempting to derive a regional large magnitude
sparse or non-existent. However, dendrochronological meth-         avalanche event chronology from tree-ring records.
ods can be used to fill this gap and infer historical avalanche
patterns. In this study, we developed a tree-ring-based
avalanche chronology for large magnitude avalanche events
(size ≥∼ D3) using dendrochronological techniques for a            1     Introduction
portion of the US northern Rocky Mountains. We used
a strategic sampling design to examine avalanche activity          1.1    Background
through time and across nested spatial scales (i.e., from in-
dividual paths, four distinct subregions, and the region). We      Snow avalanches are hazardous to human safety and infras-
analyzed 673 samples in total from 647 suitable trees col-         tructure (Mock et al., 2016; Schweizer, 2003), as well as an
lected from 12 avalanche paths from which 2134 growth dis-         important landscape disturbance affecting mountain ecosys-
turbances were identified over the years 1636 to 2017 CE.          tems (Bebi et al., 2009). In the United States, an average
Using existing indexing approaches, we developed a re-             of 27 people die in avalanche accidents each winter (CAIC,
gional avalanche activity index to discriminate avalanche          2020). Avalanches, especially large magnitude events, also
events from noise in the tree-ring record. Large magnitude         affect transportation corridors and settlements throughout
avalanches, common across the region, occurred in 30 indi-         the world. For example, avalanches impact numerous road-
vidual years and exhibited a median return interval of ap-         ways and railroad corridors in the western United States
proximately 3 years (mean = 5.21 years). The median large          (Armstrong, 1981; Hendrikx et al., 2014; Reardon et al.,
magnitude avalanche return interval (3–8 years) and the to-        2008). Consequently, understanding general avalanche pro-
tal number of avalanche years (12–18) varies throughout the        cesses and associated large magnitude avalanche return in-
four subregions, suggesting the important influence of local       tervals (RIs) is critical for local and regional avalanche fore-
terrain and weather factors. We tested subsampling routines        casters, transportation agencies, and land use planners.
for regional representation, finding that sampling 8 random           Long-term, reliable, and consistent avalanche observation
paths out of a total of 12 avalanche paths in the region cap-      records are necessary for calculating avalanche return in-
tures up to 83 % of the regional chronology, whereas four          tervals which can be used in infrastructure planning and
paths capture only 43 % to 73 %. The greatest value probabil-      avalanche forecasting operations. However, such records
ity of detection for any given path in our dataset is 40 %, sug-   are often sparse or non-existent in many mountainous re-
gesting that sampling a single path would capture no more          gions, including areas with existing transportation corri-
                                                                   dors. Thus, inferring avalanche frequency requires the use of

Published by Copernicus Publications on behalf of the European Geosciences Union.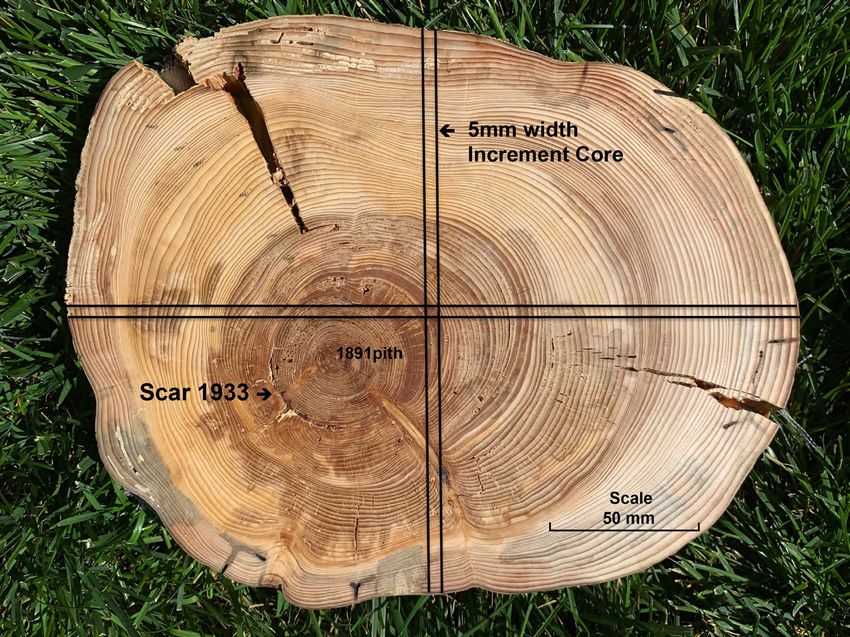
534           E. Peitzsch et al.: A regional spatiotemporal analysis of large magnitude snow avalanches using tree rings

dendrochronological methods to document damaging events           annual temporal scale, and the model scale relates to aggre-
or geomorphic response within individual trees at individ-        gating all of the sample areas to derive a regional avalanche
ual path to regional scales. Even in regions with historical      chronology.
records, tree-ring dating methods can be used to extend or           We adopt the definition of Martin and Germain (2016) that
validate uncertain historical avalanche records, which has led    large magnitude avalanches are events characterized by low
to the broad implementation of these methods in mountain-         and variable frequency with a high capacity for destruction.
ous regions throughout the world (e.g., Corona et al., 2012;      This generally translates to a size 3 or greater on the destruc-
Favillier et al., 2018; Schläppy et al., 2014).                   tive classification scale – i.e., ability to bury or destroy a car,
   Numerous studies reconstructed avalanche chronologies          damage a truck, destroy a wood frame house, or break a few
in the United States using tree-ring methods (Burrows and         trees (Greene et al., 2016).
Burrows, 1976; Butler et al., 1987; Carrara, 1979; Hebert-           Understanding the spatiotemporal behavior of large mag-
son and Jenkins, 2003; Potter, 1969; Rayback, 1998). But-         nitude avalanches on the regional scale will improve
ler and Sawyer (2008) provided a review of current method-        avalanche forecasting efforts, especially for operations in-
ologies and types of tree-ring responses used in avalanche        volving avalanche terrain that impacts transportation corri-
dendrochronological studies. Favillier et al. (2018) provided     dors. Here, we aim to answer three specific questions.
a more recent comprehensive graphical summary of den-
drochronological avalanche studies throughout the world.              1. What is the regional, subregional, and path-specific fre-
Numerous studies used dendrochronological techniques to                  quency of large magnitude avalanches in the US north-
develop avalanche chronologies for remote regions with-                  ern Rocky Mountains of northwest Montana?
out historical avalanche records or areas with inconsistent           2. How does the spatial extent of the study region affect
avalanche observations (Butler and Malanson, 1985a; Ger-                 the resulting avalanche chronology?
main et al., 2009; Reardon et al., 2008; Šilhán and Tichavský,
2017; Voiculescu et al., 2016), and many studies used these           3. What is the probability of detecting regional avalanche
techniques to examine avalanches across space and time (Ta-              activity by sampling different avalanche paths?
ble A1).
                                                                  To our knowledge, this is the first study to look at how var-
1.2   Framework and objectives                                    ious spatial scales compare when reconstructing a regional
                                                                  avalanche chronology from dendrochronological data from
Tree-ring avalanche research is resource and time intensive.      a large dataset (N > 600 samples). Further, we believe this
Like other scientific fields, it is not feasible to completely    is the first study that utilizes a regional dendrochronologi-
sample the variable of interest in infinite detail due to lo-     cal record to derive return periods over a large (> 3500 km2 )
gistical and financial constraints (Skøien and Blöschl, 2006).    spatial extent. Our hypothesis is that aggregating the paths
Thus, a strategic spatial sampling method is necessary. Here,     into subregions and then again into a full region allows us to
we strategically sampled 12 avalanche paths in four distinct      minimize the limitation of tree-ring avalanche chronologies
subregions of the US northern Rocky Mountains of north-           underestimating avalanche years at these scales.
west Montana to examine spatial differences at a regional
scale. The sampling strategy is based on the concept of scale     2     Methodology
triplet, which defines the spacing, extent, and support of our
sampling scheme (Blöschl and Sivapalan, 1995). Incorporat-        2.1    Study site
ing the scale triplet concept helps us understand the nature
of the problem, the scale at which measurements should be         Our study site consists of 12 avalanche paths in the Rocky
made, and how we can estimate the measurements across             Mountains of northwest Montana, United States (Fig. 1
space. Often the scale at which samples are collected differs     and Table 1). We sampled sets of three avalanche paths
from the scale necessary for predictive purposes (Blöschl,        in four distinct subregions within three mountain ranges:
1999). For example, if we are interested in avalanche fre-        the Whitefish Range (WF; Red Meadow Creek) and Swan
quency relationships with regional climate patterns but tree-     Range (Swan; Lost Johnny Creek) in the Flathead Na-
ring samples are collected at an avalanche path scale, then       tional Forest and two subregions within the Lewis Range in
a network of sampled paths need to be spaced and aggre-           Glacier National Park (GNP), Montana. The sites in GNP are
gated across the core of the climatically similar region. In      along two major transportation corridors through the park:
our study, the extent is the entire region and subregions, the    the Going-to-the-Sun Road (GTSR) and US Highway 2 in
spacing is the distance between avalanche paths and sub-          John F. Stevens (JFS) Canyon. These two areas were uti-
regions, and the support is the size of the area being sam-       lized for previous dendrochronological avalanche research
pled. In addition, the process scale is the natural variability   (Butler and Malanson, 1985a, b; Butler and Sawyer, 2008;
of avalanche frequency, the measurement scale is the tree-        Reardon et al., 2008). A robust regional avalanche chronol-
ring proxies used to represent avalanche occurrence on an         ogy reconstruction will help place the previous work in the

Nat. Hazards Earth Syst. Sci., 21, 533–557, 2021                                      https://doi.org/10.5194/nhess-21-533-2021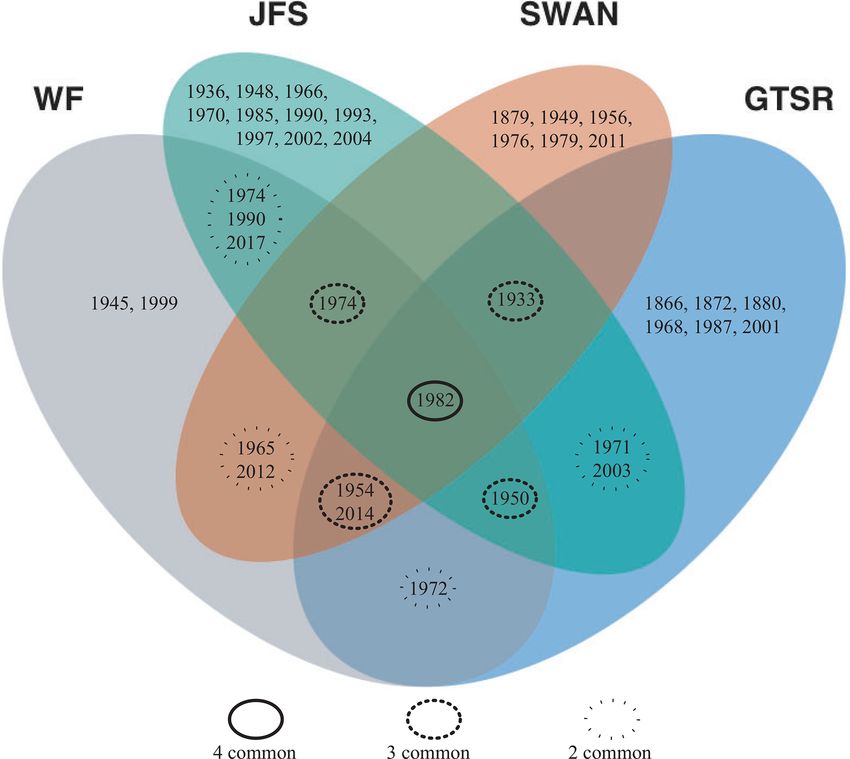
E. Peitzsch et al.: A regional spatiotemporal analysis of large magnitude snow avalanches using tree rings 535
context of the wider region. The other two sites, WF and
Swan, are popular backcountry recreation areas with access
via snow machine in the winter along a US Forest Service
road. The avalanche paths in each subregion encompass a
range of spatial extents from adjacent (i.e., < 30 m apart) to
∼ 10 km apart. Overall, this study region provides an ideal
Years of
previous
fire or
logging
1952
1967
1962
n/a
n/a
n/a
1971-72
1971–72
405.66 1957, 2003
1910
1910
1910
Spatial footprint = 3500 km2
natural setting for studying avalanches due to its geography,
inclusion of transportation and recreation corridors poten-
tially impacted by avalanches, relative accessibility, and no
artificial avalanche hazard mitigation.
Vertical
(m)
495.20
521.27
160.46
2063.61 1068.49
2940.29 1205.07
1793.13 1159.84
455.27
401.80
959.74
768.01
966.82
Northwest Montana’s avalanche climate is classified as
Table 1. Topographic characteristics of all avalanche paths. The ∗ denotes two major starting zones for one runout in the Shed 10-7 and Shed 7 paths.
both a coastal transition and intermountain avalanche climate
(Mock and Birkeland, 2000), but it can exhibit characteris-
Length
(m)
1004.97
1041.98
326.14
811.50
617.52
667.88
1745.66
1686.96
1636.52
tics of both continental and coastal climates. The elevation
of avalanche paths within the study sites range from approx-
imately 1100 to 2700 m, and the starting zones of these paths
are distributed among all aspects (Table 1).
Area
(km2 )
0.32
0.13
0.08
0.44
0.78
0.70
0.41
0.57
0.39
0.13
0.57
0.17
37
We eliminated or minimized influence from exogenous
disturbance factors such as logging and wildfire by referenc-
Median
aspect
(◦ )
155
53
257
327
250
180
77
76
326
176
152
158
31
ing wildfire maps extending back to the mid-20th century.
We selected sites undisturbed by wildfire since this time ex-
cept for Lost Johnny Creek, which was purposeful as this
area burned most recently in 2003. We also minimized the Starting
zone
slope
(mean)
(◦ )
32
37
33
40
34
42
38
39
36
35, 39
34, 36
42
0.14
influence of logging by selecting sites not previously logged.
Using historical logging parcel spatial data, we determined
logging in some sites was limited to very small parcels adja-
Full
path
slope
(mean)
(◦ )
26
31
28
31
24
32
29
32
34
31
29
38
−0.17
cent to the farthest extent of the runout zones.
The historical observational record in this area is limited.
In this study region, the Flathead Avalanche Center (FAC),
Starting
zone
elev.
(mean)
(m)
1774
1965
1692
1708
2170
2090
1731
1721
1670
1910, 1964
1935, 1837
1861
1869
a regional US Forest Service backcountry avalanche center,
records all avalanches observed and reported to the center.
However, not all avalanches are observed or reported given
the approximately 3500 km2 advisory area. The Burlington
1462–1957
1643–2164
1582–1742
1080–2149
1109–2314
1500–2660
1441–1896
1478–1879
1344–1750
1233–2193
1310–2078
1250–2217
1080–2660
Northern Santa Fe Railway (BNSF) avalanche safety pro-
(range)
elev.
path
Full
(m)
gram records most avalanches observed in John F. Stevens
Canyon in southern Glacier National Park where there is
16 km of rail line with over 40 avalanche paths. However,
systematic operational observations only began in 2005. Ob-
(mean)
1651
1870
1650
1501
1770
1863
1619
1633
1550
1644
1712
1718
1690
elev.
path
Full
(m)
servations prior to this time are inconsistent, though large
magnitude avalanches were mostly recorded. Reardon et
al. (2008) developed as complete a record as possible from
Trees
(n)
41
40
42
56
109
41
53
26
42
109
46
50
655
the Department of Transportation and railroad company
records, National Park Service ranger logs, and popular me-
GTSR-Jackson Glacier Overlook (JGO)
dia archives. In this subregion, avalanche mitigation is con-
ducted on an infrequent and inconsistent basis in emergency
situations, which is typically only once a year, if at all. Thus,
the record approximates a natural avalanche record. We com-
WF-Red Meadow A (RMA)
WF-Red Meadow B (RMB)
WF-Red Meadow C (RMC)
GTSR-Little Granite (LGP)
Swan-Lost Johnny A (LJA)
Swan-Lost Johnny B (LJB)
Swan-Lost Johnny C (LJC)
pared the reconstructed avalanche chronology of the JFS sub-
JFS-Shed 10-7 (S10.7)*
region to the historical record of large magnitude years for
n/a stands for not applicable.
qualitative purposes. A quantitative comparison would not be
JFS-Shed 7 (S7)∗
reflective of the true reliability of tree-ring methods because
GTSR – 54-3
of the incomplete historical record.
JFS-1163
All paths
Path
https://doi.org/10.5194/nhess-21-533-2021 Nat. Hazards Earth Syst. Sci., 21, 533–557, 2021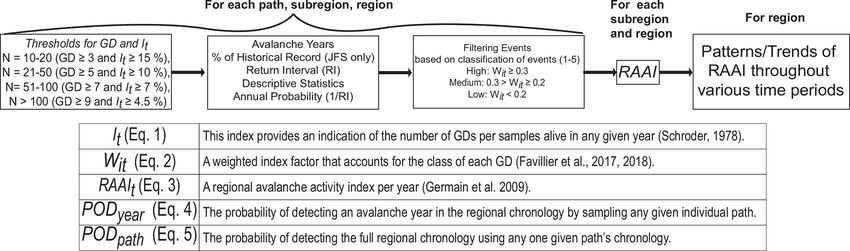
536 E. Peitzsch et al.: A regional spatiotemporal analysis of large magnitude snow avalanches using tree rings
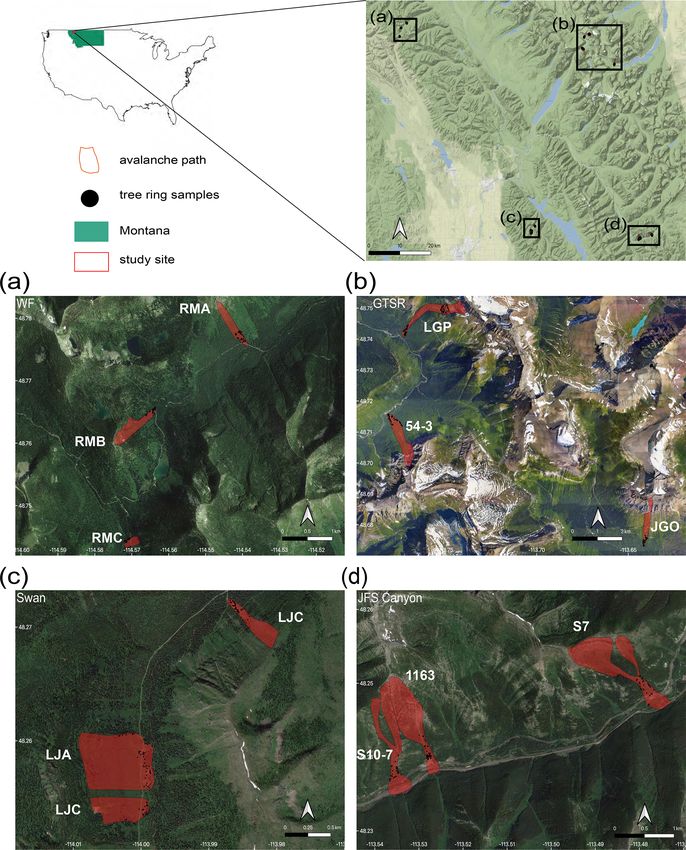
Figure 1. Study site. The red rectangle in the state of Montana designates the general area of the four sampling sites. The sites are (a) Red
Meadow, Whitefish Range (WF), (b) Going-to-the-Sun Road (GTSR), central GNP, (c) Lost Johnny Creek, northern Swan Range (Swan),
and (d) John F. Stevens Canyon (JFS), southern GNP. Black dots represent sample locations. Abbreviated names of each path are in white
text adjacent to red polygons (paths). Satellite and map imagery: © Google (2020). Maps produced using ggmap in R (Korpela et al., 2019).
2.2 Sample collection and processing previous 10 years) observed large magnitude avalanche ac-
tivity in these paths to constrain our sampling.
Our sampling strategy targeted an even number of samples The sample size for avalanche reconstruction using
collected from both lateral trimlines at varying elevations tree-ring data requires careful consideration. Butler and
and trees located in the main lower track and runout zone Sawyer (2008) suggested that a few damaged trees may
of the selected avalanche paths. This adequately captured be sufficient for avalanche chronologies, but larger target
trees that were destroyed and transported, as well as those sample sizes increase the probability of detecting avalanche
that remained in place. The definition of a large magnitude events (Corona et al., 2012). Germain et al. (2010) examined
avalanche in this study refers to avalanches of approximately cumulative distribution functions of avalanche chronologies
size D3 or greater (Greene et al., 2016) that may not run the and reported only slight increases in the probability of ex-
full length of the avalanche path. We sampled spatial extents tending chronologies with a sample size greater than 40.
within each avalanche path that are representative of runout This also depends on the available length of record within
extents ≥ size D3 avalanches. We also used recent (within the a given avalanche path. Thus, given the large spatial foot-
Nat. Hazards Earth Syst. Sci., 21, 533–557, 2021 https://doi.org/10.5194/nhess-21-533-2021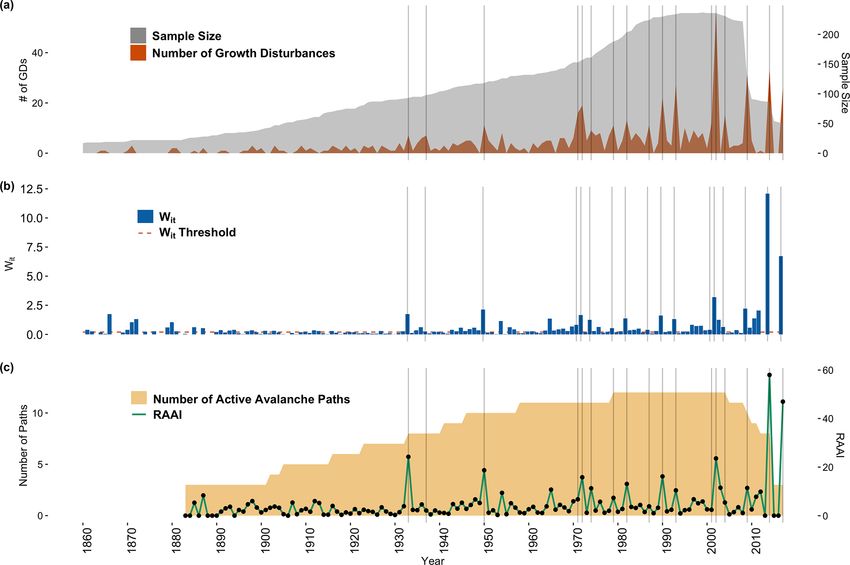
E. Peitzsch et al.: A regional spatiotemporal analysis of large magnitude snow avalanches using tree rings 537
print (∼ 3500 km2 ) of this study and feasibility of such a 2.3 Avalanche event identification
large sample size, we sampled between 26–109 samples per
avalanche path resulting in 655 trees (Table 1). Eight trees We analyzed samples for signs of traumatic impact events
were unsuitable for analysis, leaving us with 673 samples in (hereafter “responses”) likely caused by snow avalanches.
total from 647 trees. Of the 673 samples in total, we col- We adapted a classification system from previous dendro-
lected 614 cross sections and 59 cores. Shed 10.7 (S10.7) geomorphological studies to qualitatively rank the trauma
path was the focus of previous work (Reardon et al., 2008), severity and tree growth response from avalanche impacts
and the dendrochronological record extends up to 2005 (n = using numerical scores ranked 1 through 5 (Reardon et al.,
109 trees). Little Granite Path (LGP) was collected in the 2008). This classification scheme identified more prominent
summer of 2009 (n = 109 trees). We sampled the remaining avalanche damage responses with higher-quality scores and
10 paths (437 of the 655 trees in total) in the summer of 2017. allowed us to remain consistent with previous work (Corona
We collected three types of samples: (1) cross sections et al., 2012; Favillier et al., 2018) (Table 2). To compare our
from dead trees, (2) cross sections from the dead leaders of ability to capture avalanche/trauma events using cores ver-
avalanche-damaged but still living trees, and (3) cores from sus those captured using cross sections, we sampled a subset
living trees. We predominantly used cross sections in this (n = 40) of the cross sections by analyzing four 5 mm wide
study for a more robust analysis as events can potentially be rectangles to mimic a core sample from an increment borer.
missed or incorrectly identified in cores. We emphasized the The four subsamples on each cross section were made per-
selection of trees with obvious external scars and considered pendicular to one another (i.e., 90◦ ) based on the first sample
location, size, and potential age of tree samples. A limitation taken from the uphill direction of each stem to replicate com-
of all avalanche dendrochronology studies is that large mag- mon field sampling methods. We then summarized results
nitude events cause extensive damage and high tree mortality, from the four subsamples for each tree by taking the highest
thereby reducing subsequent potential tree-ring records. response score for each growth year. Finally, we compared
We sampled stem cross sections at the location of an ex- the number, quality response category, and calendar year of
ternal scar or just above the root buttress from downed or the avalanche/trauma events derived from the core subsam-
standing and dead trees and from stems of trees topped ples to those identified from the full cross sections.
by avalanche damage. We extracted tree-ring core samples
from living trees with obvious scarring or flagging along 2.4 Chronology and return period calculation
the avalanche path margins and runout zone using a 5 mm
To generate avalanche event chronologies and estimate return
diameter increment borer. We collected a minimum of two
periods for each path and for the entire study site, we utilized
and up to four core samples per tree (two in the uphill-
R statistical software and the package slideRun, an extension
downhill direction and two perpendicular to the slope). We
of the burnR library for forest fire history data (Malevich et
photographed each sample at each location and recorded
al., 2018). We calculated the age of each tree sampled and
species, Global Positioning System (GPS) coordinates (accu-
the number of responses per year in each avalanche path and
racy 1–3 m), amount of scarring on the cambium of the tree,
computed descriptive statistics for the entire dataset. Esti-
relative location of the tree in the path, and upslope direction
mates of avalanche path return intervals should be viewed as
(Peitzsch et al., 2019). We also recorded location character-
maximum return interval values due to the successive loss of
istics that identified the tree to be in place versus transported
samples and decreasing sample number back through time.
from its original growth position (i.e., presence or absence of
We used a multistep process to reconstruct avalanche
roots attached to the ground or the distance from an obvious
chronologies on three different spatial scales: individual
excavated area where the tree was uprooted).
paths, four subregions, and the entire region. We also calcu-
To prevent radial cracking and further rot, we dried and
lated a regional avalanche activity index (RAAI) (Fig. 2). The
stabilized the cross sections with a canvas backing. We
process involved first calculating the ratio of trees exhibiting
sanded samples using a progressively finer grit of sandpa-
growth disturbances (GDs) over the number of samples alive
per to expose the anatomy of each growth ring and used
in year t to provide the index It (Shroder, 1978):
the visual skeleton plot method to account for missing and
false rings and for accurate calendar year dating (Stokes and
P n
(Rt )
Smiley, 1996). We assessed cross-dating calendar year accu- i=1
It = × 100, (1)
racy of each sample and statistically verified dating against P n
measured samples taken from trees within the gallery for- (At )
i=1
est outside the avalanche path and from preexisting regional
chronologies (Table A2) (NOAA, 2018) using the dating where R is the number of trees recording a GD in year t with
quality-control software COFECHA (Grissino-Mayer, 2001; At representing the number of trees alive in our samples in
Holmes, 1983). For further details on cross-dating meth- year t.
ods and accuracy calculation for this dataset, see Peitzsch et We then used double thresholds to estimate the minimum
al. (2019). absolute number of GD and a minimum percentage of sam-
https://doi.org/10.5194/nhess-21-533-2021 Nat. Hazards Earth Syst. Sci., 21, 533–557, 2021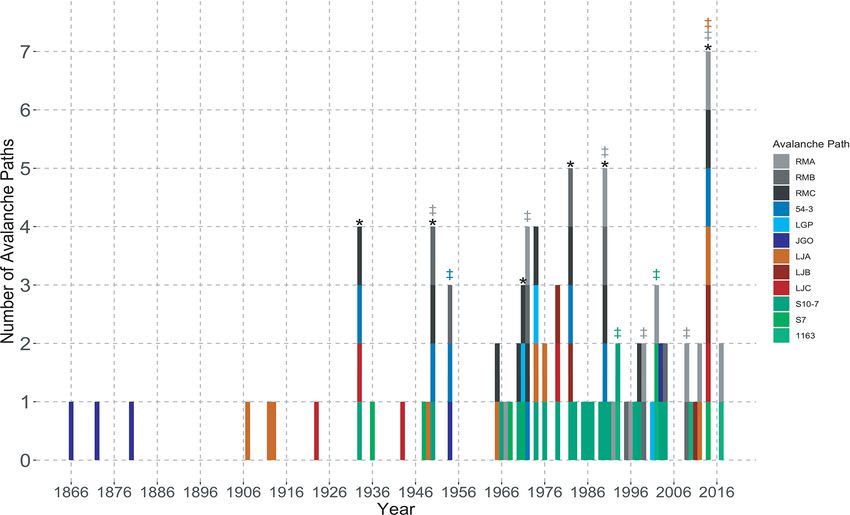
538             E. Peitzsch et al.: A regional spatiotemporal analysis of large magnitude snow avalanches using tree rings

Table 2. Avalanche impact trauma classification ratings for which C1 represents the strongest and easily detectable trauma and C5 represents
subtle and difficult-to-detect trauma.

               Classification    Description
               C1                – There is a clear impact scar associated with well-defined reaction wood, growth
                                 suppression, or major traumatic resin duct development;
                                 – or there is the strong presence of some combination of these major anatomical markers
                                 of trauma and growth response recorded in multiple years of growth and
                                 occurring in a year when multiple samples from other trees at the site record
                                 similar trauma and scaring.
                                 – C1 events are also assigned to the death date of trees killed by observed
                                 avalanche mortality at the collection site; the presence of earlywood indicates
                                 an early spring or late avalanche season event killed the tree.
               C2                – There is a scar or small scar recorded in the first 10 years of tree growth without
                                 associated reaction wood, growth suppression, or traumatic resin ducts;
                                 – or there is obvious reaction wood, growth suppression, or significant presence of
                                 traumatic resin ducts that occur abruptly after normal growth that lasts for 3 or
                                 more years.
               C3                – The presence of reaction wood, growth suppression, or traumatic resin ducts
                                 were recorded in less than 3 successive growth years.
               C4                – There is poorly defined reaction wood, growth suppression, or minimal presence of
                                 traumatic resin ducts lasting 1–2 years;
                                 – or there is a C3 class event occurring in the first 10 years of tree growth for which the cause
                                 of damage could result from various biological and environmental conditions.
               C5                – There is very poorly defined reaction wood, growth suppression, or minimal presence
                                 of traumatic resin ducts isolated in 1 growth year;
                                 – or there is a C4 class event occurring in the first 10 years of tree growth for which the cause
                                 of damage could result from various biological and environmental conditions.

Figure 2. General workflow of analytical methods to reconstruct regional avalanche chronology, regional avalanche activity index, and the
probability of detection. N is sample size. GD is growth disturbances. It is index of ratio of responses to trees alive. RI is return interval. Wit
is weighted index as per Favillier (2017, 2018). RAAI is regional avalanche activity index as per Germain et al. (2009). POD is probability
of detection. See Eqs. (1)–(5) for details.

ples exhibiting GDs per year (It ) based on sample size (N)                 tablished threshold approach since it has been broadly em-
following thresholds established by Corona et al. (2012) and                ployed in the literature and allows for the comparability of
Favillier et al. (2018): N = 10–20 (GD ≥ 3 and It ≥ 15 %),                  our avalanche chronology to results reported in other stud-
N = 21–50 (GD ≥ 5 and It ≥ 10 %), N = 51–100 (GD ≥ 7                        ies. We adapted previous equations of a weighted response
and It ≥ 7 %), and N > 100 (GD ≥ 9 and It ≥ 4.5 %).                         index (Kogelnig-Mayer et al., 2011) to our five-scale ranking
   We then used the chronologies derived from this process                  quality classification to derive the Wit :
to calculate a weighted index factor (Wit ). We used this es-

Nat. Hazards Earth Syst. Sci., 21, 533–557, 2021                                               https://doi.org/10.5194/nhess-21-533-2021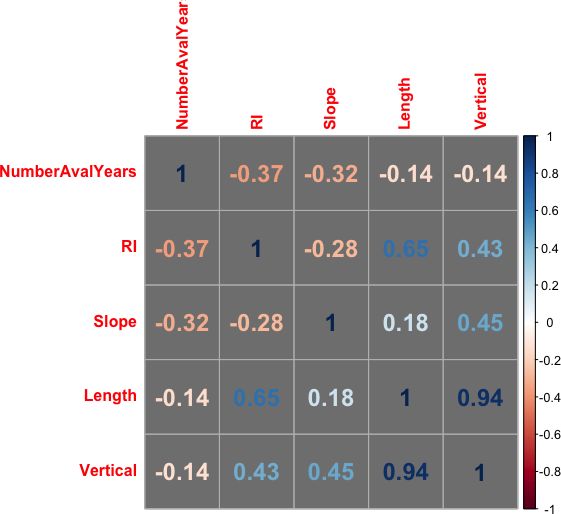
E. Peitzsch et al.: A regional spatiotemporal analysis of large magnitude snow avalanches using tree rings                          539

                                                                        could potentially record an avalanche for year t. For the cal-
Wit =                                                                   culation of the overall RAAI, we required each path to re-
 n
    P
                     n
                      P
                                  n
                                   P
                                               n
                                                P
                                                                      tain a minimum sample size of ≥ 10 trees with a minimum
            TC1 · 7 +    TC2 · 5 +    TC3 · 3 +    TC4 ,C5              number of three paths for year t and a minimum of one path
      i=1              i=1                i=1    i=1
                               n                                , (2)   from each subregion. We performed a sensitivity test to es-
                               P
                                     At                                 tablish the minimum number of paths necessary to calculate
                               i=1
                                                                        an RAAI value for any given year.
where the sum of trees with scars or injuries (C1 –C5 ) were               We also calculated the probability of detecting an
multiplied by a factor of 7, 5, 3, 1, and 1, respectively               avalanche year identified in the regional chronology as if any
(Kogelnig-Mayer et al., 2011).                                          given individual path was sampled. The probability of detec-
   Next, we classified Wit into high, medium, and low con-              tion for a given year (PODyear ) is defined as
fidence events using the thresholds detailed in Favillier et                           a
al. (2018), in which high is Wit ≥ 0.3, medium is 0.3 > Wit ≥           PODyear =          ,                                        (4)
                                                                                     a+b
0.2, and low is Wit < 0.2. This provided another step dis-
                                                                        where a is the number of individual avalanche paths that
criminating the avalanche response from noise. We included
                                                                        identify any given avalanche year in the regional chronology
all events with medium to high confidence in the next anal-
                                                                        and b is the total number of avalanche paths (n = 12). We
ysis. We then estimated the number of avalanche years, de-
                                                                        calculated PODyear for every year in the regional avalanche
scriptive statistics for return intervals (RIs), and the annual
                                                                        chronology. We then compared the PODyear of individual
probability (1/RI) for each path, subregion, and region. We
                                                                        paths to the number of active avalanche paths as defined in
use these RI values which were determined after filtering
                                                                        Eq. (3).
events throughout the study. We then compared return inter-
                                                                           We also calculated the probability of detection for each
vals for all individual paths and subregions using analysis
                                                                        path for the period of record (PODpath ):
of variance (ANOVA) and Tukey’s Honest Significant Dif-
ference (HSD) (Ott and Longnecker, 2016). In the final step                            c
                                                                        PODpath =          ,                                        (5)
of RI analysis, we subset the period of record for each path                         c+d
from 1967 to 2017 to compare RIs from this condensed time               where c is the number of years identified in any given path
series to the full period of record for each path.                      that is included in the regional chronology and d is the num-
   Next, we compared the number of avalanche years and re-              ber of years in the regional chronology that are not identified
turn periods identified in the full regional chronology to sub-         in the chronology for the given path.
sets of the region to determine the number of paths required
to replicate a full 12-path regional chronology. We assessed            2.6    Geomorphological characteristics
the full chronology against a subsampling of 11 paths in total
                                                                        Using a 10 m digital elevation model (DEM), we calculated
by sequentially removing the 3 paths with the greatest sam-
                                                                        a number of geomorphological characteristics for each path,
ple size. We then randomly sampled two paths from each
                                                                        including mean elevation (m; full path and starting zone),
subregion for a total subsample of eight paths, followed by
                                                                        elevation range (m), eastness (sin(aspect)) and northness
generating a subsample of four paths by choosing the path
                                                                        (cos(aspect)) (radians), slope (degrees; full path and starting
in each subregion with the greatest sample size. Finally, we
                                                                        zone), curvature (index (0–1); profile and planform), rough-
selected a random sample of one path from each subregion
                                                                        ness (index; full path and starting zone), perimeter (km2 ),
to compare against a total of four single path subsamples.
                                                                        area (km2 ), length (m), and vertical distance from starting
2.5     Regional avalanche activity index and probability               zone to runout zone (m). We also calculated the mean of
        of detection                                                    these characteristics for all paths in the region. The geomor-
                                                                        phological characteristics allowed for a determination of the
Next, we used the It statistic from each path to calculate a            representativeness of the region as a whole (i.e., are the paths
regional avalanche activity index (RAAI) for the subregions             similar across the region?), as well as a comparison of the
and overall region (Germain et al., 2009). The RAAI for each            return interval for each path relative to these characteristics.
year across the subregions and region provides a more com-              Finally, we estimated the potential relationship between path
prehensive assessment of avalanche activity within the spa-             length, starting zone slope angle, the number of avalanche
tial extent. For each year t, we calculated RAAI:                       years, and median return interval for each individual path us-
                   !           !                                        ing the Pearson correlation coefficient.
             Xn         Xn
RAAIt =          It /       Pt ,                         (3)
                 i=1         i=1                                        3     Results

where I is the index factor as per Eq. (1) for a given                  We collected a total of 673 samples from 647 suitable trees
avalanche path for year t and P is the number of paths that             impacted or killed by avalanches (trees: n = 531 dead; n =

https://doi.org/10.5194/nhess-21-533-2021                                         Nat. Hazards Earth Syst. Sci., 21, 533–557, 2021
540 E. Peitzsch et al.: A regional spatiotemporal analysis of large magnitude snow avalanches using tree rings
Figure 3. Histograms of (a) number of classification of responses (number above bar represents proportion), (b) sample age (red line repre-
sents mean age), and (c) collected species. For the species, ABLA is Abies Lasciocarpa, PCEN is Picea engelmannii, PSME is Pseudotsuga
menziesii, THPL is Thuja plicata, PICO is Pinus contorta, POTR is Populus tremuloides, LARIX is Larix Mill., BETULA is Betula L., and
POBA is Populus balsamifera.
116 living) in the full 12-path regional avalanche collec-
tion. Of those 673 samples, 614 were cross sections (91 %)
and 59 were cores (9 %). Within these samples, we identi-
fied 2134 GDs, of which 1279 were classified as C1 and C2
(60 %) (Fig. 3a). Scars were the dominant input type of GDs
classified as C1 , and reaction wood comprised the majority
of GDs classified as C2 , C3 , and C4 (Table A3). The old-
est individual tree sampled was 367 years, and the mean
age of all samples was 73 years (Fig. 3c). The period of
record of sampled trees extended from 1636 to 2017 CE.
The most common species in our dataset was Abies lascio-
carpa (ABLA; subalpine fir) (46 %), followed by Pseudot-
suga menziesii (PSME; Douglas fir) (37 %) and Picea en-
gelmannii (PCEN; Engelmann spruce) (14 %) (Fig. 3d). The
oldest GD response dates to the year 1655. In the entire
dataset, the 5 years with the greatest number of raw GD re-
sponses were 2002 (165 responses), 2014 (151 responses), Figure 4. Example of cross section sample where four cores taken
1990 (93 responses), 1993 (90 responses), and 1982 (75 re- uphill, downhill, and perpendicular (2) would have missed at least
one scar (1933) and potentially the pith of the tree. The black lines
sponses).
indicate the potential cores using a 5 mm width increment borer.
Note the scale on lower right of sample.
3.1 Avalanche event detection: cores versus cross
sections
we would have missed just by using cores, 24 were classified
The avalanche response subset analysis that compared re-
as C1 quality events, 24 were C2 , 14 were C3 , 3 were C4 , and
sults as if samples were from cores versus full cross sections
2 were C5 (Table A4).
showed that core samples alone would have missed numer-
ous avalanche events and generated a greater proportion of
low-quality growth disturbance classifications (Fig. 4). For
the subset of 40 samples analyzed as cores, we identified
only 124 of 191 (65 %) GDs in total. Of the 67 GDs that
Nat. Hazards Earth Syst. Sci., 21, 533–557, 2021 https://doi.org/10.5194/nhess-21-533-2021E. Peitzsch et al.: A regional spatiotemporal analysis of large magnitude snow avalanches using tree rings 541
Figure 5. Number of individual avalanche paths in which an avalanche event occurred in any given year. Avalanche years with ‡ (gray is WF,
dark blue is GTSR, orange is Swan, green is JFS) indicate years identified in at least two avalanche paths in the subregion. The ∗ represents
avalanche years in common in at least one path from at least three of the four subregions.
3.2 Individual path chronologies interval from JGO also differed from 1163 (p = 0.07) and
LJA (p = 0.08). Similarly, the return interval for Shed 10-7
There were 49 avalanche events identified from GD re- differed from LJC (p = 0.07). In assessing the potential geo-
sponses across all 12 individual paths in the study region. morphic controls on return interval, path length was the only
The avalanche years most common throughout all of the indi- significantly correlated characteristic (r = 0.65, p = 0.02;
vidual path chronologies were 2014 (seven paths), 1982 and Fig. A1).
1990 (five paths), and 1933, 1950, 1972, and 1974 (four We subset the period of record for each path from 1967
paths) (Fig. 5 and Table 3). We identified the year with the to 2017 and compared RI values to the full record. In this
greatest number of individual GD responses (2002) in three subset, nine paths exhibit no change in RI values when com-
paths – two from JFS subregion and one in the WF sub- pared to the full record. In one path, 54-3, RI values de-
region. There was no clear pattern of similarly identified creased from 14 to 10 years. We observed larger changes in
years from paths physically closer in proximity to each other. the other two paths: the JGO path had only 1 avalanche year
However, paths within the WF subregion produced the most recorded (down from 5 years), and the median RI in LJC
similar number of large magnitude avalanche years. When changed from 22.5 to 35 years. If we removed 54-3, JGO,
we applied the Wit process step, the number of identified and LJC for this comparison, the records from the subset pe-
avalanche years did not change for any individual avalanche riod of record are similar to the complete records for the other
path compared to the application of the double threshold paths in the study.
method alone. This highlights the number of responses clas-
sified as C1 and C2 (high quality) in our dataset. 3.3 Subregion chronologies
Across all individual paths, the median estimated return
interval was 8 years with a range of 2 to 28.5 (Fig. 6). Here- When the paths were aggregated into subregions (three paths
after return intervals indicate median return intervals unless per subregion) the median return periods for each subregion
specified. JGO, located in the GTSR subregion, exhibited were similar and all less than 10 years (Fig. 6e and Table 4).
the greatest spread in estimated return intervals, followed by The number of avalanche years for all of the subregions
LJB. The avalanche paths within the WF subregion had the ranges from 12 to 18 with the greatest number of identified
most similar return intervals of any of the subregions. The re- years in the JFS subregion and the fewest in the WF subre-
turn interval for JGO differed significantly from several other gion. The JFS subregion has the shortest median return inter-
paths: RMA, RMB, RMC, and Shed 10-7 (p ≤ 0.01). How- val, followed by the Swan, WF, and GTSR subregions. The
ever, when we relax a strict cutoff of p = 0.05, the return number of avalanche years for each aggregated subregion is
https://doi.org/10.5194/nhess-21-533-2021 Nat. Hazards Earth Syst. Sci., 21, 533–557, 2021E. Peitzsch et al.: A regional spatiotemporal analysis of large magnitude snow avalanches using tree rings
https://doi.org/10.5194/nhess-21-533-2021
Table 3. Avalanche chronologies and return interval (RI) statistics of all 12 avalanche paths in the region. Avalanche years in bold indicate years identified in at least two avalanche
paths in the subregion. Underlined avalanche years indicate years in common in at least one path from at least three of the four subregions, 1/RI refers to the probability of an avalanche
occurring in that avalanche path in any given year, and σ refers to the standard deviation of the RI. The period of record (POR) for each path represents the earliest inner year to the
most recent outer year of all raw samples in the path. The RI was calculated on the return interval of avalanche years.
Subregion WF GTSR Swan JFS
Path RMA RMB RMC 54-3 LGP JGO LJA LJB LJC Shed Shed 1163
10-7 7
Avalanche years 1967 1950 1933 1933 1971 1866 1907 1979 1923 1933 1936 1993
1972 1954 1950 1950 1974 1872 1912 1982 1933 1950 1948 2002
1990 1972 1965 1954 2001 1880 1913 2011 1943 1966 1968 2010
1992 1982 1971 1972 1970 1954 1949 2014 1979 1970 1971 2017
1996 1990 1972 2009 1982 2003 1974 1965 2014 1974 2002
1999 1995 1974 1990 1976 1976 2014
2002 1999 1982 2014 2012 1979
2009 2004 1990 2014 1982
2012 2009 1998 1983
2014 2014 1985
2017 1986
1987
1989
1990
1991
1993
1997
Nat. Hazards Earth Syst. Sci., 21, 533–557, 2021
1998
2003
2004
Number of avalanche years 11 9 11 7 4 5 9 4 5 20 6 4
POR (raw samples) 1922–2017 1845–2017 1783–2016 1777–2017 1836–2009 1784–2017 1636–2017 1808–2017 1657–2017 1910–2004 1864–2017 1929–2017
RI – median 3 5 8 14 8 28.5 7 3 22.5 2 12 8
RI – mean 5 7.38 8.1 13.5 12.67 34.25 13.38 11.67 22.75 3.74 15.6 8
RI – min. 2 4 1 4 3 6 1 3 10 1 3 7
RI – max. 18 18 17 24 27 74 36 29 36 17 31 9
1/RI 0.33 0.20 0.13 0.07 0.13 0.13 0.14 0.33 0.04 0.50 0.08 0.13
σ 4.81 4.78 6.12 7.42 12.66 33.09 14.79 15.01 14.73 4.68 10.50 1.00
542E. Peitzsch et al.: A regional spatiotemporal analysis of large magnitude snow avalanches using tree rings 543
Figure 6. Boxplot of return intervals for individual avalanche paths in each subregion: (a) WF, (b) GTSR, (c) Swan, and (d) JFS. Panel
(e) shows the boxplots of return intervals for the subregions and the overall region.
Table 4. Avalanche chronologies and return interval (RI) statistics Table 5. Number of avalanche events for each subregion, the mean
of all four subregions; 1/RI refers to the probability of an avalanche of three individual paths in each region, and the overall aggregated
occurring in that avalanche path in any given year, and σ refers to region.
the standard deviation of the RI.
Number of avalanche events
WF GTSR Swan JFS Region
Subregion Three individual Aggregated
Number of aval. years 12 14 13 18 30 paths subregion
RI – median 7 8 4 3 3
RI – mean 6.27 11.35 11.25 4.94 5.21 WF 11, 9, 11 12
RI – min. 2 1 1 1 1 GTSR 7, 4, 5 14
RI – max. 13 53 54 16 21 Swan 9, 4, 5 13
1/RI 0.14 0.13 0.25 0.33 0.33 JFS 20, 6, 4 18
σ 3.69 13.48 15.70 4.60 9.53 Region 30
incomplete and limited historical record, the individual re-
greater than the number of avalanche years for any individ- constructed avalanche chronologies of paths in the JFS sub-
ual path within each subregion except for the JFS subregion region captured 10 %–50 % of the recorded large magnitude
where 18 avalanche years were identified but Shed 10-7 to- events over the years 1908 to 2017.
taled 20 avalanche years (Table 5).
In terms of commonality of years between the subregions, 3.4 Regional chronology and RAAI
1982 is the only year identified in all of the four subregions
(Fig. 7). Avalanche years commonly identified in three sub- We identified 30 avalanche years in the overall region and a
regions are 1933, 1950, 1954, 1974, and 2014. We iden- median return interval of 3 years (Table 5). The number of
tified the JFS subregion as having the greatest number of samples increases through time to a peak during 2005, and
years exclusive to that subregion (10 years). The WF subre- as expected, the number of GDs also increases through time
gion shared the greatest number of years with other regions (Fig. 8a). The Wit index also increases particularly from the
(11 years), followed by JFS (9 years), GTSR (8 years), and year 2000 onward with the largest spikes in 2014 and 2017
the Swan (7 years). In the only available comparison with an (Fig. 8b). The regional assessment of avalanche years iden-
https://doi.org/10.5194/nhess-21-533-2021 Nat. Hazards Earth Syst. Sci., 21, 533–557, 2021544 E. Peitzsch et al.: A regional spatiotemporal analysis of large magnitude snow avalanches using tree rings
Finally, the probability of capturing all of the avalanche
years identified in the regional chronology by each individ-
ual path ranges from 7 % to 40 % (Table 8). The greatest
PODpath value from any given path is S10.7 (POD = 40 %)
in the JFS subregion, followed by RMC in the Whitefish sub-
region (POD = 37 %). In general, the paths within the White-
fish subregion capture the regional chronology most consis-
tently.
4 Discussion
The processing and analysis of 673 samples spanning a large
spatial extent allowed us to create a robust regional large
magnitude avalanche chronology reconstructed using den-
drochronological methods. Cross sections provided a more
robust and complete GD and avalanche chronology com-
pared to a subsample generated from cores alone. Due to the
reduced information value of working only with cores, Favil-
Figure 7. Venn diagram of avalanche years common between sub-
lier et al. (2017) included a discriminatory step in their meth-
regions. Overlapping areas of each ellipse indicate years in common
with each subregion. ods to distinguish avalanche signals in the tree-ring record
from exogenous factors, such as abnormal climate signals or
response to insect disturbance. By using cross sections to de-
tified fewer years (n = 30) than the simple aggregation of velop our avalanche chronologies, we were able to view the
all unique avalanche years identified in the individual paths entire ring growth and potential disturbance around the cir-
(n = 49) (Table A2). cumference of the tree as opposed to the limited view pro-
When we included all paths but S10.7 (one of two paths vided by cores. This allowed us to place GD signals in the
with the greatest sample size), we captured 80 % of all context of both climate and insect disturbances without the
avalanche years and added 1 new year to the chronology (Ta- need for this processing step. We do not discount any studies
ble 6). When we removed LGP (the other path with the great- that use cores for reconstructing avalanche chronologies and
est size of sampled trees), we still captured all of the years in understand there are sampling limitations from environmen-
the regional chronology but introduced 4 new years into the tal and policy perspectives in different regions, as well as
chronology for a total of 34 years. A random sample of 8 financial and processing constraints. However, we are sug-
(2 from each subregion) of the 12 avalanche paths captured gesting that if the ability to collect cross sections exists, then
83 % of the years in the chronology and identified 2 new it is advantageous to collect them.
avalanche years. Finally, when using only one path from each We targeted sample collection in the runout zones and
subregion with the largest sample size (Shed 10-7, 54-3, LJA, along the trim line where large magnitude avalanches oc-
and RMA), we captured 73 % of the avalanche years identi- curred in recent years. At several sites, we collected sam-
fied in the full regional chronology. When using a random ples at the upper extent of the runout zones (S10.7, Shed 7,
sample of one path from each subregion (1163, LGP, LJC, and 1163). Thus, some additional noise in the final chronol-
RMB), we captured only 43 % of the years included in the ogy for those specific paths could be due to more frequent
regional chronology of all 12 paths. The RAAI is insensitive small magnitude avalanches. Though the oldest individual
(no significant difference, p > 0.05) to the number of paths trees extended as far back as the mid-17th century, the ap-
when tested using a minimum number of paths recording an plication of the double thresholds processing steps restricted
avalanche in year t. The years with the largest RAAI are 2014 individual avalanche path chronology lengths since the min-
and 2017, followed by 2002, 1950, and 1933 (Fig. 8c). imum GD threshold requirements were not met. It is difficult
The probability of detection for the avalanche to place confidence in these older recorded events due to the
years (PODyear ) identified in the regional chronology decreasing evidence back in time inherent in avalanche path
ranged from 8 % to 58 % when we examined individual tree-ring studies. Therefore, we chose to examine more re-
paths (Table 7). The year with the highest POD was 2014. cent time periods dictated by the avalanche years identified
The mean POD for all years was 21 %. When we examined through the double threshold methods.
avalanche paths that exhibited at least one GD during the All of the paths in the study are capable of producing large
avalanche years identified in the regional chronologies magnitude avalanches with path lengths greater than 100 m
(i.e., no thresholds used), the POD is generally greater. (typical length for avalanche destructive size 2, D2), and all
but RMC have a typical path length of close to or greater than
Nat. Hazards Earth Syst. Sci., 21, 533–557, 2021 https://doi.org/10.5194/nhess-21-533-2021E. Peitzsch et al.: A regional spatiotemporal analysis of large magnitude snow avalanches using tree rings 545
Table 6. Comparison of the number of avalanche years and return intervals (RIs) when including all 12 paths in the region to using a
combination of fewer paths to define the region. HLC signifies a high level of confidence and MLC a medium level of confidence as per
Favillier et al. (2017, 2018). “Number not in regional” refers to avalanche years identified in that particular combination of paths but not
identified in the regional record.
Paths Region All All All S7, 1163, S10.7, 1163,
(all but but but LGP, 54-3, LGP,
paths) S10.7 LGP 54-3 JGO, LJA, LJC,
RMB, RMA RMB
RMC,
LJB,
LJC
Number of paths 12 11 11 11 8 4 4
Sample size (n) 635 528 526 581 382 253 239
Number of avalanche years 30 27 34 31 27 34 17
Number of matches with regional n/a 24 30 29 25 22 13
Number not in regional n/a 1 4 2 2 11 4
Number captured in regional n/a 80 100 97 83 73 43
Median RI 3 3 3 3 3 2 3.5
Number of years removed using only Wit = HLC instead of Wit = MLC and HLC 10 3 9 7 1 1 1
n/a stands for not applicable.
Figure 8. (a) The number of samples (gray shaded area) increases through time, but the number of responses (dark orange shaded area)
varies. Note that sample size is on a secondary (right) y axis. (b) The Wit , a weighted index factor that accounts for the class of each growth
disturbance, threshold (0.2; dashed red line) provides a means of discriminating between high and low confidence signals in the tree-ring
record. (c) The regional avalanche activity index (RAAI) (green line, black points) is a measure of regional avalanche activity based on the It ,
the ratio of trees exhibiting growth disturbances over the number of samples alive in year t, of each path and the number of active avalanche
paths (yellow shaded area). Note RAAI is on a secondary (right) y axis.
https://doi.org/10.5194/nhess-21-533-2021 Nat. Hazards Earth Syst. Sci., 21, 533–557, 2021546 E. Peitzsch et al.: A regional spatiotemporal analysis of large magnitude snow avalanches using tree rings
Table 7. Probability of detection (PODyear ). Avalanche years iden- Table 8. Probability of detection of each individual path (PODpath )
tified in the regional chronology and associated POD by analyzing to the regional avalanche chronology.
individual paths with and without growth disturbances (GDs), sam-
ple size, and Wit thresholds. Path POD
(%)
Avalanche POD (%) POD (%)
RMA 27
year in with without
RMB 27
regional thresholds thresholds
RMC 37
chronology
54-3 23
1866 8 8 LGP 7
1872 8 8 JGO 17
1880 8 17 LJA 17
1933 33 58 LJB 10
1936 8 25 LJC 7
1945 n/a 58 Shed 10-7 40
1948 8 33 Shed 7 17
1950 33 58 1163 10
1954 25 67
1956 n/a 58
1965 17 67
4.1 Regional sampling strategy
1970 17 50
1971 25 50
By examining three different spatial scales (individual path,
1972 33 83
1974 33 75
subregion, and region), we produced a large magnitude
1976 17 50 avalanche chronology for the region captured in a small sub-
1982 42 92 set of the total number of paths across the large region. Ac-
1990 42 83 cordingly, this sampling strategy may also alleviate the issue
1993 17 50 of recording large magnitude avalanches within a region in
1997 8 92 the successive years following a major destructive avalanche
1998 17 50 event that removed a large number of trees within specific
1999 17 58 paths but not others. Overall, a regional sampling strategy
2002 25 75 enables us to capture large magnitude avalanche events over
2003 17 33 a broad spatial extent, which is useful for regional avalanche
2004 17 75
forecasting operations and future climate association anal-
2009 17 33
2011 8 33
ysis. This strategy also allows us to understand large mag-
2012 17 42 nitude avalanche activity at scales smaller than the regional
2014 58 58 scale.
2017 17 25
4.2 Chronologies for individual paths and subregions
Mean 21 52
We applied the Wit threshold specifically to weight higher-
n/a stands for not applicable.
quality responses. The number of identified avalanche years
does not change for any individual avalanche path when we
1000 m (for avalanche destructive size 3, D3) (Greene et al., applied the Wit process. This lack of change suggests that
2016). As Corona et al. (2012) noted, the avalanche event many of the responses in our samples were ranked as high
must be large enough to create an impact on the tree, and quality (i.e., C1 and C2 ). The high quality of responses can
size D2 or greater will be evident from the tree-ring record be attributed to the use of cross sections which allowed for
(Reardon et al., 2008). However, the successive damage and a more complete depiction and assessment of the tree-ring
removal of trees from events sized D2 or greater also impacts signal (Carrara, 1979). Scarring comprised the majority of
the future potential to record subsequent events of similar C1 samples, and evidence of scarring in lower-quality classi-
magnitude. In other words, if a large magnitude avalanche fication was due to other types of small cambial tissue scars
removes a large swath of trees in 1 year, then there are that could not be confidently classified as avalanche damage.
fewer trees available to record a slightly smaller magnitude The reaction wood in C1 GDs was associated with obvious
avalanche in subsequent years. Therefore, dendrochronology avalanche scars in the same year.
methods inherently underestimate avalanche events by up to We developed avalanche chronologies for 12 individual
60 % (Corona et al., 2012). avalanche paths. The path with the greatest number of iden-
tified avalanche years, S10.7, contains two major starting
Nat. Hazards Earth Syst. Sci., 21, 533–557, 2021 https://doi.org/10.5194/nhess-21-533-2021E. Peitzsch et al.: A regional spatiotemporal analysis of large magnitude snow avalanches using tree rings 547 zones that are both steeper (35 and 39◦ ) than Shed 7, activity in this path in 2003. LJC was heavily burned, and this which also contains two separate starting zones. Reardon et created a steep slope with few trees that was once moderately al. (2008) collected a substantial number of samples at higher to heavily forested. Substantial anchoring and snowfall inter- elevations in the S10.7 avalanche path. However, the loca- ception likely created an avalanche path that did not have tion data for these samples were not available. Many of those many large magnitude avalanches for decades since slope samples were the living stumps that captured smaller annual forestation plays a substantial role in runout distance and events. This is likely the root of the difference between S10.7 avalanche frequency in forested areas (Teich et al., 2012). In and the other paths in this study and the reason this path con- addition, wildfires in 1910 burned a majority of the JFS sub- tains the largest numbers of avalanche years in this analysis. region as well, and the higher frequency of avalanche years The range of return intervals across all paths (2– recorded between 1910 and 1940 in S10.7 suggests wildfire 28.5 years) is similar to those reported for 12 avalanche paths impacts may also be a contributor to the high frequency of across a smaller spatial extent in the Chic-Choc Mountains of avalanche events in that location (Reardon et al., 2008). Ad- Québec, Canada (2–22.8 years) (Germain et al., 2009). Al- ditionally, the fire in LJC may also have removed evidence though the authors in that study used a different avalanche of previous avalanche activity. response index, their study still suggests considerable varia- Our results also suggest that return interval increases as tion in avalanche frequency across avalanche paths within a path length increases, though the sample size for this correla- region. tion analysis on individual paths is small (n = 12). This result The results from examining return intervals during a trun- is likely because only very large magnitude avalanches affect cated period from 1967 to 2017 across all paths illustrate that the far extent of the runout of the paths. This finding dif- several of the individual path return interval results should be fers from a group of avalanche paths in Rogers Pass, British treated with caution (e.g., JGO, LJC, and 54-3). The differ- Columbia, Canada, where path length was not significantly ence in minimum and maximum return interval values is a correlated with avalanche frequency (Smith and McClung, function of a decreasing sample size back in time. The min- 1997). However, that study used all observed avalanches, in- imum return interval values in many of the paths are con- cluding artillery-initiated avalanches, as opposed to a tree- centrated during recent periods. This is a limitation of us- ring reconstructed dataset. ing dendrochronology to estimate return intervals. Compar- The greatest number of identified avalanche years is in the ing avalanche return intervals across individual paths should JFS subregion. The avalanche paths in this subregion are all also be treated with caution given the variable nature of sam- southerly or southeasterly facing, whereas the other subre- ple availability across paths. This variability across individ- gions span a greater range of aspects. This narrow range of ual paths further provides reasons to evaluate the number aspect may cause a bias toward overrepresentation of those of paths necessary to create a regional avalanche chronol- aspects compared to the inclusion of other aspects in other ogy from tree rings. Most of the paths have a reasonable subregions. record over this truncated period and also highlight the im- The differences between individual avalanche paths, as portance of strategic sampling in numerous avalanche paths. well as subregions, are likely due to localized terrain While dendrochronology underestimates avalanche activity, and weather/climate factors and the interaction of the two we show that sampling enough paths across a region provides (Chesley-Preston, 2010), as well as local avalanche, for- a reasonable estimate of avalanche activity at this scale. est stand, and fire history. For example, Birkeland (2001) JGO contains the maximum return interval for any path in demonstrated significant variability in slope stability across the study, and the return intervals are significantly different a small mountain range dependent upon terrain and weather. from numerous other paths. A lack of recording data after Slope stability and subsequent large magnitude avalanching one large avalanche event could easily skew this value. To are likely to be highly heterogeneous not only across the understand if this value is accurate, we would have to sample subregion but across a large region. This is also consistent adjacent tracks to determine if the return intervals are sim- with findings by Schweizer et al. (2003) that suggest substan- ilar or not. An appropriate sample base without large tem- tial differences in stability between subregions despite the poral gaps is necessary to fully provide an accurate estimate presence of widespread weak layers. Finally, climate drives of return intervals within a single avalanche path. While the weather but is not a first-order effect on avalanche occurrence sample size is sufficient for this individual path, the results in any one given avalanche path. In this study, we derived a should be treated with caution due to the temporal gaps. In regional avalanche chronology to provide a spatial scale that other words, the large return interval values may reflect the aligns more with the spatial scale of climate drivers than any irregular preservation of evidence for large avalanches as op- one individual path. These are relationships that should be posed to an accurate estimate of return intervals. Therefore, examined in future work. we cannot fully explain the large maximum return interval for this path. The return intervals for LJC in the Swan subregion were the greatest in this subregion, and this is likely due to wildfire https://doi.org/10.5194/nhess-21-533-2021 Nat. Hazards Earth Syst. Sci., 21, 533–557, 2021
You can also read