Jena Soil Model (JSM v1.0; revision 1934): a microbial soil organic carbon model integrated with nitrogen and phosphorus processes
←
→
Page content transcription
If your browser does not render page correctly, please read the page content below
Geosci. Model Dev., 13, 783–803, 2020
https://doi.org/10.5194/gmd-13-783-2020
© Author(s) 2020. This work is distributed under
the Creative Commons Attribution 4.0 License.

Jena Soil Model (JSM v1.0; revision 1934): a microbial soil organic
carbon model integrated with nitrogen and phosphorus processes
Lin Yu1 , Bernhard Ahrens1 , Thomas Wutzler1 , Marion Schrumpf1,2 , and Sönke Zaehle1,2
1 Max   Planck Institute for Biogeochemistry, Hans-Knöll Str. 10, 07745 Jena, Germany
2 International Max Planck Research School (IMPRS) for Global Biogeochemical Cycles, Jena, Germany

Correspondence: Lin Yu (lyu@bgc-jena.mpg.de)

Received: 9 July 2019 – Discussion started: 25 September 2019
Revised: 24 January 2020 – Accepted: 24 January 2020 – Published: 28 February 2020

Abstract. Plant–soil interactions, such as the coupling of          1   Introduction
plants’ below-ground biomass allocation with soil organic
matter (SOM) decomposition, nutrient release and plant up-          There is ample evidence from both ecosystem monitor-
take, are essential to understand the response of carbon (C)        ing data (Bond-Lamberty et al., 2018; Hou et al., 2018;
cycling to global changes. However, these processes are             Jonard et al., 2015) and ecosystem manipulation experiments
poorly represented in the current terrestrial biosphere mod-        (Ellsworth et al., 2017; Iversen et al., 2012; McCarthy et al.,
els owing to the simple first-order approach of SOM cycling         2010; Warren et al., 2011) that the effects of environmen-
and the ignorance of variations within a soil profile. While        tal changes, such as atmospheric CO2 concentrations, global
the emerging microbially explicit soil organic C models can         warming and continued air pollution, on terrestrial ecosys-
better describe C formation and turnover, at present, they lack     tems are driven by the constraints imposed by macronutri-
a full coupling to the nitrogen (N) and phosphorus (P) cycles       ents such as nitrogen (N) and phosphorus (P). It is, there-
with the soil profile. Here we present a new SOM model – the        fore, of great relevance to identify and understand these con-
Jena Soil Model (JSM) – which is microbially explicit, ver-         straints on global carbon (C) cycling and storage for predict-
tically resolved and integrated with the N and P cycles. To         ing potential future carbon–climate feedback (Ciais et al.,
account for the effects of nutrient availability and litter qual-   2013). There have been continuous efforts to integrate the
ity on decomposition, JSM includes the representation of en-        N (Thornton et al., 2007; Zaehle and Friend, 2010; Smith
zyme allocation to different depolymerisation sources based         et al., 2014) and P cycles (Wang et al., 2010; Yang et al.,
on the microbial adaptation approach as well as of nutrient         2014b; Goll et al., 2017; Thum et al., 2019; Zhu et al.,
acquisition competition based on the equilibrium chemistry          2019) in terrestrial biosphere models (TBMs) for improv-
approximation approach. Herein, we present the model struc-         ing the representation of C–nutrient interactions. However,
ture and basic features of model performance in a beech for-        despite major advances in simulating terrestrial biogeochem-
est in Germany. The model reproduced the main SOM stocks            istry, these nutrient-enabled TBMs largely fail to reproduce
and microbial biomass as well as their vertical patterns in the     the responses of ecosystems to elevated atmospheric CO2
soil profile. We further tested the sensitivity of the model to     concentration, as observed in the free-air CO2 enrichment
parameterisation and showed that JSM is generally sensitive         experiments (Zaehle et al., 2014; Medlyn et al., 2015, 2016;
to changes in microbial stoichiometry and processes.                Fleischer et al., 2019). An important shortcoming of the
                                                                    current generation of models is their poor representation of
                                                                    plant–soil interactions, in particular the responses of soil or-
                                                                    ganic matter (SOM) decomposition and nutrient release to
                                                                    altered plant inputs and ultimately plant uptake of mineral
                                                                    nutrients (Hinsinger et al., 2011; Drake et al., 2011; Zaehle
                                                                    et al., 2014).

Published by Copernicus Publications on behalf of the European Geosciences Union.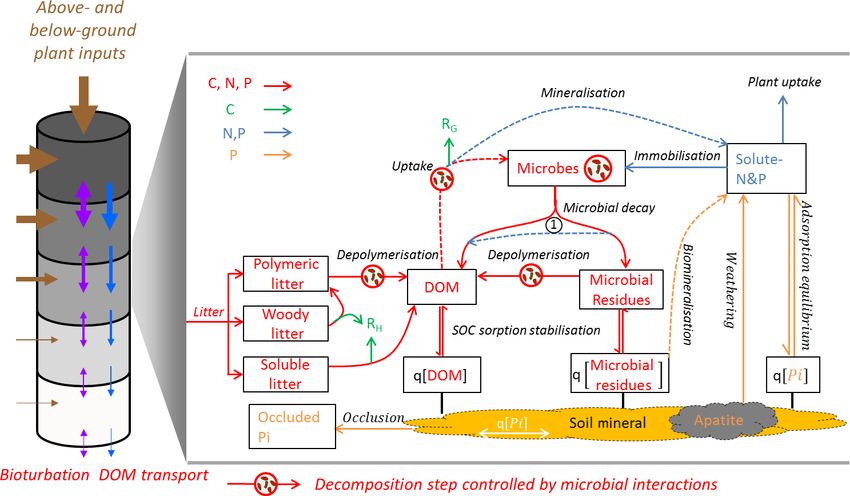
784                                                                                                              L. Yu et al.: JSM

   Current TBMs largely adopt the CENTURY model (Par-               influences SOM turnover (Lang et al., 2017). As the above-
ton et al., 1988) or comparable model approaches, in which          mentioned processes/phenomena are receiving more atten-
SOM is divided into two or three pools with different first-        tions, an increasing number of emerging microbially explicit
order decomposition rates. In these models, nutrient miner-         models have started to tackle these challenges by account-
alisation and immobilisation fluxes depend on the C transfer        ing for the N cycle, enzymatic biosynthesis and rhizosphere
efficiency between SOM pools and their prescribed C : N : P         priming (Abramoff et al., 2017; Sulman et al., 2017; Huang
stoichiometry. Recent insights in soil science have ques-           et al., 2018; Sulman et al., 2019) using certain novel ap-
tioned the adequacy of the CENTURY approach to SOM cy-              proaches. For instance, the microbial adaptation concept has
cling for simulating the effects of global changes, particularly    been applied to represent the adaptation of enzyme allocation
in response to altered plant inputs. Researchers have under-        by microorganisms to maximise their growth through alter-
scored the need and offered a direction for a more mech-            ing the preferential source of decomposition between plant
anistic representation of soil processes in models, such as         litter and SOM, as demonstrated using the SEAM model
the substrate limitation of soil microbial growth as well as        (Wutzler et al., 2017).
the nutrient immobilisation and physico-chemical stabilisa-             Another emerging challenge of representing nutrient pro-
tion of organic matter through organo-mineral association           cesses in microbially explicit models is the competition for
(Schmidt et al., 2011; Lehmann and Kleber, 2015). Another           nutrient uptake between plants and microbes (Dannenmann
limitation of many current SOM models in TBMs is that they          et al., 2016; Zhu et al., 2017). Regarding P, in particular,
represent soil as a ‘‘bucket’’, thus ignoring the strong vari-      the soil mineral surface adsorbs inorganic P to compete with
ance of SOM cycling within a soil profile (Koven et al., 2013;      plants and microbes (Bünemann et al., 2016; Spohn et al.,
Arora et al., 2013; McGuire et al., 2018). Such a highly em-        2018). The equilibrium chemistry approximation (ECA) ap-
pirical representation of SOM cycling, in which important           proach has been proposed to simulate the competition of sub-
processes such as microbial immobilisation or rhizosphere           strate uptake kinetics in complex networks where the uptake
deposition are not well represented, brings large uncertain-        kinetics of one substrate affect the others (Tang and Riley,
ties in future projections of terrestrial C sequestration (Brad-    2013). ECA has also been applied to resolve mineral nutri-
ford et al., 2016). There have been increasing efforts in taking    ent sink (plant–microbe uptake or mineral adsorption) com-
into account microbial (enzymatic) dynamics and mineral as-         petitions in other modelling studies (Zhu et al., 2016, 2017,
sociation in soil organic C (SOC) models, such as CORPSE            2019).
(Sulman et al., 2014), MIMICS (Wieder et al., 2014), MEND               In this study, we present the structure and basic features
(Wang et al., 2014) and RESOM (Tang and Riley, 2014). In-           of a novel microbially explicit and vertically resolved SOM
clusion of these processes in SOC models has demonstrated           model that integrates with the N and P cycles – the Jena Soil
possibilities to represent SOC responses to global warming          Model (JSM). JSM combines the representations of the verti-
(Sulman et al., 2018). Moreover, further inclusion of the ex-       cal structure, microbially explicit decomposition and stabil-
plicit vertical resolution of biogeochemical processes and          isation (Ahrens et al., 2015) with the microbial adaptation
transport allows for the reconciliation of the SOC depth and        concept from the SEAM model (Wutzler et al., 2017) and
14 C profile (Ahrens et al., 2015). Although these new micro-       the ECA approach (Tang and Riley, 2013). We tested alterna-
bial SOC models better describe C formation and turnover            tive hypotheses regarding the competition among microbial,
processes than the conventional models, they still lack full        plant and mineral nutrient sinks (uptake or mineral sorption)
coupling with the N and P cycles.                                   and evaluated the effects of nutrient availability on the prefer-
   The main challenge in coupling C and nutrient cycles in          ential decomposition of either nutrient-poor or nutrient-rich
microbially explicit models is to account for the large sto-        organic matter using observed soil C, N and P profiles in a
ichiometric imbalances between the microbial decomposers            temperate beech forest stand. Additionally, we evaluated the
(i.e. soil microorganisms) and their resources (i.e. plant litter   model’s sensitivity to parameterisation and associated uncer-
and SOM) (Xu et al., 2013; Mooshammer et al., 2014). Soil           tainty to help understand these effects.
microbial communities can adapt to these imbalances by ad-
justing their C : N : P ratios, typically through shifting com-
munity structure (e.g. fungal : bacterial ratios) (Rousk and        2     Material and methods
Frey, 2015) or through eliminating excess elements by al-
tering their use efficiencies (e.g. C use efficiency) (Manzoni      2.1    Model description
et al., 2012). A well-known adaptive mechanism to these im-
balances is the exudation of extracellular enzymes to release       JSM is a soil biogeochemical model built on the backbone
nutrients through hydrolysis (Olander and Vitousek, 2000;           of the vertically explicit C-only SOC model COMISSION
Allison and Vitousek, 2005) or enhanced SOM oxidation,              (Ahrens et al., 2015). The COMISSION model was fur-
known as the “rhizosphere priming effect” (Craine et al.,           ther developed from the conventional one by introducing a
2007). Recent evidence has also shown that soil P availabil-        scalable maximum sorption capacity based on soil texture
ity regulates phosphatase synthesis (Fujita et al., 2017) and       for dissolved organic C and microbial residues (Sect. S1.4

Geosci. Model Dev., 13, 783–803, 2020                                                  www.geosci-model-dev.net/13/783/2020/
L. Yu et al.: JSM                                                                                                                             785

Figure 1. Theoretical representation of Jena Soil Model (JSM) structure. The vertical soil profile (9.5 m) is split into 15 soil layers; above-
ground litter is added on top of the soil profile; root litter enters into each soil layer according to the root distribution. Bioturbation and DOM
transport translocate SOM between soil layers. In each soil layer, boxes refer to pools and lines refer to processes. Red lines: biogeochemical
fluxes of C, N and P; green lines: respiration fluxes (RH for heterotrophic respiration and RG for microbial growth respiration); blue lines:
fluxes of N and P; orange lines: fluxes of only P; dashed lines: biogeochemical processes that involves stoichiometry change between the
sourcing and sinking pools. The number 1 at the centre (1) indicates microbial nutrient recycling from residue to DOM during decay; q[X]:
mineral-associated form (adsorbed to soil mineral surface or absorbed into soil mineral matrix) of X, which can be DOM, microbial residues
or inorganic phosphate (Pi).

in the Supplement) as well as temperature and moisture                      development of an organic layer, the model also includes an
rate modifiers for microbe-mediated processes and sorption                  extra advective transport term which accounts for the up-
(Sect. S1). We will investigate in a separate study how the                 wards/downwards shift of the soil surface when the surface
maximum sorption capacity for mineral-associated organic                    SOM accumulates/diminishes.
C contributes to the observed patterns of SOC content and                      SOM is represented as pools of soluble, polymeric or
radiocarbon age. A schematic overview of JSM is presented                   woody litter as well as of dissolved organic matter (DOM),
in Fig. 1, and the mathematical description of the processes is             mineral-associated DOM, living microbial biomass, micro-
provided in the Supplement. The model is integrated into the                bial residue (necromass) and mineral-associated microbial
QUINCY (Thum et al., 2019) TBM modelling framework                          residue, each of which contains organic forms of C, N and
and can either be applied as a stand-alone soil model or cou-               P. The flows of organic N and P follow the pathways of C,
pled to the representation of the vegetation and surface pro-               with additional nutrient-specific processes, such as minerali-
cesses. In this study, we applied JSM as a stand-alone model.               sation and plant uptake, to link organic matter turnover with
JSM neither describes the energy and water processes at the                 inorganic nutrient cycles. Microbial biomass is assumed to
atmosphere–soil interface or in the soil profile nor simulates              maintain a fixed stoichiometry in the model. It assimilates
the production of litter. Model inputs (soil temperature, mois-             organic forms of C, N and P from DOM with fixed element
ture and water fluxes as well as plant litter data) were derived            use efficiencies and inorganic forms of N and P from solu-
from the QUINCY model.                                                      ble mineral pools. Microbes are assumed to aim to maximise
   JSM describes the formation and turnover of SOM along                    their growth by maintaining high C use efficiency; however,
a vertical soil profile, which is explicitly represented as ex-             when growth is limited by nutrients, microbes reduce their
ponentially increasing layer thickness with increasing soil                 C use efficiency and increase nutrient mineralisation accord-
depth (Fig. 1). The biogeochemical processes and pools of                   ingly (See Sect. S1.5). The stoichiometry of all other SOM
C, N and P are represented in each layer. Vertical transport                pools depends on the C : N : P ratios of influx and efflux, and
of biogeochemical pools between the adjacent layers due to                  these fluxes retain the stoichiometry of their source pools un-
percolation and bioturbation is also modelled. To reflect the               less the formation processes involve respiration. In addition,

www.geosci-model-dev.net/13/783/2020/                                                              Geosci. Model Dev., 13, 783–803, 2020
786                                                                                                           L. Yu et al.: JSM

Figure 2. Simulated dynamics of (a) SOC and (b) non-occluded inorganic P contents in topsoil (30 cm) and subsoil (30–100 cm) for
10 000 years. The three vertical dashed lines represent 200, 1000 and 5000 years.

when microbes decay, nutrients are preferentially recycled to     phosphate), the potential rates are calculated on the basis of
the DOM pool due to the low C-to-nutrient ratio in the cycto-     the respective richness and half-saturation level of enzymes
plasma, as proposed by Schimel and Weintraub (2003). The          and the impacts of other competitors, following the ECA ap-
inorganic pools of N and P include soluble inorganic ammo-        proach (See Sect. S2.2).
nium (referred to as NH4 ), nitrate (referred to as NO3 ), sol-      The impacts of soil conditions on biogeochemical pro-
uble inorganic phosphate (referred to as PO4 ), as well as ad-    cesses are also represented in JSM. The temperature response
sorbed PO4 , absorbed PO4 , occluded PO4 and primary PO4 .        of different processes (e.g. microbial growth, decay, and nu-
The inorganic P cycle follows the QUINCY model (Thum              trient uptake in Sect. S1.4) are represented by the Arrhe-
et al., 2019) and accounts for microbial interactions. JSM        nius equation with different activation energies. Moisture re-
explicitly traces 13 C, 14 C and 15 N following Ahrens et al.     sponses are described by two rate modifiers – one represent-
(2015) and Thum et al. (2019).                                    ing the effects of oxygen limitation (e.g. litter turnover in
   Enzymes are not explicitly modelled in JSM, although           Sect. S1.2) and the other representing the effects of diffusion
these are described implicitly to regulate processes such as      limitation (e.g. depolymerisation in Sect. S1.3). JSM also
depolymerisation and nutrient acquisition. For enzyme allo-       considers the effects of SOM content to correct bulk den-
cation within depolymerisation processes, we extended the         sity (Sect. S3), which in turn affects other processes such as
microbial adaptation approach of the SEAM model (Wutzler          organic matter (Eq. S7) and phosphate (Eq. S25) sorption.
et al., 2017) by including P dependence of enzyme allocation
and the assumption of a steady state of enzyme production,        2.2   Site description and data for model analysis
leading to the prediction that the total enzyme level is al-
ways proportional to the microbial biomass. The fractions of
                                                                  The Vessertal (VES) site is a mature beech (Fagus sylvat-
enzymes allocated to different depolymerisation sources (lit-
                                                                  ica) forest stand with an average tree age of > 120 years, lo-
ter and microbial residue) are dynamically modelled to max-
                                                                  cated in the central uplands of Germany (Thuringian Forest
imise the release of the most limiting microbial elements.
                                                                  mountain range). The intermediate elevation is 810 m a.s.l.,
JSM tracks three potential fractions of enzyme allocation,
                                                                  with a high annual precipitation of 1200 mm and a mean an-
which represent cases in which microbes only maximise the
                                                                  nual temperature of 5.5 ◦ C (Lang et al., 2017). It is one of
depolymerisation release of C, N or P, respectively, and then
                                                                  the Level II intensive monitoring plots in the Pan-European
updates the microbial enzyme allocation fraction by accli-
                                                                  International Co-operative Program for the assessment and
mating gradually to the potential fraction of the most lim-
                                                                  monitoring of air pollution effects on forests (ICP Forests).
iting element (See Sect. S1.5.2). For nutrient competition
                                                                  Since 2013, the VES site has also been one of the main study
between plant, microbes and soil adsorption sites (only for
                                                                  sites in the German Research Foundation (DFG) priority pro-

Geosci. Model Dev., 13, 783–803, 2020                                                www.geosci-model-dev.net/13/783/2020/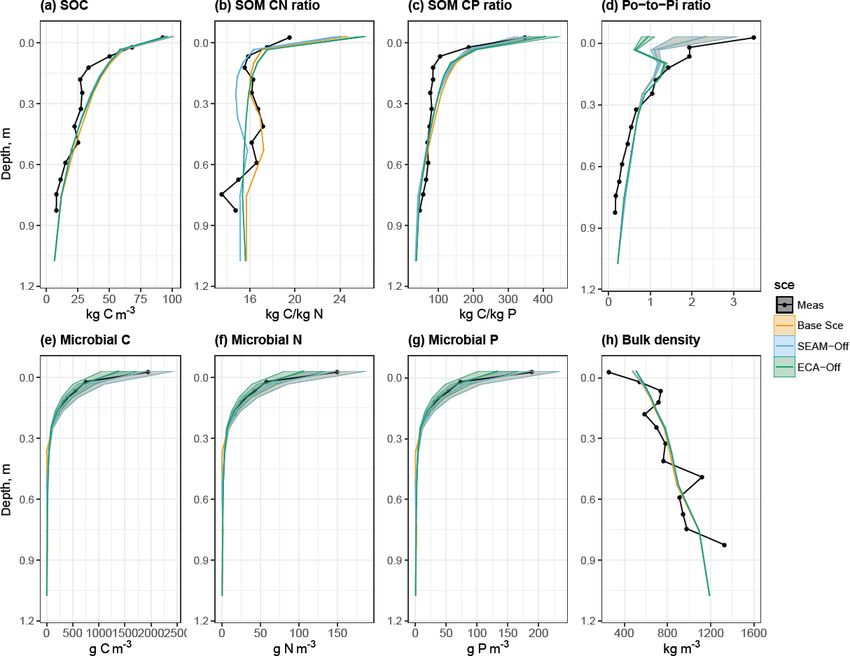
L. Yu et al.: JSM                                                                                                               787

gramme 1685 “Ecosystem Nutrition: Forest Strategies for             2016), and for other SOM pools, we used the measured av-
Limited Phosphorus Resources”.                                      erage SOM stoichiometry of the 1 m soil profile (Lang et al.,
   Soil at the VES site is classified as Hyperdystric Skeletic      2017). All SOC profiles were initialised with a pre-industrial
Chromic Cambisol (WRB, 2015), with loamy topsoil and                114 C values for all C pools, from which the 14 C values were
sandy loamy subsoil, overlain by a moder organic layer. The         developed. The soil inorganic P pools were initialised using
current soil developed on trachyandesite, and the develop-          the soil P dataset from Yang et al. (2014a), corrected with
ment started at the end of the last ice age, 10–12 000 years        the current total inorganic P from field measurements and
ago (Lang et al., 2017). The soil was sampled up to 1 m, with       extrapolated to the whole soil profile following the approach
layer depths of 5–10 cm, for the measurements of total C,           used in the QUINCY model (Thum et al., 2019). Organic
N, and organic and inorganic P and basic physical properties        matter material and mineral soil densities were solved using
such as bulk density and soil texture. Soil from the A horizon      the Federer equation (Federer et al., 1993) with field data of
alone was extracted for the estimation of microbial C, N and        the SOM content and bulk density.
P pools. Detailed sampling and measurement approaches are              We first ran the QUINCY model for 500 years to generate
described in Lang et al. (2017).                                    soil forcing and then simulated the VES site for 200 years
   The soil contains 19 kg m−2 C, 1.1 kg m−2 N and                  using JSM, repeating 30 years of soil forcing (half-hourly
464 g m−2 P up to 1 m soil depth, including the forest floor        soil temperature, soil moisture, vertical water fluxes and ver-
(Lang et al., 2017). The soil C content decreases from              tically resolved litterfall that includes 14 C values) simulated
510 g C kg−1 soil in the forest floor to 126 g C kg−1 soil in the   by the QUINCY model for the VES site. To mimic the his-
A horizon to 5.9 g C kg−1 soil at 1 m depth. The C : N ratio        tory of 14 C input, we increased litter 14 C content for the
of SOM slightly decreases from 19.5 in the forest floor to          final 60 years before the end of the simulation, assuming
14.75 at 1 m depth, whereas the C : P ratio decreases more          that the 114 C in gross primary productivity in response to
steeply from 348.7 in the forest floor to 46.6 at 1 m depth.        the observed 14 CO2 atmospheric pulse propagates directly
The organic P fraction of total P also decreases from 67 % in       into litterfall without any delay. We tested different simula-
the organic layer to 13 % at 1 m depth. The microbial C con-        tion lengths (50, 200, 1000, 5000 and 10 000 years) and ob-
tent decreases from > 2000 µg C g−1 soil C in the forest floor      served that the simulated SOM profiles changed slowly af-
(Zederer et al., 2017) to 764 µg C g−1 soil C in the top mineral    ter 200 years but the soil inorganic P pools changed grad-
soil (Bergkemper et al., 2016). The microbial biomass shows         ually as the simulation time increased (Fig. 2b). In view of
a C : N ratio of 13 and a very low C : P ratio of 10.3 (Lang        computational efficiency, we sought to compare the present-
et al., 2017).                                                      day soil profile observations with the simulated profiles for
                                                                    200 years, which also best fit the date of soil inorganic P
2.3     Model protocol, model experiments and sensitivity           pool initialisation (1850, as indicated in Yang et al., 2014a).
        analysis                                                    All the other presented results (including sensitivity analysis)
                                                                    are also based on the 200-year simulations, and the results
2.3.1    Model protocol                                             of long-term simulations (1000, 5000 and 10 000 years) are
                                                                    specified with their simulation times.
The soil texture profiles for both QUINCY (for the gener-
ation of soil temperature, moisture and litterfall) and JSM         2.3.2   Model experiments
simulations were obtained from observations at the VES site.
The mineral-associated DOM and residue pools were ini-              To further test the effects of different model features, we im-
tialised on the basis of Eq. (S7) using the observed soil tex-      plemented several model experiments, including a SEAM-
ture and mineral soil density and assuming that the soil sur-       off scenario in which the enzyme allocation to polymeric lit-
face sorption sites are less occupied as soil depth increases.      ter and microbial residue are both fixed to 50 % (Eq. 1b),
The vertical profile of the other SOM pools was initialised         and an ECA-off scenario in which the ECA-based plant and
with a default C content for each pool in the first layer and       microbial uptakes of inorganic N and P and soil adsorption
assumed to decrease with soil depth in proportion to the fine       of phosphate were switched off and replaced by a demand-
root profile (Jackson et al., 1996), except in the woody litter,    based microbial uptake of inorganic N and P that ignored
which is only initialised in the first layer. The initialisation    P adsorption flux (Eq. 1c). All model experiments used the
C contents in the first layer for soluble litter, polymeric lit-    same parameterisation from the calibrated model with full
ter, woody litter, DOM, microbes and microbial residue were         model features, which is denoted as the Base Scenario in
291, 2914, 1000, 2.4, 73.2 and 203 g m−3 C, respectively. The       this study.
N and P contents of the SOM pools were initialised using the           The differences between Base Scenario and SEAM-off
stoichiometry of different pools. For litter pools, we adapted      and ECA-off are listed below.
the litter stoichiometry from the QUINCY model (Thum
et al., 2019); for microbes and microbial residues, we used
the measured microbial stoichiometry (Bergkemper et al.,

www.geosci-model-dev.net/13/783/2020/                                                    Geosci. Model Dev., 13, 783–803, 2020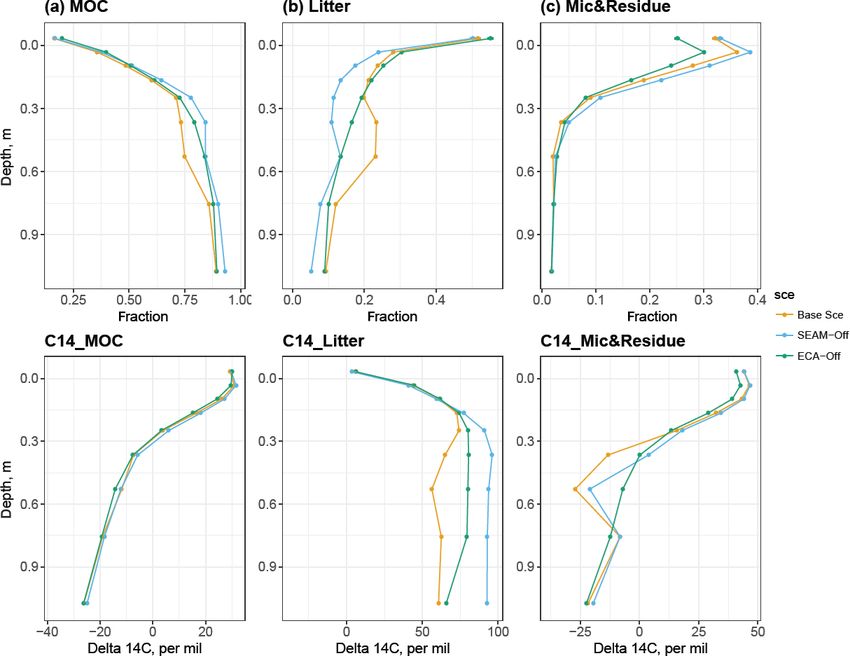
788                                                                                                            L. Yu et al.: JSM

Base Scenario:                                                     used in model sensitivity and uncertainty analyses presented
      poly                                                         in this paper. We evaluated the model output from these sim-
Enzfrac &Enzres
            frac calculated as Eq. (S15);                          ulations in terms of main biogeochemical fluxes (e.g. respi-
U ∗X,y for microbes, plant and adsorption                          ration, net N and P mineralisation, microbial uptake of inor-
calculated as Eq. (S23).                                   (1a)    ganic N and P, N and P losses, and P biomineralisation) and
                                                                   the main SOM pools (up to 1 m depth) (e.g. total C, N and P
SEAM-off Scenario:                                                 in SOM; total soil inorganic P and microbial C, N and P). We
      poly
                                                                   measured parameter importance as the rank-transformed par-
Enzfrac = Enzres
             frac = 0.5.                                   (1b)    tial correlation coefficients (RPCCs) to account for potential
                                                                   non-linearities in the association between model parameters
ECA-off Scenario:                                                  and output (Saltelli et al., 2000; Zaehle et al., 2005).
                           X
U ∗X,plant = f (Tsoil , 2)vmax,plant Cfine_root [X]
   upt            1
(Km1 +    upt         ),                                           3     Results
         Km2 + [X]
              demand                                               3.1    Model stability and quasi-equilibrium state
U ∗X,mic = Fmic,X    ,
U ∗P ,adsorp = 0.                                          (1c)
                                                                   We tested JSM with different initial SOM contents and dif-
The plant uptake of inorganic N or P (U ∗X,plant ) in the ECA-     ferent microbial stoichiometry. The simulated SOM profiles,
off scenario (Eq. 1c) uses the equations and parameters from       including SOC; C : N and C : P ratios of SOM; microbial C,
the QUINCY model (Thum et al., 2019).                              N and P contents, and bulk density, did not respond strongly
                                                                   to changes in initial SOM contents (Fig. S2) but were notably
2.3.3        Calibration and model sensitivity                     affected by the assumed microbial stoichiometry (Fig. S1).
                                                                   We further examined the effects of simulation time on soil
We calibrated the Base Scenario in two main steps. In the first    profile development (Figs. 2 and S1). SOC in the topsoil
step, we matched the model results with the measured SOC           (30 cm) reached a stable state (ca. 70 kg C m−3 ) after approx-
profile, mainly by calibrating the depolymerisation, organic       imately 150 years and the subsoil (30–100 cm) reached a sta-
matter sorption and litter turnover processes; in the second       ble state (ca. 30 kg C m−3 ) after approximately 1000 years.
step, we matched the model results with the measured soil          The accumulation rate of SOM decreased with time, but the
organic P profiles by calibrating the microbial growth and         complete soil profile had not yet reached a steady state (Ta-
decay, nutrient acquisition, and soil inorganic P cycling. The     ble 1) because C continues to accumulate slowly, particu-
two steps were not performed iteratively; however, during the      larly in deeper soil layers (> 1 m). Although the organic P
second step, we revised the parameters from the first step as      dynamics follow the soil C dynamics, the inorganic P pools
necessary. Other observed soil profiles, such as the soil or-      inevitably deplete in the long-term simulation (Fig. 2) due to
ganic N and the bulk density, were used as additional crite-       high uncertainties in initialisation and P cycling processes.
ria to select parameterisation, although not specifically used     Therefore in this study, we focussed on the stable state of the
to calibrate the model. During the calibration processes, pa-      topsoil (30 cm) at the end of the 200-year simulations and re-
rameter values were gradually changed and the goodness of          ferred to it as a “quasi-equilibrium state” since slow changes
model fit was visually evaluated on the basis of observations.     are still occurring, particularly in soil inorganic P pools and
   To test the effects of different microbial stoichiometry, we    SOM in deeper soil layers (Figs. S3, S4 and S5).
ran a “Glob Mic Stoi” scenario in which the global average
microbial stoichiometry (42 : 6 : 1, Xu et al., 2013) was used     3.2    Simulated SOM stocks and fluxes at the study site
to parameterise the model instead of the observed microbial
C : N : P ratio (10.3 : 0.8 : 1, Lang et al., 2017). To further    We first compared the simulated profiles with the in situ
test the model responses to different initial conditions, we ran   observed ones (Fig. 3). The modelled results agreed well
the model with different initial SOM contents (50 %, 75 %,         with observed stock sizes and vertical patterns, indicating
150 % and 200 % of the default initial content) for 1000 years     that the stocks (here we define the term “stock” as the total
to ensure that the soil reached a more stable state.               amount of all (model) pools within a larger set) of C, N and
   We also tested the sensitivity of JSM to parameterisation       P pools in SOM show smaller temporal variations than the
using a hierarchical Latin hypercube design (LHS; Saltelli         microbial pools at the quasi-equilibrium state (Fig. 3a to c)
et al., 2000; Zaehle et al., 2005). We selected 28 parameters      due to strong seasonal variations in microbial biomass. We
from calibration (Table S1) and varied each parameter be-          also found a greater variation in the simulated organic-P-to-
tween 80 % and 120 % of the Base Scenario values given in          inorganic-P (Po-to-Pi) ratio (Fig. 3d) than for the individual
Table S2, which were obtained through LHS sampling from            organic and inorganic P stocks (data not shown), inferring
a uniform distribution to form a set of 1000 LHS samples and       that the seasonal dynamics of microbes also impose a sea-

Geosci. Model Dev., 13, 783–803, 2020                                                 www.geosci-model-dev.net/13/783/2020/
L. Yu et al.: JSM                                                                                                                           789

Table 1. The annual soil C, N and P fluxes of model experiments at the study site. Positive values infer accumulation in the soil, and negative
values infer loss from the soil. The values are the accumulated sum of the whole soil profile, calculated based on data from the last 10 years
of model experiments. SOP: soil organic phosphorus; SON: soil organic nitrogen.

           Variable          Unit            Base Scenario      SEAM-Off       ECA-Off      1000 years    5000 years     10 000 years
           Biogeochemical fluxes
           C litterfall      gC m−2 yr               788.0          788.0        788.0          788.0         788.0           788.0
           Respiration       gC m−2 yr              −741.0         −746.2       −746.2         −778.0        −787.4          −788.0
           1 SOC             gC m−2 yr                47.0           41.8         41.8           10.1           0.7            0.04
           N litterfall      gN m−2 yr               14.52          14.52        14.52          14.52         14.52           14.52
           N deposition      gN m−2 yr                2.04           2.04         2.04           2.04          2.04            2.04
           Plant N uptake    gN m−2 yr              −13.29         −13.26       −13.28         −15.67        −16.01          −16.01
           N leaching        gN m−2 yr               −0.01          −0.01        −0.01          −0.08         −0.49           −0.54
           1 SON             gN m−2 yr                3.25           3.29         3.26           0.80          0.06           0.002
           P litterfall      mgP m−2 yr              980.4          980.4        980.4          980.4         980.4           980.4
           P deposition      mgP m−2 yr                4.2            4.2          4.2            4.2           4.2             4.2
           P weathering      mgP m−2 yr              155.6          155.6        142.6          277.8         197.0           522.8
           Plant P uptake    mgP m−2 yr             −852.0         −866.8       −886.9         −920.9        −959.5         −1134.6
           P leaching        mgP m−2 yr               −0.3           −0.3         −1.7           −0.5          −1.7            −8.4
           P desorption      mgP m−2 yr             −233.0         −243.8       −185.6          −58.3         157.4           345.7
           1 SOP             mgP m−2 yr              520.9          516.9        424.1          399.3          63.0            18.7

Figure 3. Simulated and observed (a) SOC content, (b) C : N ratio in SOM, (c) C : P ratio in SOM, (d) organic-P-to-inorganic-P ratio in
soil, (e) microbial C content, (f) microbial N content, (g) microbial P content and (h) soil bulk density at the study site up to 1 m soil depth.
Black lines and dots: observations; coloured lines and shades: simulated mean values and ranges of standard deviation by different model
experiments in Sect. 2.3. Microbial C, N and P values were only measured in the top 30 cm of soil. Simulated means and standard deviations
were calculated using data from the last 10 years of model experiments.

www.geosci-model-dev.net/13/783/2020/                                                             Geosci. Model Dev., 13, 783–803, 2020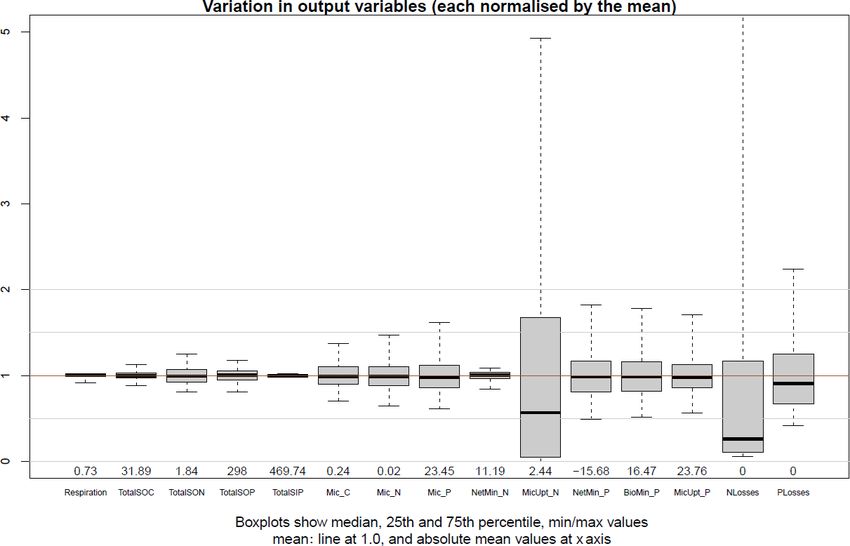
790                                                                                                           L. Yu et al.: JSM

sonal pattern of P immobilisation (from Pi to Po) and miner-      plant uptake of NH4 , respectively, whereas for P, microbial
alisation (from Po to Pi).                                        uptake is the main sink and biomineralisation is a larger
    The distribution and radiocarbon profile of total organic     source than gross mineralisation in each scenario.
matter in the simulations varied across soil depths (Fig. 4).
The first layer (0 cm, O–A horizon) is dominated by the plant     3.3   Model features: nutrient acquisition competition
litter and microbial component (living or dead microbes),               and enzyme allocation
and while the microbial component decreases strongly from
ca. 40 % at 0 cm to almost zero at 50 cm soil depth, the lit-     In general, the SEAM-off scenario did not differ much from
ter component still constitutes ca. 10 % of the total SOC at      the Base Scenario in terms of the main soil stocks and bio-
1 m soil depth. The mineral-associated C (MOC) compo-             geochemical fluxes (Figs. 3 and 5); however, the ECA-off
nent switches from a minor component in the O–A horizon           scenario produced a lower microbial biomass and Po-to-Pi
(ca. 20 %) to the dominant component (ca. 90 % at 1 m) in         ratio in the organic layer and topsoil. Total SOC may not be
deeper soil layers.                                               influenced in either scenario, although its composition and
    The simulated radiocarbon (114 C) profile qualitatively       radiocarbon profile were both altered (Fig. 4).
agreed with the observed one (Fig. S1e); the 114 C content           We presented the uptake of inorganic PO4 and competition
increased within the O horizon and started decreasing with        between phosphate adsorption, uptake of inorganic P at three
increasing soil depth from mineral soil, i.e. the A horizon.      different depths (Fig. 8), and seasonal and vertical uptakes
This pattern indicates that the “bomb pulse” 114 C signal sig-    of inorganic N and P for both microbes and plants (Fig. 6).
nificantly affects the apparent 14 C age in the organic layer     The simulations showed that microbes outcompeted roots for
and its impact decreases with soil depth due to the slow          inorganic P uptake in JSM at all depths. However, the rela-
turnover in deeper soil. Our simulations further indicated that   tive competitiveness of roots for phosphate uptake increased
such a vertical pattern is caused by MOC and microbial com-       with increasing soil depth because the plant P uptake rate
ponents, while the litter component stays modern throughout       decreases less strongly than the microbial P uptake with in-
the profile (Fig. 4). Increases in litter 14 C with depth sug-    creasing soil depth. In contrast, the phosphate adsorption rate
gest that more bomb-derived SOC is still found in subsoils        increased strongly with increasing soil depth and outcom-
due to slower litter turnover, while it is already replaced by    peted biological processes (plant and microbial uptake) in
more recent, 14 C-poorer SOC in the topsoil. Although the         deeper soil layers. The relative competitiveness of phosphate
Base Scenario did not reproduce the measured radiocarbon          adsorption against microbial and plant uptake also strongly
profile, despite producing its vertical pattern, a much better    decreased in summer in the topsoil due to high biological ac-
fit with the measured radiocarbon profile and an increase in      tivity in warm months (Fig. 8b). With respect to competition
soil 14 C age, driven by MOC, were indeed observed as sim-        for inorganic N, plants outcompeted microbes along the en-
ulation time increased (Figs. S1e and S4).                        tire soil profile and throughout the year, particularly in sum-
    The simulated biogeochemical fluxes show strong sea-          mer when microbes assimilate N mainly from DOM (Fig. 6c
sonal and vertical patterns (Figs. 5 and 6), in which the flux    and d).
rates in summer and in the topsoil are generally higher than         Turning off the model’s feature for nutrient acquisition
those in winter and in the subsoil, respectively. Meanwhile,      competition, i.e. ECA-off scenario, led to a notably lower
microbial inorganic N uptake shows a different seasonal pat-      microbial biomass and Po-to-Pi ratio in the topsoil (Fig. 3).
tern, with the lowest rates observed in August and Septem-        This is caused by concurrent changes in microbes and plant
ber (Fig. 6c). In fact, this pattern is supported by the sea-     inorganic P uptake, particularly in the topsoil layer where
sonal pattern of net N mineralisation flux, in which the peak     plants take up more inorganic P than in the Base Scenario
is observed in August and September (Fig. 5b). This result        (Fig. 6) due to reduced competition with microbes. More-
indicates that organic N in DOM is the most abundant for          over, there were differences in spatial and temporal varia-
microbial growth during August and September, leading to a        tions in uptake and mineralisation fluxes between the ECA-
large reduction in the microbial inorganic N uptake and an in-    off scenario and the other two scenarios. For instance, the
crease in net N mineralisation. In contrast, organic P content    seasonal variation in fluxes was notably lower in the ECA-
in DOM is the lowest during August and September, leading         off scenario. Decrease in P flux rate with soil depth may be
to net P immobilisation and microbial inorganic P uptake el-      weaker in the ECA-off scenario, but the decrease in net N
evation (Figs. 5d and 6a). While the vertical pattern of plant    mineralisation with soil depth is marginally stronger (Fig. 5).
N uptake parallels root distribution (Jackson et al., 1996),      This difference is because geophysical processes, such as ad-
plant P uptake is lower in the organic layer than in the top-     sorption and absorption, play more crucial roles in the soil
soil due to strong competition from microbes in the organic       P cycle than in the N cycle and because these show rather
layer (Figs. 6 and 8).                                            different seasonal and vertical patterns from the biochemical
    The sources and sinks of soluble inorganic N and P also       processes, such as mineralisation.
show very different patterns (Fig. 7). The main source and           The modelled enzyme allocation for depolymerisation is
sink for inorganic N in solution are gross mineralisation and     presented in Fig. 9. We compared the enzyme allocation

Geosci. Model Dev., 13, 783–803, 2020                                                www.geosci-model-dev.net/13/783/2020/
L. Yu et al.: JSM 791
Figure 4. Simulated SOC fractions (upper panels) and their respective radiocarbon profiles (bottom panels) at 1 m soil depth. Column (a):
mineral-associated C (MOC), including adsorbed DOM and adsorbed microbial residue; column (b): litter, including woody, polymeric and
soluble litter; column (c): live and dead microbes. Data points are derived using data from the last 10 years of the model experiments. All
model experiments used 200-year simulations and were not validated against the measured 114 C.
poly
curve of polymeric litter (Enzfrac in Eq. S17) with three 3.4 Model sensitivity and uncertainties
X
potential allocation curves (αpoly where X stands for C, N
and P in Eq. S15), which represent cases in which microbes
The interquartile range of outputs (Fig. 10) from model sen-
only maximise C, N or P release from depolymerisation. All
sitivity analysis revealed that all outputs were well centred
modelled fractions of enzyme allocation to polymeric lit-
around the results of the parameterisation of the Base Sce-
ter were well below 50 % for the whole soil profile, indi-
nario (Table S2), except microbial inorganic N uptake and
cating that polymeric litter is less preferred than microbial
N losses. In general, the soil stocks were more stable than
residues for depolymerisation in the soil, particularly in very
the microbial pools and biogeochemical fluxes. N minerali-
deep soil layers where no roots are present and microbes
sation was surprisingly insensitive while microbial inorganic
would thus only produce enzyme to depolymerise microbial
N uptake was very sensitive to parameterisation. N minerali-
residues because the content of residue is much higher than
sation in JSM was mainly driven by the C : N ratio of DOM,
that of polymeric litter. The simulated curve of allocation
which remains rather stable due to the similar C : N ratios of
overlaps with the curve of potential allocation to maximise
plant litter, microbes and microbial residues. The very sensi-
P release, indicating that depolymerisation is solely driven
tive response of microbial inorganic N uptake was attributed
by P demand. This explains why microbial residues are pre-
to the high-affinity (low Km,mic value) N uptake transporters
ferred over polymeric litter since the C : P ratio of micro-
of microbes (Kuzyakov and Xu, 2013) and their sensitivity
bial residues is much lower than that of polymeric litter (data
to changes in NH4 concentration. The RPCC of parameters
not shown). Despite rather different enzyme allocation frac-
with outputs (Table 2) also demonstrated that the C and N
tions shown in Fig. 9, the majority of the modelled stocks
contents of SOM as well as the C and N fluxes were more
and fluxes were not significantly influenced when enzyme
sensitive to changes in C processes, such as depolymerisa-
allocation was turned off (Figs. 3 and 5). More profound dif-
tion, organic matter sorption and litter partitioning, while the
ferences were observed in the composition and radiocarbon
microbial dynamics and the P fluxes were more sensitive to
profile of SOC; there was less litter and more SOC in the
changes in microbial and nutrient processes, such as maxi-
SEAM-off scenario than in the Base Scenario, resulting a
mum biomineralisation rate (vmax,biomin ) and P recycling dur-
systematic difference in the radiocarbon profiles between the P
ing microbial decay (ηres→dom ). Overall, most of the selected
two scenarios (Fig. 4).
outputs were strongly influenced by microbial stoichiometry.
www.geosci-model-dev.net/13/783/2020/ Geosci. Model Dev., 13, 783–803, 2020792 L. Yu et al.: JSM
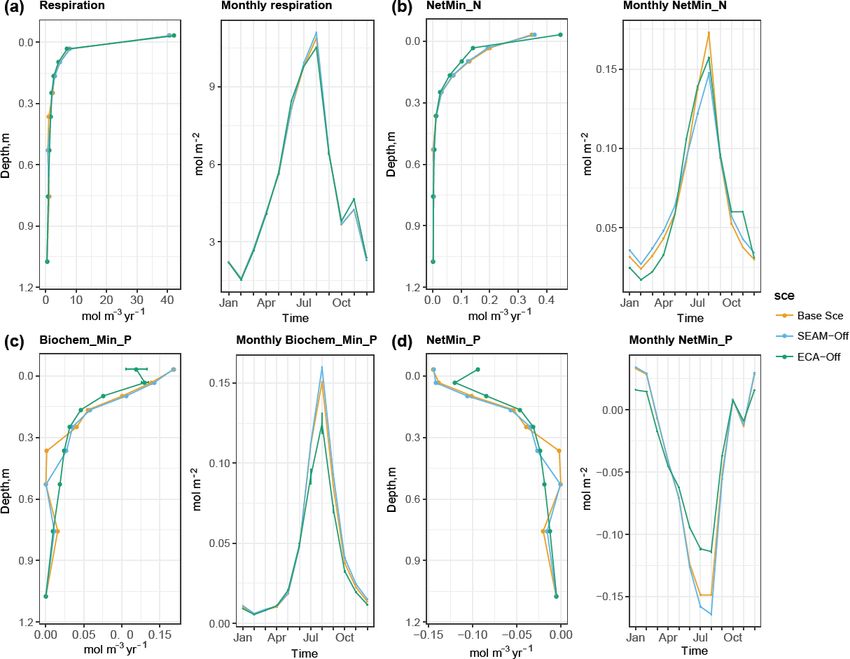
Figure 5. Simulated seasonal and vertical distribution of (a) respiration, (b) net N mineralisation, (c) biochemical P mineralisation and (d) net
P mineralisation at the study site at 1 m soil depth. Points represent the mean values and error bars represent the standard deviations, both
calculated using data from the last 10 years of model experiments.
The five most influencing parameters in JSM were micro- This decoupling of the soil P cycle is represented by
C:N ), microbial N : P ratio (χ N:P ), micro-
bial C : N ratio (χmic biomineralisation in TBMs; however, the vertical decoupling
mic
bial mortality rate (τmic ), soluble litter C fraction transformed of C : N : P stoichiometry is poorly reproduced (Fig. S6) even
into DOM (ηC,sol→dom ), and P fraction recycled from res to when microbial biomass is explicitly represented (Yu et al.,
P
dom during microbial decay (ηres→dom ). 2018). Our study indicated that the decrease in C : N ratio
is mainly due to a shift in SOC composition with soil depth
(Fig. 4), whereby the fraction of the nutrient-poor litter com-
4 Discussion ponent decreases and the nutrient-rich MOC component in-
creases. Slight overestimation of the modelled soil C : N ratio
4.1 Features of nutrient cycling
in the first layer (Fig. 3) is probably due to the higher C : N
4.1.1 Soil stoichiometry ratio (52) of leaf litter inputs than the observed one (41.7).
However, with respect to the decrease in C : P ratio, the
Following calibration, JSM could reproduce the main soil model simulations indicated that the change in microbial
stocks of C, N and P; microbial biomass; and soil bulk den- nutrient recycling scheme with depth might be associated
sity as well as their vertical patterns along the soil profile in a with shift in the SOC component. To account for differ-
beech forest stand in Germany. The observed SOM C : N ra- ent stoichiometry of cell walls and plasma of microbes in
tio (19.5) and the C : P ratio (348) in the first model layer JSM, we introduced the microbial nutrient recycling pa-
X
rameter (ηres→dom , X for N or P) that partitions microbial
– the O–A horizon – fit well within the ranges of the re-
ported soil stoichiometry of temperate broadleaf forests (Xu residues with lower C : N : P ratio according to P stoichiom-
et al., 2013), and there was a much stronger decreasing trend etry; that is, a higher nutrient content is allocated to DOM,
in the C : P ratio than in the C : N ratio with an increase in while the residual pool receives the remaining part with a
soil depth, indicating that organic P in SOM is “decoupled” lower nutrient content. Since JSM currently does not distin-
from the C and N cycles (Yang and Post, 2011; Tipping et al., guish between microbial guilds, the microbial nutrient recy-
2016). cling parameters also mimic different stoichiometry of mi-
crobial guilds, such as bacteria and fungi. The model only
Geosci. Model Dev., 13, 783–803, 2020 www.geosci-model-dev.net/13/783/2020/L. Yu et al.: JSM 793
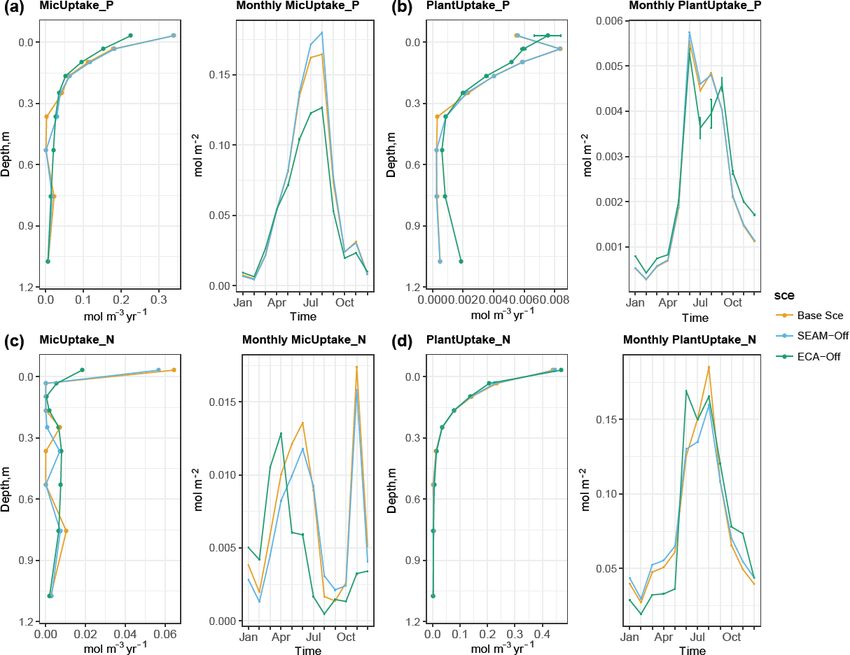
Figure 6. Simulated seasonal and vertical distribution of (a) microbial inorganic P uptake, (b) plant P uptake, (c) microbial inorganic N
uptake and (d) plant N uptake at the study site at 1 m soil depth. Points represent the mean values and error bars represent the standard
deviations, both calculated using data from the last 10 years of model experiments.
adequately reproduced the vertical SOM C : P ratio profile further investigation, particularly for the development of soil
when the microbial P recycling parameter decreases with in- profiles.
creasing depth, resulting in a decreased C : P ratio with in- In JSM, plant nutrient uptake is driven by root biomass
creasing soil depth. Such a shift in the microbial P recycling (prescribed by the QUINCY outputs) and its uptake capacity
parameters indicates changes in microbial communities from (as reported in Kuzyakov and Xu, 2013; Kavka and Polle,
a nutrient-poor fungi-dominated to a nutrient-rich bacteria- 2016). Plant uptake is further influenced by microbial (P ad-
dominated one with increasing depth, which has also been sorption) competition, but it is not regulated by plant demand
evidenced by Rousk and Frey (2015). Our model suggests due to the absence of vegetation processes. The simulated
that this community shift mainly regulates the decrease in plant N and P uptakes at the quasi-equilibrium state were
SOM C : P ratio at the study site. very close to the N and P inputs from the litterfall (Table 1),
indicating that realistic root biomass and uptake capacity en-
4.1.2 N cycle vs. P cycle able the simulation of nutrient uptake for plants. This find-
ing supports the recent change in plant uptake simulations in
JSM had already reached a quasi-equilibrium state at the end TBMs from plant demand driven (Yang et al., 2014b) to trait
of the 200-year simulation, when the respiration of C and (root biomass, uptake capacity and inorganic nutrient pool)
plant uptake of N and P were very close to the C, N and P driven (Zaehle and Friend, 2010; Goll et al., 2017; Thum
from litterfall and SOM accumulated slowly in the soil (Ta- et al., 2019), which strengthens the interactions between soil
ble 1, Fig. 2). As the simulation time increased, the C and nutrient availability and plant growth.
N cycles approached true equilibrium but the P cycle did not The simulated microbial uptake of inorganic P
(Table 1); this could be due to the lack of vegetation feedback (238.0 kg P ha−1 yr−1 ) was much higher than the plant
or the constantly increasing occluded P pool and decreasing inorganic P uptake (8.5 kg P ha−1 yr−1 ) and microbial
primary P pool that do not make it possible to reach true equi- inorganic N uptake (Fig. 7). This difference was strongly
librium in JSM. Similar trends have been observed with all driven by the difference between litterfall and microbial
TBMs because they employ the structure of the inorganic P stoichiometry. In JSM, nutrient assimilation for microbial
cycle described in Wang et al. (2010). This leads to a bound- growth occurs in two steps. In the first one, a certain fraction
ary issue, particularly in long-term simulations, and warrants
www.geosci-model-dev.net/13/783/2020/ Geosci. Model Dev., 13, 783–803, 2020794 L. Yu et al.: JSM Figure 7. Simulated yearly budget of (a) N and (b) P in soil solutions. In (a), sourcing fluxes of N are presented in the order of gross mineralisation of NH4 and NO3 and N deposition (in the bar plot: from right to the zero point; in the legend: from the top to the separation line); sinking fluxes of N are presented in the order of plant and microbial uptakes of NH4 , plant and microbial uptakes of NO3 , N leaching (both inorganic and organic), and changes in soluble N content (delta_sol_N) (in the bar plot: from left to the zero point; in the legend: from the separation line to the bottom). In (b), sourcing fluxes of P include weathering, gross mineralisation of PO4 , biochemical mineralisation of PO4 and P deposition; sinking fluxes of P includes adsorption (Exchange_fast), microbial and plant uptakes, P leaching (both inorganic and organic), and changes in soluble P content (delta_sol_P). (The order of presented processes follows the same rule as N.) The budgets are calculated using data from the full simulation (200 years) of the model experiments. of N and P (micnue and micpue ) from microbial DOM by plant demand and that of soil P is driven by microbial uptake is assimilated directly by microbes; in the second demand. step, dissolved inorganic N and P are further taken up by microbes through microbial inorganic N and P uptake to 4.1.3 Microbial stoichiometry fulfil their stoichiometry. In the Base Scenario, we used the measured microbial C : N : P ratio at the study site Since the microbial C : N : P ratio we used (10.3 : 0.8 : 1, (10.3 : 0.8 : 1), which largely differs from the litterfall Lang et al., 2017) was very different from the global average C : N : P ratio (800 : 14.8 : 1), particularly in terms of the value (42 : 6 : 1, Xu et al., 2013), additional modelling exper- P content. Therefore, although the demand for N and P for iments were conducted with the global microbial stoichiom- microbial growth does not differ much, the assimilation of etry to examine the effects of this ratio (Figs. S1 and S3–S5). dissolved organic N is much higher than that of dissolved The SOC and microbial C profiles did not differ significantly organic P, resulting in a much higher demand for microbial in the new scenarios, although the N and P stocks and fluxes P uptake than for N uptake from the inorganic pool and very were greatly influenced. As a direct consequence of a change different seasonal patterns of microbial inorganic N and P in microbial stoichiometry change, the resultant SOM C : N uptakes (Fig. 6). This is well demonstrated in Figs. 5 and 7; and C : P ratios became lower and higher, respectively, than net mineralisation, calculated by subtracting microbial values in the Base Scenario. Moreover, the total demand for inorganic nutrient uptake from gross mineralisation, is microbial N was much higher and the demand for microbial always positive for N and mostly negative for P, particularly P was much lower than that in the Base Scenario, leading in the warm season when microbial biomass is high. While to a higher microbial inorganic N uptake and lower micro- the majority of the mineralised N is taken up by plants, only bial inorganic P uptake, which in turn alter the plant–microbe a minor fraction of mineralised P is taken up by them, and competition for inorganic N and P as well as the vertical and most of it, together with the additional biomineralised P, is seasonal patterns of plant and microbial uptake of inorganic taken up by microbes in the form of dissolved inorganic P. nutrients. Although the microbial P demand was lower in the This pattern implies that the mobilisation of soil N is driven scenario with the global microbial stoichiometry than in the Geosci. Model Dev., 13, 783–803, 2020 www.geosci-model-dev.net/13/783/2020/
L. Yu et al.: JSM 795
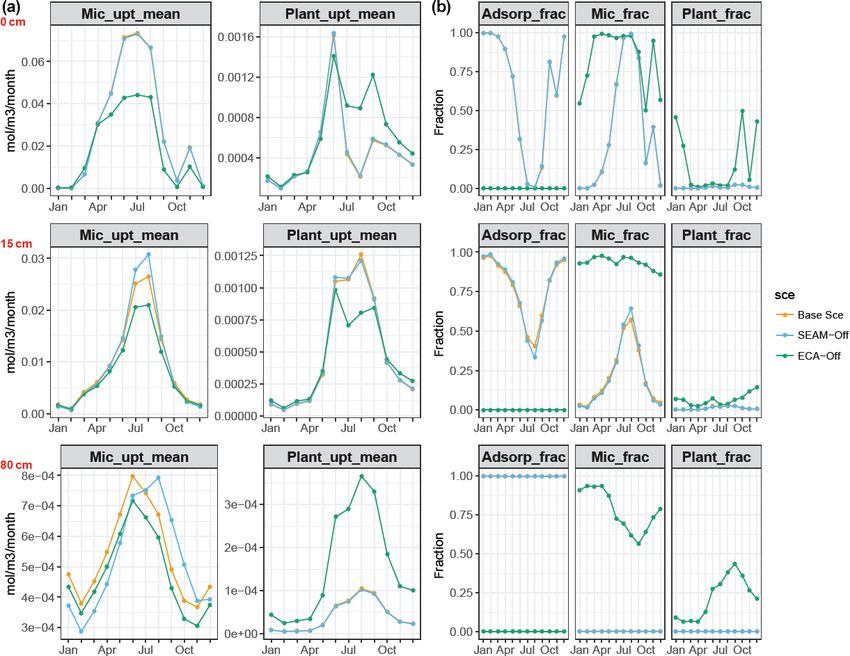
Figure 8. Simulated (a) microbial and plant P uptake rates and (b) relative competitiveness (in fractions) of P adsorption, microbial P uptake
and plant P uptake at depths of 0 (O–A horizon, upper panels), 15 (A–B horizon, middle panels) and 80 cm (B–C horizon, bottom panels).
In (a), monthly mean values at different depths are presented throughout the whole year; in (b), relative competitiveness is calculated as the
fraction of the individual rate to the sum of all three rates (P adsorption rate, microbial P uptake and plant P uptake). All data points are
derived from data from the last 10 years of model experiments.
Base Scenario, it still drove the soil P mobilisation. However, other involved processes such as adsorption–desorption and
N mobilisation in the new scenario was no longer exclusively nitrification–denitrification.
plant driven and became both microbe and plant driven. This
indicates that the microbial stoichiometry is a key factor for 4.2 Key features and model limitations
soil nutrient processes and plant–soil interactions in JSM.
In JSM, the choice of nutrient mineralisation– We applied the ECA approach described by Tang and Riley
immobilisation pathways (Manzoni and Porporato, 2009) (2013) to simulate inorganic nutrient competition. In general,
during microbial DOM uptake, i.e. the microbial nutrient our model simulations indicated that microbes take up more
use efficiencies in Eq. (S13), did not greatly change the total inorganic P than plants, which supports the findings of 33 P
microbial nutrient assimilation but significantly impacted tracer experiments at two other beech forests in Germany
the partitioning between organic (microbial DOM uptake) (Spohn et al., 2018). However, our study showed that plants
and inorganic (microbial inorganic nutrient uptake) nutrient take up more inorganic N than microbes (Figs. 7a and S1).
assimilation (Table 2). This partitioning greatly alters the This pattern seems to disagree with the findings of field stud-
isotopic signals of soil pools and is essential to understand- ies of 15 N addition (e.g. Bloor et al., 2009; Dannenmann
ing soil nutrient cycling and thus to unravelling soil effects et al., 2016) and a modelling study using the same approach
based on vegetation signals (Craine et al., 2018) – something to simulate competition (Zhu et al., 2017). The reason for
which is not possible with the current TBMs due to poorly this disagreement is that in JSM, we assumed high microbial
defined and parameterised microbial nutrient use efficiencies N use efficiency from DOM, and the majority of microbial
(Manzoni and Porporato, 2009). It is possible to use JSM N assimilation was actually fulfilled by DOM uptake. There-
to predict realistic microbial nutrient use efficiencies with fore, plants take up more inorganic N than microbes. How-
constraints of tracer experiments by labelling different ever, in 15 N tracer experiments and a model study by Zhu
forms of dissolved nutrients. However, future detailed et al. (2017), there was no distinction between assimilation
investigation is needed due to complications arising from from organic and inorganic sources; thus, microbes outcom-
pete plants in the sense that the total N assimilated by mi-
www.geosci-model-dev.net/13/783/2020/ Geosci. Model Dev., 13, 783–803, 2020796 L. Yu et al.: JSM
Table 2. The five most important parameters (Par) and their respective RPCCs for each output variable and the overall model importance
(OVI). RPCCs were calculated for each output variable, and the overall importance of parameters was measured by calculating the mean of
the absolute RPCCs across all output variables, weighted by the uncertainty contribution of these model outputs. The parameters are listed
in Table S2 and explained in Table S1. SOP: soil organic phosphorus; SIP: soil inorganic phosphorus; SON: soil organic nitrogen.
Rank 1 Rank 2 Rank 3 Rank 4 Rank 5
Variable Par RPCC Par RPCC Par RPCC Par RPCC Par RPCC
poly res 1
Total SOC vmax,depoly −0.84 vmax,depoly −0.80 τmic 0.83 ηC,wl→poly 0.71 ηC,sol→dom 0.66
Total SON C:N
χmic −0.99 res
vmax,depoly −0.94 ηC,sol→dom 0.84 N:P
χmic 0.40 ηC,wl→poly 0.38
Total SOP C:N
χmic −0.97 N:P
χmic −0.97 vmax,biomin −0.84 P
ηres→dom −0.78 1 0.74
τmic
Total SIP kweath −0.58 P
ηres→dom 0.57 vmax,biomin 0.47 N:P
χmic 0.45 P
ηres→dom −0.42
Microbial C 1 −0.98 ηC,sol→dom 0.86 C:N
χmic 0.68 N:P
χmic 0.67 ηC,wl→poly 0.67
τmic
Microbial N 1 −0.97 C:N
χmic −0.95 ηC,sol→dom 0.83 N:P
χmic 0.63 ηC,wl→poly 0.62
τmic
Microbial P 1 −0.96 N:P
χmic −0.94 C:N
χmic −0.93 ηC,sol→dom 0.79 ηC,wl→poly 0.55
τmic
Respiration 1 −0.71 N:P
χmic 0.69 C:N
χmic 0.65 res
vmax,depoly 0.45 micmin −0.37
τmic cue
Net N mineralisation C:N
χmic 0.97 res
vmax,depoly 0.65 micmin −0.40 ηC,sol→dom −0.32 1 −0.29
cue τmic
Microbial N uptake micnue −0.98 C:N
χmic −0.90 ηC,sol→dom 0.75 ηC,wl→poly 0.38 N:P
χmic 0.21
Net P mineralisation P
ηres→dom 0.94 N:P
χmic 0.84 C:N
χmic 0.84 ηC,sol→dom −0.67 ηC,wl→poly −0.53
P Biomineralisation P
ηres→dom −0.94 N:P
χmic −0.85 C:N
χmic −0.84 ηC,sol→dom 0.67 ηC,wl→poly 0.54
Microbial P uptake micpue −0.91 N:P
χmic −0.90 C:N
χmic −0.89 P
ηres→dom −0.85 ηC,sol→dom 0.70
N losses N:P
χmic 0.72 1 −0.72 C:N
χmic 0.67 dom
vmax,upt 0.41 vmax,biomin 0.35
τmic
P losses dom
vmax,upt 0.22 micpue 0.15 micmin −0.14 P
ηres→dom −0.11 P
kenz,mic −0.55
cue
OVI C:N
χmic 0.73 N:P
χmic 0.57 1 0.47 ηC,sol→dom 0.42 P
ηres→dom 0.35
τmic
crobes exceeds the total N taken up by plant roots, which P demand (Fig. S5). This result is partly supported by the
was also true in our study. Another uncertainty related to global enzymatic activity data, in which global ratios of spe-
the plant–microbe competition for inorganic N is the micro- cific C, N and P acquisition activities converged on 1 : 1 : 1
bial stoichiometry we used in parameterisation. As discussed (Sinsabaugh et al., 2008), while the global microbial stoi-
in the previous section, a change in microbial stoichiome- chiometry was much higher, indicating that relatively more
try from the observed field value to the global average value resources are allocated to acquire P than to acquire N and
resulted in a switch from microbes outcompeting plants for C. This result actually reveals a caveat in the current imple-
inorganic N to the opposite trend. Additionally, the choice mentation of enzyme allocation in JSM: the main process
of microbial nutrient use efficiencies not only affected the via which organic P is hydrolysed, biomineralisation and the
microbial demand for inorganic nutrients and the concentra- mobilisation of sorbed inorganic P due to root exudation are
tions of inorganic N and P, thereby influencing the potential not included in the enzyme allocation calculation. It also ex-
uptake rates of microbes and roots. plains the very small difference between the Base Scenario
We extended the enzyme allocation approach of the and the SEAM-off scenario.
SEAM model (Wutzler et al., 2017) by including P depen- JSM demonstrated a capacity to reproduce the vertical
dence and vertical explicitness and by assuming a steady patterns of soil stocks (Fig. 3) and to satisfactorily produce
state of enzyme production. Due to the very small micro- both vertical and seasonal patterns of biogeochemical fluxes
bial C : P ratio used in model parameterisation, our results (Figs. 5 and 6). While the seasonal patterns are primarily
indicated that depolymerisation is solely driven by P de- driven by the temperature response of the represented pro-
mand; thus, microbial residues are the preferred substrate cesses, the vertical patterns are shaped by the combined ef-
because they have a much lower C : P ratio than polymeric fects of biochemical and geophysical factors represented in
litter. This is also supported by the massive P biomineralisa- the model. As seen in Figs. 3 and 4, although total SOC
tion flux (Fig. 7) independent of depolymerisation and gross decreased with soil depth, the microbial, litter and MOC
mineralisation, indicating that microbial growth is strongly components showed very different patterns. Following the
P limited. Even in the scenario using the global microbial COMISSION model (Ahrens et al., 2020), we constrained
stoichiometry, depolymerisation was still solely P driven, the capacity of organo-mineral association with silt and clay
and P biomineralisation fulfilled over half of the microbial contents and soil bulk density in JSM. In the organic layer
Geosci. Model Dev., 13, 783–803, 2020 www.geosci-model-dev.net/13/783/2020/You can also read