Appendix 3. Fountain Head Gold Project Site Water and Solute Balance Modelling - NT EPA
←
→
Page content transcription
If your browser does not render page correctly, please read the page content below
Appendix 3. Fountain Head Gold Project Site Water and Solute Balance Modelling
Error! No text of specified style in document.

ERIAS Group
Fountain Head Gold Project: Site water and solute
balance modelling
25 May 2021

                                                                                     i
CDMSmith-1001007-ERIAS-PNX-FountainHeadGold_WaterSoluteBalanceModelling_REV3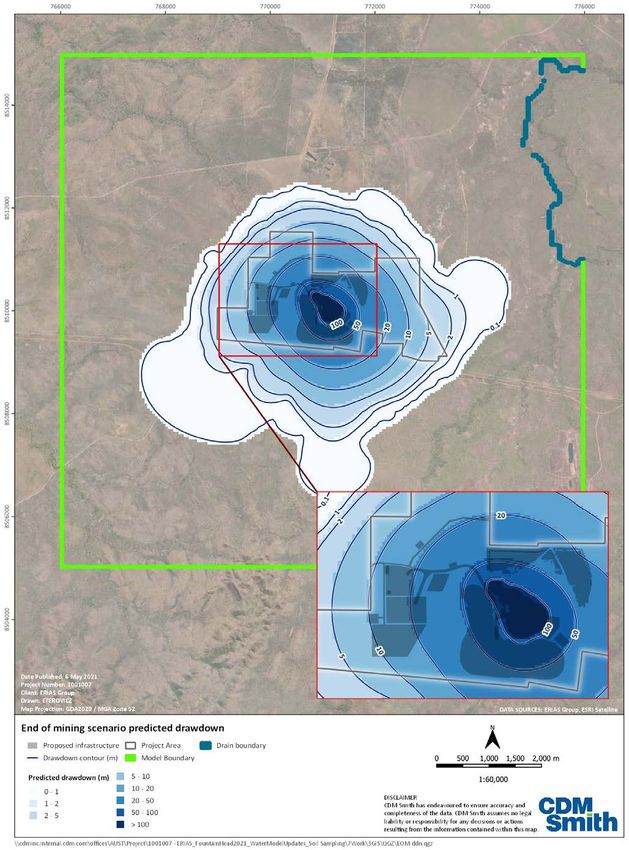
Table of Contents

Table of Contents
Section 1 Introduction ................................................................................................................................................. 1
1.1            Background ........................................................................................................................................................ 1
1.2            Objectives ........................................................................................................................................................... 1

Section 2 Supporting data and information ................................................................................................................. 3

Section 3 Physical setting ............................................................................................................................................ 4
3.1            Climate ............................................................................................................................................................... 4
3.2            Hydrology ........................................................................................................................................................... 4
3.3            Hydrogeology ..................................................................................................................................................... 6
3.3.1          Hydrostratigraphy................................................................................................................................................................. 6
3.3.2          Groundwater levels and flow direction ................................................................................................................................ 7
3.3.3          Groundwater system hydraulic properties ........................................................................................................................... 9
3.4            Hydrogeological conceptualisation .................................................................................................................. 10
3.5            Water quality evolution and representative concentrations ........................................................................... 10
3.5.1          Water quality and seasonal variability ............................................................................................................................... 10
3.5.2          Mine drainage water quality evolution .............................................................................................................................. 13
3.5.3          Representative concentrations for solute balance ............................................................................................................. 14

Section 4 Site operational water balance .................................................................................................................. 16
4.1            Overview .......................................................................................................................................................... 16
4.2            Background and previous Fountain Head modelling ....................................................................................... 16
4.3            Modelling conceptualisation overview ............................................................................................................ 19
4.3.1          Overview............................................................................................................................................................................. 19
4.3.2          Fountain Head Pit conceptualisation .................................................................................................................................. 20
4.3.3          Evaporation Pond conceptualisation .................................................................................................................................. 20
4.3.4          Fountain Head Lake conceptualisation ............................................................................................................................... 22

4.4            GoldSim water balance model construction .................................................................................................... 22
4.4.1          Model structure .................................................................................................................................................................. 22
4.4.2          Model approach ................................................................................................................................................................. 24
4.5            Fountain Head Pit dewatering model results................................................................................................... 33
4.5.1          Fountain Head Pit dewatering and recovery mass balance ................................................................................................ 33
4.5.2          Aided recovery scenario ..................................................................................................................................................... 38
4.6            Evaporation Pond water balance and seepage results .................................................................................... 39
4.6.1          Unaided recovery scenario ................................................................................................................................................. 39
4.6.2          Aided recovery scenario ..................................................................................................................................................... 42
4.6.3          Operational water level triggers and potential mitigation options .................................................................................... 42

4.7            Fountain Head Lake.......................................................................................................................................... 43
4.8            Water balance predictive uncertainty ............................................................................................................. 45
4.9            Water quality ................................................................................................................................................... 46
4.9.1          Overview............................................................................................................................................................................. 46
4.9.2          Fountain Head Pit ............................................................................................................................................................... 46

                                                                                                                                                                                               ii
CDMSmith-1001007-ERIAS-PNX-FountainHeadGold_WaterSoluteBalanceModelling_REV3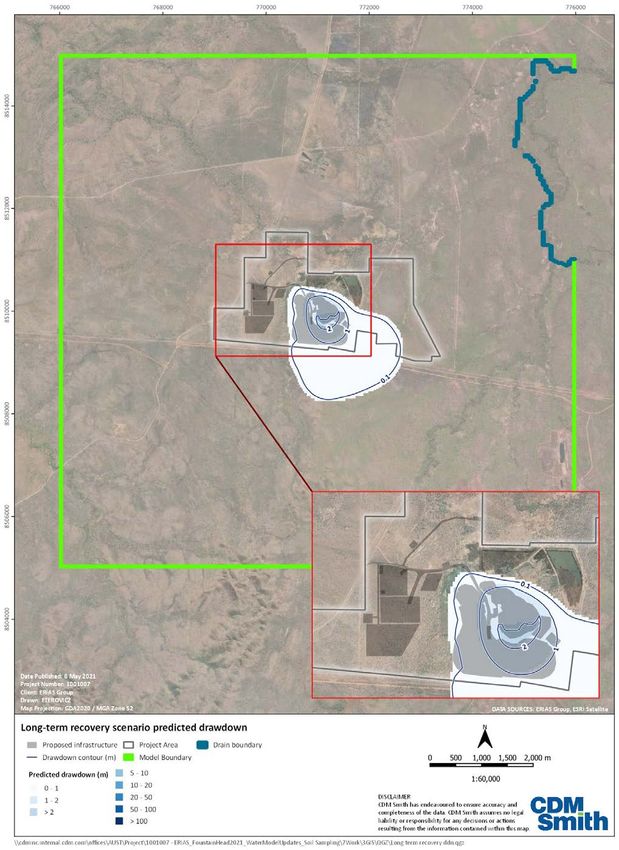
Figures
4.9.3 Evaporation Pond (unaided recovery scenario).................................................................................................................. 49
4.9.4 Fountain Head Lake ............................................................................................................................................................ 50
4.9.5 Comparison to water quality guidelines ............................................................................................................................. 52
4.10 Key findings ...................................................................................................................................................... 53
Section 5 Groundwater dynamics.............................................................................................................................. 55
5.1 Overview .......................................................................................................................................................... 55
5.2 Numerical model .............................................................................................................................................. 55
5.2.1 Model domain .................................................................................................................................................................... 55
5.2.2 Model boundary conditions and parameterisation ............................................................................................................ 57
5.2.3 Steady-state and transient calibration ............................................................................................................................... 57
5.2.4 Scenario descriptions and results ....................................................................................................................................... 59
5.2.5 Sensitivity analysis .............................................................................................................................................................. 66
5.2.6 Limitations .......................................................................................................................................................................... 66
5.3 Key findings ...................................................................................................................................................... 67
Section 6 Conclusions ................................................................................................................................................ 68
6.1 Water balance .................................................................................................................................................. 68
6.2 Solute balance .................................................................................................................................................. 68
6.3 Dewatering management ................................................................................................................................ 69
Section 7 References ................................................................................................................................................. 71
Figures
Figure 1-1 Project location map (source: ERIAS Group, 2021) ........................................................................................................ 2
Figure 3-1 Mean monthly rainfall and daily pan evaporation at Douglas River (BOM station 14901) ............................................ 4
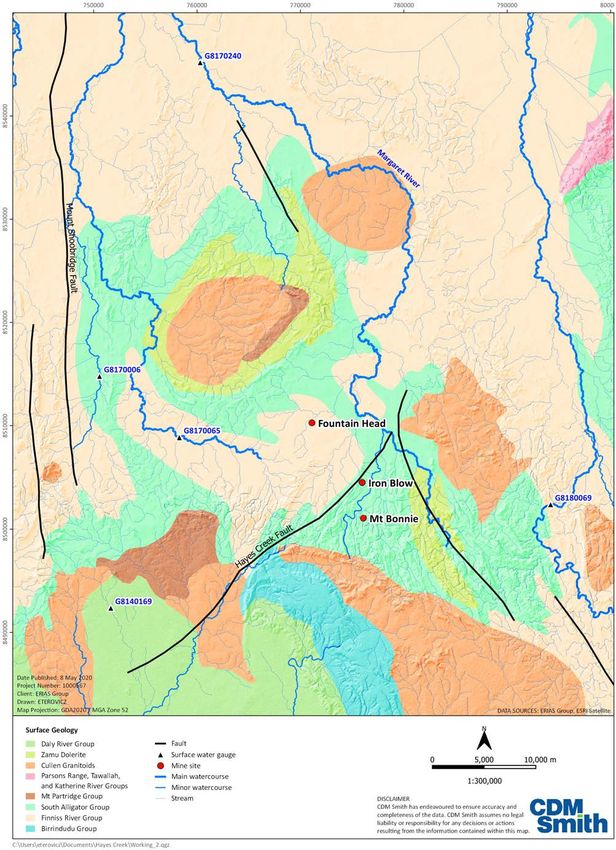
Figure 3-2 Surface water and regional geology in the vicinity of Fountain Head ............................................................................ 5
Figure 3-3 Mean monthly discharge from Margaret River at Bobs Hill (G8170240) ....................................................................... 6
Figure 3-4 Stratigraphy of the Adelaide River – Pine Creek area (Coffey, 2012) ............................................................................. 7
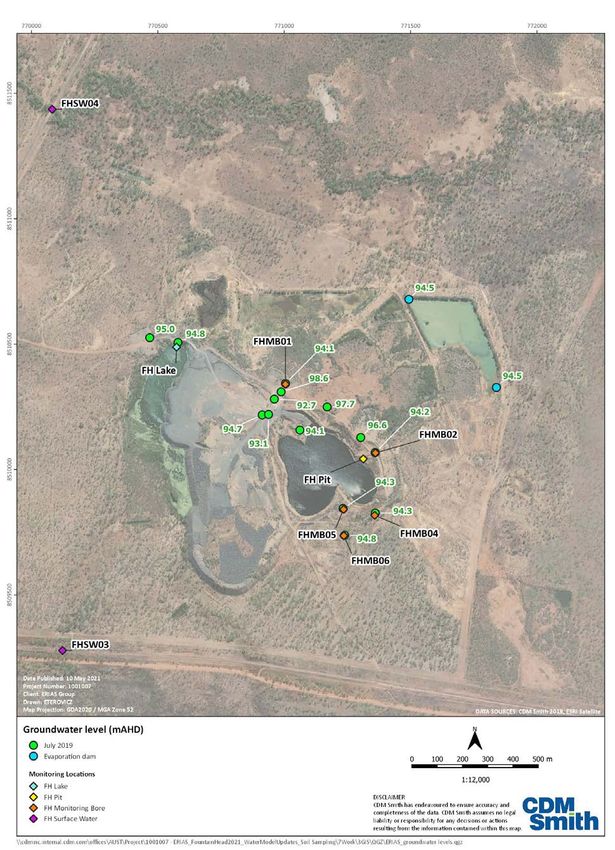
Figure 3-5 July 2019 groundwater levels (reference elevations estimated from recent DEM and differential GPS for some
locations) and monitoring sites ...................................................................................................................................... 8
Figure 3-6 Simplified hydrogeological conceptual model.............................................................................................................. 10
Figure 3-7 Fountain Head piper diagram (note “dry” & “wet” indicate Dry & Wet Season samples, respectively) ...................... 12
Figure 3-8 Fountain Head Lake and FHSW03 selected water quality analyte concentrations over time ...................................... 13
Figure 3-9 Ficklin Diagram showing selected principles that govern mine water quality (GARDGuide, 2015).............................. 14
Figure 3-10 Ficklin Diagram of Fountain Head water groups relative to reference shape of GARDGuide (2015) ........................... 14
Figure 4-1 Observed and modelled Pit Lake level over time (CDM Smith, 2019) .......................................................................... 17
Figure 4-2 Observed and modelled Pit Lake volume over time (CDM Smith, 2019) ..................................................................... 18
Figure 4-3 Modelled cumulative inflow volumes (CDM Smith, 2019) ........................................................................................... 18
Figure 4-4 Modelled cumulative volume removed due to evaporation (CDM Smith, 2019)......................................................... 19
Figure 4-5 Overview of Fountain Head Pit and Evaporation Pond water balance Stages ............................................................. 20
Figure 4-6 Evaporation Pond level-volume-surface area relationship with operational and other levels .................................... 21
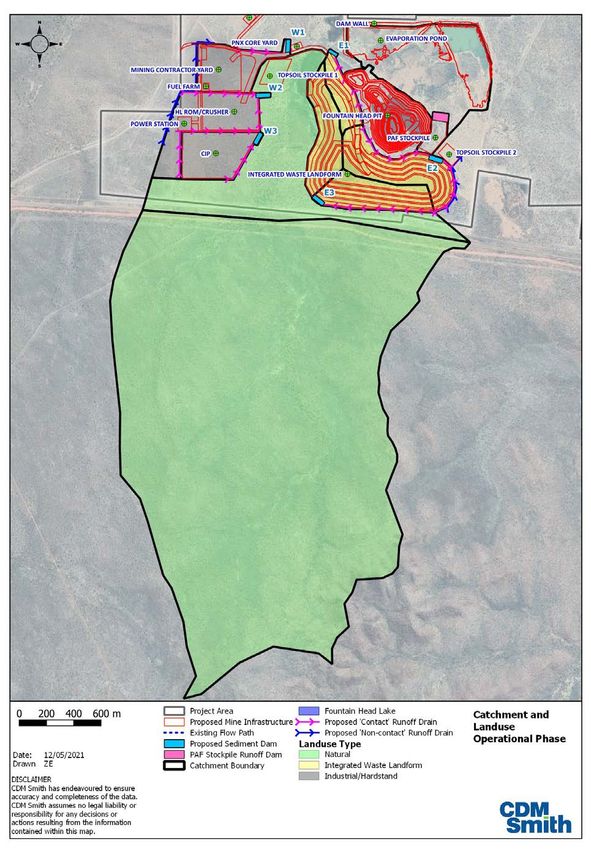
Figure 4-7 Fountain Head Lake catchment and land use............................................................................................................... 23
Figure 4-8 Fountain head site water balance schematic ............................................................................................................... 24
Figure 4-9 Evaporation Pond catchment at full capacity ............................................................................................................... 26
Figure 4-10 Predicted change in Fountain Head Pit water level during recovery for the first 50 years post-mining ...................... 33
Figure 4-11 Predicted change in Fountain Head level during dewatering and recovery (modelling Stages indicated)................... 34
iii
CDMSmith-1001007-ERIAS-PNX-FountainHeadGold_WaterSoluteBalanceModelling_REV3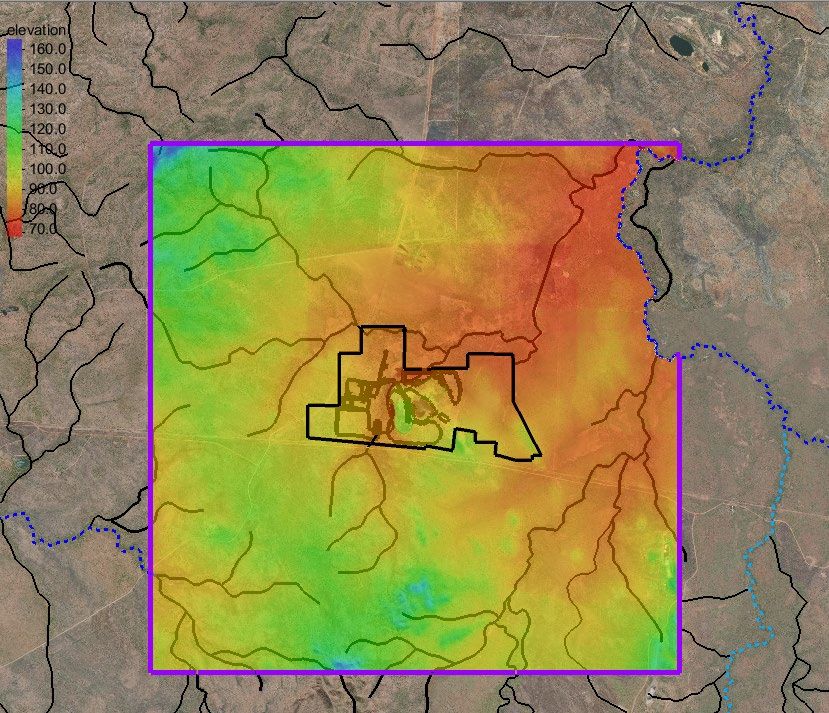
Tables

Figure 4-12   Predicted Fountain Head water levels (operational water level trigger sensitivity test at 97.9 m AHD) ..................... 35
Figure 4-13   Predicted Fountain Head water levels (operational water level trigger sensitivity test at 98.4 m AHD) ..................... 35
Figure 4-14   Predicted groundwater inflow rates during dewatering and recovery (ML/d) ............................................................ 36
Figure 4-15   Predicted mean Fountain Head Pit Lake level and inflows during dewatering and recovery ...................................... 37
Figure 4-16   Predicted mean Fountain Head Pit Lake level and outflow during dewatering and recovery (mean) ......................... 37
Figure 4-17   Summary of predicted median Fountain Head Pit mass balance for Stage I and II (pit dewatering and mining) ........ 38
Figure 4-18   Predicted water level in the Evaporation Pond ............................................................................................................ 39
Figure 4-19   Predicted volume of water storage in the Evaporation Pond ...................................................................................... 40
Figure 4-20   Predicted mean Evaporation Pond inflows time series ................................................................................................ 40
Figure 4-21   Predicted mean Evaporation Pond outflows time series ............................................................................................. 41
Figure 4-22   Summary of predicted Evaporation Pond mass balance for Stage I and II (pit dewatering and LOM) ......................... 41
Figure 4-23   Example of predicted Fountain Head Lake water level and overflow rate ................................................................... 44
Figure 4-24   Probabilistic distribution of the predicted Fountain Head Lake water levels ............................................................... 44
Figure 4-25   Summary of predicted median Fountain Head Lake mass balance for Stage I and II (pit dewatering and mining) ..... 45
Figure 4-26   Predicted mass load and water TDS in the pit for the first seven years post-mining ................................................... 47
Figure 4-27   Predicted bulk TDS of the Pit Lake over 500 years post-mining (median case) ............................................................ 47
Figure 4-28   Predicted normalised modelled pit water quality over time (median value), expressed as a percentage of the
              groundwater contaminant concentration .................................................................................................................... 48
Figure 4-29   Predicated water salinity in the Evaporation Pond ...................................................................................................... 49
Figure 4-30   Predicted normalised approach expressing Evaporation Pond concentration as a percent of the groundwater
              contaminant concentration .......................................................................................................................................... 50
Figure 4-31   Predicted water salinity in the Fountain Head Lake ..................................................................................................... 51
Figure 4-32   Predicted percentage concentration of a potential contaminant (compared to a waste rock runoff source) in FH Lake
              ...................................................................................................................................................................................... 51
Figure 4-33   Predicted conservative arsenic concentration in Fountain Head Lake (median case) ................................................. 52
Figure 4-34   Predicted arsenic concentration in Fountain Head Pit Lake (median case).................................................................. 53
Figure 5-1    Groundwater model domain with surface elevation ................................................................................................... 56
Figure 5-2    (a) 3D model view and (b) spatial discretization .......................................................................................................... 56
Figure 5-3    Comparison of observed and simulated groundwater levels ....................................................................................... 58
Figure 5-4    Comparison of groundwater flux to the pit between GoldSim and MODFLOW........................................................... 58
Figure 5-5    Current conditions – predicted steady-state groundwater contours (m AHD) ............................................................ 61
Figure 5-6    Predicted groundwater contours at the end of mining – maximum dewatering (m AHD) .......................................... 62
Figure 5-7    Predicted steady state groundwater contours 40 years post-mining (m AHD) ............................................................ 63
Figure 5-8    Predicted drawdown at the end of mining – maximum dewatering (m) ..................................................................... 64
Figure 5-9    Predicted drawdown 40 years post-mining compared to current conditions (m) ....................................................... 65
Figure 5-10   The effect of specific yield on the estimation of groundwater flux to the pit in the prediction model ....................... 66

Tables
Table 3-1     Geometric mean parameters for Fountain Head water sources .................................................................................. 15
Table 4-1     Adopted catchment areas and land use ....................................................................................................................... 27
Table 4-2     Adopted AWBM parameters ........................................................................................................................................ 28
Table 4-3     Monthly evaporators efficiency ................................................................................................................................... 29
Table 4-4     Summary of the model parameters ............................................................................................................................. 30
Table 4-5     Sensitivity testing for Evaporation Pond water level operational trigger for life of mine period ................................. 34
Table 4-6     Predicted Fountain Head Pit water balance summary from June 2021 to April 2025 (end of mining operations) ...... 38
Table 4-7     Predicted Evaporation Pond water balance summary from June 2021 to April 2025 (end of mining operations) ...... 42
Table 4-8     Predicted Fountain Head Lake water balance summary from June 2021 to April 2025 (end of mining operations) ... 45
Table 4-9     Current and predicted concentration of water chemical elements after 30 and 500 years in Fountain Head Pit ....... 48

                                                                                                                                                                                              iv
CDMSmith-1001007-ERIAS-PNX-FountainHeadGold_WaterSoluteBalanceModelling_REV3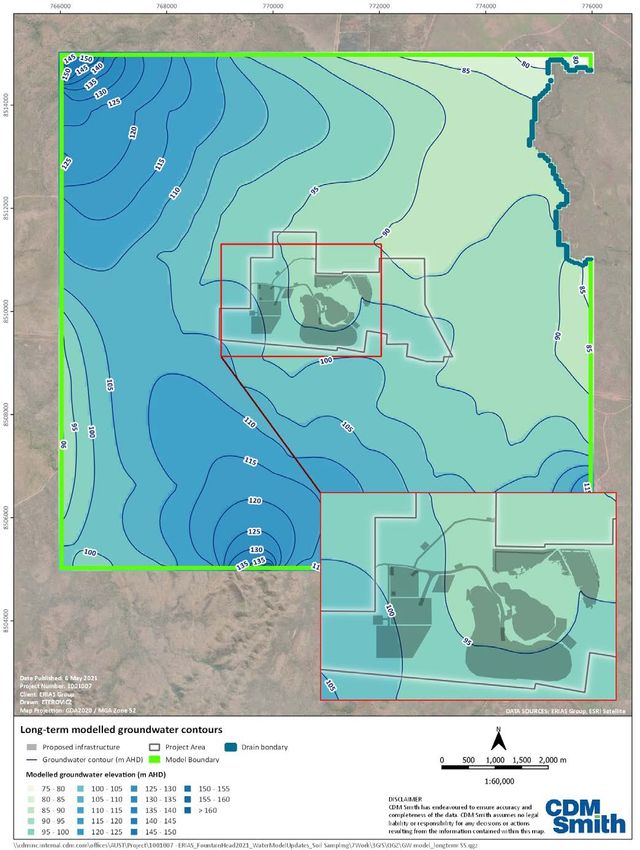
Document history & status

Table 4-10     Fountain Head Lake catchment parameters ................................................................................................................ 50
Table 5-1      Calibrated model parameters....................................................................................................................................... 59
Table 5-2      Groundwater model balance for all scenarios.............................................................................................................. 60

Document history & status
 Revision      Date issued                 Reviewed by                     Approved by                      Date approved                   Revision type
 REVA          6/04/2020                   R Cranswick                     R Cranswick                      10/03/2021                      Revised Final as Draft
 REVB          17/03/2021                  C Li, Z Eterovic                R Cranswick                      19/03/2021                      Final Draft
 REV0          19/03/2021                  ERIAS Group                     ERIAS Group                      24/03/2021                      Final Draft Review
 REV1          07/04/2021                  R Cranswick                     R Cranswick                      08/04/2021                      Final
 REV2          26/04/2021                  R Cranswick                     R Cranswick                      12/05/2021                      Revised Final
 REV3          24/05/2021                  R Cranswick                     R Cranswick                      25/05/2021                      Revised Final

Distribution of copies
 Version                               Date issued                        Quantity                              Electronic                      Issued to
 REV0                                  19/03/2021                         1                                     Y                               ERIAS Group
 REV1                                  08/04/2021                         1                                     Y                               ERIAS Group
 REV2                                  12/05/2021                         1                                     Y                               ERIAS Group
 REV3                                  25/05/2021                         1                                     Y                               ERIAS Group

 Last Saved:                           25 May 2021
 File Name:                            CDMSmith-1001007-ERIAS-PNX-FountainHeadGold_WaterSoluteBalanceModelling_REV3
 Authors:                              Roger Cranswick, Jakob Pretzsch-Kalsgaard, Vincent Puech, Zlatko Eterovic, Chris Li
 Project Manager:                      Roger Cranswick
 Client:                               ERIAS Group
 Document Title:                       Fountain Head Gold Project: Site water and solute balance modelling
 Document Version:                     REV3
 Project Number:                       1001007

                                                                                                                                                                             v
CDMSmith-1001007-ERIAS-PNX-FountainHeadGold_WaterSoluteBalanceModelling_REV3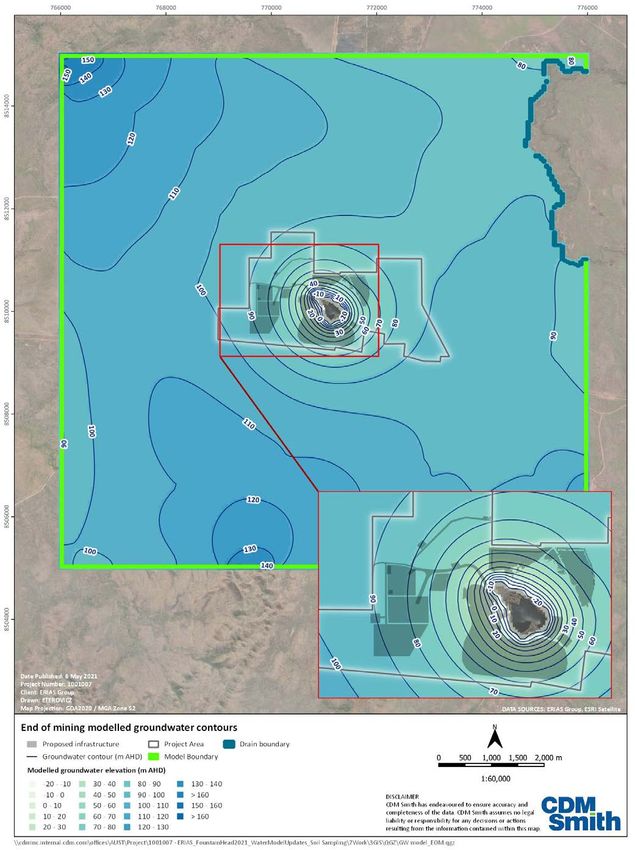
Section 1 Introduction
Section 1 Introduction
1.1 Background
CDM Smith Australia Pty Ltd (CDM Smith) has been engaged by PNX Metals Limited (PNX), through ERIAS Group, to
undertake water-related assessments in support of environmental approvals for the proposed Fountain Head Gold
Project (the Project). The Project is located approximately 170 km south of Darwin (Figure 1-1) within the Pine Creek
region of the Northern Territory.
The Project involves brownfield development of the Fountain Head deposit, where gold mining and exploration dates
back to the late-1800’s. Mining at Fountain Head was most recently undertaken from 2007 to 2009 by GBS Gold. PNX
acquired the tenements in 2018, following further exploration and a mining scoping study completed in 2019. Recent
exploration drilling intersected notable gold mineralisation in the vicinity of the existing open (but flooded) pit,
prompting a renewed focus on the Fountain Head site. As outlined in the Notice of Intent (ERIAS Group, 2019), PNX
proposes to use open pit mining methods and a carbon in pulp plant (CIP) at the Project site with the following related
activities:
Dewatering of the existing Pit Lake and expansion of the existing open pit
Expansion of the waste rock storage (WRS) as an integrated waste landform (IWL)
Construction of processing related areas, crushing facility and gold processing plant
Construction of supporting infrastructure and expansion of the existing Evaporation Dam to an Evaporation Pond
(EP) for water storage
Surface water and groundwater management are critical to the success of this project, which has prompted the need
for more detailed assessment and water balance modelling. The CDM Smith scope of works has a number of
components that will contribute to the development of a Mine Management Plan (MMP) and Environmental Impact
Statement (EIS) related to the Project – these components include:
Two short technical reports describing 1) a proposed shallow groundwater monitoring network, and 2) the soil
infiltration testing and assessment of potential solute fate from tailings stored within the IWL and temporary PAF
stockpile (CDM Smith 2021a)
A technical report documenting the model predicted water fluxes and quality changes related to Fountain Head
Pit dewatering and Evaporation Pond storage through to the mine closure Stage, and other site water balance
components (this report)
A technical report related to other scoped components including catchment, surface water and flood modelling
(CDM Smith 2021b)
1.2 Objectives
The objectives of this report relate to the development of the Fountain Head Gold Project approval documents to:
Estimate the life of mine (LOM) dewatering requirements for safe mining operations
Estimate the seepage rates from the Evaporation Pond and conservative water quality evolution within the Pond
Predict the Fountain Head Pit Lake recovery and conservative water quality evolution post-mining
Generate maps showing the predicted groundwater contours during pre-mine, mining and closure stages
Demonstrate that the planned water storage capacity and evaporators will be sufficient to enable dewatering of
the pit for mining, and storage of water on site without uncontrolled discharge
1
CDMSmith-1001007-ERIAS-PNX-FountainHeadGold_WaterSoluteBalanceModelling_REV3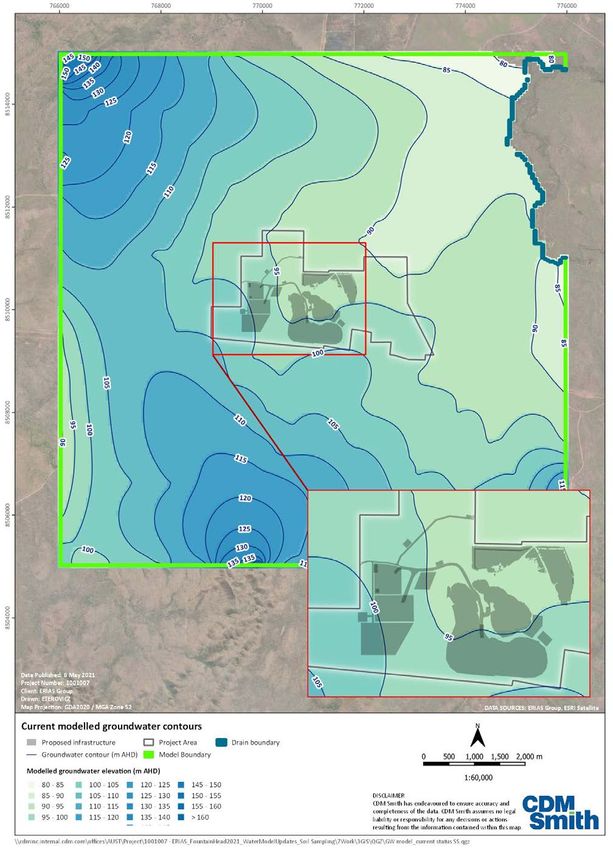
Section 1 Introduction

Figure 1-1   Project location map (source: ERIAS Group, 2021)

                                                                                                  2
CDMSmith-1001007-ERIAS-PNX-FountainHeadGold_WaterSoluteBalanceModelling_REV3
Section 2 Supporting data and information
Section 2 Supporting data and information
All supporting data and information have been sourced either from publicly available data or from ERIAS Group. Data
and information supplied to ERIAS Group by PNX includes the following:
Historical water quality and climate information
Proposed site layouts and mining plans
Basemap spatial data (e.g. streams)
Multiple digital elevation models and revised surface elevations of selected groundwater bores
Various spreadsheets (e.g. historical hydrochemical data, proposed mine schedule and water balance)
Historical reports and documentation related to the Project (e.g. Notice of Intent, referenced reports)
A listing of references used in this report is provided in Section 7.
3
CDMSmith-1001007-ERIAS-PNX-FountainHeadGold_WaterSoluteBalanceModelling_REV3Section 3 Physical setting
Section 3 Physical setting
3.1 Climate
Two distinct seasons are experienced in the Project area - a wet season typically occurring from November to April
and a dry season typically occurring from May to October. The wet season is characterised by warm to hot
temperatures with high humidity and rainfall. The dry season is characterised by cooler temperatures, lower humidity
and little to no rainfall (see Figure 3-1). The majority of rainfall typically occurs between November and March.
Average annual rainfall is around 1200 mm (Douglas River).
Douglas River BoM Station
300 300
Average monthly pan evaporation (mm)
Average monthly rainfall (mm)
250 250
200 200
150 150
100 100
50 50
0 0
Jan Feb Mar Apr May Jun Jul Aug Sep Oct Nov Dec
Rainfall Pan evaporation
Figure 3-1 Mean monthly rainfall and daily pan evaporation at Douglas River (BOM station 14901)
Potential evapotranspiration (PET) (shown here as the pan evaporation rate) remains high throughout the year,
peaking in the build-up to the wet season before humidity increases with net yearly evaporation exceeding net yearly
rainfall (Figure 3-1).
3.2 Hydrology
Little is known about the hydrology of the Margaret River and its tributaries within the Project area (Figure 3-2).
Anecdotally and from previous field observations, there have been end-of dry season pools along some watercourse
reaches. Their presence in the dry season is likely dependent on the previous wet season’s rainfall and runoff, and
subsequent groundwater recharge, baseflow and evaporation.
The nearest surface water gauge on the Margaret River is at Bobs Hill (G8170240; Figure 3-2) some 50 km
downstream of the Fountain Head site. Figure 3-3 shows the measured ephemerality of the flow regime at this
location with an incomplete data record from 1967 to 1986 after which there are no data. Flow duration is typically
between three and six months.
4
CDMSmith-1001007-ERIAS-PNX-FountainHeadGold_WaterSoluteBalanceModelling_REV3Section 3 Physical setting
Figure 3-2 Surface water and regional geology in the vicinity of Fountain Head
5
CDMSmith-1001007-ERIAS-PNX-FountainHeadGold_WaterSoluteBalanceModelling_REV3Section 3 Physical setting
10000
1000
Mean monthly discharge (ML/d)
100
10
1
0.1
1967
1968
1969
1970
1971
1972
1973
1974
1975
1976
1977
1978
1979
1980
1981
1982
1983
1984
1985
1986
1987
Figure 3-3 Mean monthly discharge from Margaret River at Bobs Hill (G8170240)
3.3 Hydrogeology
3.3.1 Hydrostratigraphy
The Project is located within the Pine Creek Geosyncline geological province, within which McGowan (1989) has
identified four Proterozoic hydrostratigraphic units (HSUs):
Alluvial sediments – alluvial aquifer where saturated
– Variably weathered mudstone with poorly sorted sandstone, gravel and cobbles containing pyritic veining;
comprised of remnant fragments of the Mt Bonnie Formation.
– Forms the alluvial cover of the Margaret River floodplain and tributaries.
– Groundwater flow and storage controlled by primary porosity.
Burrell Creek Formation – fractured rock aquifer
– A fine to course-grained feldspathic meta-greywacke consisting of minor slate/phyllite, mudstone, schist
and lenses of volcanilithic pebble conglomerate.
Mt Bonnie Formation – fractured rock aquifer
– An interbedded carbonaceous unit consisting of pyritic and/or chloritic slate, feldspathic metagreywacke
and ferruginous phyllite (metasiltstone) with chert lenses and nodules.
– Conformably overlies the Gerowie Tuff.
Gerowie Tuff – fractured rock aquifer
– A combination of cherty/feldspathic crystal tuff, lithic tuff with minor felsic ignimbrite, volcaniclastic shale
and siliceous siltstone.
Figure 3-4 presents the stratigraphic relationships. The sub-regional geology in the vicinity of Fountain Head is
bounded by the Hayes Creek Fault to the south, the Pine Creek Shear Zone to the east and the Shoobridge Fault to the
west (Figure 3-2). The original geometry of these sedimentary units has undergone significant distortion while surface
geology at Fountain Head is dominated by weathering products of the Burrell Creek Formation.
6
CDMSmith-1001007-ERIAS-PNX-FountainHeadGold_WaterSoluteBalanceModelling_REV3Section 3 Physical setting
Figure 3-4 Stratigraphy of the Adelaide River – Pine Creek area (Coffey, 2012)
3.3.2 Groundwater levels and flow direction
Groundwater level monitoring and sampling was conducted by CDM Smith from the 15th to 19th of July 2019. The
results of this field work are summarised in CDM Smith (2020a) and have been used where relevant in this report
along with historical information provided by ERIAS Group. Figure 3-5 shows the most recent (July 2019) groundwater
heads gauged at wells around the Fountain Head site. Given the uncertainty associated with screened/open intervals
and reference elevations of some bores, combined with a near-flat hydraulic gradient, it is difficult to infer a clear
groundwater flow direction from the data nor vertical head gradients within the HSUs. PNX staff collected refined
reference elevations for some groundwater bores in early 2021, and these have been used where relevant to improve
the accuracy of groundwater level data from the bores surveyed.
7
CDMSmith-1001007-ERIAS-PNX-FountainHeadGold_WaterSoluteBalanceModelling_REV3Section 3 Physical setting
Evaporation
Dam
Figure 3-5 July 2019 groundwater levels (reference elevations estimated from recent DEM and differential GPS
for some locations) and monitoring sites
8
CDMSmith-1001007-ERIAS-PNX-FountainHeadGold_WaterSoluteBalanceModelling_REV3Section 3 Physical setting
Conceptually, the Fountain Head Pit is likely to be acting as a local groundwater discharge zone with minor
throughflow due to the overall deficit between evaporation and rainfall (i.e. pit water levels may decline when
evaporation exceeds rainfall, causing groundwater to flow from the aquifer into the pit). Given the Pit Lake is likely to
have now fully recovered after previously being dewatered (CDM Smith, 2019) it is possible for there to be a
throughflow component also. Regional groundwater flow is assumed, based on topography, to be in a north-easterly
direction while site data does not resolve a clear flow direction given its proximity to the Pit Lake. Partly this is due to
the uncertainty of the elevation (m AHD) of each monitoring point, and it is also possible the water table surface is
quite flat in this area of relatively low relief (i.e. hydraulic gradients may be quite low). At the time of writing, there
have been only a limited number of groundwater level measurements with accurate reference elevations from
monitoring bores. Accurate reference elevations from all monitoring bores and additional time-series water level data
(groundwater and surface water) will be needed to reduce uncertainty related to groundwater flow direction and
potential connection between the shallow groundwater and surface water features (i.e. Fountain Head Lake and the
Evaporation Pond), in addition to an expansion of groundwater monitoring at greater distances away from the Pit
Lake.
Other on-site surface water features, including the Fountain Head (FH) Lake (to the west of the WRS) and the
Evaporation Dam appear to have at least some of their extent permanently inundated based on historical satellite
imagery (Figure 3-5). This implies they may be fed by groundwater discharge and their bed levels could be intersected
by the water table.
3.3.3 Groundwater system hydraulic properties
Hydrogeological investigations by CDM Smith have been undertaken previously at the nearby Mt Bonnie and Iron
Blow sites (Figure 3-2) (CDM Smith, 2018), where estimates of hydraulic conductivity derived for the Mt Bonnie
Formation range from less than 0.5 m/d up to around 33 m/d (geometric mean of around 4 m/d), and estimates
derived for storativity value around 7x10⁻⁵.
A shallow geotechnical study by WANT Geotechnics (2020) at the Fountain Head site involved a series of falling head
permeability tests on the silty clay soils / weathered basement. These tests were conducted in shallow test pits using
MiniDisk Infiltrometers and in shallow dynamic cone penetrometer (DCP) holes using Falling Head Permeameters. The
geometric mean of the hydraulic conductivity values derived from all nine tests was 3.4x10⁻² m/d, with a minimum
and maximum value of 2x10⁻³ and 5x10⁻¹ m/d, respectively. These test results are considered to be relatively high for
silty clays (but possibly representative of silty soils with sandy lenses) and may not be representative of the saturated
hydraulic conductivity of the soils (noting that some tests were not sufficiently detailed or repeated to provide high
confidence in their results). This may be a result of the influence of preferential pathways or disturbed ground, in
combination with the nature of short-duration tests. Based on the soil descriptions, CDM Smith considers these
estimates to be too high for meaningful application to the Evaporation Pond seepage assessment.
Recent field work by CDM Smith in early-2021, completed additional infiltration testing using Talsma Permeameters
within the extent of the proposed Evaporation Pond (EP) area. Collecting water level measurements every 30 seconds
until the infiltration rate became constant, these tests can be considered with greater confidence. Four tests were
completed at each of two sites (western and south western segments) and intersected variable soils from silty clays
with a median vertical hydraulic conductivity of 1.5x10⁻² m/d with three tests indicating values < 1x10⁻³ m/d, which are
captured within the Monte Carlo analysis for this parameter (Section 4.4). Three tests in silty sands and clayey silts
with minor sand, had a median of 1.2 m/d but are not considered representative of the bulk characteristics of the
proposed EP. It is clear from these tests that the vertical hydraulic conductivity of the soils within the proposed EP are
highly variable, and larger scale infiltration tests may be needed to make more reliable estimates of potential
infiltration rates. More detail on these and other sites can be found in CDM Smith (2021a).
Fountain Head water balance modelling completed by CDM Smith (2019) used an analytical solution to match
groundwater inflow rates to the pit as it has recovered over time since last being dewatered. Through calibration to
the historical pit water level (recovery) data, a fractured rock aquifer hydraulic conductivity value of 0.2 m/d produced
a good fit to the observations, which is similar to the lower end of the range observed for the Mt Bonnie Formation
9
CDMSmith-1001007-ERIAS-PNX-FountainHeadGold_WaterSoluteBalanceModelling_REV3Section 3 Physical setting
around Mt Bonnie and Iron Blow. This hydraulic conductivity value is considered to be representative of bulk hydraulic
conductivity of the aquifer hosting the Fountain Head Pit.
3.4 Hydrogeological conceptualisation
The water table surface is likely to follow a subdued form of the topography and also be structurally controlled due to
the nature of fractured rock aquifers (i.e. flow through networks of connected fractures). Groundwater discharge is
expected along ephemeral creek lines as groundwater evapotranspiration from riparian vegetation and as direct
groundwater discharge (i.e. baseflow) when groundwater heads are higher than Stage / bed height of the ephemeral
creeks. An unnamed ephemeral creek is located approximately 1 km north of the Fountain Head Pit and flows
approximately 5 km towards the northeast before joining the Margaret River, consistent with the inferred
groundwater flow field. End of wet season baseflow may occur but this is unclear due to a lack of flow information or
groundwater measurements in the vicinity of the watercourses.
An indicative conceptual cross-section from the top of the surface water catchment (south of the site) through the
Fountain Head Pit and to the Margaret River is shown in Figure 3-6.
Fountain Head pit
Evaporation + rainfall + runoff Groundwater
Rainfall recharge
evapotranspiration
Waste rock dump Unnamed creek Margaret river
100 m
Regional groundwater flow
South-southwest 12 km North-northeast
Figure 3-6 Simplified hydrogeological conceptual model
3.5 Water quality evolution and representative concentrations
3.5.1 Water quality and seasonal variability
The fractured rock aquifers of the Pine Creek Geosyncline are characterised by relatively fresh groundwater. Although
groundwater salinity is generally low, some areas contain elevated concentrations of heavy metals, particularly in
mineralised zones, with arsenic being the most commonly encountered. Typically, sulfide orebodies in the study area
are potentially acid forming (PAF) and prone to generation of acidic and metalliferous drainage (AMD) when exposed
to air or oxidised. AMD has the potential to alter surface and groundwater quality with subsequent potential for
impacting Environmental Values. It should be noted that the groundwater and surface water at the Fountain Head site
contain relatively elevated background concentrations of a range of metals. This is likely to be a result of natural water
chemistry and/or in combination with legacy mining operations.
PNX is currently undertaking a further testing program to define the geochemical characteristics of existing and
possible future ore and waste materials, and have indicated that large quantities of PAF material are not expected to
require complex management based on 2020 results. Any PAF material identified during mining operations, will be
stockpiled adjacent to the south-eastern corner of the Pit during operations. Once mining has ceased this will be
backfilled into the pit and submerged below the recovering Pit Lake water levels.
10
CDMSmith-1001007-ERIAS-PNX-FountainHeadGold_WaterSoluteBalanceModelling_REV3Section 3 Physical setting
Collection of historical and recent surface water and groundwater samples in the Project area (ERIAS 2020; CDM Smith
2020a) enable the interpretation of representative water types and inferences of potential mixing between them. The
concentrations of major ions reported for these samples are presented in a Piper diagram (Figure 3-7) and are
categorised into five groups (including “dry” and “wet” sub-groups for dry and wet season samples, respectively) to
give an indication of the potential mixing of waters that could be occurring on site. It should be noted that FH Lake is a
different site to FH pit (see Figure 3-5 for locations) and that both of these sampling locations are thought to be
influenced by mine-related water-rock interaction processes (i.e. the source of altered chemical water composition as
shown at the top of diamond section of Figure 3-7). Key observations relating to the hydrochemical data are:
The Fountain Head Pit contains a considerable historical dataset including depth profiling in October 2016
The groundwater and surface water types range from Mg- to Na-HCO3 and are similarly grouped, suggesting
these waters have undergone similar degrees of water-rock interaction (i.e. conceptually, shallow groundwater
may be sourced from surface water as sheet-flow or creek flow, noting that surface water samples are from both
wet and dry seasons)
The groundwater samples have elevated Mg and HCO3- relative to surface water samples suggesting interaction
with dolomitic rocks
Fountain Head Lake is predominantly a Mg-SO4 type water with some spread towards Mg-HCO3 suggesting
localised water-rock interaction (e.g. from adjacent WRS or waste rock within the pit)
The Fountain Head Pit water samples are more tightly grouped as a Mg-HCO3 type water
The Fountain Head Pit grouping appears to be a mixture of the local source that contributes to the FH Lake
samples (i.e. water type found at the top of diamond section of Figure 3-7) and a groundwater source from the
near-vicinity of the Pit.
11
CDMSmith-1001007-ERIAS-PNX-FountainHeadGold_WaterSoluteBalanceModelling_REV3Section 3 Physical setting
Figure 3-7 Fountain Head piper diagram (note “dry” & “wet” indicate Dry & Wet Season samples, respectively)
Analysis of historical time series water quality data shows that runoff originating in the southern part of the
catchment (represented by FHSW03 shown in Figure 3-5) strongly influences the concentrations of water quality
analytes in Fountain Head Lake. Effectively, the volume of water stored in the Lake is flushed each year during the wet
season prior to returning to concentrations indicative of mine-drainage (see next section). This is represented in
Figure 3-8 where hardness (as CaCO3) and dissolved iron concentrations are shown for Fountain Head Lake and
FHSW03 over time (other major ions and metals show similar changes). This flushing effect is most-easily seen
following the 2014 dry season where increasing major ion concentrations suddenly drop at the onset of the 2014/15
wet season. This corresponds with a spike in dissolved iron and other metals (aluminium, copper and zinc), which are
thought to be the result of dissolution from the relatively old and weathered soils in the region by rainfall-runoff.
12
CDMSmith-1001007-ERIAS-PNX-FountainHeadGold_WaterSoluteBalanceModelling_REV3Section 3 Physical setting
1000 10000
100 1000
Concentration (mg/L)
10 100
Rainfall (mm)
1 10
0.1 1
0.01 0.1
Rainfall Iron (FH Lake) Hardness (FH Lake) Iron (FHSW03) Hardness (FHSW03)
Figure 3-8 Fountain Head Lake and FHSW03 selected water quality analyte concentrations over time
3.5.2 Mine drainage water quality evolution
The generation, release, mobility and attenuation of mine drainage are complex processes governed by a combination
of physical, chemical and biological factors (GARDGuide, 2015). The extent to which mine drainage enters and affects
the environment depends largely on the characteristics of the sources, pathways and receptors which vary by
commodity, climate, mine facility and phase. Ficklin Diagrams provide a method for illustrating the influence of these
processes and can be used to interpret variations in mine drainage water chemistry between different deposits.
Traditionally the diagram is populated by plotting the sum of base metals zinc (Zn), copper (Cu), lead (Pb), cadmium
(Cd), cobalt (Co), and nickel (Ni) against pH which allows for a diagnosis on different geological controls.
Figure 3-9 provides an overview for means of interpreting a Ficklin Diagram. The location in which data points plot on
the diagram can provide an indicative diagnosis of the mine drainage type, i.e. whether the drainage type is acid mine
drainage (AMD) or neutral mine drainage (NMD) / saline drainage. The locality of the data points, however, should not
be construed as representing strict classifications as there are no formal guidelines for quantitative definitions of the
mine drainage types mentioned (GARDGuide, 2015). Also depicted on the figure are the principles which govern the
mine water quality that can explain increases/decreases in acidity and base metal concentrations.
The water groups at Fountain Head have been plotted on a Ficklin Diagram in Figure 3-10. Using the earlier figure as a
diagnostic reference it can be observed that water groups at the Fountain Head site can be classified as NMD water
due to their near-neutral pH and base metal concentrations. Using the principles outlined in the Ficklin Diagram it is
likely that the water groups are influenced by the presence of carbonate minerals which provide a neutralising effect.
Additionally surface water inflows are likely to increase dilution of the water’s pH and major ions although, conversely
to the principles suggested by the Ficklin Diagram, the addition of surface water to the Lake increases the
concentration of metals as a result of interaction with weathered soils in and around the mining area (as described in
Section 3.5.1).
13
CDMSmith-1001007-ERIAS-PNX-FountainHeadGold_WaterSoluteBalanceModelling_REV3Section 3 Physical setting
Figure 3-9 Ficklin Diagram showing selected principles that govern mine water quality (GARDGuide, 2015)
Figure 3-10 Ficklin Diagram of Fountain Head water groups relative to reference shape of GARDGuide (2015)
3.5.3 Representative concentrations for solute balance
Representative concentrations of selected key analytes based on historical and recent data from the site are
presented in Table 3-1, with some groups separated to represent specific water bodies in more detail (e.g. FHSW03 is
part of the surface water group). The representative groundwater chemistry is a combination of all data on site that
includes the appearance of at least two groups of groundwater types. FHMB01, FHMB02 and FHMB03 generally have
elevated metal concentrations compared to other groundwater samples and are located on the northern and eastern
14
CDMSmith-1001007-ERIAS-PNX-FountainHeadGold_WaterSoluteBalanceModelling_REV3Section 3 Physical setting
sides of the pit, while FHMB04, FHMB05 and FHMB06 for example, have lower metal concentrations and are located
to the south of the pit. Since there is uncertainty about the spatial extent and volume of groundwater with different
chemical signatures, and because all of this groundwater is expected to be drawn into the pit and mixed together,
geometric mean concentrations have been adopted.
Table 3-1 Geometric mean parameters for Fountain Head water sources
Surface Fountain Fountain Evaporation
Parameter Rainfall[1] FHSW03 Groundwater
water Head Pit Head Lake Dam
FLS EC (uS/cm) 184 - 70 378 409 357 38
TDS calc EC 119 7 45 246 266 232 25
(mg/L)
Hardness 27 - 14 102 141 72 10
(mgCaCO3/L)
Total Alkalinity as 45.6 2.7 35 158 136 38 26
CaCO3 (mg/L)
Calcium-Dissolved 3.9 1.2 1.5 8.6 13 9.4 -
(mg/L)
Chloride (mg/L) 2.6 1.9 1.7 4.3 5.5 2.6 30
Magnesium- 5.2 0.1 2.4 19 25 12 2.3
Dissolved (mg/L)
Potassium- 1.4 0.1 1.0 1.9 1.8 1.6 0.6
Dissolved (mg/L)
Sodium - 7.8 0.9 6.2 25 29 11 2.3
Dissolved (mg/L)
Sulfate (mg/L) 4 0.2 - 2.5 68 59 -
Aluminium- 111 - 143 58 5.2 70 -
Dissolved (µg/L)
Arsenic-Dissolved 2.6 - 1.8 56 567 7.6 0
(µg/L)
Copper-Dissolved 1.4 - - 1.3 0.6 1.8 -
(µg/L)
Iron-Dissolved 223 - 375 1272 26 74 -
(µg/L)
Zinc-Dissolved 4.4 - 4.1 5.1 4.4 9.6 -
(µg/L)
[1] Darwin rainfall data from Crosbie et al. (2012)
It should be noted, particularly for metal concentrations, that there will be a series of geochemical reactions occurring
as dewatering of the Fountain Head Pit and disposal into the Evaporation Pond occurs because waters will be mixed
and exposed to different oxidation, pH and temperature conditions. These interactions have not been modelled
explicitly but salinity, which can be used as a proxy for conservative geochemical behaviour, has been tracked through
the solute balance model components to demonstrate their changes over time (see section 4.9).
15
CDMSmith-1001007-ERIAS-PNX-FountainHeadGold_WaterSoluteBalanceModelling_REV3Section 4 Site operational water balance
Section 4 Site operational water balance
4.1 Overview
The objective of this section is to describe the site water balance, which is assessed using GoldSim® software. The site
conceptualisation, model construction methodology, data inputs and model results are presented in this section. The
model was developed to estimate:
The initial and ongoing dewatering rates, including groundwater inflows, to achieve dry conditions for mining in
the Fountain Head Pit
The Fountain Head Pit water level recovery rates after cessation of mining, under two scenarios (aided and
unaided recovery)
The recovered Pit Lake stabilisation level and the duration until full recovery is reached
The ability of the proposed Evaporation Pond to contain the pit dewatering volume during dewatering and
mining operations – a Monte Carlo analysis applied 200 realisations of historical rainfall data and model
parameters to evaluate the likelihood of exceeding an upgraded Evaporation Pond storage capacity
The feasibility of sourcing a non-potable water supply during construction and operational phases from the
Fountain Head Pit
The ongoing frequency and volume of flush/overflow at Fountain Head Lake
The water salinity (and by extension the contaminant load) within the Fountain Head Pit, Evaporation Pond and
Fountain Head Lake to assess the potential for exceedance of environmental water quality guideline values, and
The overall site water balance
A number of features are not explicitly modelled, including seasonal groundwater recharge, seepage from the
integrated waste landform or soil stockpiles, nor the return of processed or other water used on site sourced from
Fountain Head Pit
4.2 Background and previous Fountain Head modelling
Dewatering of the Fountain Head Pit (which is known to envelope two smaller pits, the Tally Ho and Fountain Head
Pits – the bridge between them occurs at around 80 m AHD) has been modelled previously by CDM Smith (2019) for a
rapid dewatering scenario using GoldSim® software. Based on available historical information it is assumed that active
dewatering of Fountain Head and Tally Ho pits during mining stopped on 15 September 2008, which is the date the
previous operator (GBS Gold) was placed into Administration. The bottoms of the existing pits are at an elevation of
34.3 m AHD in Fountain Head and 44.4 m AHD in Tally Ho. The Pit Lake is assumed to have started recovering from an
elevation of approximately 34.3 m AHD on 15 September 2008, reaching 93.9 m AHD by early August 2018. This
equates to an increase in water level of 59.6 m in around 10 years, the result of groundwater and surface water
inflow, balanced by evaporation.
For the CDM Smith (2019) study, the Pit Lake level was last measured on 2 August 2018 at an elevation of 93.9 m AHD
(note the Pit Lake level was again measured in February 2021 at 93.2 m AHD). At this elevation, Fountain Head and
Tally Ho pits are connected and form one Pit Lake with an estimated volume of 2064 ML, of which 991 ML is estimated
to be stored above the bridge level, while 714 ML and 359 ML is estimated to be below the bridge separating Fountain
Head and Tally Ho pits, respectively. For the work presented in this section, it is assumed both pits act as one (i.e. the
Fountain Head Pit). This means the recovery is happening simultaneously and interaction between the two pits is
ignored. The model simulates inflows to the Pit from direct rainfall, runoff and groundwater discharge, and outflows
from evaporation. The calibration and structure of the CDM Smith (2019) model have been used as the basis for the
16
CDMSmith-1001007-ERIAS-PNX-FountainHeadGold_WaterSoluteBalanceModelling_REV3Section 4 Site operational water balance
current work. Calibration details are reported below, and only minor alterations have been made to the original
model.
The Fountain Head GoldSim model has been calibrated based on recorded pit water levels to derive estimates of the
groundwater and surface water inflow components (CDM Smith, 2019). The recorded water levels for the calibration
period range between 90 and 94.4 m AHD, which means Fountain Head and Tally Ho were connected when recording
started. A bund wall is present around the perimeter of the pit and no outside catchment is simulated, only the pit
footprint. A good fit to the observations was achieved using an internal runoff coefficient of 0.6 (60% of rainfall
becomes runoff while 40% is lost to evaporation or infiltration) and bulk aquifer hydraulic conductivity of 0.2 m/d.
Groundwater inflows in the GoldSim model are simulated using the Dupuit-Forcheimer equation.
The observed and modelled levels are shown in Figure 4-1 and as an equivalent volume in Figure 4-2 (noting the black
dashed line represents a stepwise function related to the bathymetry of the Pit Lake). The components of the water
balance are shown over time in Figure 4-3 and Figure 4-4 for the Pit Lake inflows and outflows, respectively.
Groundwater inflow is the major contribution to the water stored in the Pit Lake compared to runoff and direct
rainfall.
Figure 4-1 Observed and modelled Pit Lake level over time (CDM Smith, 2019)
17
CDMSmith-1001007-ERIAS-PNX-FountainHeadGold_WaterSoluteBalanceModelling_REV3Section 4 Site operational water balance
Figure 4-2 Observed and modelled Pit Lake volume over time (CDM Smith, 2019)
Figure 4-3 Modelled cumulative inflow volumes (CDM Smith, 2019)
18
CDMSmith-1001007-ERIAS-PNX-FountainHeadGold_WaterSoluteBalanceModelling_REV3You can also read