Past African dust inputs in the western Mediterranean area controlled by the complex interaction between the Intertropical Convergence Zone, the ...
←
→
Page content transcription
If your browser does not render page correctly, please read the page content below
Clim. Past, 16, 283–298, 2020
https://doi.org/10.5194/cp-16-283-2020
© Author(s) 2020. This work is distributed under
the Creative Commons Attribution 4.0 License.

Past African dust inputs in the western Mediterranean area
controlled by the complex interaction between the Intertropical
Convergence Zone, the North Atlantic Oscillation, and total
solar irradiance
Pierre Sabatier1 , Marie Nicolle2 , Christine Piot3 , Christophe Colin4 , Maxime Debret2 , Didier Swingedouw5 ,
Yves Perrette1 , Marie-Charlotte Bellingery1,3 , Benjamin Chazeau1,3,6 , Anne-Lise Develle1 , Maxime Leblanc4 ,
Charlotte Skonieczny4 , Yoann Copard2 , Jean-Louis Reyss1 , Emmanuel Malet1 , Isabelle Jouffroy-Bapicot7 ,
Maëlle Kelner8 , Jérôme Poulenard1 , Julien Didier7 , Fabien Arnaud1 , and Boris Vannière7
1 EDYTEM,   Université Savoie Mont-Blanc, Université Grenoble Alpes, CNRS, Le Bourget du Lac, France
2 M2C, Université de Rouen, CNRS, Rouen, France
3 LCME, Université Savoie Mont-Blanc, Le Bourget du Lac, France
4 GEOPS, CNRS-Université de Paris-Sud, Université Paris-Saclay, Orsay, France
5 EPOC, CNRS-Université de Bordeaux, Pessac., France
6 LCE, Université Aix-Marseille, CNRS, Marseille, France
7 Chrono-Environnement, Université de Franche-Comté, CNRS, Besançon, France
8 SPE, Université de Corse Pascale Paoli, CNRS, Campus Grimaldi, BP 52, 20250 Corte, France

Correspondence: Pierre Sabatier (pierre.sabatier@univ-savoie.fr)

Received: 29 August 2019 – Discussion started: 30 September 2019
Revised: 10 January 2020 – Accepted: 13 January 2020 – Published: 7 February 2020

Abstract. North Africa is the largest source of mineral dust     increase in wind and a decrease in precipitation over west-
on Earth, which has multiple impacts on the climate system;      ern and North Africa. For centennial to decadal variations,
however, our understanding of decadal to centennial changes      wavelet analyses show that since 1070 cal BP, the North At-
in African dust emissions over the last few millenniums is       lantic Oscillation (NAO) has been the main climatic forc-
limited. Here, we present a high-resolution multiproxy anal-     ing, with an increase in Saharan dust input during the pos-
ysis of sediment core from high-elevation Lake Bastani, on       itive phase, as suggested by previous studies over the last
the island of Corsica, to reconstruct past African dust inputs   decades. However, when the ITCZ is in a northern position,
to the western Mediterranean area over the last 3150 cal BP.     before 1070 cal BP, wavelet analyses indicate that total solar
Clay mineralogy with palygorskite and a clay ratio associated    irradiance (TSI) is the main forcing factor, with an increase
with geochemical data allow us to determine that terrigenous     in African dust input during low TSI. With climate reanaly-
fluxes are almost exclusively related to atmospheric dust de-    sis over the instrumental era, during low TSI we observe a
position from the western Sahara and Sahel areas over this       significant negative anomaly in pressure over Africa, which
period. High-resolution geochemical contents provide a reli-     is known to increase the dust transport. These two climatic
able proxy for Saharan dust inputs with long-term (millen-       forcing factors (NAO, TSI) modulate Saharan dust inputs
nial) to short-term (centennial) variations. Millennial varia-   to the Mediterranean area at a centennial timescale through
tions have been correlated with the long-term southward mi-      changes in wind and transport pathways.
gration of the Intertropical Convergence Zone (ITCZ), with
an increase in dust input since 1070 cal BP. This correlation
suggests a strong link with the ITCZ and could reflect the in-
creased availability of dust sources to be mobilized with an

Published by Copernicus Publications on behalf of the European Geosciences Union.
284                                                                                  P. Sabatier et al.: Past African dust inputs

1   Introduction                                                   Espejo et al., 2014), despite the low resolution of the se-
                                                                   quence. In this paper, we present a high-resolution African
The dust cycle is an important part of the Earth system: each      dust record from sediment cores sampled in Lake Bastani, a
year, an estimated 2000 Mt (metric tons) of dust is emitted        high-elevation lake (2092 m a.s.l.) located on Corsica in the
into the atmosphere (Shao et al., 2011). Mineral dust plays a      northwestern Mediterranean Sea (Fig. 1), which records the
role in the different components of the climate by affecting       long-term (millennial) to short-term (centennial) variability
the radiative budget and therefore the energy balance of the       of African dust inputs over the late Holocene with high tem-
Earth system. Dust can also act as a cloud condensation nu-        poral resolution, allowing for the discussion of centennial
cleus, changing the hydrological cycle by modifying cloud          climate forcing and filling the gap between long-term instru-
cover and microphysics (Rosenfeld et al., 2008). Mineral           mental observations and millennial reconstructions.
dust also contributes to the carbon cycle as an external source
of nutrients to the oceans and to remote terrestrial ecosystems
                                                                   2     Material and methods
(Maher et al., 2010; Pabortsava et al., 2017; Shao et al., 2011;
Yu et al., 2015). North Africa is the world’s largest source of    2.1    Study area
mineral dust to the Earth system and influences spread over
both the Atlantic to the American–Caribbean regions and            In the Mediterranean area, despite a large daily variability,
the Mediterranean to Europe (Goudie and Middleton, 2001;           climatological data show a clear seasonal cycle of African
Prospero, 2002). Understanding dust emission, transport, and       dust transport with a maximum during the dry season: trans-
deposition requires the study of both past and present cli-        port begins over the eastern basin in the spring and spreads
matic variations. Advances in remote sensing and modeling          over the western basin in the summer (Moulin et al., 1998).
have improved understanding of the dust cycle, while im-           This dust mobilization is strongly related to the presence
provements in paleo-sciences allow for the reconstruction of       of low-pressure systems over North Africa (Moulin et al.,
both dust record emissions through time and source region          1998). Dust deposition in the western Mediterranean region,
fingerprinting (Marx et al., 2018). African dust emissions and     including the island of Corsica, originates from three main
transports exhibit variability on diurnal to decadal timescales    dust emission hot spots called potential source areas (PSAs):
under different atmospheric patterns (Evan et al., 2016). At       PSA1 (northern Sahara), PSA2 (western Sahara), and PSA3
the scale of glacial to interglacial climates, dust deposition     (Sahel) (Prospero, 2002; Scheuvens et al., 2013) (Fig. 1), as
recorded in marine and continental sediments in middle to          demonstrated by deposition collectors associated with satel-
high latitudes indicates that dust fluxes have changed greatly     lite observations and back trajectory analysis (Bergametti et
over such transitions (Maher et al., 2010). However, ex-           al., 1989; Guieu et al., 2002; Vincent et al., 2016) (Fig. 1a).
cept for the African Humid Period (AHP) (deMenocal et al.,            Lake Bastani (4.2 ha), a high-elevation lake (2092 m a.s.l.)
2000; Ehrmann et al., 2017; McGee et al., 2013), the influ-        with a maximum depth of 24 m, is located on Corsica in
ence of the Holocene centennial climate variability on the         the northwestern Mediterranean Sea (Fig. 1). The Lake Bas-
past dust cycle remains poorly quantified (Cockerton et al.,       tani watershed is restricted (17.3 ha) and mainly composed
2014; Mulitza et al., 2010), but it can be a key element of        of granodiorite and coarse screes from glacial or rockfall ori-
the forcing of climatic variations and therefore deserves to       gins, containing no permanent streams and delivering very
be integrated in transient climate simulations of the Holocene     limited local lithogenic input to the sediments. This lake
(Albani et al., 2015). For instance, the neglect of atmospheric    formed after the last glacial retreat and is delimited north-
dust reduction in the early to mid-Holocene in climate mod-        ward by glacial deposits. In its southern part a very restricted
els could partly explain the model–data temperature discrep-       delta is present and composited by coarse material (coarse
ancy in the Northern Hemisphere (Liu et al., 2018).                sand to gravel).
   Past dust deposition in the Atlantic (deMenocal et al.,            Three sediment cores referred to as BAS13P1 (IGSN:
2000; McGee et al., 2013) and Mediterranean (Bout-                 IEFRA0031; 58 cm), BAS13P3 (IGSN: IEFRA0033; 47 cm),
Roumazeilles et al., 2007, 2013; Ehrmann et al., 2017;             and BAS13P4 (IGSN: IEFRA0034; 102 cm) were sampled in
Rodrigo-Gámiz et al., 2011; Wu et al., 2017; Zhao et al.,          the central part of the lake (42◦ 030 56.65◦ N, 9◦ 080 02.79◦ E)
2016) regions is classically reconstructed from marine sed-        under 21 m (P4) and 23 m (P1 and P3) of water depth us-
iment cores. The respective influence of fluvial versus eo-        ing a UWITEC gravity corer (Fig. 1b). IGSN has been
lian input and the low time resolution of marine sedimentary       furnished by the SESAR System (http://www.geosamples.
records over the Holocene period do not allow for studies          org/, last access: 31 January 2020). All the core meta-
of short-term (decadal to centennial) variability. Other con-      data are stored in the French Cyber-Core repository (https:
tinental archives such as peat bogs (Le Roux et al., 2012;         //www.cybercarotheque.fr/, last access: 31 January 2020).
Longman et al., 2017) and lakes (Zielhofer et al., 2017)           Core metadata are summarized in Table S1 in the Supple-
demonstrate the possibility to record African dust. A recent       ment, and core data are all stored in PANGAEA (https://doi.
study in the Iberian Peninsula shows the potential for high-       pangaea.de/10.1594/PANGAEA.910655, last access: 10 Jan-
elevation lake sediment to record African dust (Jiménez-           uary 2020). Samples were also collected in the watershed in

Clim. Past, 16, 283–298, 2020                                                                  www.clim-past.net/16/283/2020/
P. Sabatier et al.: Past African dust inputs 285
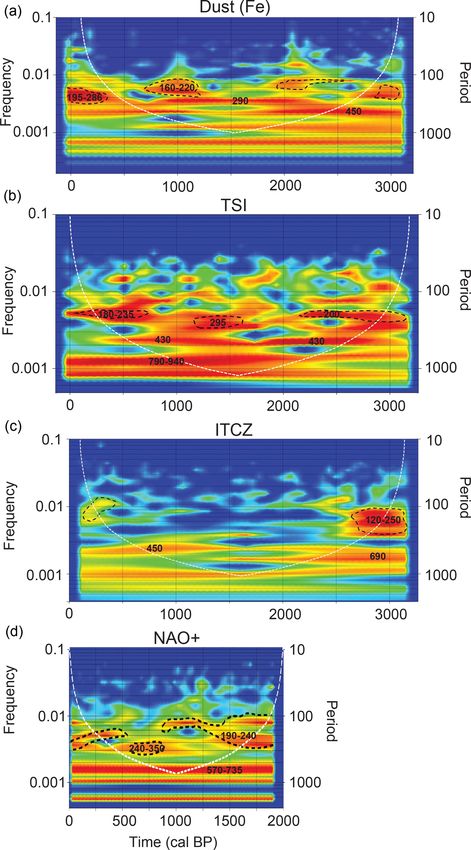
Figure 1. (a) Map of the western Mediterranean area showing major potential source areas for northwestern African dust (PSA1, PSA2,
PSA3) with a clay mineral ratio (illite to kaolinite and chlorite to kaolinite) and palygorskite content (Bout-Roumazeilles et al., 2007;
Formenti et al., 2011; Scheuvens et al., 2013). Black curves are the main back trajectories for the dust event collected on Corsica (study area,
red rectangle); modified from Guieu et al. (2002). The dotted line represents the summer (July) ITCZ position. (b) Aerial photography of
Corsica with the localization of Lake Bastani. The Lake Bastani bathymetry map and its watershed with the localization of the three studied
cores (BAS13P1, BAS13P3, BAS13P4) and samples on the watershed. In orange is the Sahel–Sahara limit.
different potential sediment sources (granodiorite, moraine, als were mainly made according to the position of the (001)
soil, delta; Fig. 1b). These three cores were correlated, and series of basal reflections on the three XRD diagrams using
we used data from different sections to have enough material MacDiff software. Samples were also analyzed by diffuse re-
for different analyses. flectance Fourier transform infrared spectrometry (FTIRS)
using a Thermo Nicolet 380 spectrometer equipped with
2.2 Analytical methods a liquid-nitrogen-cooled mercury cadmium telluride (MCT)
detector and a diffuse reflectance accessory. Each sample was
Core were split, photographed, and logged in detail, noting scanned 32 times at a resolution of 2 cm−1 for wavelengths
all physical sedimentary structures and the vertical succes- between 4000 and 650 cm−1 . The complete absence of the
sion of facies. The grain size distributions were determined peaks systematically associated with carbonates in lake sedi-
using a Malvern Mastersizer S at a continuous interval of ments (1300–1560, 1780–1810, 2460–2640 cm−1 ) (Rosén et
1 cm for core BAS13P4. Ultrasound was applied to minimize al., 2010) for all the samples indicates that all these sediments
particle flocculation. The core was also sampled at 1 cm steps are carbonate-free. X-ray fluorescence (XRF) analysis was
for core BAS13P4 to obtain the loss on ignition (LOI) fol- performed on the surfaces of the split sediment cores at 1 mm
lowing Heiri et al. (2001). LOI550 and LOI950 respectively intervals using a nondestructive Avaatech core scanner. The
represent the organic and carbonate content of a sample ex- geochemical relative components (intensities), expressed in
pressed in percent. LOI at 950 ◦ C was interpreted to have a counts per second, were obtained at various tube settings:
carbonate content below 4 % and likely illustrates the uncer- 10 kV at 1.5 mA for Al, Si, S, K, Ca, Ti, Mn, and Fe; 30 kV
tainties of this method. The non-carbonate ignition residue at 1 mA for Cu, Zn, Br, Sr, Rb, Zr, and Pb; 50 kV at 2 mA
(NCIR) was obtained by removing the LOI at 550 ◦ C from for Ba. Each run lasted 60 s (Richter et al., 2006). Principal
the initial dry weight. Clay minerals were identified by X- component analysis (PCA) was performed using R software.
ray diffraction (XRD) every 2 cm for core BAS13P4 using a Major and trace element analyses on samples from the wa-
PANalytical diffractometer at the Laboratoire GEOPS (Uni- tershed (n = 5) and lake sediment (n = 10) were conducted
versité de Paris XI) on oriented mounts of non-calcareous by flow injection ICP-MS (traces) and ICP-OES (majors) at
clay-sized particles (< 2 µm). The oriented mounts were ob- the Service d’Analyse des Roches et des Minéraux (SARM,
tained following the methods described in detail by Colin et Nancy, France) using the method described by Carignan et al.
al. (1999). Three XRD trials were performed, each proceeded (2001). Each element has a different range of uncertainties,
by air-drying, ethylene glycol solvation for 24 h, and heating
at 490 ◦ C for 2 h. Semiquantitative estimates of clay miner-
www.clim-past.net/16/283/2020/ Clim. Past, 16, 283–298, 2020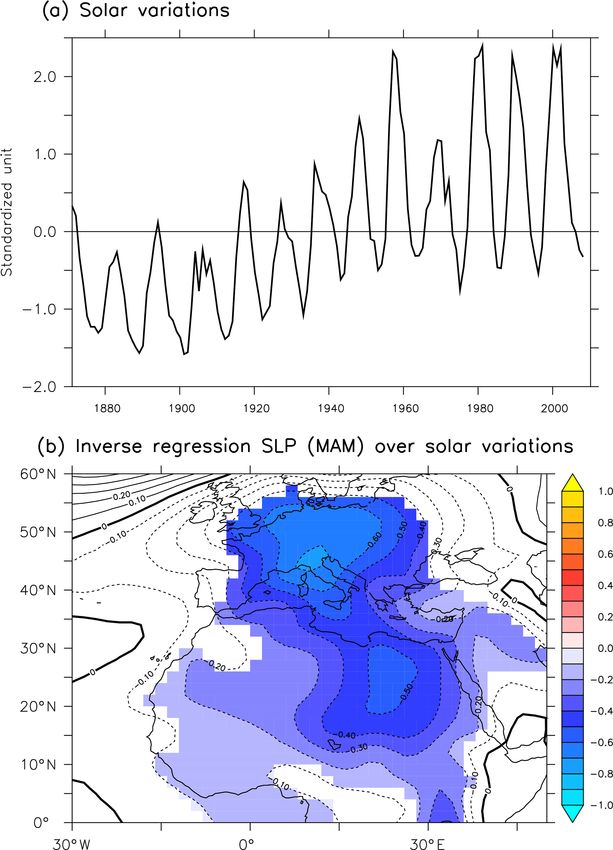
286                                                                                 P. Sabatier et al.: Past African dust inputs

with an average of 1 %–5 % for major elements and 5 %–               Because WA is sensitive to large, long-term fluctuations
10 % for trace elements.                                          that can occur in paleoclimate series, which may mask fluc-
                                                                  tuations expressed at the highest frequencies, all series were
2.3   Dating
                                                                  detrended before performing WA. The long-term trends were
                                                                  calculated with autosignal software using a cubic model. The
A continuous sampling step of 5 mm was applied over the           cubic baseline is fitted in a single step matrix solution using
first 10 cm of BAS13P3 to determine 210 Pb, 226 Ra, and           a least-squares minimization. The resulting plot of the WA,
137 Cs activities using well-type germanium detectors placed      called the local wavelet spectrum, allows for the description
at the Laboratoire Souterrain de Modane following Reyss et        and visualization of the power distribution (z axis) according
al. (1995). In each sample, the 210 Pb excess activities were     to the frequency (y axis) and time (x axis). All series were
calculated by subtracting the 226 Ra-supported activity from      zero-padded to twice the data length to prevent spectral leak-
the total 210 Pb activity. Age models are computed with the       ages produced by the finite length of the time series. Zero-
serac R package (https://github.com/rosalieb/serac, last ac-      padding produces edge effects: the lowest frequencies and
cess: 11 February 2019; Bruel and Sabatier 2020). Five 14 C       near the edges of the series are underestimated, and fluctua-
measurements of the terrestrial organic macroremains sam-         tions that occur in this area must be interpreted with caution.
pled in core BAS13P1 (four ages) and BAS13P4 (one age)            This area is known as the cone of influence. Monte Carlo
were carried out by an accelerator mass spectrometer (AMS)        simulations were used to assess the statistical significance of
at the Poznan Radiocarbon Laboratory. The calibration curve       the detected fluctuations. All the detected fluctuations are sta-
IntCal13 (Reimer et al., 2013) was used for the 14 C age cal-     tistically tested at the α = 0.05 significance level against an
ibration (Table 1). Then, we used a smooth spline interpola-      appropriate background spectrum. Autoregressive modeling
tion with the R Code package clam of R software to generate       was used to determine the autoregressive model (first order:
the age model (Blaauw, 2010).                                     AR(1)) stochastic process against which the initial time se-
                                                                  ries was to be tested. For this study, AR(1) corresponds to a
2.4   Statistical analysis
                                                                  red noise of (AR(1) > 0).
                                                                     Cross wavelet (XWT) and wavelet coherence (WTC) were
Different strategies of multivariate data analysis are used to    used to examine the relationship between the dust proxy
interpret geochemical data from both sediment core and wa-        in the sediment and external forcing. Following Grinsted et
tershed samples. Principal component analysis (PCA) is per-       al. (2004) this analysis allows for the testing of whether forc-
formed on major elements as is loss on ignition (LOI) from        ing can change over time for specific frequencies. XWT and
the BAS13 core and samples from the watershed after “cen-         WTC were calculated using the MATLAB (R2018) wavelet
tered log-ratio transformation” (clr transformation; Aitchison    toolbox. To avoid edge effects, time series were downsam-
et al., 2002). These statistical calculations were conducted      pled at the closer dyadic size of the shortest time series. As
with R software using the package “compositions” and allow        for WA, the Morlet wavelet (m = 6) was used because of its
us to avoid the so-called closure operation on the covariance     compromise between accuracies in both time and frequen-
matrix for major elements (van den Boogaart and Tolosana-         cies. XWT gives a cross-correlation between the two signals,
Delgado, 2008). Classic PCA was conducted on XRF analy-           while WTC provides information about the phase between
sis.                                                              them. Right and left arrows are respectively in phase or in
    The R package “segmented” (Muggeo, 2008) is used for          phase opposition, and up and down arrows respectively show
break-point analyses on a given linear regression model to        the first or second signal that predates the other one. Dyadic
estimate a new model having broken-line relationships with        resampling of the time series denoises the signal, allowing
the variables specified. A segmented (or broken-line) rela-       us to use a first-order derivative for detrending. Phase arrows
tionship is defined by the slope parameters and the break         were shown for correlation superior to 0.7.
point at which the linear relation changes.
    Wavelet analysis (WA) is used to decompose a signal into      2.5   Observation-based data pressure data
a sum of small wave functions of a finite length that are
highly localized in time for different exploratory scales (Tor-   To evaluate the link between solar forcing and changes in
rence and Compo, 1998). WA corresponds to a band-pass             wind patterns over the recent period, we used the 20th cen-
filter that decomposes the signal on the basis of scaled and      tury reanalysis NOAA (20CR) project version 2 (Compo et
translated versions of a reference wave function. The Morlet      al., 2011), consisting of an ensemble of 56 realizations with
wavelet was chosen as the wavelet reference. Several types        2◦ × 2◦ gridded 6-hourly weather data from 1871 to 2010.
of wavelets are available, but the Morlet wavelet offers a        Each ensemble member was performed using the NCEP/GFS
good frequency resolution and is used most of the time with       atmospheric model, prescribing the monthly sea surface tem-
a wavenumber of 6, for which the wavelet scale and Fourier        perature and sea ice changes from HadISST as boundary
period are approximately equal. All the series were resam-        conditions and assimilating sea level pressure data from the
pled at the initial point number n of the series.                 International Surface Pressure Databank version 2.0 (https:

Clim. Past, 16, 283–298, 2020                                                                 www.clim-past.net/16/283/2020/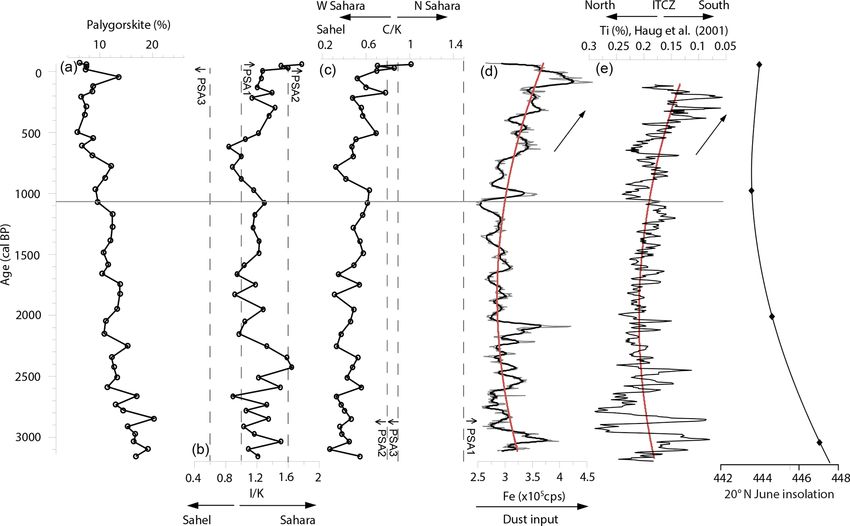
P. Sabatier et al.: Past African dust inputs                                                                                     287

Table 1. List and depth reported in the composite depth of 14 C dates for the Lake Bastani cores. The composite depth is obtained from
Fig. S2.

           Samples       Material    Cores         Composite     Uncalibrated   Uncertainty   Calibrated age ranges at 95 %
                         dated                    depth (mm)        age (BP)                   confidence interval (cal BP)
           Poz-69623     O. macro    BAS13P1              118            325            30                        307–468
           Poz-69624     O. macro    BAS13P1              226            545            30                        516–635
           Poz-73333     O. macro    BAS13P1              380           1410            30                      1286–1358
           Poz-69625     O. macro    BAS13P1              566           2110            30                      1996–2152
           Poz-61153     O. macro    BAS13P4             1020           3000            35                      3076–3327

//rda.ucar.edu/datasets/ds132.0/, last access: 5 April 2018).         marked over the upper 50 cm of the core. All these clay min-
We used the ensemble mean to perform our analysis. We                 eral contents present short-term variations at the pluricen-
have computed a linear regression between sea level pres-             timeter scale (Fig. S1).
sure variations in each grid point and variation of the TSI
(Lean, 2009) over the period 1870–2009. We have applied
Student’s t test to only show the correlation significant at the      3.2   Geochemistry
95 % level.
                                                                      The three cores were correlated using XRF data (Fig. S2) to
                                                                      provide enough material for each analysis. Major and trace
3     Results
                                                                      elements were measured using an XRF core scanner and
                                                                      were subjected to PCA (Fig. S3) to constrain sediment end-
3.1    Sedimentology and mineralogy
                                                                      members (Sabatier et al., 2010). Dim1, Dim2, and Dim3 ex-
The sediment consists of olive-gray silty clay with a high            plain 50.5 %, 14.9 %, and 12.1 % of the total observed vari-
organic content (15.7 %) of up to 20 % over the last few cen-         ance, respectively (Fig. S3). This PCA allows for the iden-
timeters (Fig. S1 in the Supplement). This increase in organic        tification of three geochemical end-members: (i) Al, K, Fe,
matter content is related to the lake eutrophication induced          Ti, Ca, Rb, Sr, Ba, Zr, and (Si), which are related to terrige-
by a recent increase in atmospheric nitrogen deposit, which           nous inputs (eolian and/or watershed); (ii) S and Br, which
enhances lake primary productivity (Roche and Loÿe-Pilot,             are linked to the organic matter content (Bajard et al., 2016);
1989). The carbonate content estimated by LOI950 presents             and (iii) a Pb source that may be correlated with periods of
a very low value (< 4 %, close to the method uncertainties),          past metallurgic activities (Elbaz-Poulichet et al., 2011). We
and infrared analyses show that there is no carbonate present         can note that the Si content appeared to be slightly different
in this sediment (data not shown). The NCIR is relatively             from other terrigenous elements because Si is high in alu-
constant and up to 80 %, with small variation over the up-            minosilicate and in diatom content, which is linked to the
per 10 cm. This NCIR is mainly composed of biogenic sil-              planktonic productivity in the lake.
ica (diatom frustules observed in smear slices) and terrige-              Major element concentrations obtained from a quantita-
nous input from both the watershed and the eolian flux. The           tive analysis of sediment core and samples from the water-
grain size distribution presents a homogenous content (me-            shed were subjected to PCA after centered log-ratio trans-
dian (D50) = 32 ± 8 µm) (Fig. S1) mostly affected by bio-             formation (van den Boogaart and Tolosana-Delgado, 2008)
genic silica not removed before analysis. Grain size in this          (Fig. 2a). Dim1 and Dim2 explain 81 % and 13 % of the to-
lake sediment is mostly affected by biogenic silica (diatoms);        tal observed variance, respectively, and allow for the identifi-
thus, these data could not be used to track thin particles of         cation of two geochemical end-members: (i) Fe2 O3 , TiO2 ,
eolian origin. We use grain size here to illustrate that there        MgO, and Fe2 O3 correlated with lake sediment samples
is no coarse deposit link to flood or terrigenous events. How-        and (ii) CaO, K2 O, Na2 O, and MnO correlated with sam-
ever, there is also no large grain size variation related to flood    ples from the watershed; SiO2 appeared in an intermedi-
events (Sabatier et al., 2017; Wilhelm et al., 2015); thus, fur-      ate position (Fig. 2a), as for PCA on XRF data (Fig. S3).
ther analyses could not be influenced by grain size variation.        With this identification of two main end-members, the Fe/Ca
On average, the clay mineral fraction is composed of illite           vs. Ti/Ca and Fe/K vs. Ti/K element ratios from quantita-
(28±5 %), smectite (25±7 %), kaolinite (24±4 %), chlorite             tive measurements are then used to understand the geochem-
(12 ± 4 %), and palygorskite (12 ± 4 %) and presents large            ical signature of the lake sediment (Fig. 2b). High-resolution
variations (Fig. S1). Toward the top of the core, illite, kaoli-      XRF Fe content presents (i) a main tendency with an increase
nite, and chlorite present an increasing trend, with a stabi-         between ∼ 40 and 10 cm and then a decrease and (ii) short-
lization for kaolinite around 50 cm, while smectite and paly-         term increase in Fe contents at ∼ 8, 13, 18, 25, 33, 38, 45,
gorskite present a decreasing one. These tendencies are less          52, 59, 68, 73, 85, and 95 cm (Fig. 2c). Fe2 O3 concentrations

www.clim-past.net/16/283/2020/                                                                      Clim. Past, 16, 283–298, 2020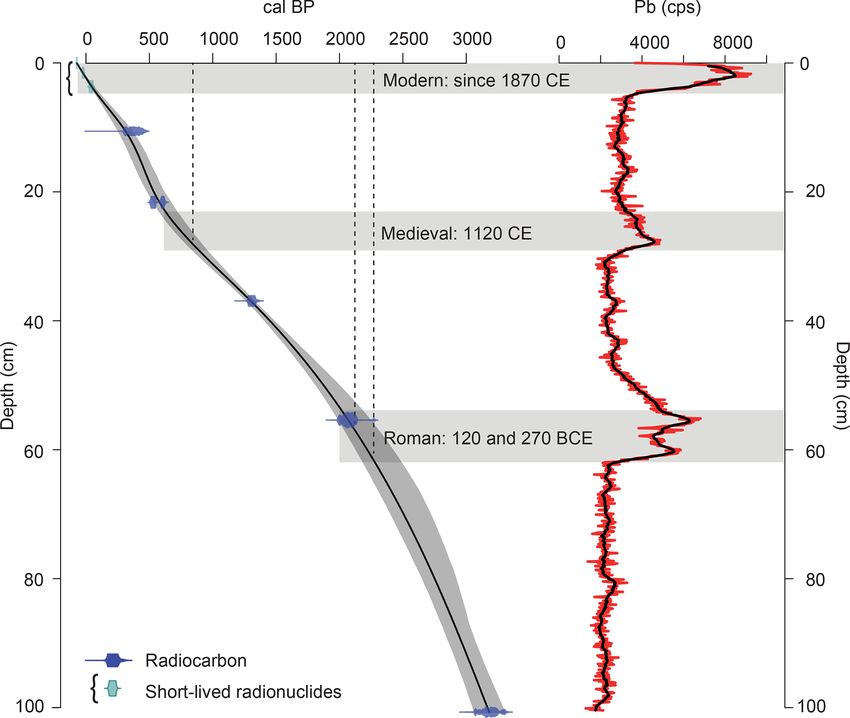
288                                                                                        P. Sabatier et al.: Past African dust inputs

Figure 2. (a) PCA biplot of major elements obtained by ICP-MS measurement corrected for LOI content and after centered log-ratio trans-
formation. Data used in this PCA are from both lake sediment (dotted area) and watershed samples (granodiorite and quaternary deposits).
(b) Selected element ratios (Fe/Ca vs. Ti/Ca and Fe/K vs. Ti/K) from ICP-MS measurement on lake sediment, watershed samples, and data
from dust deposits in the NW Mediterranean (Spain; Avila et al., 1997, 2007) and central Mediterranean areas (Adriatic Sea, Italy, Sicily;
Tomadin et al., 1984). Light orange areas correspond to the geochemical signature of African dust from the available dataset. (c) Comparison
between Fe content from the XRF core scanner and ICP-MS analyses.

match very well with Fe contents obtained by the XRF core               mentary record because it was considered to be an instan-
scanner with the same variations (Fig. 2c), and the correlation         taneous deposit. 210 Pbex activities plotted on a logarithmic
between these two types of data (r = 0.86, p < 0.0013) al-              scale revealed two linear trends providing two mean sed-
lows us to use Fe content from XRF data as a high-resolution            imentation rates of 0.79 ± 0.1 mm yr−1 above 3.5 cm and
quantitative measurement.                                               0.23±0.02 mm yr−1 below 6.5 cm (Fig. S4). Ages were then
                                                                        calculated using the Constant Flux Constant Sedimentation
                                                                        (CFCS) model applied to the original sediment sequence to
3.3   Chronology                                                        provide a continuous age–depth relationship. The 137 Cs pro-
                                                                        file presented one peak at 6.75 cm, which corresponds to
The excess 210 Pb downcore profile showed a regular de-
                                                                        maximum nuclear weapon tests in the Northern Hemisphere
crease punctuated by a phase of homogenized 210 Pbex ac-
                                                                        in 1963 CE. The Chernobyl accident in 1986 CE is not clearly
tivities (Fig. S4, gray band), which corresponds to the mass-
                                                                        visible on this profile. This age model is confirmed by the
wasted deposit with a constant Fe content (counts per sec-
                                                                        correlation between the 210 Pbex and the 137 Cs peak (Fig. S4).
ond – cps) identified in Fig. S2 and to the higher NCIR
                                                                           Sediment core chronology is based on short-lived radionu-
content (Fig. S1). Following Arnaud et al. (2002) the event
                                                                        clide data (Fig. S4) and five radiocarbon dates (Table 1), both
was excluded from the construction of an event-free sedi-

Clim. Past, 16, 283–298, 2020                                                                         www.clim-past.net/16/283/2020/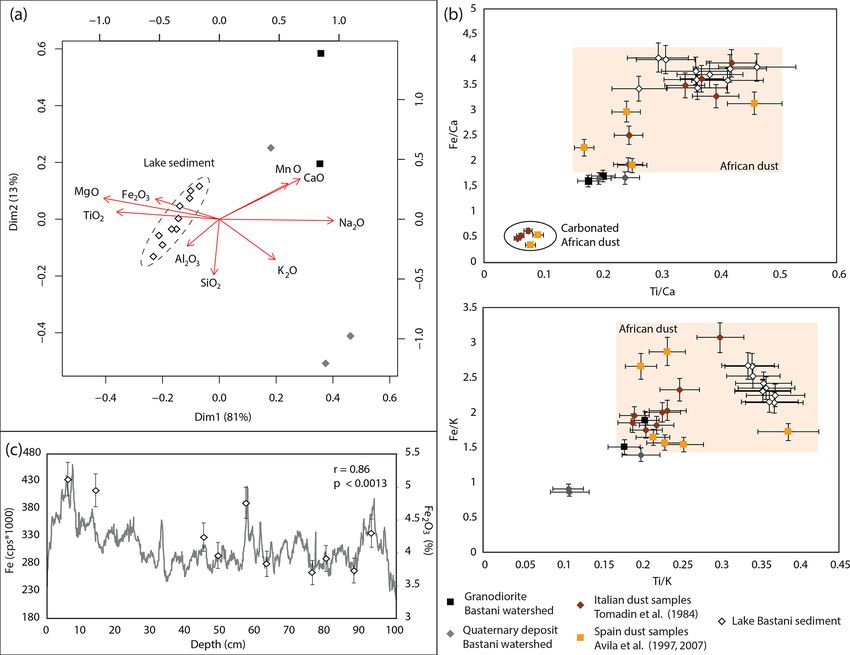
P. Sabatier et al.: Past African dust inputs                                                                                            289

Figure 3. Age–depth model of the 102 cm Lake Bastani sedimentary sequence (BAS13P4), including 210 Pb / 137 Cs chronology (Fig. S4)
and 14 C ages (Table 1). Lead measurement in the lake sediments with the identification of three pollution peaks and associated ages.

correlated with the BAS13P4 core (Fig. S2). Age modeling                 presents less palygorskite (Bout-Roumazeilles et al., 2013).
provided a precise age model over the last 3150 cal BP, with             The 3150 cal BP Lake Bastani sediment record reveals a rel-
an average sedimentation rate of 0.34 mm yr−1 (Fig. 3), us-              atively high percent of palygorskite in the clay mineral frac-
ing clam software (Blaauw, 2010). This age model is con-                 tion; therefore, African dust deposits constitute a major part
firmed by three Pb peaks: in the Roman period (with a dou-               of the fine terrigenous flux in this lake (Fig. 4a). Palygorskite
ble peak centered at 270 and 120 BCE), the medieval pe-                  is also highly variable inside each source, and even if its con-
riod (1120 CE), and the modern industrial period starting                tent could reach 75 % and 45 % in some areas of PSA2 and
at 1870 CE, with a maximum between 1970 and 1980 CE                      PSA1, respectively (Grousset et al., 1992), the mean value
(Fig. 3) related to Pb additives in gasoline. The two older              of 11.6 ± 3.6 % in the Bastani record could indicate a degra-
Pb peaks correspond to well-known past metallurgic activi-               dation of this fibrous mineral during long wind transport as
ties in the Mediterranean area (Elbaz-Poulichet et al., 2011)            previously observed for river transport (Bout-Roumazeilles
and demonstrate that the age model is well-defined and that              et al., 2007). The I/K ratio (around 1.21 ± 0.22) is typical of
this lake system is ideal for recording atmospheric inputs.              the northern Saharan source (PSA1: 1 < I/K < 2) but if we
                                                                         consider multiple sources contributions this ratio could result
                                                                         from a mix between the western Sahara (PSA2: I/K > 1.6)
4     Discussion                                                         and Sahel (PSA3: 0.3 < I/K < 0.7) (Fig. 4b). The low value
                                                                         of the C/K ratio (mean: 0.51±0.15) is typical of the western
4.1    Sediment sources
                                                                         Saharan source (PSA2: 0 < C/K < 0.8) or the Sahel (PSA3:
In northern Africa, the ratios of clay minerals, such as il-             0.2 < C/K < 0.9) but far from PSA1 (C/K = 1.5), except
lite to kaolinite (I/K ratio) and chlorite to kaolinite (C/K             for the upper part of the record (Fig. 4c). Thus, if we con-
ratio), can serve as “fingerprints” of specific source areas             sider these two ratios together the main dust sources are a
(Bout-Roumazeilles et al., 2007; Caquineau, 2002; Guieu et               mix between western Saharan and Sahelian except for the re-
al., 2002) (Fig. 1). The fibrous clay mineral (palygorskite),            cent part, with an increasing influence of the northern Sahara
typical of arid to semiarid areas, appears to be a suit-                 (PSA1). Even if palygorskite is relatively low in regards to
able source marker for the northern and western Sahara                   source contents from PSA1 and PSA2, the decreasing trend
(PSA1 and PSA2) with high content, while the Sahel (PSA3)                in palygorskite content probably reflects a progressive trend

www.clim-past.net/16/283/2020/                                                                          Clim. Past, 16, 283–298, 2020
290 P. Sabatier et al.: Past African dust inputs Figure 4. (a) Palygorskite content (%). (b) I/K (illite to kaolinite) ratio to discriminate the source area of the Sahel (PSA3) from the Sahara (PSA1 and PSA2). (c) C/K (chlorite to kaolinite) ratio to discriminate source areas in the northern Sahara (PSA1) from the western Sahara (PSA2). Vertical dashed lines represent the upper and lower boundary of African sources. (d) Fe content interpreted as total dust input. (e) Variation of the ITCZ position (Haug et al., 2001) with reverse scale. (f) 20◦ N June insolation from Berger and Loutre (1991). Red curves present the long-term trend, and black arrows indicate a common variation. The horizontal gray line at 1071 cal BP represents this break-point analysis on the linear regression model between Fe content (dust input) and the ITCZ. with more influence from PSA1 (Bout-Roumazeilles et al., vary from one year to another, dust fluxes measured in Cor- 2013; Grousset et al., 1992) through time, also supported by sica may represent almost all of the silicate source to this sys- the increasing trend of the C/K ratio and higher value for tem, and siliceous input from the watershed can be neglected the upper part of the record (Fig. 4). Modern dust prove- in the variability of our reconstructed signal. nance areas identified for Corsica through air mass trajecto- Geochemical data allow for the identification of two mains ries over 1.5 years identify a dominant dust flux originating terrigenous end-members: lake sediment characterized by from the western (> 30 %) and northern (25 %–30 %) Sahara Fe2 O3 , TiO2 , MgO, and Fe2 O3 and watershed samples and a low contribution from the Sahel (< 5 %) (Vincent et mainly composed of CaO, K2 O, Na2 O, and MnO. Accord- al., 2016), in agreement with recent source reconstitutions in ing to a PCA of the geochemical dataset, the ratios Fe/Ca the Bastani record. Longer instrumental records also identify vs. Ti/Ca and Fe/K vs. Ti/K were used in order to compare African dust input to Corsica from northern Sahel sources the compositions of lake sediments and the associated water- (Fig. 1; Bergametti et al., 1989; Guieu et al., 2002). shed with dust deposits in NW Mediterranean (Spain; Avila The NCIR (eolian, watershed, biogenic silica) flux for the et al., 1997, 2007) and central Mediterranean areas (Adri- last century in Lake Bastani is 4.5 g m 2 yr−1 . In compar- atic Sea, Italy, Sicily; Tomadin et al., 1984) (Fig. 2b). These ison, the longest deposition dust fluxes measured in Cor- data allow us to determine that the geochemical composition sica (10 years) vary between 4 and 26 g m 2 yr−1 (Loÿe- of lake sediment is similar to non-carbonated dust samples, Pilot, M.D. and Martin, 1996), with the lower value of this with no evident contribution of the watershed end-member range corresponding to the NCIR flux calculated from the to the lake sediment, as all lake sediment samples fall in Lake Bastani sediment core. Even a low dust deposition year the African dust signature (light orange area in Fig. 2b), (2013: 2.1 g m 2 yr−1 ) (Vincent et al., 2016) corresponds to in agreement with previous finding on fluxes. From XRF half of the NCIR flux. Thus, even though eolian input may measurements on lake sediment, the terrigenous elements Clim. Past, 16, 283–298, 2020 www.clim-past.net/16/283/2020/
P. Sabatier et al.: Past African dust inputs                                                                                 291

present in the African dust, such as Ti and Fe, are corre-        a southerly position of the ITCZ over North Africa, associ-
lated (r = 0.72, p < 10−16 ), but the Fe signal is less noisy.    ated with increased surface winds over central and western
Moreover, Fe, Ca, and K contents present the same varia-          North Africa (Doherty et al., 2012, 2014). The annual dust
tions with good correlation (Fe vs. Ca r = 0.63, p < 10−16 ;      cycle may be partly explained by seasonal changes in the po-
Fe vs. K r = 0.63, p < 10−16 ) in lake sediment, indicating       sitions of the Intertropical Convergence Zone (ITCZ) and as-
that even for the terrigenous elements typical of the water-      sociated rainfall distributions. The most northern position of
shed (Ca, K; Fig. 2b), most of the variation is influenced by     the ITCZ is responsible for the rainy (monsoon) season; rain-
African dust, in good agreement with the NCIR flux esti-          fall reduces the atmospheric dust content through increases
mation. This very low contribution of terrigenous elements        in soil moisture and vegetation cover, reducing dust emis-
from the watershed precluded the Fe/Ca or Fe/K ratio as a         sions from the ground and cleaning the atmosphere by re-
proxy for dust input. In African dust, iron is present in Fe-     moving dust particles (wet deposition) (Engelstaedter et al.,
containing silicate, iron oxide, and hydroxide coating and        2006). This correlation could reflect the availability of dust
cement on grains, as well as in the lattice of clay minerals      sources for mobilization, suggesting a long-term forcing of
(Formenti et al., 2011; Scheuvens et al., 2013). Consider-        the southward ITCZ migration on the increased dust export
ing (1) the high Fe content in African dust, (2) the negli-       to the Mediterranean area since 1070 cal BP. Over a longer
gible input from the watershed, (3) no grain size variations      period, such a link is also observed, with a drastic decline
in the Lake Bastani sediment (SI1), (4) low sedimentation         in dust flux occurring during the AHP (11 to 7–5 ka) re-
rate changes (Fig. 2), and (5) good correlation between the       lated to a combination of decreased wind and increased pre-
XRF core scanner and Fe2 O3 concentrations, the Fe content        cipitation, which is associated with a northward shift of the
measured by XRF has been used to reconstruct African dust         ITCZ (Bout-Roumazeilles et al., 2007; McGee et al., 2013;
input variations through time (Fig. 4d). Ca is classically used   Rodrigo-Gámiz et al., 2011; Zielhofer et al., 2017) in rela-
as a tracer for carbonate minerals (calcite and dolomite) and     tion to the increase in summer orbital insolation (deMenocal
is present in African dust; however, carbonate was not identi-    et al., 2000).
fied in the Lake Bastani sediment using infrared spectrometry
(data not shown) and LOI. The absence of carbonate in the         4.2.2   Centennial variation
sediment could be linked to calcite dissolution during both
atmospheric transport (Avila et al., 2007) and deposition in      Reconstructed African dust input also presents high short-
the lake water.                                                   term variation at a centennial to decadal timescale. Over the
                                                                  last century, we observed from Fe data an African dust in-
                                                                  crease that reached a maximum between 1945 and 1975 and
4.2     African dust input and climate forcing                    then a decrease until today, like the decreasing trend ob-
4.2.1    Millennial variation                                     served by Evan and Mukhopadhyay (2010). African dust in-
                                                                  put variations on Corsica are potentially linked to the avail-
High-resolution (3-year) Fe content over the last 3150 years      ability of dust sources that could be mobilized and to the
shows a long-term variation with a significant increase from      transport pathway that allows dust to reach this island.
approximately 1000 cal BP and centennial-scale variations,           A recent study, based on a comparison between dust time
as well as an increase during the Little Ice Age (650–            series and projections of the wind pattern onto climate mod-
50 cal BP) (Fig. 4d). This increase in dust input is earlier      els, shows that wind intensity is an important factor control-
than previously published by Mulitza et al. (2010) in the At-     ling African dust variability over the last several decades, and
lantic area, which the authors attributed to human contribu-      this explains why time series of dust are correlated with di-
tions through changes in agriculture in the Sahel region (be-     verse climate phenomena such as the NAO, ITCZ, and Sa-
ginning of the 19th century).                                     helian drought (Evan et al., 2016). To test such relationships
   We calculate the long-term trend (centennial to millennial)    over the last millennia wavelet analyses have been performed
using the cubic model, which allows for the reconstruction        on the Bastani dust inputs, total solar irradiance (TSI) (Stein-
of the long-term dust signal in Lake Bastani. This millennial-    hilber et al., 2012), the ITCZ (Haug et al., 2001), ENSO
scale variation shows an increasing trend, similar to the long-   (Moy et al., 2002), and the North Atlantic Oscillation (NAO)
term southward migration of the ITCZ (Haug et al., 2001)          (Franke et al., 2017) reconstructions. They highlight signifi-
(Fig. 4d, e) in response to a gradual orbitally induced de-       cant cyclicities (up to more than the 95 % level of confidence;
crease in Northern Hemisphere insolation. These two long-         Fig. 5). The scalogram of dust inputs (Fe) presents three
term reconstructed trends present a good correlation (R 2 =       different cycles of approximately 200, 300, and 450 years
0.90, p value < 2.2 × 10⁻¹⁶ , F statistic = 4857). A break-       (Fig. 5a). The power spectra of the ITCZ and ENSO recon-
point analysis on the linear regression model between the         structions do not show significant cycles in this period, ex-
two initial signal shows a change at 1070 cal BP (Fig. 4),        cept between 2500 and 3100 cal BP for the ITCZ reconstruc-
with a positive trend since that time. Modern increases in        tion with a period of approximately 200 years common with
boreal winter and summer dust emissions are correlated with       the dust signal (Fig. 5b) and a large oscillation in the ITCZ

www.clim-past.net/16/283/2020/                                                                  Clim. Past, 16, 283–298, 2020
292 P. Sabatier et al.: Past African dust inputs
Corsica corresponding to a positive (negative) NAO index
over the last millennium (Fig. 6a). During the positive NAO
phase, the pressure gradient between the Icelandic low and
the subtropical high is more intense than normal and westerly
winds are stronger across northern Europe, which is associ-
ated with mild temperatures and higher precipitation, while
drier conditions than usual are produced at lower latitudes
across southern Europe. Moulin et al. (1997) showed that,
over the modern period, the positive NAO phase, with drier
conditions over southern Europe, the Mediterranean Sea, and
northern Africa, induced higher dust transport and affected
both the pattern and intensity of the transport of African
dust. When the NAO is negative, the pressure gradient de-
creases and the westerlies are shifted to the south, providing
precipitation over the Mediterranean and the North African
continent and restricting dust uptake and transport (Moulin
et al., 1997). The correlation between the positive summer
NAO and a high dust contribution has been identified more
recently in an 11-year (2001–2011) record (Pey et al., 2013).
But, even if in our record we compare the dust signal (mainly
spring and summer) with the yearly index of the NAO, this
strong relation appeared since ∼ 1000 cal BP (Fig. 6a), which
corresponds to the period of a long-term increase in African
dust correlated with the southward ITCZ migration (Fig. 4),
suggesting that long-term forcing through ITCZ migration
has an impact on the NAO–African dust correlation. This in-
fluence can be explained by the fact that the ITCZ and west-
erlies are both linked to the Hadley cell through the North
Atlantic subtropical high, and the position of the westerlies is
influenced by the NAO (Souza and Cavalcanti, 2009). During
the positive phase of the NAO with a strong North Atlantic
subtropical high, the ITCZ is displaced southward in April
(Souza and Cavalcanti, 2009). Here we suggest that a long-
term southward position of the ITCZ over the last millennium
may have enhanced NAO forcing on African dust inputs to
the western Mediterranean area in spring and summer.
The scalogram of TSI reconstructions shows significant
Figure 5. Individual wavelet analyses for (a) dust content (Fe, Lake
Bastani), (b) TSI (Steinhilber et al., 2012), (c) ITCZ (Haug et al., periodicities already known from cosmic-ray-produced ra-
2001), and (d) NAO+ (Franke et al., 2017) signals. The NAO signal dionuclide records (Steinhilber et al., 2012), such as the pe-
covers the last 2000 years. The occurrence of periods (labeled in riod of ∼ 200 years corresponding to the de Vries cycle and
black) with respect to time is given by the bright yellow–red colors. the period of ∼ 300 years to a lesser extent, with a less signif-
The 95 % confidence levels are indicated with the dotted line. icant one of around 430 years. These two significant cycles
are the same as the two shorter cycles observed in the dust
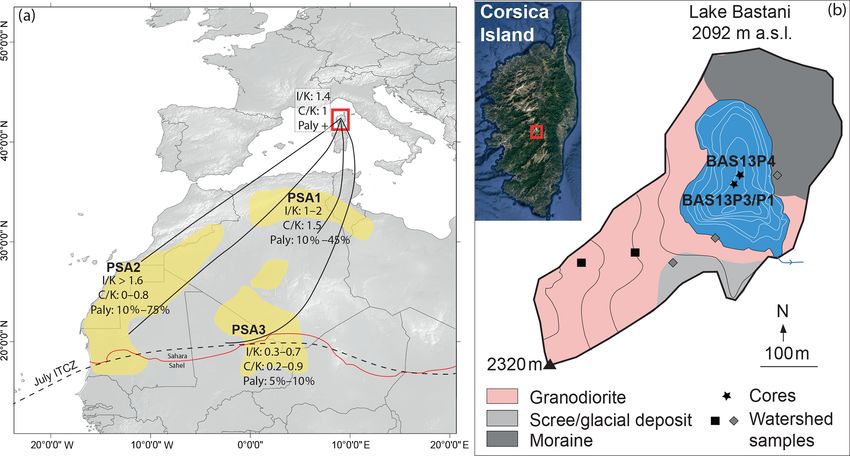
inputs (Fig. 5a, b). Cross-wavelet analysis between dust in-
position (wavelet analyses not shown for ENSO). We use a put and the TSI signal over the last 3000 years highlights
recent NAO reconstruction for the last 2000 years (Franke a period of high (low) dust inputs in Corsica corresponding
et al., 2017), based on 37 highly resolved proxy records fol- to a low (high) TSI between 3000 and 1000 cal BP with a
lowing the recommendation of Ortega et al. (2015), which shift from the 200- to the 300-year cycles around 2000 cal BP
showed that an NAO index reconstruction based on two (Fig. 6b). Variation in solar ultraviolet (UV) radiation affects
proxies is not sufficient to define long-term NAO variability. the stratospheric ozone, leading to temperature variations
While this record only covers the last 2 millennia, wavelet in the top stratosphere. The resulting temperature gradients
analyses have been performed and display cycles of approx- lead to changes in the zonal wind, which change the plane-
imately 200 and 300 years (Fig. 5d). Cross-wavelet anal- tary wave–mean flow interactions and appear to be an indi-
ysis between dust input and the NAO signal over the last rect effect of the changes in the global atmospheric circula-
2000 years highlights a period of high (low) dust inputs in tion through the “top-down” mechanism (Gray et al., 2010).
Clim. Past, 16, 283–298, 2020 www.clim-past.net/16/283/2020/P. Sabatier et al.: Past African dust inputs 293
Figure 7. (a) Total solar irradiance variations (standardized over
the whole period) from Lean (2009). (b) Regression (hPa / TSI SD)
of the sea level pressure data from the 20CR reanalysis over the TSI
variations for the period 1870–2009 in spring (March, April, May:
Figure 6. Cross-wavelet analyses for dust input versus NAO (a) and
MAM). Only the values significant at the 95 % level appear in color,
TSI (b). The dotted line represents an identified significant cycle for
while the contours show all the computed values.
each signal in single wavelet analyses (Fig. 5). Right and left arrows
are respectively in phase or in phase opposition, and up and down
arrows respectively show the first or second signal that predates the
other one. in the magnitude of anticyclones over North Africa, i.e., a
negative sea level pressure or low-pressure anomaly. Such a
low-pressure anomaly is known to increase the dust trans-
Thus, small changes in solar radiation might indirectly affect port over the recent period (Moulin et al., 1998). To support
the climate by inducing atmospheric changes, such as in the this link between the TSI and changes in the pressure pat-
large European Atlantic sector with wind and precipitation tern over North Africa, as the amplitude of centennial vari-
changes (Martin-Puertas et al., 2012) or in the Mediterranean ability may be of the same order of magnitude as the well-
area, which results in both increased storminess (Sabatier et observed 11-year cycle, we performed a regression analy-
al., 2012) and a higher flood frequency (Sabatier et al., 2017; sis over the instrumental period using the TSI reconstruction
Vannière et al., 2013). (Lean, 2009) and the NOAA 20CR reanalysis (Compo et al.,
To explain the link we found between TSI and dust 2011). We find in spring a significant negative anomaly in
records, we argue that changes in the TSI can (slightly) mod- pressure when TSI is decreasing (Fig. 7), which is in line
ify the main wind patterns. Indeed, a decrease in TSI dimin- with the mechanism depicted before. Even if TSI variations
ishes the surface solar insolation in tropical area, especially are weak, this regression analysis show that such an ampli-
in cloud-free areas, which can decrease evaporation there and tude is likely sufficient to have a significant impact on the
then the moisture transport into the precipitation convergence climatic system. Moreover, this mechanism could be also as-
zone, leading to a weakening of the Hadley cell, as illus- sociated with the Saharan Heat Low (SHL), an area of high
trated in some model simulations (Meehl et al., 2004). Such a surface temperature and low surface pressure within the sum-
weakening can then induce in the subsidence zone a decrease mertime Sahara, when SHL cools, wind speed increases over
www.clim-past.net/16/283/2020/ Clim. Past, 16, 283–298, 2020294 P. Sabatier et al.: Past African dust inputs
the Sahara, and increasing dust emission from the major dust when the ITCZ is in a more northern position such an atmo-
sources in the Sahara is observed (Wang et al., 2015, 2017). spheric mechanism is enhanced and induces changes in wind
Therefore, we argue that such a relatively simple process, ob- intensity and the transport pathways of dust into the western
served over the last century and already found in model sim- Mediterranean area. As long-term ITCZ migration reflects
ulations concerning the weakening of the Hadley cell (Meehl the availability of dust sources to be mobilized, the NAO and
et al., 2004), can explain the link we found between a low TSI modulate short-term Saharan dust inputs to the western
TSI and higher dust input records in Corsica for the period Mediterranean area through changes in wind and transport
between 3000 and 1000 cal BP. Thus, we hypothesize here pathways. The highlighting of these three climatic controls
that when the ITCZ is in a more northern position (before on dust inputs at different timescales allows for a better defi-
1070 cal BP) such a mechanism is enhanced through changes nition of dust–climate interactions from a long-term perspec-
in wind intensity and the transport pathways of dust into the tive.
western Mediterranean area. The mechanism proposed does
not account for the potential impact feedback of atmospheric
circulation on dust emissions or the impact on solar irradi- Data availability. Core data are all stored in PANGEA (https:
ance reaching the surface (Alonso-Montesinos et al., 2017; //doi.pangaea.de/10.1594/PANGAEA.910655, last access: 14 Jan-
Granados-Muñoz et al., 2019; Kosmopoulos et al., 2017). uary 2020).
5 Conclusions Supplement. The supplement related to this article is available
online at: https://doi.org/10.5194/cp-16-283-2020-supplement.
A high-elevation sediment record from Lake Bastani on Cor-
sica in the northwestern Mediterranean Sea allows for a re-
Author contributions. PS, BV, MD, and CP designed the re-
construction of high-resolution African dust variability over search; PS, CC, EM, MCB, BC, JLR, ALD, YC, JD, IJB, CP, DS,
the last 3150 years. Thanks to mineralogical and geochem- MK, and JP performed the research; PS, MN, YP, CC, BV, DS, CS,
ical analyses we can unambiguously determine that African ML, and MD contributed new reagents and analytic tools; PS, YP,
dust is the main terrigenous sediment component. This multi- MN, BV, DS, CS, ML, and MD analyzed data; and PS, MN, CC,
proxy approach reveals that both the western Sahara and Sa- MD, BV, DS, and FA wrote the paper.
hel are the main African dust sources to the western Mediter-
ranean area, with a more important influence of the northern
Sahara over the last centuries, in agreement with the mod- Competing interests. The authors declare that they have no con-
ern dust provenance areas identified for Corsica through air flict of interest.
mass trajectories. We suggest that the millennial-scale varia-
tions of Saharan dust inputs could be forced by the southward
migration of the ITCZ, with an increase since 1070 cal BP in Acknowledgements. We thank the Office Environemental Corse
response to a gradual orbitally induced decrease in North- (OEC; Gwenaëlle Baldovini and Pierre-Jean Albertini), the Parc
ern Hemisphere insolation. This correlation could reflect the Naturel Regional de Corse, and the Direction regionale de
l’Environnement, de l’Aménagement et du Logement de Corse
increased availability of dust sources to be mobilized by an
(DREAL) for the coring authorization and support during fieldwork.
increase in wind and a decrease in precipitation, soil mois-
The authors would like to thank Marie-Dominique Loÿe-Pilot for
ture, and vegetation cover over North Africa. At the centen- paper reading, Victor Froissard for help with R Code, Jérôme De-
nial timescale, the NAO and TSI are the two main climate bret for his help during the field trip, and Cécile Pignol for data and
forcings identified, but their respective influences seem to metadata good practices. Some of the 14 C analyses were acquired
be related to the ITCZ migration. Since 1070 cal BP (ITCZ thanks to the CNRS-INSU ARTEMIS national radiocarbon AMS
southern position) the NAO has been the dominant climate measurement program at Laboratoire de Mesure 14 C (LMC14) in
forcing, with an increase in Saharan dust input during the the CEA Institute at Saclay (French Atomic Energy Commission).
NAO positive phase and drier conditions over southern Eu- The figure about short-lived radionuclides was computed thanks
rope, the Mediterranean Sea, and northern Africa affecting to a code developed by Rosalie Bruel (manuscript in preparation).
both the pattern and intensity of the transport of African The authors would also like to thank the Laboratoire Souterrain de
Modane facilities for the gamma spectrometry measurements and
dust, as observed from the instrumental period. Even if a pre-
Environnement, Dynamique et Territoires de Montagne for the X-
cise NAO reconstitution is not available before 2000, wavelet ray fluorescence analyses. We thank Nathalie Combourieu-Nebout
analysis shows that between 3150 and 1070 cal BP (ITCZ in and two anonymous reviewers for their comments and suggestions
a more northern position) the centennial increases in Saharan that improved the paper.
dust inputs are correlated with a low TSI. During the instru-
mental era, we observe during low TSI a significant negative
anomaly in pressure over Africa, which is known to increase
the dust transport over the recent period. We suggest that
Clim. Past, 16, 283–298, 2020 www.clim-past.net/16/283/2020/P. Sabatier et al.: Past African dust inputs 295
Financial support. This research is part of the HoTMED project Berger, A. and Loutre, M. F.: Insolation values for the climate
(led by Boris Vannière) and is funded by the Région Franche-Comté of the last 10 million years, Quat. Sci. Rev., 10, 297–317,
through the University of Franche-Comté as well as by the CNRS https://doi.org/10.1016/0277-3791(91)90033-Q, 1991.
through the PaleoMEx-INEE program. Blaauw, M.: Methods and code for “classical” age-modelling
of radiocarbon sequences, Quat. Geochronol., 5, 512–518,
https://doi.org/10.1016/j.quageo.2010.01.002, 2010.
Review statement. This paper was edited by Nathalie Com- Bout-Roumazeilles, V., Combourieu Nebout, N., Peyron, O.,
bourieu Nebout and reviewed by two anonymous referees. Cortijo, E., Landais, A., and Masson-Delmotte, V.: Con-
nection between South Mediterranean climate and North
African atmospheric circulation during the last 50 000 yr BP
North Atlantic cold events, Quat. Sci. Rev., 26, 3197–3215,
References https://doi.org/10.1016/j.quascirev.2007.07.015, 2007.
Bout-Roumazeilles, V., Combourieu-Nebout, N., Desprat, S., Siani,
Aitchison, J., Barcelo-Vidal, C., Egozcue, J. J., and Pawlowsky- G., Turon, J.-L., and Essallami, L.: Tracking atmospheric and
Glahn, V.: A concise guide for the algebraic – geometric structure riverine terrigenous supplies variability during the last glacial
of the simplex, the sample space for compositional data analysis, and the Holocene in central Mediterranean, Clim. Past, 9, 1065–
in: Proceedings of IAMG’02 – The Eighth Annual Conference of 1087, https://doi.org/10.5194/cp-9-1065-2013, 2013.
the International Association for Mathematical Geology, edited Bruel, R. and Sabatier, P.: serac: a R package for Short-
by: Bayer, U., Burger, H., and Skala, W., Berlin, Germany, 387– livEd RAdionuclide Chronology of recent sediment cores,
392, 2002. https://doi.org/10.31223/osf.io/f4yma, 1–38, 2020.
Albani, S., Mahowald, N. M., Winckler, G., Anderson, R. F., Bradt- Caquineau, S.: Mineralogy of Saharan dust transported
miller, L. I., Delmonte, B., François, R., Goman, M., Heavens, N. over northwestern tropical Atlantic Ocean in rela-
G., Hesse, P. P., Hovan, S. A., Kang, S. G., Kohfeld, K. E., Lu, H., tion to source regions, J. Geophys. Res., 107, 1–14,
Maggi, V., Mason, J. A., Mayewski, P. A., McGee, D., Miao, X., https://doi.org/10.1029/2000JD000247, 2002.
Otto-Bliesner, B. L., Perry, A. T., Pourmand, A., Roberts, H. M., Carignan, J., Hild, P., Mevelle, G., Morel, J., and Yeghicheyan,
Rosenbloom, N., Stevens, T., and Sun, J.: Twelve thousand years D.: Routine Analyses of Trace Elements in Geological Samples
of dust: the Holocene global dust cycle constrained by natural using Flow Injection and Low Pressure On-Line Liquid Chro-
archives, Clim. Past, 11, 869–903, https://doi.org/10.5194/cp-11- matography Coupled to ICP-MS: A Study of Geochemical Ref-
869-2015, 2015. erence Materials BR, DR-N, UB-N, AN-G and GH, Geostand.
Alonso-Montesinos, J., Barbero, J., Polo, J., López, G., Geoanal. Res., 25, 187–198, https://doi.org/10.1111/j.1751-
Ballestrín, J., and Batlles, F. J.: Impact of a Saha- 908X.2001.tb00595.x, 2001.
ran dust intrusion over southern Spain on DNI estima- Cockerton, H. E., Holmes, J. A., Street-Perrott, F. A., and Ficken,
tion with sky cameras, Atmos. Environ., 170, 279–289, K. J.: Holocene dust records from the West African Sahel
https://doi.org/10.1016/j.atmosenv.2017.09.040, 2017. and their implications for changes in climate and land sur-
Arnaud, F., Lignier, V., Revel, M., Desmet, M., Beck, C., face conditions, J. Geophys. Res.-Atmos., 119, 8684–8694,
Pourchet, M., Charlet, F., Trentesaux, A., and Tribovillard, https://doi.org/10.1002/2013JD021283, 2014.
N.: Flood and earthquake disturbance of 210 Pb geochronol- Colin, C., Turpin, L., Bertaux, J., Desprairies, A., and Kissel, C.:
ogy (Lake Anterne, NW Alps), Terra Nova, 14, 225–232, Erosional history of the Himalayan and Burman ranges during
https://doi.org/10.1046/j.1365-3121.2002.00413.x, 2002. the last two glacial–interglacial cycles, Earth Planet. Sc. Lett.,
Avila, A., Queralt-Mitjans, I., and Alarcón, M.: Mineralogical com- 171, 647–660, https://doi.org/10.1016/S0012-821X(99)00184-3,
position of African dust delivered by red rains over north- 1999.
eastern Spain, J. Geophys. Res.-Atmos., 102, 21977–21996, Compo, G. P., Whitaker, J. S., Sardeshmukh, P. D., Matsui, N., Al-
https://doi.org/10.1029/97JD00485, 1997. lan, R. J., Yin, X., Gleason, B. E., Vose, R. S., Rutledge, G.,
Avila, A., Alarcón, M., Castillo, S., Escudero, M., García Orellana, Bessemoulin, P., Brönnimann, S., Brunet, M., Crouthamel, R. I.,
J., Masqué, P. and Querol, X.: Variation of soluble and insoluble Grant, A. N., Groisman, P. Y., Jones, P. D., Kruk, M. C., Kruger,
calcium in red rains related to dust sources and transport patterns A. C., Marshall, G. J., Maugeri, M., Mok, H. Y., Nordli, ø., Ross,
from North Africa to northeastern Spain, J. Geophys. Res., 112, T. F., Trigo, R. M., Wang, X. L., Woodruff, S. D., and Worley, S.
1–14, https://doi.org/10.1029/2006JD007153, 2007. J.: The Twentieth Century Reanalysis Project, Q. J. Roy. Meteor.
Bajard, M., Sabatier, P., David, F., Develle, A.-L., Reyss, J.-L., Soc., 137, 1–28, https://doi.org/10.1002/qj.776, 2011.
Fanget, B., Malet, E., Arnaud, D., Augustin, L., Crouzet, C., deMenocal, P., Ortiz, J., Guilderson, T., Adkins, J., Sarnthein, M.,
Poulenard, J., and Arnaud, F.: Erosion record in Lake La Thuile Baker, L., and Yarusinsky, M.: Abrupt onset and termination
sediments (Prealps, France): Evidence of montane landscape dy- of the African Humid Period, Quat. Sci. Rev., 19, 347–361,
namics throughout the Holocene, The Holocene, 26, 350–364, https://doi.org/10.1016/S0277-3791(99)00081-5, 2000.
https://doi.org/10.1177/0959683615609750, 2016. Doherty, O. M., Riemer, N. and Hameed, S.: Control of Saharan
Bergametti, G., Gomes, L., Remoudaki, E., Desbois, M., Martin, D., mineral dust transport to Barbados in winter by the Intertrop-
and Buat-Ménard, P.: Present Transport and Deposition Patterns ical Convergence Zone over West Africa: winter dust in Bar-
of African Dusts to the North-Western Mediterranean, in Paleo- bados and the ITCZ, J. Geophys. Res.-Atmos., 117, D19117,
climatology and Paleometeorology: Modern and Past Patterns of https://doi.org/10.1029/2012JD017767, 2012.
Global Atmospheric Transport, edited by: Leinen, M. and Sarn-
thein, M., Springer Netherlands, Dordrecht, 227–252, 1989.
www.clim-past.net/16/283/2020/ Clim. Past, 16, 283–298, 2020You can also read