Insights into HOx and ROx chemistry in the boreal forest via measurement of peroxyacetic acid, peroxyacetic nitric anhydride (PAN) and hydrogen ...
←
→
Page content transcription
If your browser does not render page correctly, please read the page content below
Atmos. Chem. Phys., 18, 13457–13479, 2018
https://doi.org/10.5194/acp-18-13457-2018
© Author(s) 2018. This work is distributed under
the Creative Commons Attribution 4.0 License.

Insights into HOx and ROx chemistry in the boreal forest via
measurement of peroxyacetic acid, peroxyacetic nitric
anhydride (PAN) and hydrogen peroxide
John N. Crowley1 , Nicolas Pouvesle1 , Gavin J. Phillips1 , Raoul Axinte1 , Horst Fischer1 , Tuukka Petäjä2 ,
Anke Nölscher1 , Jonathan Williams1 , Korbinian Hens1 , Hartwig Harder1 , Monica Martinez-Harder1 , Anna Novelli1 ,
Dagmar Kubistin1 , Birger Bohn3 , and Jos Lelieveld1
1 Division   of Atmospheric Chemistry, Max-Planck-Institute für Chemie, Mainz, Germany
2 Institute for Atmospheric and Earth System Research INAR/Physics, University of Helsinki,
Helsinki, Finland
3 Institut für Energie- und Klimaforschung, Troposphäre (IEK-8), Forschungszentrum Jülich GmbH, 52425 Jülich, Germany

Correspondence: John N. Crowley (john.crowley@mpic.de)

Received: 19 April 2018 – Discussion started: 14 May 2018
Revised: 20 August 2018 – Accepted: 23 August 2018 – Published: 21 September 2018

Abstract. Unlike many oxidised atmospheric trace gases,         oxidized trace gases were observed. A dominant fraction of
which have numerous production pathways, peroxyacetic           CH3 O2 radical generation was found to arise via reactions
acid (PAA) and PAN are formed almost exclusively in gas-        of the CH3 C(O)O2 radical. The model indicates that organic
phase reactions involving the hydroperoxy radical (HO2 ),       peroxy radicals were present at night in high concentrations
the acetyl peroxy radical (CH3 C(O)O2 ) and NO2 and are         that sometimes exceeded those predicted for daytime, and
not believed to be directly emitted in significant amounts      initially divergent measured and modelled HO2 concentra-
by vegetation. As the self-reaction of HO2 is the main pho-     tions and daily concentration profiles are reconciled when or-
tochemical route to hydrogen peroxide (H2 O2 ), simultane-      ganic peroxy radicals are detected (as HO2 ) at an efficiency
ous observation of PAA, PAN and H2 O2 can provide in-           of 35 %. Organic peroxy radicals are found to play an impor-
sight into the HO2 budget. We present an analysis of ob-        tant role in the recycling of OH radicals subsequent to their
servations taken during a summertime campaign in a boreal       loss via reactions with volatile organic compounds.
forest that, in addition to natural conditions, was temporar-
ily impacted by two biomass-burning plumes. The observa-
tions were analysed using an expression based on a steady-
state assumption using relative PAA-to-PAN mixing ratios to     1   Introduction
derive HO2 concentrations. The steady-state approach gen-
erated HO2 concentrations that were generally in reason-        Peroxyacetyl nitric anhydride (CH3 C(O)O2 NO2 ), commonly
able agreement with measurements but sometimes overesti-        and hereafter referred to as PAN, plays a centrally impor-
mated those observed by factors of 2 or more. We also used      tant role as a reservoir of reactive nitrogen and transportation
a chemically simple, constrained box model to analyse the       medium for NOx from polluted to NOx -poor regions of the
formation and reaction of radicals that define the observed     atmosphere and thus impacts global tropospheric O3 forma-
mixing ratios of PAA and H2 O2 . After nudging the simu-        tion (Singh and Hanst, 1981; Fairlie et al., 2007; Zhang et
lation towards observations by adding extra, photochemical      al., 2008). This, combined with its influence on ecosystem
sources of HO2 and CH3 C(O)O2 , the box model replicated        health and productivity (Sparks et al., 2003), has made PAN
the observations of PAA, H2 O2 , ROOH and OH through-           a target of environmental research for several decades (Singh,
out the campaign, including the biomass-burning-influenced      1987; Roberts, 1990; Grosjean, 2003). PAN is formed exclu-
episodes during which significantly higher levels of many       sively in the termolecular reaction of NO2 with the peroxy-

Published by Copernicus Publications on behalf of the European Geosciences Union.
13458                                        J. N. Crowley et al.: Insights into HOx and ROx chemistry in the boreal forest

acetyl radical (PA, CH3 C(O)O2 ), which is considered one of         Unlike PAN, there are few measurements of PAA (Fels
the four most abundant organic peroxy radicals in the atmo-       and Junkermann, 1994; He et al., 2010; Zhang et al., 2010;
sphere (Tyndall et al., 2001).                                    Nguyen et al., 2015) and even fewer data sets in which PAN
   PAN is thermally unstable, with a lifetime for re-             and PAA were both monitored (Zhang et al., 2010; Phillips et
dissociation to reactants (Reaction R-1), which is of the order   al., 2013). A significant difference between PAA and many
of hours at temperatures close to 20 ◦ C, but which increases     other organic acids is that, to the best of our knowledge,
to weeks or longer at lower temperatures as found at higher       the former is generated in the gas phase almost exclusively
altitudes.                                                        via Reaction (R2a), whereas non-peroxy acids (e.g. its acetic
                                                                  acid co-product in Reaction R2b) may be emitted by vegeta-
CH3 C(O)O2 + NO2 + M → CH3 C(O)O2 NO2 + M                 (R1)    tion (Talbot et al., 1995) or formed in reactions of O3 with
CH3 C(O)O2 NO2 + M → CH3 C(O)O2 + NO2 + M                (R-1)    olefins (Grosjean, 1992) or by biomass burning (Talbot et al.,
                                                                  1988). PAA may also be formed in aerosols by the aqueous-
As PAN is formed in reactions involving NO2 and radi-             phase oxidation of acetic acid by H2 O2 , but its high solubility
cals formed from oxidation of organics its occurrence is fre-     and aqueous-phase equilibrium with CH3 C(O)OH and H2 O
quently associated with photochemical ozone formation, and        preclude significant release into the gas phase.
PAN measurements have been interpreted to derive regional            Recently, we presented a data set of quasi-simultaneous
O3 formation rates (Williams et al., 1997).                       PAN and PAA measurements made at a boreal forest site
   Peroxyacetic acid (CH3 C(O)OOH, hereafter PAA) is              in Finland (Phillips et al., 2013). In Phillips et al. (2013)
formed in a branch of the reaction of CH3 C(O)O2 with HO2         more technical aspects of the measurement of PAN and PAA
(Reaction R2) and is thus linked to PAN via their common,         were described, though we also alluded to the fact that, due
organic, peroxy-radical precursor.                                to their partly common generation mechanism, PAN / PAA
                                                                  ratios may be a useful indicator of HO2 levels. Here, we ex-
CH3 C(O)O2 + HO2 → CH3 C(O)OOH + O2                      (R2a)    amine that aspect in more detail using an analytical expres-
                     → CH3 C(O)OH + O3                  (R2b)     sion that describes the PAA-to-PAN ratio. We also combine
                     → OH + CH3 CO2 + O2                 (R2c)    the PAN and PAA measurements with those of several other
                                                                  trace gases and use chemical box modelling with a highly
   The fate of the CH3 CO2 radical formed in Reaction (R2c)       simplified reaction scheme to gain insight into HOx chem-
is decomposition to CO2 and CH3 , the latter being converted      istry and the factors affecting PAN, PAA and H2 O2 forma-
immediately to CH3 O2 in the presence of O2 .                     tion at the boreal site.
   Several recent experimental studies of Reaction (R2) (Has-
son et al., 2004; Dillon and Crowley, 2008; Jenkin et al.,
2010; Groß et al., 2014) have shown that the dominant path-       2   Campaign site and instruments
way (Reaction R2c) results in OH formation, contributing
to HOx recycling in NOx poor regions (Lelieveld et al.,           The HUMPPA-COPEC campaign in the summer of 2010
2008; Taraborrelli et al., 2012). The IUPAC preferred values      was located in the Finnish boreal forest at the SMEAR
for this reaction (Atkinson et al., 2006; IUPAC, 2018) are        II-Hyytiälä station (Hari and Kulmala, 2005) (61◦ 510 N,
an overall rate coefficient at a room temperature of (2.2 ±       24◦ 170 E). The location of the site means that it experiences
0.4) ×10−11 cm3 molecule−1 s−1 with 50 % (±10 %) of re-           a very homogeneous fetch extending over hundreds of kilo-
active collisions resulting in OH formation (Reaction R2c)        metres in all directions. A campaign overview with a list
and branching ratios of 0.37 ± 0.1 and 0.13 ± 0.1 for Reac-       of instruments and an outline of the meteorological situa-
tions (R2a) and (R2b), respectively.                              tion during the intensive period (July and August) is given
   Under conditions of temperature and pressure found in the      in Williams et al. (2011). The campaign period was unusu-
lowermost troposphere, the rate coefficients for reaction of      ally warm for this location (maximum temperature recorded
CH3 C(O)O2 with NO2 and HO2 are similar (k1 at 298 K              was ∼ 30 ◦ C), mainly due to the above-average contribution
and 1 bar pressure is 9.3 × 10⁻¹² cm3 molecule−1 s−1 ) and        of air masses from the south, which resulted in enhanced
the relative flux of CH3 C(O)O2 radicals into PAN and PAA         biogenic emissions from the forest and which also brought
formation will depend on the relative abundance of NO2 and        two episodes of biomass-burning-impacted air to the site.
HO2 . Apart from extremely clean environments or very aged        The forest is dominated by a mixture of coniferous forest
air pollution, when HO2 concentrations approach those of          (Scots pine and Norway spruce) and mixed forest (conifers
NO2 , this will generally favour PAN. In the summertime           and silver birch). Most of the instruments from which data
boundary layer at midlatitudes, PAN is, however, short-lived      have been used in this work (PAN, PAA, H2 O2 , NO, NO2 , O3
and will readily decompose back to NO2 + CH3 C(O)O2 , im-         and HCHO) had inlets at the top of a ∼ 20 m high tower lo-
plying that the formation of the thermally stable peroxy acid     cated in a small clearing (∼ 20 m diameter) in the forest and
in (R2a) will be a significant CH3 C(O)O2 and HOx sink in         at approximately the same height as the surrounding tree-
warm conditions with low NOx levels.                              tops. Other data including OH and HO2 and organic trace

Atmos. Chem. Phys., 18, 13457–13479, 2018                                         www.atmos-chem-phys.net/18/13457/2018/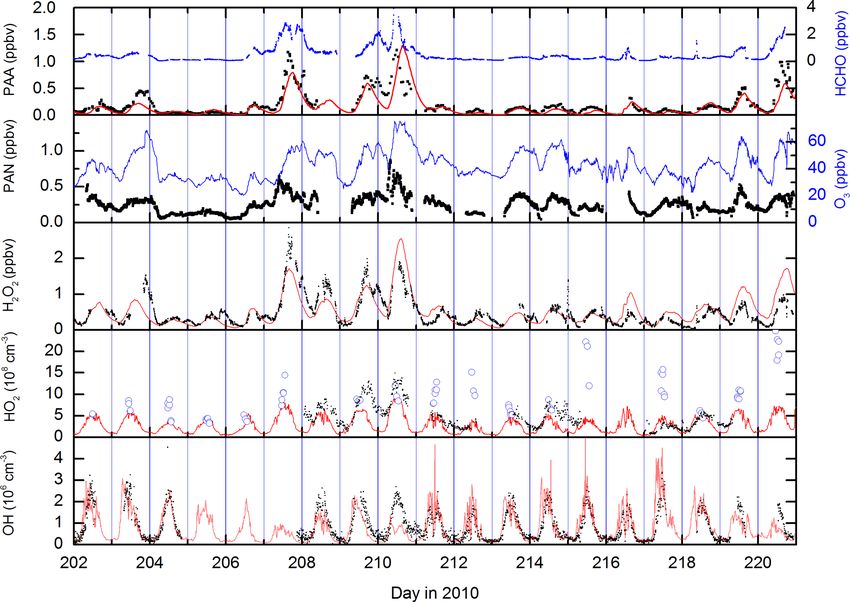
J. N. Crowley et al.: Insights into HOx and ROx chemistry in the boreal forest 13459
gases were taken by instruments located nearby (for details An additional feature during the first episode (day 210.5) is
of instrument positions and inlet heights see Williams et al., a spike in the SO2 , HCHO and CO mixing ratios and also in
2011). non-oxidised hydrocarbons such as pentane (Williams et al.,
PAN and PAA were measured using an iodide chemical 2011). This shorter-lived plume was associated with a con-
ionisation mass spectrometer (I-CIMS) described in Phillips tinuous and rapid change in wind direction (from ∼ 25 to ∼
et al. (2013). Details of the instruments used to measure 160◦ ) and higher local wind speeds (up to 25 km h−1 ), which
H2 O2 and ROOH (enzymes/fluorescence), HCHO (Hantzch resulted in the arrival of biomass-burning impacted but less
method), NOx (chemiluminescence detector) organic per- aged air masses to the site. The presence of sharply elevated
oxides and O3 (UV) have been reported elsewhere (Stick- SO2 and pentane strongly suggests that fossil-fuel-related
ler et al., 2006; Hosaynali Beygi et al., 2011; Fischer et emissions from St Petersburg, (120◦ , 400 km distant), were
al., 2015). Details of the OH-reactivity measurements and mixed into this air mass, which may be regarded as chemi-
proton-transfer mass spectrometric (PTRMS)/GC measure- cally distinct from the other, longer-lasting biomass-burning
ments of organic trace gases have been previously given episodes. NOx levels were not elevated during the biomass-
(Nölscher et al., 2012; Yassaa et al., 2012; Kourtchev et al., burning plumes, confirming that they were chemically aged
2016). OH was measured by chemical ionisation mass spec- with respect to the conversion of NOx to NOy . Significant
trometry (Petäjä et al., 2009), HO2 radicals were measured increases in signals at several PTRMS masses also indicated
by laser-induced fluorescence (LIF-FAGE) after conversion the presence of elevated amounts of oxygenated, volatile or-
to OH as described in Hens et al. (2014) and Novelli et ganic compounds (OVOCs, including organic acids, aldehy-
al. (2014). J values were obtained from process-specific pa- des and ketones) and also aromatic trace gases during the
rameterizations based on J -NO2 and J -(O(1 D)) measured by period where the site was impacted by the biomass-burning
filter radiometers (Bohn et al., 2008). Owing to known inter- plumes. The warmer temperatures were also associated with
ferences by organic peroxy radicals (Fuchs et al., 2011, 2016; increases in the emissions of biogenic trace gases (Paasonen
Lew et al., 2018), especially in forested regions, we refer to et al., 2013; Kourtchev et al., 2016), making this a chemi-
the measurements of HO2 as LIF-HO2 which represent an cally very complex period during the campaign. An overview
upper limit to true HO2 levels. Since the discovery of this in- of several trace gases measured by the PTRMS is given in
terference in 2010, it was eliminated from all later LIF mea- Fig. S1 of the Supplement.
surements by reducing the amount of NO added internally to While the elevated levels of long-lived biomass-burning
the sampled air and by regularly performing titration tests in tracers such as CO and CH3 CN and biomass-burning aerosol
the field. signal (Corrigan et al., 2013) are clearly due to long-range
transport, this is unlikely to be the case for the shorter-lived
trace gases. The very high OH reactivity (up to 45 s−1 ) ob-
served (Nölscher et al., 2012) during the biomass-burning
3 Results and discussion events and the fact that both H2 O2 and PAA display diur-
nal profiles consistent with photochemical generation sug-
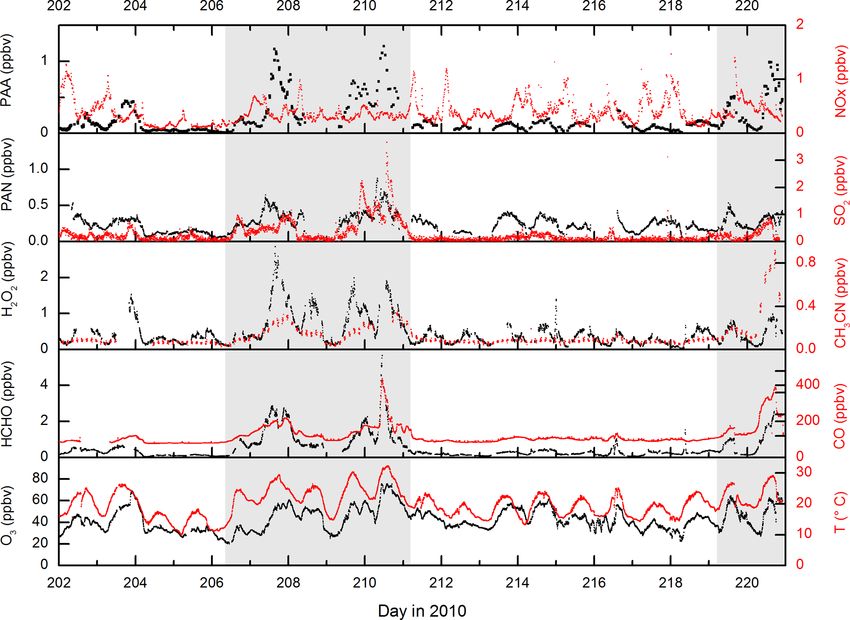
Figure 1 displays measurements of PAN and PAA made gest that the high levels of PAA, PAN and H2 O2 are related
by iodide CIMS during HUMPPA-COPEC-2010 and several to the presence of high levels of radical precursors in the
other trace gases (O3 , CO, H2 O2 , HCHO, NOx ), which pro- biomass-burning plumes, as previously observed for boreal
vide some indication of the type of air masses sampled. Gen- fires (Alvarado et al., 2010).
erally, the mixing ratios of PAN and PAA were similar, with While PAA and PAN have similar photochemical genera-
PAN typically present at less than one ppb, reflecting the rel- tion routes, a cursory examination of their average diel pro-
atively low NOx levels (median, noontime mixing ratio of files during the campaign (Fig. 2) reveals important differ-
0.3 ± 0.1 ppbv) at this boreal forest site. In two campaign ences, with peak concentrations in the daily cycle of PAA
periods, days 207–211 and 219–221 highlighted in grey in displaced (later) relative to those of PAN by about 2 h. This
Fig. 1, elevated levels of PAN and especially PAA were ob- is related to the maximum loss rates of PAN (via thermal de-
served, with mixing ratios of PAA exceeding 1 ppb compared composition), which occur at the highest temperatures in the
to levels of less than 200 pptv during the rest of the campaign. mid-afternoon. The day-to-day variations in the diel cycle of
These episodes of high PAA (and PAN) were accompanied PAA are mainly changes in the maximum mixing ratio, re-
by elevated mixing ratios of longer-lived trace gases such flecting variable rates of production from precursors, with a
as CH3 CN, CO, SO2 , HCHO and O3 , and were also coinci- night-time concentration generally tending to zero. This is
dent with higher than average temperatures. As discussed in very similar to the diel profile of H2 O2 , which is also highly
Williams et al. (2011), CH3 CN measurements indicate that, regular in shape and which, on most nights, also tends to-
during these periods, the site was impacted by biomass burn- wards zero.
ing in Russia, with back trajectories suggesting that the air The mixing ratios of PAA are plotted against those of both
from the fires had travelled for a few days before reaching H2 O2 and PAN in Fig. 3, which highlights the good correla-
the site. tion (R 2 = 0.74) with H2 O2 . The slope of the PAN-to-PAA
www.atmos-chem-phys.net/18/13457/2018/ Atmos. Chem. Phys., 18, 13457–13479, 2018
13460                                         J. N. Crowley et al.: Insights into HOx and ROx chemistry in the boreal forest

Figure 1. Measurements of PAA (CH3 C(O)OOH), PAN (CH3 C(O)O2 NO2 ) and other trace gases during HUMPPA-COPEC-2010. Day 202
was the 20 July 2010. The shaded areas represent two periods in which the site was impacted by biomass-burning plumes originating from
Russia.

ratio is reduced at high PAA mixing ratios, which were gen-          period gives loss-rate constants of 5.2 × 10⁻⁵ s−1 (H2 O2 ),
erally observed when temperature and photochemical activ-            2.3 × 10⁻⁵ s−1 (PAN) and 9.3 × 10⁻⁶ s−1 (O3 ) resulting in
ity were highest. The more rapid loss of PAN at high temper-         campaign-averaged, night-time lifetimes of ≈ 7, 5 and 30 h,
atures causes a non-linear relationship and weakens the over-        for H2 O2 , PAN and O3 , respectively. Note that as NO and
all PAA-to-PAN correlation (R 2 = 0.47). The lower panel of          HO2 are absent or present in very low concentrations at night,
Fig. 3 indicates that PAA is strongly correlated with total or-      the thermal decomposition of PAN does not result in its ef-
ganic peroxides (ROOH) and represents a significant frac-            ficient loss (see below). The night-time loss rates of H2 O2 ,
tion of total organic peroxides during the HUMPPA-COPEC              PAN and O3 therefore reflect different rates of deposition to
campaign (Phillips et al., 2013). The PAN mixing ratios over         the canopy, although that of H2 O2 will be a lower limit as
the diel cycle were very variable, especially at night-time.         night-time production can occur via the ozonolysis of ter-
   Radiosondes suggest that for HUMPPA-COPEC-2010 the                penes (see below).
lowermost layer will be mixed with the residual layer by                The average, night-time loss-rate constant for PAN of
≈ 10:00 local time (07:00 UTC), and we can consider the              2.3 × 10⁻⁵ s−1 can be equated to 2Vex / h, where Vex is the
boundary layer thereafter to be mixed up to 1 km height with         exchange velocity and h is the boundary layer height (Shep-
a further increase in height over the next 2 h, depending on         son et al., 1992). This results in an approximate value of
meteorological conditions (Ouwersloot et al., 2012). As rates        Vex ≈ 0.23 cm s−1 for an average, night-time boundary layer
of entrainment from the free troposphere and the vertical            height of 200 m for this campaign (Ouwersloot et al., 2012).
gradients of PAA are not known, in the subsequent analy-             This is consistent with values between 0 and 0.6 cm s−1 ob-
sis we assume that photochemical generation dominates the            tained at night-time over coniferous forests (Shepson et al.,
production side of the PAA budget but re-address this later          1992; Turnipseed et al., 2006; Wolfe et al., 2009). Wolfe et
when comparing measured and model predictions of PAA                 al. (2009) determined that the exchange velocity of PAN in-
and H2 O2 mixing ratios.                                             creased by a factor of ≈ 4 at noon compared to night, which
   Analysis of the net loss of PAN, O3 and H2 O2 dur-                is partially due to more efficient stomatal transport during the
ing the pre-dawn period (midnight to 04:00; see Fig. 2)              day. From this ratio, yielding an average, noontime exchange
by fitting exponential decay curves to the data during this          velocity of ≈ 0.9 cm s−1 for HUMPPA-COPEC, and assum-

Atmos. Chem. Phys., 18, 13457–13479, 2018                                             www.atmos-chem-phys.net/18/13457/2018/
J. N. Crowley et al.: Insights into HOx and ROx chemistry in the boreal forest 13461
Figure 3. Correlation of PAA with PAN, H2 O2 and ROOH (total
organic peroxides).
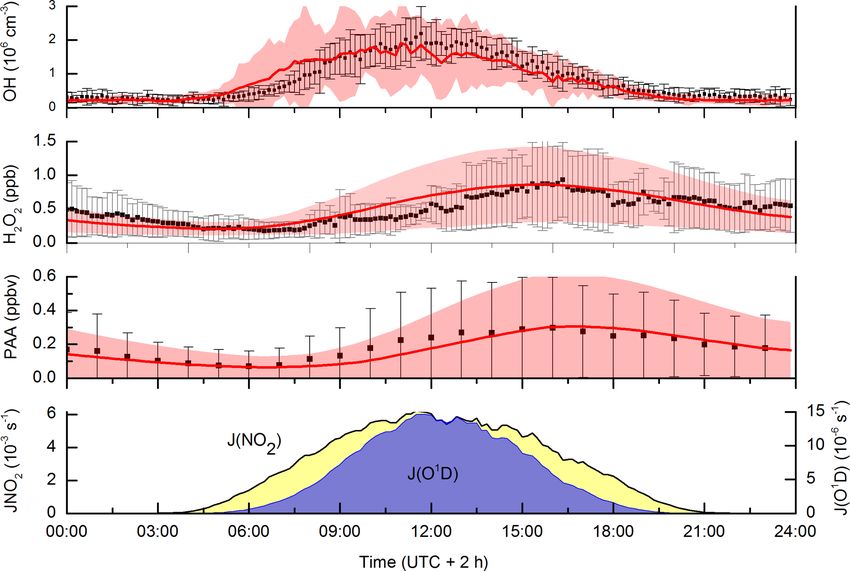
Figure 2. Averaged diel profiles (days 202–220) of PAN, O3 , parisons are complicated by variability in the chemical losses
H2 O2 , NO2 , NO, temperature, J -O(1 D) (all 10 min averages) and of O3 , e.g. via reaction with NO or sesquiterpenes (Kurpius
PAA (60 min intervals). The solid green lines represent campaign- and Goldstein, 2003), which depend on factors such as forest
averaged, night-time exponential decay rate constants (s−1 ) for type and emission rates.
H2 O2 , PAA, PAN and O3 . The dashed green line is the adjusted The observed (net) loss-rate constant for H2 O2 is 5.2 ×
decay constant for H2 O2 that takes into account its formation via
10−5 s−1 , whereby ≈ 0.25 ppbv are lost in 4 h between 00:00
ozonolysis of VOCs. The cyan lines represent average production
rates (ppbv or pptv per hour) for PAA and PAN (centred at 12:00).
and 04:00. The change in [H2 O2 ] results from a com-
bination of its production via ozonolysis of terpenes and
depositional losses. During the period from midnight to
04:00, the campaign-averaged terpene and O3 mixing ra-
ing a daytime boundary layer height of 1400 m (Ouwersloot tios were 300 pptv and 38 ppbv, respectively. The five bio-
et al., 2012), we calculate noontime loss-rate constants for genic species measured by the GC (isoprene, α-Pinene,
PAN deposition of ≈ 1×10⁻⁵ s−1 . The high temperatures en- myrcene, 3-carene and β-Pinene) have rate constants for re-
countered during the summer in the HUMPPA-COPEC-2010 action with O3 that vary between ≈ 1.3 × 10⁻¹⁷ and 5 ×
campaign mean that daytime loss of PAN due to deposition is 10−16 cm3 molecule−1 s−1 . Taking into account the mean
small compared to thermal dissociation followed by reaction relative concentration and O3 -rate coefficient for each ter-
of CH3 C(O)O2 with NO or HO2 (see below). pene, we derive an effective, campaign-averaged rate con-
With a loss-rate constant of 9.3 × 10⁻⁶ s−1 , the night-time stant of 1.5 × 10⁻¹⁶ cm3 molecule−1 s−1 for the ozonoly-
depletion of O3 is slower than for PAN. From the values pre- sis of terpenes. Taking a H2 O2 yield of 0.16 (e.g. as ob-
sented in Fig. 2, the relative loss rate of O3 and PAN is 0.4, served for α-Pinene) we calculate that ≈ 0.1 ppb H2 O2 was
which is similar to the value of 0.42±0.19 reported by Shep- generated during this period. Taken together with the ob-
son et al. (1992) and Wolfe et al. (2009), though such com- served (net) loss of H2 O2 , this implies a loss of 0.35 ppbv
www.atmos-chem-phys.net/18/13457/2018/ Atmos. Chem. Phys., 18, 13457–13479, 2018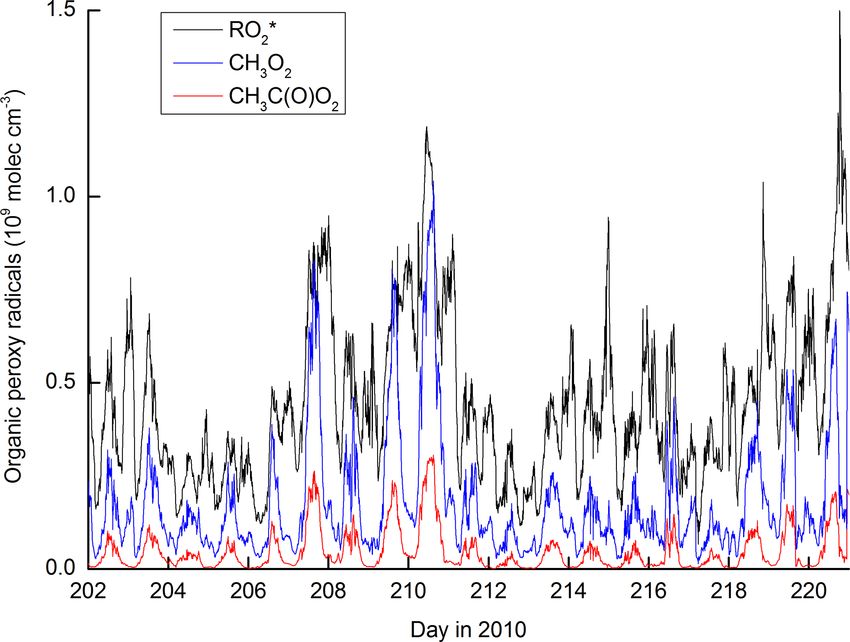
13462                                         J. N. Crowley et al.: Insights into HOx and ROx chemistry in the boreal forest

H2 O2 by dry deposition in 4 h, which translates to a loss-rate       By analogy with reactions of OH with H2 O2 and
constant of ≈ 8 × 10⁻⁵ s−1 . Equating this value to 2Vex / h       CH3 OOH, Orlando and Tyndall estimated k4 to be ≈ 1–
(see above) we derive a night-time deposition velocity for         5 × 10⁻¹² cm3 molecule−1 s−1 with CH3 C(O)O2 (and H2 O)
H2 O2 of 0.8 cm s−1 . Given the assumptions made, the uncer-       the predicted, dominant products following abstraction of
tainty associated with this value is likely to be considerable.    the acidic H atom in Reaction (R4) (Orlando and Tyndall,
Nonetheless, the value obtained is entirely consistent with        2003). Theoretical work (Rypkema and Francisco, 2013)
night-time deposition velocities of 0.8 ± 0.2, 1.0 ± 0.3 and       suggests that H abstraction at the methyl group forming (in
1.6±0.3 cm s−1 reported for H2 O2 deposition over the Cana-        air) O2 CH2 C(O)OOH is also possible. Recent experimen-
dian boreal forest, with daytime H2 O2 deposition velocities       tal work (Wu et al., 2017) suggests that k4 may be as large
that are a factor of 10 (±5) larger (Hall and Claiborn, 1997).     as 1.1 × 10⁻¹¹ cm3 molecule−1 s−1 and this value has been
Using this factor we calculate daytime deposition velocities       adopted by the IUPAC panel (IUPAC, 2018) albeit with large
of 8±4 cm s−1 . This can be equated to Vex / h, which assumes      associated uncertainty related to experimental difficulties.
no gradient in H2 O2 in a well-mixed boundary layer. Taking           The boundary layer lifetime of PAA and PAN will also be
into account the average daytime boundary layer height of          partially determined by deposition, especially in forests, as
1400 m during HUMPPA, this converts to a loss-rate con-            discussed above. The first-order rate constants representing
stant of (6 ± 3) ×10−5 s−1 during the day. Later, we shall         dry deposition are dPAN and dPAA . Experimental work (Wu et
show that these values are consistent with results from the        al., 2015) on the uptake of PAA to ambient aerosol indicates
box-model-based analysis of the data set.                          an uptake coefficient (γ ) of ≈ 3 × 10⁻⁴ . Using the simplified
   Hall and Claiborn (1997) measured deposition rates for          expression (1) for the heterogeneous loss-rate constant (khet )
summed organic peroxides (mainly CH3 OOH), which were              of a trace gas to an aerosol particle:
a factor of about 2 to 3 lower than for H2 O2 , and Nguyen
et al. (2015) measured deposition velocities for PAA over a        khet = 0.25γ c̄A,                                           (1)
temperate forest that were a factor of 2 lower than H2 O2 .
For our analysis, we apply daytime loss rates of ROOH,             where c ≈ 28 000 cm s−1 is the mean molecular velocity of
CH3 OOH and PAA due to deposition that are a factor of 2           PAA at room temperature and A = 2 × 10⁻⁶ cm2 cm−3 is the
lower than for H2 O2 . In the following, we present a more         aerosol surface area density results in an approximate loss-
detailed discussion of the chemical factors which control the      rate constant of ≈ 5 × 10⁻⁶ s−1 or a lifetime of about 3 days.
relative abundance of PAA and PAN during the campaign.             Although PAA may be lost to aerosol in regions with extreme
                                                                   aerosol loading (Li et al., 2016), this loss term is negligible,
3.1   Production and loss of PAN and CH3 C(O)OOH                   e.g. compared to depositional losses and reaction with OH in
                                                                   the boreal forest, and is not considered further in this paper.
In the absence of a sufficiently rapid reaction with OH               Considering only their in situ, production and loss (i.e. ig-
(k < 3 × 10⁻¹⁴ cm3 molecule−1 s−1 ) and photodissociation          noring advection) the net, relative rate of production of PAA
(due to low cross sections and quantum yields in the tropo-        and PAN (PPAA and PPAN , respectively) is given by
spheric spectral range) (Talukdar et al., 1995), the lifetime of
                                                                   PPAA
PAN during HUMPPA-COPEC-2010 was largely controlled                                                                            (2)
by the temperature, which strongly affects its rate of ther-       PPAN
mal decomposition to CH3 C(O)O2 and NO2 (Reaction R-1).                   k2a [CH3 C(O)O2 ]ss [HO2 ] − [PAA] (k4 [OH] + dPAA )
                                                                      =                                                        ,
The relative concentrations of trace gases such as NO and                   k1 [CH3 C(O)O2 ]ss [NO2 ] − [PAN] (k−1 + dPAN )
peroxy radicals (which can react with CH3 C(O)O2 via Reac-
tions R2 and R3) to that of NO2 , which regenerates PAN (Re-       where [CH3 C(O)O2 ]ss , is the steady-state concentration of
action R1) and its dry deposition rate dPAN thus control its       the acetylperoxy radical, determined by the ratio of its pro-
effective lifetime. Unlike other peroxides (e.g. H2 O2 ) PAA       duction and loss terms. On the right-hand side of Eq. (2),
is not formed at significant yield in the ozonolysis of BVOCs      the first terms of the numerator and denominator are read-
such as α-Pinene (Li et al., 2016).                                ily recognised as governing PAA and PAN production, while
   The most important reactions (Reactions R1, R-1, R2a)           the second terms are the summed loss rates. If both PAA and
describing the formation and loss of PAN and PAA involve           PAN were to acquire steady state, their relative concentra-
the acetyl peroxy radical (CH3 C(O)O2 ), including its reac-       tions would be given by
tion with NO (Reaction R3).                                        [PAA] [HO2 ] k2a (k−1 + dPAN )
                                                                        =      ·                     ,                         (3)
                                                                   [PAN] [NO2 ] k1 (k4 [OH] + dPAA )
CH3 C(O)O2 + NO(+O2 ) → CH3 + CO2 + NO2                    (R3)
                                                                   indicating that the PAA-to-PAN ratio depends on the relative
PAA will be lost by reaction with OH (Reaction R4):                abundance of HO2 and NO2 . This is the expression we previ-
                                                                   ously presented (Phillips et al., 2013) and which we used to
OH + CH3 C(O)OOH → CH3 C(O)O2 + H2 O.                      (R4)    derive very rough diel and campaign-averaged HO2 mixing

Atmos. Chem. Phys., 18, 13457–13479, 2018                                          www.atmos-chem-phys.net/18/13457/2018/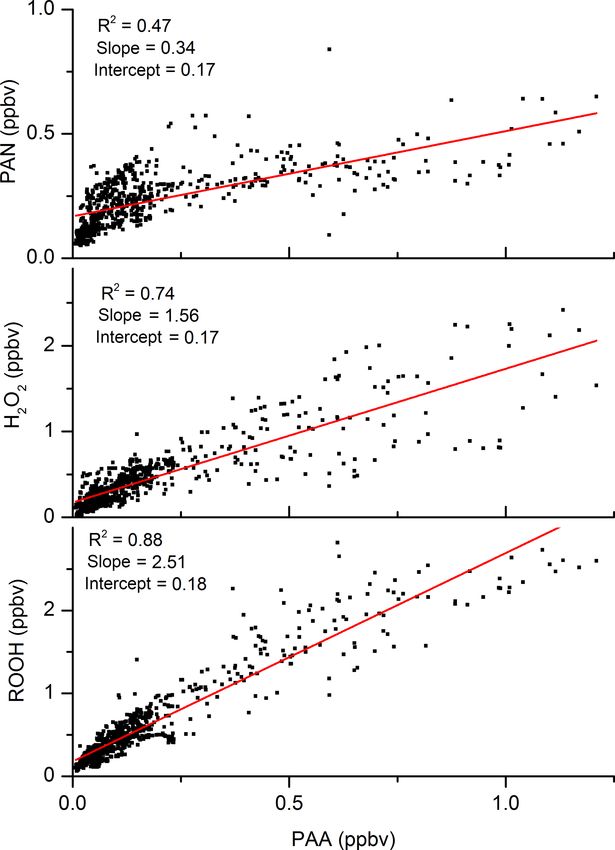
J. N. Crowley et al.: Insights into HOx and ROx chemistry in the boreal forest                                               13463

ratios of about 30 ppt.

           [PAA]            k1 (k4 [OH] + dPAA )
[HO2 ] =         · [NO2 ] ·                                (4)
           [PAN]             k2a (k−1 + dPAN )

Uncertainties of 30 %, 25 % and 15 % for the mixing ratios
of PAA, PAN and NO2 , respectively can be combined with
uncertainties of 10 %–20 % for the rate coefficients k1 , k2a
and k−1 and 50 % uncertainty for the deposition velocities for
PAA and PAN, resulting in an overall uncertainty in [HO2 ]
of close to 75 %.
   Whether PAN and PAA acquire steady state (equivalence
of production and loss terms in Eq. 2) depends on their loss
rates. The first-order rate constant for PAN loss is given by
the thermal decomposition rate constant (k−1 ) multiplied by
                                                                 Figure 4. Lifetimes of PAN and PAA. The more regular diel cycle
the fraction of the CH3 C(O)O2 radical, which does not re-       of PAA reflects the dominance of dry deposition with only a small
form PAN, plus the term for dry deposition, dPAN , i.e.          contribution due to OH (visible as some fine structure in the midday
                                                                 loss-rate constant). PAN losses are dominated by thermal decompo-
                                                                 sition during the day and deposition at night.
−d [PAN] /dt
                                                           (5)
   [PAN]
                  k3 [NO] + k2 [HO2 ]                            dPAA is as follows:
   = k−1 ·                                   + dPAN .
             k3 [NO] + k2 [HO2 ] + k1 [NO2 ]                     −d [PAA] /dt
                                                                                                                                 (6)
                                                                    [PAA]
                                                                                  k3 [NO] + k1 [NO2 ] + k2 (1 − α) [HO2 ]
At a temperature of 298 K and at 1 bar pressure,                    = k4 [OH] ·                                           + dPAA .
                                                                                      k3 [NO] + k1 [NO2 ] + k2 [HO2 ]
k1 = 8.7 × 10⁻¹² cm3 molecule−1 s−1 , k−1 = 3.8 × 10⁻⁴ s−1
and      k2 = k3 ≈ 2 × 10⁻¹¹ cm3 molecule−1 s−1 .       Using    The second term on the right-hand side of this expression
campaign-averaged midday values of [NO2 ] = 300 pptv,            varies between about 0.9 during the day and 1.0 at night
[NO] = 60 pptv and assuming [HO2 ] = 20 pptv, we derive          when, to a first approximation, NO and HO2 are very low.
an effective PAN loss-rate constant of 7.5 × 10⁻⁵ s−1 or a       With the same conditions as given above, using a model re-
lifetime of ≈ 4 h without considering deposition. The PAN        sult for the diel variation of the OH concentration and taking
lifetime will, however, vary greatly over the diel cycle and     k4 to be 1 × 10⁻¹¹ cm3 molecule−1 s−1 , we derive an OH-
will increase substantially during colder, dark periods as the   induced PAA loss-rate constant of ≈ 1 × 10⁻⁵ s−1 or a life-
thermal dissociation slows down. In the absence of HO2 and       time greater than 10 h. Thus, both dry deposition and reaction
NO, the dominant fate of the CH3 C(O)O2 radical at night         with OH determine the lifetime of PAA, though the dry de-
is to react with NO2 to reform PAN. The lifetime of PAN          position term dominates. The differences in the diel cycles of
through the campaign was calculated using the measured           the PAA and PAN lifetimes are illustrated in Fig. 4.
NO and NO2 concentrations and temperature and a model               Use of a single, average boundary layer height and the
result for the HO2 concentration (see section on the box         same variation in exchange velocities for each day during
model below).                                                    the campaign means that the lifetime of PAA shows a very
   Time-dependent values of dPAN were derived using a            uniform behaviour, varying between ≈ 5 and 8 h. In contrast,
sinusoidal variation of the boundary layer height during         noontime PAN lifetimes are sometimes less than 3 h but in-
HUMPPA between ∼ 1400 m during the day and ∼ 200 m               crease up to 16 h at night.
at night (Ouwersloot et al., 2012), which was matched in            Bearing in mind that the long lifetimes of PAA and PAN
phase to the average diel temperature variation during the       may partially invalidate the assumption of steady state, we
campaign. Deposition of PAN was calculated with loss-rate        can insert noontime values of PAA, PAN and NO2 into ex-
constants of 2.3×10⁻⁵ s−1 at night, varying sinusoidally to a    pression (4) to derive HO2 concentrations for each day dur-
maximum value of 1.3 × 10⁻⁵ at 15:30 (see above). The life-      ing the campaign when data were available. The result is
time for PAN throughout the campaign is displayed in Fig. 4.     displayed in Fig. 5, which also compares the HO2 concen-
   Similarly, the loss rate of PAA will be controlled by its     trations thus derived with direct measurements of LIF-HO2
reaction with OH multiplied by the fraction that does not re-    (Hens et al., 2014), available for only a limited period of the
form PAA (1 − α), and its rate constant for dry deposition,      campaign.

www.atmos-chem-phys.net/18/13457/2018/                                          Atmos. Chem. Phys., 18, 13457–13479, 2018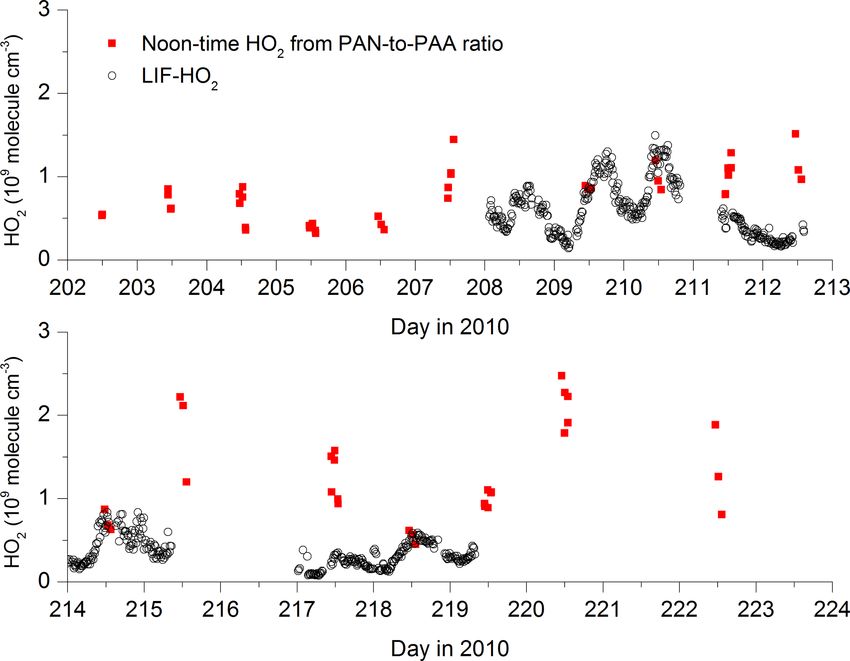
13464                                          J. N. Crowley et al.: Insights into HOx and ROx chemistry in the boreal forest

                                                                        A more detailed insight into the chemical and meteorolog-
                                                                     ical factors controlling PAA and PAN can be gained from use
                                                                     of a time-dependent photochemical box model constrained
                                                                     by some of the longer-lived trace gases that contribute cen-
                                                                     trally to local photochemical generation of radicals and thus
                                                                     PAA and PAN. This is described below.

                                                                     3.2   Box model description

                                                                     The box model was developed with the goal of simulating
                                                                     the concentration of PAA and H2 O2 over several diel cycles,
                                                                     which requires realistic diel variation in the photochemical
                                                                     production and loss rates of the CH3 C(O)O2 and HO2 rad-
                                                                     icals. A highly simplified approach was taken, in which the
Figure 5. [HO2 ] calculated via the PAN-to-PAA ratio at local noon   diel variation of HO2 and CH3 C(O)O2 radical concentrations
(red symbols) and comparison with measured HO2 (black data
                                                                     over periods of several days was constrained by measured
points) by LIF.
                                                                     (non-radical) trace gases and photolysis constants, but over-
                                                                     all radical levels were adjusted to optimise the simulation of
                                                                     PAA and H2 O2 . This may be seen as complementary to the
   The steady-state calculations result in noontime HO2 con-         modelling exercise of Hens et al. (2014), who used a highly
centrations between 5 × 10⁸ and 2.5 × 10⁹ molecule cm−3 .            detailed chemical scheme and focussed on radical production
   On most days on which PAA, PAN and LIF-HO2 data are               in a bottom-up approach in which several biogenic organic
available (209, 210, 214, 218), the agreement is reasonable,         trace gases were constrained.
exceptions being days 211 and 217. Given that the PAA- and              In all model runs, the parameters directly constrained by
PAN-derived HO2 concentrations are based on a steady-state           observations were the temperature, concentrations of O3 ,
assumption and are heavily dependent on the PAA deposition           NO, NO2 , HONO, PAN, CO, HCHO, CH3 CHO, 6terpenes
rate, the agreement may be coincidental, and the LIF-HO2             and the photolysis rate constants, J -O(1 D), J -NO2 , J -
data are likely to be an overestimate of HO2 concentrations          HONO, J -H2 O2 and J -HCHO. The model CH4 mixing ratio
if high levels of organic peroxy radicals are present (Hens et       was held constant at 1.8 ppmv. In sensitivity runs, the con-
al., 2014).                                                          centrations of trace gases that were not measured (e.g. dicar-
   A further cause of the occasional disagreement, also re-          bonyls; see below) were added to the model and their con-
lated to the long lifetimes of PAN and PAA, may be the ad-           centrations were calculated relative to those of related trace
vection of NOx from a source that is too near for the PAN-to-        gases for which correlation is expected.
PAA ratio to adapt to and which will then result in an over-            The complete reaction scheme is listed in Table S1 of the
estimation of HO2 (see Eq. 4). Below, we compare the HO2             Supplement. Rate coefficients were taken from the IUPAC
concentrations derived from Eq. (4) with those from a photo-         evaluations (IUPAC, 2018). For the box model, programmed
chemical box model and show that good agreement is found             in FACSIMILE code (Curtis and Sweetenham, 1987), several
during the warmer periods of the campaign (when daytime              different scenarios were investigated, in which sections of the
PAN lifetimes are shorter) but the disagreement can be sig-          chemistry listed in Table S1 were deactivated or modified in
nificant during the colder periods when PAN is longer lived.         order to investigate sensitivity of the model output (i.e. con-
   The HO2 mixing ratio derived via Eq. (4) is rather in-            centrations of PAA, H2 O2 , HO2 and OH) to certain reactions
sensitive to the rate coefficient for the reaction of OH with        and assumptions made, and to optimise the simulation of the
PAA, which is poorly constrained (IUPAC, 2018) or the                measured concentrations of these trace gases and radicals.
concentration of OH if it lies within the expected ranges            The box model simulated the field data at 10 min resolution.
(k4 = 2–10×10−12 cm3 molecule−1 s−1 , and [OH] = 5–20×               Due to the constraint (by measurements) of relatively long-
105 molecule cm−3 ), reflecting the dominance of dry depo-           lived trace gases such as O3 and NOx , the model reached
sition losses of PAA such that dPAA > k6 [OH]. Likewise, at          steady state in less than 1 day. The simulation was initiated
noontime, the thermal decomposition rate of PAN is too rapid         on day 196 and the output was only used from days 202 to
for the deposition term to impact the calculation of HO2             220 (for which PAA and PAN data were available). Essential
(k−1  dPAN ). The value of [HO2 ] derived is, however, sen-         features of the different model runs are listed in the section
sitive to the deposition rate of PAA chosen. An increase in          “Box model development” of the Supplementary informa-
dPAA by a factor of 2 leads to a similar increase in [HO2 ].         tion.

Atmos. Chem. Phys., 18, 13457–13479, 2018                                            www.atmos-chem-phys.net/18/13457/2018/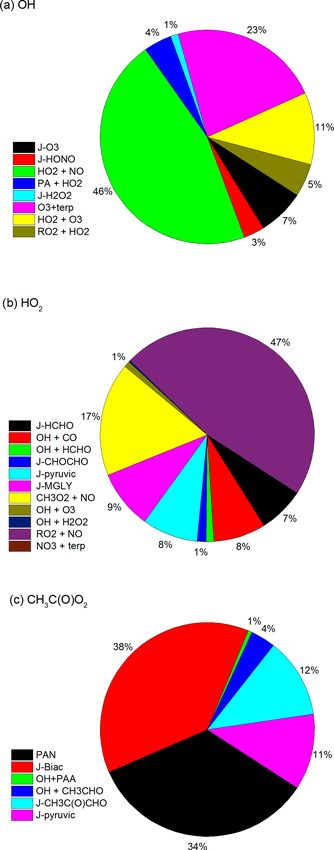
J. N. Crowley et al.: Insights into HOx and ROx chemistry in the boreal forest 13465
3.2.1 Model production and loss of HOx and ROx
OH was generated directly via O3 photolysis, whereby the
photolysis rate constant, J -O(1 D), was modified to take into
account the relative rates of quenching of the O(1 D) atom by
N2 and O2 and reaction with H2 O; i.e. it takes into account
changes in humidity throughout the campaign. OH was also
generated by photolysis of H2 O2 and HONO and via reaction
of HO2 with NO and O3 .
Loss of OH via reactions with the trace gases constrained
by measurement such as CO, H2 O2 , HCHO, O3 and NO2
represent only a small fraction of the overall OH reactiv-
ity, which is dominated by organic trace gases (Nölscher et
al., 2012). Thus, two reactions in which OH was converted
to organic peroxy radicals were used to tune the model OH
reactivity and organic radical production rates. These OH-
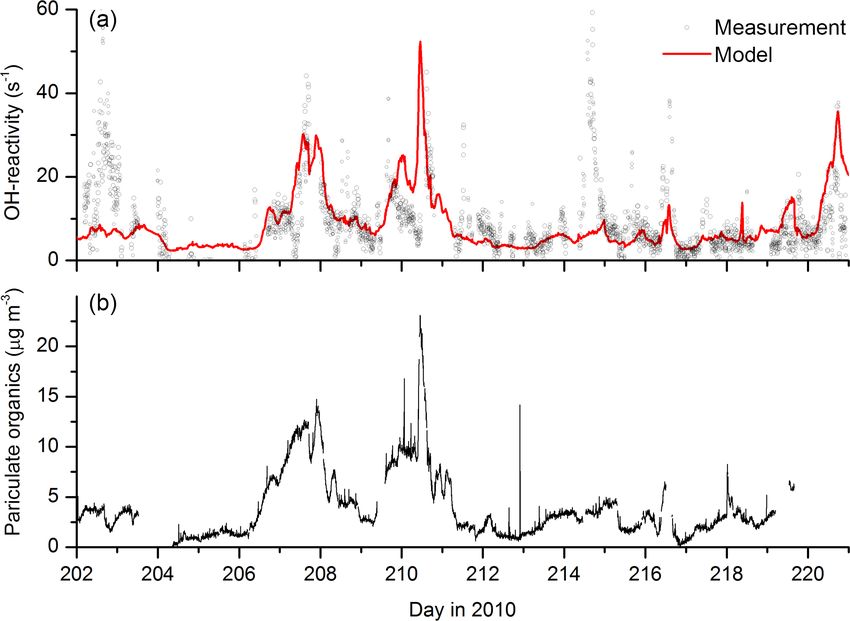
loss processes were parameterised as generic reactions of Figure 6. (a) Measured (black data points) and modelled OH re-
activity (red line). The aerosol organic content (b) shows similar
OH with biogenic trace gases and reactions with oxygenated
campaign variability to modelled OH reactivity.
volatile organic compounds (OVOCs) to form RO∗2 . In this
case RO∗2 is distinct from the sum of organic peroxy radicals,
which is usually denoted RO2 . The mixing ratios of the bio-
genic trace gases (terpenoids) was constrained by PTR-MS tivity are tied to high levels of measured OVOCs (CH3 CHO
measurements at high time resolution. The PTR-MS mixing and HCHO), which may also be correlated with organic
ratios agreed with the summed terpenoids from the GC mea- aerosol content. The most prominent exceptions are again
surements. the very high OH reactivities on day 202.6 (∼ 43 s−1 ) and
A generic rate constant of 7 × 10⁻¹¹ cm3 molecule−1 s−1 day 214.6 (∼ 70 s−1 ). No corroborative evidence for high re-
was used for the reaction of OH with terpenes. This was cal- activity on these days could be found in the extensive data
culated from the relative concentrations of the terpenes as sets available for this campaign. For example, there were no
measured by GC and weighted with their individual rate con- significant increases in any measured trace gases (biogenic or
stants for reaction with OH (Atkinson and Arey, 2003b; IU- biomass burning related), no reductions in the OH levels or
PAC, 2018). enhanced formation of products such as HCHO. Instrument
The mixing ratios of OVOCs were linked by a factor (ad- failure and subsequent tests resulted in an interruption in OH-
justed to obtain good agreement between observation and reactivity measurements shortly before the sharp increase in
model output) to measurements of CH3 CHO and HCHO. For OH reactivity on day 214 was measured. Though it is not ob-
the reaction of OVOC with OH we used a rate coefficient of vious why this should have resulted in such a large, positive
1 × 10⁻¹¹ cm3 molecule−1 s−1 . This approach is different to bias when measurements were resumed, the mismatch with
that taken by Hens et al. (2014), who tied missing OH re- other data, proximity to the power-down and exponential de-
activity to an unknown trace gas that behaved like α-Pinene cay in the reactivity suggest that the instrument was not fully
but at concentrations that were a factor of 5–10 higher than operational in this period.
measured. Tying missing OH reactivity to α-Pinene could, RO∗2 reacted in the model with NO to form HO2 (generic
however, not simulate the high OH reactivities during the rate coefficient of 1 × 10⁻¹¹ cm3 molecule−1 s−1 ) and with
biomass-burning-impacted periods of the campaign. HO2 to form peroxides (ROOH, with generic rate coeffi-
The modelled OH reactivity varied between 3 and 50 s−1 , cient of 0.8×10⁻¹¹ cm3 molecule−1 s−1 ) and regenerate OH
the highest values being associated with the biomass- at 0.2 × 10⁻¹¹ cm3 molecule−1 s−1 . As the chemical identity
burning-impacted days as observed. A comparison between of the OVOCs is unknown, a more explicit description of the
modelled and measured OH reactivity reveals broad agree- chemistry was not warranted.
ment (Fig. 6) with several high-reactivity events captured by HO2 was generated directly via photolysis of HCHO and
the model. The main exceptions are the events on day 202.5 from reactions of OH with O3 , CO, HCHO and H2 O2 , and
(OH reactivity up to 43 s−1 ) and day 215 (peak OH reactivity the reaction of NO with CH3 O2 and other peroxy radicals.
of 70 s−1 ). Figure 6 also plots the time series of the organic The most important HO2 reactions in the model are its self-
content of aerosol, which varies in a similar manner to the reaction to form H2 O2 , and reaction with NO and O3 to form
modelled OH reactivity. This is expected, as increased OH OH. It also reacts with the CH3 C(O)O2 radical (forming PAA
reactivity should lead to larger rates of generation of con- and acetic acid and recycling OH). The uptake of HO2 to
densable OVOCs and thus SOA mass. On the other hand, it aerosol has been reported to be important for the HOx budget
will also reflect that in the model the high values of OH reac- under some conditions (Jacob, 2000; Liang et al., 2013). The
www.atmos-chem-phys.net/18/13457/2018/ Atmos. Chem. Phys., 18, 13457–13479, 2018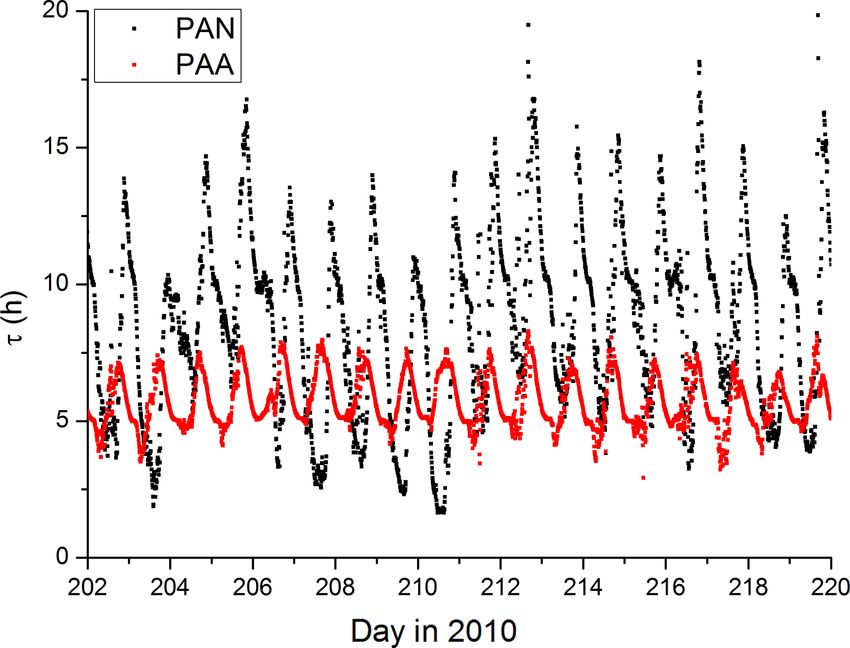
13466                                         J. N. Crowley et al.: Insights into HOx and ROx chemistry in the boreal forest

present IUPAC evaluation (Ammann et al., 2013; IUPAC,               neous reaction of H2 O2 with aerosol particles can be cal-
2018) for the heterogeneous interaction of HO2 with aque-           culated from expression (2) using c ≈ 44 000 cm s−1 , A =
ous aerosol has a dependence on the HO2 concentration as            2 × 10⁻⁶ cm2 cm−3 and γ = 3 × 10⁻⁴ (Wu et al., 2015), re-
well as the aerosol pH, which is based on the formulation of        sulting in khet = 7×10⁻⁶ s−1 . As concluded for PAA, loss of
Thornton et al. (2008). For average HUMPPA-COPEC con-               gas-phase H2 O2 via uptake to aerosol is insignificant com-
ditions a value for the uptake coefficient (γ ) between 10−3        pared to dry deposition.
and 10−4 is estimated. In combination with Eq. (2), and for
HO2 = 5 × 10⁸ molecule cm−3 (≈ 20 pptv), this results in a          3.2.3    Dry deposition
loss rate for HO2 of ≈ 1 × 10⁴ − 1 × 10⁵ molecule cm−3 s−1 ,
which is insignificant compared to HO2 loss rates via its self-
                                                                    Depositional loss of PAA and H2 O2 was simulated in the
reaction (1.5×10⁶ molecule cm−3 s−1 ) and reaction with NO
                                                                    model using time-dependent first-order loss-rate constants
(1.2 × 10⁷ molecule cm−3 s−1 with NO = 100 pptv) close to
                                                                    that were derived assuming a sinusoidal variation of the
midday. Heterogeneous losses of HO2 were therefore not in-
                                                                    boundary layer height during HUMPPA between ∼ 1400 m
cluded in the model.
                                                                    during the day and ∼ 200 m at night (Ouwersloot et al.,
   The rate of CH3 C(O)O2 formation in the model is deter-
                                                                    2012), which was matched in phase to the average, diel
mined by the rate of oxidation or photolysis of its organic
                                                                    temperature during the campaign. Deposition rate constants
precursors, including the oxidation of CH3 CHO via reaction
                                                                    were calculated from deposition velocities from the litera-
with OH:
                                                                    ture scaled to the observed loss rate of PAA and H2 O2 at
OH + CH3 CHO + O2 → CH3 C(O)O2 + H2 O.                      (R5)    night (see Sect. 3). For H2 O2 , the data from Hall and Clai-
                                                                    born (1997) were used. Their values are chosen as they are
   As we describe later, this reaction alone was not sufficient     expected to be most relevant for the boreal tree type and
to describe the formation of PAA at the levels observed and         forested environment but are still in broad agreement with
the model was augmented with other CH3 C(O)O2 sources               other data sets for H2 O2 deposition (Stickler et al., 2007).
such as the degradation of photolabile carbonyl species. Ty-        Following Nguyen et al. (2015), the daytime deposition of
ing CH3 C(O)O2 production rates to the levels of oxidised           PAA was modelled to be 50 % of H2 O2 , with the same vari-
VOCs as measured by the PTRMS was found to be es-                   ation over the diel cycle. The diel cycle of the deposition
pecially important during biomass-burning-influenced pe-            velocities for PAA and H2 O2 are displayed in Fig. S2.
riods in which VOCs (e.g. propane, butane) and OVOCs
(e.g. CH3 CHO, CH3 C(O)OH, CH3 OH) were also greatly en-
                                                                    3.3     Box model results
hanced.
   Finally, in order to test potential radical sources leading to
enhanced HOx concentrations at night-time, formation and            The constrained model, with the photochemical sources of
reactions of the NO3 radical were implemented in a simpli-          radicals described in Sect. 3.2.1, significantly underestimated
fied manner (see Table S1) as was the formation of OH via           the observations of H2 O2 and PAA, especially during the
ozonolysis of alkenes.                                              biomass-burning episodes. Addition of an extra source of
                                                                    CH3 C(O)O2 in the reaction of OH with OVOC (at 30 %
3.2.2   Model production of H2 O2 and PAA                           branching ratio) was found to not help as even small in-
                                                                    creases (less than a factor of 2) in the modelled concentra-
PAN, PAA and H2 O2 are NOx dependent, stable products of            tion of PAA could only be achieved at the cost of reducing
HOx , ROx and NOx interactions. The goal of the modelling           the OH, HO2 and thus H2 O2 concentrations significantly be-
study is to examine whether their measurement can provide           low the measurements. This is readily understood as PAA is
insight into the HOx budget in the boreal environment by            an effective sink of HOx for this low NOx environment.
adapting a reaction scheme to match the observed mixing ra-            The PAA production rate was therefore enhanced by in-
tio of H2 O2 and PAA over chemically different periods of           troducing a CH3 C(O)O2 production term that does not re-
the campaign. H2 O2 was generated in the model via the HO2          quire initiation by reaction with OH, i.e. photolysis of a
self-reaction, the rate constant of which displays a complex        precursor trace gas, which results in CH3 CO release. Ace-
dependence on temperature, pressure and humidity (IUPAC,            tone (CH3 C(O)CH3 ) was present at mixing ratios of up to
2018). The rate coefficient during the campaign varied be-          10 ppbv during the periods impacted by biomass burning,
tween 4.3 and 7.2 × 10⁻¹² cm3 molecule−1 s−1 . We also in-          yet its slow photolysis (lifetime of months) means that it
clude H2 O2 formation from the ozonolysis of terpenes.              is not a significant source of CH3 C(O)O2 in the bound-
   Model PAA was generated only in the reaction between             ary layer. In contrast, dicarbonyls such as methylglyoxal
HO2 and CH3 C(O)O2 radicals described above. PAA and                (CH3 C(O)CHO), pyruvic acid (CH3 C(O)C(O)OH) or bi-
H2 O2 may be lost via photolysis, reaction with OH, dry de-         acetyl (CH3 C(O)C(O)CH3 ) have absorption spectra that ex-
position and uptake to aerosol. As described in Sect. 3.1           tend beyond 400 nm, are rapidly photolysed and may repre-
for PAA the first-order loss-rate constant for heteroge-            sent an efficient source of CH3 C(O)O2 and HO2 if present at

Atmos. Chem. Phys., 18, 13457–13479, 2018                                           www.atmos-chem-phys.net/18/13457/2018/
J. N. Crowley et al.: Insights into HOx and ROx chemistry in the boreal forest 13467
sufficient concentrations. alkenes, acetylene and aromatics (Calvert et al., 2000; Volka-
mer et al., 2001; Calvert et al., 2002) and which is present in
CH3 C(O)CHO + hν(O2 ) → CH3 C(O)O2 + HO2 + CO (R6) biomass burning (Fu et al., 2008) is glyoxal (HC(O)C(O)H).
CH3 C(O)C(O)CH3 + hν(O2 ) → 2CH3 C(O)O2 (R7) It is also formed at high yield (via glycol aldehyde) in the
CH3 C(O)C(O)OH + hν(O2 ) → CH3 C(O)O2 + HO2 (R8) OH oxidation of methyl butenol (Atkinson and Arey, 2003a),
+ CO2 emitted by pine trees and is therefore of relevance for the
HUMPPA-COPEC campaign. The photolysis of glyoxal is
Addition of short-lived hydrocarbons including methyl- efficient (lifetimes at noon of ∼ 4 h) and results in formation
glyoxal has been found to increase CH3 C(O)O2 radical pro- of two HO2 radicals:
duction rates in models of biomass-burning plumes (Fischer
HC(O)CHO + hν(O2 ) → 2HO2 + 2CO. (R9)
et al., 2014) and to dramatically increase PAN production
rates in a global model (Ito et al., 2007). In the absence of direct measurements, indications of the
Methylglyoxal is formed at high yield from the OH- presence of biacetyl and methylglyoxal were sought in the
initiated oxidation of several biogenic (especially isoprene) PTR-MS data set. Strong increases in mixing ratio at m/z =
and anthropogenic VOCs, e.g. via degradation of aromatic 73 and m/z = 87 were observed, which would correspond to
hydrocarbons (Arey et al., 2009; Obermeyer et al., 2009) and protonated methylglyoxal and biacetyl, respectively. Indeed,
is found in biomass-burning-impacted air masses (Fu et al., most monitored PTR-MS masses displayed similar trends,
2008; Akagi et al., 2011; Stockwell et al., 2015) and those in- with strong increases during the biomass-burning-impacted
fluenced by urban emissions of aromatics (Liu et al., 2010). periods. Campaign time series for selected masses are shown
It is also formed at yields of several percent from the ozonol- in the Supplement (Fig. S1).
ysis of monoterpenes such as α-Pinene and 13 -carene (Yu For m/z = 73, a peak mixing ratio of ≈ 0.8 ppbv was ob-
et al., 1998; Fick et al., 2003), which were both present at served during the first biomass-burning event (days 206–
high concentrations during HUMPPA-COPEC-2010. Model 212). At the same time a peak value of 0.5 ppbv was reported
estimates of PAN formation suggest that, on a global scale, for mass 87. The PTRMS signal at mass 73 is usually con-
30 % of the acetyl peroxy radical generation is the result of sidered to be methyl ethyl ketone (de Gouw and Warneke,
methylglyoxal degradation, with 44 % arising via CH3 CHO 2007; Blake et al., 2009; Yáñez-Serrano et al., 2016), a prod-
oxidation by OH (Fischer et al., 2014). uct of butane degradation. N-butane was enhanced during the
Biacetyl is formed in the photo-oxidation of aromatic hy- biomass-burning periods and correlated with m/z = 73, so
drocarbons in the presence of NOx (Atkinson et al., 1980; that a significant (or dominant) contribution of methyl ethyl
Arey et al., 2009; Obermeyer et al., 2009) and is also ex- ketone to this mass is probable.
pected to be present in biomass-burning-impacted air masses. The PTRMS mass 87 (peaking at mixing ratios of 0.5 ppb
The proposed intermediacy of dicarbonyls such as methyl- during the biomass-burning-impacted periods) is usually as-
glyoxal and biacetyl in forming PAA in this study is consis- signed to 2-methyl-3-buten-2-ol (MBO) which is emitted
tent with the dominant role for di- and trialkyl benzenes in from coniferous trees (Schade et al., 2000) but may have con-
PAA formation found by Zhang et al. (2010). Pyruvic acid tribution from several trace gases including C5-carbonyls,
is formed in the gas-phase degradation of biogenic and an- butadione and methacrylic acid (de Gouw and Warneke,
thropogenic hydrocarbons and has been observed at mixing 2007; Blake et al., 2009; Müller et al., 2016). We are not
ratios of hundreds of pptv (Andreae et al., 1987; Jacob and aware that biacetyl has been reported at this mass.
Wofsy, 1988; Talbot et al., 1995; Veres et al., 2011). As a pre- Previous measurements of methylglyoxal and glyoxal in
cursor in the biosynthesis of terpenoids, pyruvic acid can be rural locations have revealed mixing ratios up to a few hun-
directly emitted by vegetation resulting in very large mixing dred pptv (see Fu, 2008 for a summary) which were corre-
ratios (several ppbv) in a non-oxidative environment (Jardine lated with those of HCHO (Lee et al., 1995) or CO (Spauld-
et al., 2010). It is also found in secondary organic aerosol and ing et al., 2003) and which had mixed biogenic and anthro-
may be formed in the aqueous-phase reaction of methylgly- pogenic sources. Greatly elevated concentrations of methyl-
oxal (Tan et al., 2012). In a recent campaign (Liebmann et glyoxal (> 900 pptv) and glyoxal (> 500 pptv) have been ob-
al., 2018) at the Hyytiälä site, our iodide CIMS instrument served in biomass-burning-impacted air masses in a rural en-
monitored large signals at m/z = 87, which we assigned to vironment (Kawamura et al., 2013). Even at levels below
the CH3 C(O)CO− 2 ion from pyruvic acid. Post-campaign cal- 100 pptv, methylglyoxal was found to contribute significantly
ibration of the CIMS resulted in mixing ratios of several hun- to CH3 C(O)O2 radical production (Lee et al., 1995). We note
dred pptv, which were correlated with other biogenic trace that the PTR-MS is insensitive to glyoxal due to instability of
gases. We thus have direct evidence of pyruvic acid at this the protonated parent ion at m/z = 59 (Stoenner et al., 2017),
site, albeit in the autumn (when emissions are likely to be which is dominated by acetone.
weaker) rather than in the summer. The potential impact of dicarbonyls on the HOx and
A further, short-lived dicarbonyl that is formed in the CH3 C(O)O2 budget was investigated by incorporating
OH and O3 -initiated degradation of several VOCs including methylglyoxal, biacetyl, glyoxal and pyruvic acid into the
www.atmos-chem-phys.net/18/13457/2018/ Atmos. Chem. Phys., 18, 13457–13479, 201813468 J. N. Crowley et al.: Insights into HOx and ROx chemistry in the boreal forest model with the concentrations of the first three dicarbonyls noontime maximum values. This contrasts with the conclu- constrained by a correlation factor with CH3 CHO. Mixing sions of Hens et al. (2014), who also modelled the reaction of ratios of pyruvic acid at this site (in autumn) have been found ozone with biogenics (but using speciated terpenes from GC to be correlated with (and at similar concentration to) those measurements) and were unable to generate and sustain suf- of directly emitted biogenics and its concentration was arbi- ficient OH at night-time to match the observations. Although trarily set equal to that of the summed terpenes. the difference may be partially related to our use of PTRMS- The ratios of CH3 CHO to methylglyoxal, biacetyl and measured terpenes and an average yield of OH based on the glyoxal were varied to optimise the simulation of the mea- latest recommendations for individual terpenes, the main ef- sured PAA and H2 O2 mixing ratios and resulted in maxi- fect is the night-time recycling of HO2 and OH via reactions mum concentrations of methylglyoxal, glyoxal and biacetyl of peroxy radicals formed from OH generated in ozonolysis in the model of approximately 0.75, 0.15 and 1.3 ppbv, reactions. Given the high OH reactivities measured during respectively, which were present during the peak of the the HUMPPA-COPEC-2010 campaign, the fate of most OH biomass-burning-impacted episodes (when CH3 CHO levels radicals formed at night-time will be reaction with terpenes were largest). The relative mixing ratios of dicarbonyls is and other VOCs to form RO∗2 . At night-time, in the absence not important for the model result; i.e. a reduction in the of NO, the main fates of peroxy radicals are reaction with methylglyoxal mixing ratio would result in a decrease in both HO2 and self-reaction. In the model, the reaction of RO∗2 with CH3 C(O)O2 and HO2 radical production, which could be HO2 forms ROOH (80 %) with a minor (20 %) reaction path- balanced by an increase in pyruvic acid (with also gener- way forming OH as observed in laboratory studies (at yields ates one of each radical) or by an increase in both biacetyl of 10 %–60 %) for several substituted oxidised organic per- and glyoxal, scaled by the relative J values. Based on pre- oxy radicals (Dillon and Crowley, 2008; Jenkin et al., 2010; ferred experimental absorption spectra and quantum yields Groß et al., 2014). (IUPAC, 2018), the photolysis rates of pyruvic acid, gly- The self-reaction of RO∗2 is modelled to form HO2 (via the oxal, methylglyoxal and biacetyl were modelled as factors degradation of the alkoxy radicals formed in the first step) so (J -dicarbonyl/J -NO2 ) of 0.033, 0.0076, 0.019 and 0.033. that non-zero concentrations of HO2 and RO∗2 are predicted We note that large differences in experimental results (see to be present at night. The modelled HO2 and RO∗2 concentra- IUPAC, 2018 for a summary) and in the preferred values of tions are displayed in Fig. 9a. The initially surprising result is evaluation panels (Burkholder et al., 2015; IUPAC, 2018) in- that RO∗2 radicals are present at night at concentrations that dicate that the J values of the dicarbonyls are associated with are comparable to, or even exceed, those predicted for the significant uncertainties. For biacetyl, the factor used, 0.033, daytime. This reflects the weak sinks of RO∗2 at night-time is consistent with observations in an environmental cham- (owing to the absence of NO), rather than high rates of pro- ber (Klotz et al., 2001) where a value of J -dicarbonyl/J - duction. The diel cycles of RO∗2 (Fig. 9d) and HO2 (Fig. 9c) NO2 = 0.036 was reported. are very different. Whereas the HO2 concentration is defined The incorporation of dicarbonyls into the model has the by its photochemical production, with a maximum coincid- anticipated effect of increasing acetylperoxy and HO2 pro- ing with the maximum of the actinic flux and low concen- duction rates and thus levels of PAA, especially during trations at night, that of RO∗2 shows two distinct, broad max- the biomass-burning-impacted periods. As seen in Fig. 7, ima, one at noon and one at midnight, both at concentrations the model does a reasonable job of reproducing both PAA of ≈ 5×10⁸ molecule cm−3 (≈ 20 pptv). The modelled RO∗2 - and H2 O2 . Especially encouraging is the good model– to-HO2 ratio is ≈ 1 at 12:00 UTC, increasing to ≈ 5 at mid- measurement agreement in the period between days 204 and night. This is consistent with the box model result of Hens et 209, in which PAA levels increased by an order of magnitude al. (2014), who report RO2 -to-HO2 ratios of between 0.5 and and which were accompanied by large increases in H2 O2 4.5. and the generally good agreement with OH measurements. RO∗2 production at night occurs via OH (formed via The measurement–model agreement is further exemplified in ozonolysis of alkenes and reaction of O3 with HO2 ) with Fig. 8, which plots the diel profiles of PAA and H2 O2 and OVOC and terpenes, the weak sinks enabling it to build up OH and the comparison with the model output for the same in concentration. The modelled, rapid depletion of RO∗2 at time period. Considering that we use a diel cycle for the de- sunrise is a result of increasing NO concentrations, which position term that is unchanged for the whole campaign (i.e. is followed by a second maximum in the RO∗2 concentration does not vary with relative humidity, wind speed, rates of at noon, resulting from photochemical generation of OH. Or- turbulent mixing, etc.) and thus does not reflect any variation ganic radicals have previously been observed at night-time in in the meteorological situation at the site, the agreement for several locations and are often attributed to the O3 -initiated H2 O2 and PAA is very good. Within the observed variability oxidation of organics (Hu and Stedman, 1995; Cantrell et al., and considering the experimental uncertainty in the measure- 1997; Reiner et al., 1997; Salisbury et al., 2001; Geyer et ments, the model captures the average variation of each trace al., 2003; Emmerson and Carslaw, 2009; Sommariva et al., gas across the diel cycle. It is also noteworthy that the model 2011; Andrés-Hernández et al., 2013). Night-time concentra- captures the non-zero OH levels at night-time as well as the tions of ROx (HO2 + RO2 in molecule cm−3 ) of 5–7 × 10⁸ Atmos. Chem. Phys., 18, 13457–13479, 2018 www.atmos-chem-phys.net/18/13457/2018/
You can also read