Spatially resolved infrared radiofluorescence: single-grain K-feldspar dating using CCD imaging - Geochronology
←
→
Page content transcription
If your browser does not render page correctly, please read the page content below
Geochronology, 3, 299–319, 2021
https://doi.org/10.5194/gchron-3-299-2021
© Author(s) 2021. This work is distributed under
the Creative Commons Attribution 4.0 License.

Spatially resolved infrared radiofluorescence: single-grain
K-feldspar dating using CCD imaging
Dirk Mittelstraß1, and Sebastian Kreutzer2,3,
1 independentresearcher: Berthelsdorfer Str. 13, 09599 Freiberg, Germany
2 Geography & Earth Sciences, Aberystwyth University, Aberystwyth, Wales, United Kingdom
3 IRAMAT-CRP2A, UMR 5060, CNRS-Université Bordeaux Montaigne, Pessac, France
 These authors contributed equally to this work.

Correspondence: Dirk Mittelstraß (dirk.mittelstrass@luminescence.de) and Sebastian Kreutzer
(sebastian.kreutzer@aber.ac.uk)

Received: 31 December 2020 – Discussion started: 28 January 2021
Revised: 29 March 2021 – Accepted: 1 April 2021 – Published: 21 May 2021

Abstract. The success of luminescence dating as a chrono-          ments also revealed an unstable signal background due to our
logical tool in Quaternary science builds upon innova-             cameras’ degenerated cooling system. Besides this technical
tive methodological approaches, providing new insights into        issue specific to the system we used, SR IR-RF is ready for
past landscapes. Infrared radiofluorescence (IR-RF) on K-          application. Our contribution provides guidance and software
feldspar is such an innovative method that was already in-         tools for methodological and applied luminescence (dating)
troduced two decades ago. IR-RF promises considerable ex-          studies on single-grain feldspars using radiofluorescence.
tended temporal range and a simple measurement protocol,
with more dating applications being published recently. To
date, all applications have used multi-grain measurements.
Herein, we take the next step by enabling IR-RF measure-
                                                                   1   Introduction
ments on a single grain level. Our contribution introduces
spatially resolved infrared radiofluorescence (SR IR-RF) on
                                                                   During the last two decades of advances in luminescence-
K-feldspars and intends to make SR IR-RF broadly acces-
                                                                   based chronologies, two promising developments stand out
sible as a geochronological tool. In the first part of the ar-
                                                                   but somehow never took off: (1) spatially resolved (SR) de-
ticle, we detail equipment, CCD camera settings and soft-
                                                                   tection of optical and thermoluminescence signals and (2) in-
ware needed to perform and analyse SR IR-RF measure-
                                                                   frared radiofluorescence (IR-RF) of potassium feldspar (K-
ments. We use a newly developed ImageJ macro to process
                                                                   feldspar). Our perception is that the most significant obsta-
the image data, identify IR-RF emitting grains and obtain
                                                                   cles in both approaches lie in imperfections of the available
single-grain IR-RF signal curves. For subsequent analysis,
                                                                   instrumentation and the complexity of the data analysis.
we apply the statistical programming environment R and the
                                                                      Although aware of this, we draw upon both developments,
package Luminescence. In the second part of the article,
                                                                   SR and IR-RF, and present a new approach: spatially re-
we test SR IR-RF on two K-feldspar samples. One sample
                                                                   solved infrared radiofluorescence (henceforth: SR IR-RF) for
was irradiated artificially; the other sample received a natu-
                                                                   measuring K-feldspar on a single grain level. This article has
ral dose. The artificially irradiated sample renders results in-
                                                                   two parts. After a brief literature review, the first part will
distinguishable from conventional IR-RF measurements with
                                                                   outline the technical aspects and the data analysis methods.
the photomultiplier tube. The natural sample seems to over-
                                                                   The second part will test and apply the developed approach.
estimate the expected dose by ca. 50 % on average. However,
                                                                      As it concerns our article’s technical part, we attempt to
it also shows a lower dose component, resulting in ages con-
                                                                   summarise our work on SR IR-RF of K-feldspar carried out
sistent with the same sample’s quartz fraction. Our experi-
                                                                   since 2015. We will present a detailed workflow, a new soft-

Published by Copernicus Publications on behalf of the European Geosciences Union.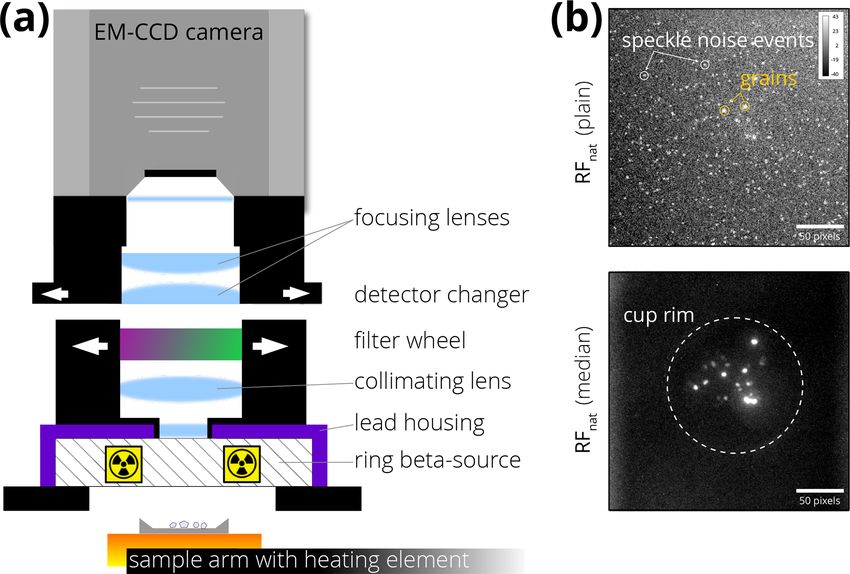
300                                                D. Mittelstraß and S. Kreutzer: Spatially resolved infrared radiofluorescence

ware toolchain, guidelines and technical suggestions like the        1.2   The brief history of spatially resolved IR-RF dating
parameterisation of the used EM-CCD camera.
                                                                     IR-RF dating applies ionising radiation to stimulate a fluores-
   In the application part of our article, we will present a first
                                                                     cence signal in K-feldspar at a wavelength of around 865 nm
test of the hypothesis of whether SR IR-RF allows decipher-
                                                                     (Trautmann et al., 1999). This IR-RF signal decays with the
ing single feldspar grains’ bleaching history. We used a sam-
                                                                     accumulation of dose and resets through optical bleaching
ple from the Médoc area (south-western France) previously
                                                                     (e.g. a few hours to days of sunlight exposure). Determin-
dated using non-spatially resolved IR-RF for this test.
                                                                     ing ages up to ca. 600 ka is reported in the literature (Wagner
                                                                     et al., 2010).
1.1   Spatially resolved luminescence dating                            The early development of conventional non-spatially re-
Conventional luminescence readers rely on photomultiplier            solved IR-RF as dating technique was an effort of the group
tubes (PMTs) to detect luminescence emissions (e.g. Bor-             led by Matthias Krbetschek at the TU Freiberg (Germany)
tolot, 2000; Bøtter-Jensen et al., 2000; Richter et al., 2015;       (Trautmann et al., 1998, 1999; Krbetschek et al., 2000; Er-
Maraba and Bulur, 2017). However, equivalent dose (De )              furt and Krbetschek, 2003b). Their work cumulated in the
distributions deduced from multiple-grain aliquots tend to           infrared radiofluorescence single aliquot regenerative-dose
scatter more than individual analytical uncertainties can ex-        (IRSAR) protocol (Erfurt and Krbetschek, 2003a). Although
plain (for a brief overview on various reasons, see Fitzsim-         the IRSAR protocol is straightforward and promises ex-
mons, 2019), and a PMT does not allow distinguishing si-             tended temporal range, its invention had limited impact on
multaneously emitted signals from individual grains.                 the dating practice in Quaternary science (see Murari et al.,
   Single-grain systems, such as employed by Bøtter-Jensen           2021, for a detailed review).
et al. (2003), use a laser to optically stimulate luminescence          One particular issue is the low bleachability of the IR-
(OSL, Huntley et al., 1985) single grains sequentially. Hence,       RF signal (at least 2 h of natural sunlight, Trautmann et al.,
luminescence is collected grain-wise. However, such a sys-           1999), which potentially provokes partial bleaching effects.
tem does not suite when (1) the stimulation (heating, irra-          Other issues are potential inhomogeneities in the mineral
diation) can only be applied simultaneously to all grains,           composition and micro-dosimetry of the sample (Trautmann
or (2) spatial mapping of the sample is desired (e.g. Duller         et al., 2000).
and Roberts, 2018). For these reasons, luminescence imag-               Seeking a technical solution, Krbetschek and Degering
ing systems have been subject of research since, at least,           (2005)1 conducted first spatially resolved (SR) IR-RF mea-
the 1980s (cf. Huntley and Kirkley, 1985). In the 1990s,             surements on feldspars. In their experiment, the sample was
charged coupled device (CCD) cameras became affordable               irradiated from below with a 90 Sr /90 Y β source. The RF sig-
and gained attraction for luminescence detection due to their        nal was collected by a 45◦ mirror and a custom-made imag-
high quantum efficiency in conjunction with a relatively sim-        ing optic, with the signal detected through an electron mul-
ple technical implementation into existing systems. A vari-          tiplying (EM) CCD camera. Images were analysed using the
ety of experimental and commercial image systems based on            software AgesGalore (Greilich et al., 2006).
CCD cameras were developed (Duller et al., 1997; Spooner,               When Matthias Krbetschek joined Freiberg Instruments
2000; Greilich et al., 2002; Baril, 2004; Clark-Balzan and           GmbH, the capability of performing SR IR-RF measure-
Schwenninger, 2012; Chauhan et al., 2014; Greilich et al.,           ments became part of the design of the commercial avail-
2015; Kook et al., 2015; Duller et al., 2020). However, the          able lexsyg research reader (Richter et al., 2013). Contrary
number of publications making use of those systems in the            to the original design by Krbetschek and Degering (2005), in
context of actual dating appears to be surprisingly small (e.g.      this system, the 90 Sr /90 Y source is placed above the sample
Greilich et al., 2005; Rhodius et al., 2015; Duller et al.,          position. A circular opening in the middle of the source mod-
2015).                                                               ule enables luminescence detection (Richter et al., 2012). A
   Reasons for this lag of attention might be found in               sketch of this lexsyg research RF imaging module is shown
the technical complexity of luminescence imaging systems,            in Fig. 1. With the early death of M. Krbetschek in 2012, the
combined with significant issues such as image noise or              progression in the SR IR-RF technique’s development came
signal cross-talk (Gribenski et al., 2015; Cunningham and            to a temporary halt.
Clark-Balzan, 2017). Thus, luminescence imaging methods
appear challenging to apply, and the efforts necessary to anal-
yse the measurements might be considered disproportional to
the scientific gain. To prevent spatially resolved IR-RF from
failing for the same reasons, we intend to provide our soft-
ware and methods as accessible, transparent and automated
as possible.                                                            1 These results were never formally published. However, we are
                                                                     happy to share their presentation on the 11th International LED con-
                                                                     ference (2005, Cologne, Germany) upon request.

Geochronology, 3, 299–319, 2021                                                       https://doi.org/10.5194/gchron-3-299-2021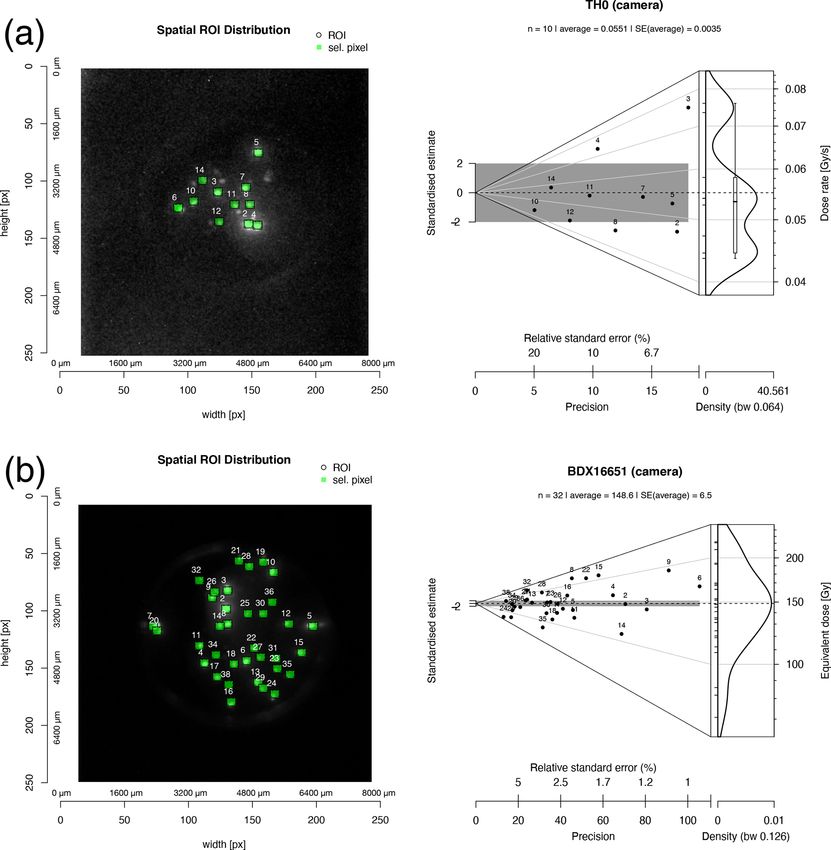
D. Mittelstraß and S. Kreutzer: Spatially resolved infrared radiofluorescence                                                         301

Figure 1. (a) Technical sketch of the camera system for spatially resolved IR-RF measurements at the lexsyg research reader L2 in Bordeaux.
The collimating lens position and the camera’s height were adjusted manually to obtain the best IR-RF image quality. (b) Typical image
output of a natural IR-RF image stack. The upper picture shows an unprocessed but background-corrected SR IR-RF image taken with high
SNR setting (see Table 2). Two speckle noise events caused by bremsstrahlung (white) and two grain IR-RF signals (yellow) are marked.
Individual grain signals are hardly distinguishable from the image noise. The lower image shows the processed image stack’s median image,
where light from individual grains is visible. The dashed white line marks the rim of the sample carrier (here a stainless-steel cup).

2     Part I: enabling spatially resolved                               centred at ca. 865 nm the QE is around 60 %. For the IR-RF
      radiofluorescence                                                 measurements, we placed a Chroma D850/40x interference
                                                                        filter between β source and EMCCD camera. The custom-
In the following section, we outline technical aspects of rel-          made optic has a numerical aperture (NA) of about 0.2 and
evance for successful SR IR-RF measurements. Although                   a lateral magnification of 0.6, leading to an image resolu-
we were bounded to tailor some settings to a particular sys-            tion of 27 µm per pixel. Prior to our experiments, we ad-
tem, the overall parameterisation and the developed work-               justed the optical focus by manually calibrating the camera’s
flow is fairly system independent. More detailed information            installation height until we obtained the best image quality
is available in the Appendix and the referenced resources.              in terms of sharpness and minimised distortion. The nearby
                                                                        90 Sr /90 Y β source shielding emits secondary X-ray photons

                                                                        (bremsstrahlung, cf. Liritzis and Galloway, 1990), which in-
2.1    Equipment                                                        duce localised high signal events at the CCD chip upon im-
All measurements presented in this article were performed               pact. The result is images speckled with bright spots (see
on a single Freiberg Instruments lexsyg research reader                 Fig. 1b). We will refer to this effect as “speckle noise”. It has
(Richter et al., 2013) at the IRAMAT-CRP2A in Bordeaux                  to be noted that naturally occurring cosmic rays also cause
(reader name L2). The system is equipped with a ring-shape              similar bright spots. However, we approximated that cosmic
type 90 Sr /90 Y β source (Richter et al., 2012) delivering             rays are responsible for less than 1 % of the spots.
ca. 3.5 Gy min−1 to K-feldspar grains with a size of 125–                   The system was equipped with a solar light simulator
250 µm (cf. Frouin et al., 2017).                                       (SLS) system facilitating LEDs with broad peaks centred at
   For luminescence detection, we used a Princeton Instru-              365, 462, 523, 590, 625 and 850 nm (Richter et al., 2013).
ments ProEM: 512B+ eXcelon EMCCD camera with a 512×                     The system is the same as used for the experiments by Frouin
512 pixel unichromatic back-illuminated CCD sensor. The                 et al. (2015) and Frouin et al. (2017).
camera sits on an automated detector changer, which allows                  However, over the years, the system received a couple of
also for spatially resolved thermal luminescence (TL) and               hardware upgrades tackling various problems (cf. Kreutzer
OSL measurements (cf. Richter et al., 2013; Greilich et al.,            et al., 2017). In 2018, an improved drive train for the sam-
2015). The camera has a quantum efficiency (QE) of >80 %                ple arm, modernised control hardware and a new 100 W
between 450 and 750 nm. At the K-feldspar IR-RF emission                at 48 V Si3 N4 heater controlled by a PT1000 thermocou-

https://doi.org/10.5194/gchron-3-299-2021                                                          Geochronology, 3, 299–319, 2021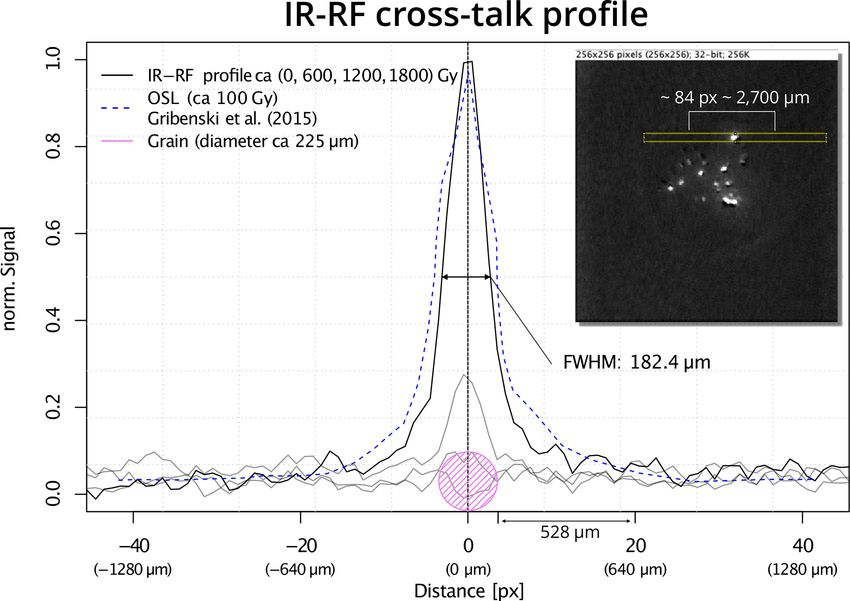
302                                             D. Mittelstraß and S. Kreutzer: Spatially resolved infrared radiofluorescence

ple were installed (personal communication, Freiberg Instru-      sion: 2.0.0-rc-69) for most of our analyses. A cross-platform
ments GmbH, 2019).                                                version of ImageJ and the SR-RF macro and all neces-
                                                                  sary plug-ins pre-installed can be downloaded from https:
2.2     Software
                                                                  //luminescence.de/ (last access: 28 March 2021). A short de-
                                                                  scription of how to install the SR-RF macro and its depen-
Our software toolchain consisted of three different tools:        dencies and detailed documentation of the macro can also be
LexStudio 2 for measurement sequence control, Im-                 found on our website. Interfacing of the macro to other pro-
ageJ for image processing and the R function library              grams is possible through the additionally supported ImageJ
Luminescence for data analysis. ImageJ and the                    batch mode.
Luminescence package are open-source (GPL-3 licence)
and freely available for all major platforms (Windows, Linux,     2.2.3    Data analysis with R
macOS). However, our software toolchain was tested so far
just on Windows 10 and macOS (v10–v11). Detailed in-              We employed the statistical programming environment R
stallation guides and additional download links to the SR         (R Core Team, 2020) and the package Luminescence
IR-RF-specific software modules can be found at https://          (Kreutzer et al., 2012, 2020) for processing the IR-RF single-
luminescence.de/ (last access: 28 March 2021).                    grain data.
                                                                     Therefore, we developed two new functions for a seamless
                                                                  data import and processing of *.rf files: read_RF2R()
2.2.1    Image acquisition with LexStudio 2                       and plot_ROI() (Luminescence ≥ v0.9.8). Both func-
We used the software LexStudio 2 (version 2.5.0, 2019-11-         tions work in conjunction with the already available function
01) shipped with the measurement system for sequence writ-        analyse_IRSAR.RF(). See below for an application ex-
ing, camera parameterisation and image acquisition. For the       ample.
presented work, Freiberg Instruments updated LexStudio 2             Advanced users can also deploy our experimental R pack-
in 2018/2019 with a new module to control the camera set-         age dedicated to spatially resolved luminescence data anal-
tings relevant for luminescence imaging (Fig. 2a). The new        ysis called RLumSTARR (Kreutzer and Mittelstrass, 2020a).
module also enables sequence-synchronous camera control           The sole relevance of RLumSTARR for this contribution is
and data handling. Thus, sequence writing does not differ         the function run_ImageJ(). We used this function to run
from routine luminescence measurements with a PMT. The            ImageJ in a batch mode and autoprocess our image data.
new LexStudio 2 camera module uses the 32-bit PVCAM               However, RLumSTARR is not required to analyse SR IR-RF
drivers by Princeton Instruments and maintains the compati-       data.
bility to the camera control software WinView shipped with
the ProEM camera. Unfortunately, this enhanced version of         2.3     Measurement protocol
LexStudio 2 is currently bound to 32-bit Microsoft Win-
                                                                  We applied the RF70 single aliquot protocol by Frouin et al.
dows platforms. The obtained data, however, can be sepa-
                                                                  (2017), an improved version of the IRSAR protocol (Erfurt
rately processed and analysed on other computers with other
                                                                  and Krbetschek, 2003a). The RF70 sequence (Table 1) in-
platforms. The data consist of one image stack for each RF
                                                                  cludes two IR-RF measurements: one for the natural signal
measurement, saved as a 16-bit greyscale TIF file. To prevent
                                                                  (RFnat ) and one for the regenerated signal (RFreg ). In the
system crashes due to the 3 GB barrier of 32-bit platforms,
                                                                  data analysis process, the RFnat signal curve is slid verti-
LexStudio 2 provides an option to split large data sets auto-
                                                                  cally and horizontally along the signal curve until the best
matically.
                                                                  match is achieved with the RFreg curve. The horizontal slid-
                                                                  ing distance is the accumulated dose needed to match the
2.2.2    Image processing with ImageJ                             natural RF signal, thus defining the equivalent dose (Murari
                                                                  et al., 2018). Measurement durations are user-defined. How-
For processing the image data, we used the open-source soft-
                                                                  ever, RFreg should be longer than the sample’s expected nat-
ware ImageJ (version: 1.52p) (Schneider et al., 2012). We
                                                                  ural dose. RFnat should not contain fewer than 70 data points
developed a macro called SR-RF (file SR-RF.ijm, see the
                                                                  (in our case images) to give sufficient statistical confidence
Supplement) to automatise the workflow. The SR-RF macro
                                                                  when using the sliding method (Frouin et al., 2017, their sup-
is a plain ASCII file and written in the JavaScript-like Im-
                                                                  plement, proposed at least 40 channels for a resolution of
ageJ macro language. It provides a graphical user interface
                                                                  15 s/channel).
(Fig. 2b) to simplify user interactions. The output is an ASCII
                                                                     We used the comparable solar simulator settings as
text file with the file-ending *.rf. The file contains the
                                                                  in Frouin et al. (2017)2 : 365 nm: 20 mW cm−2 , 462 nm:
single-grain IR-RF curves, the size and spatial location of
the associated regions of interests (ROIs) and further image-        2 Contrary to what is quoted erroneously in Frouin et al. (2017),
processing information. We used the enhanced ImageJ distri-       these settings are identical to the bleaching settings applied by
bution Fiji (https://fiji.sc, last access: 28 March 2021) (ver-   Frouin et al. (2017) for their measurements.

Geochronology, 3, 299–319, 2021                                                    https://doi.org/10.5194/gchron-3-299-2021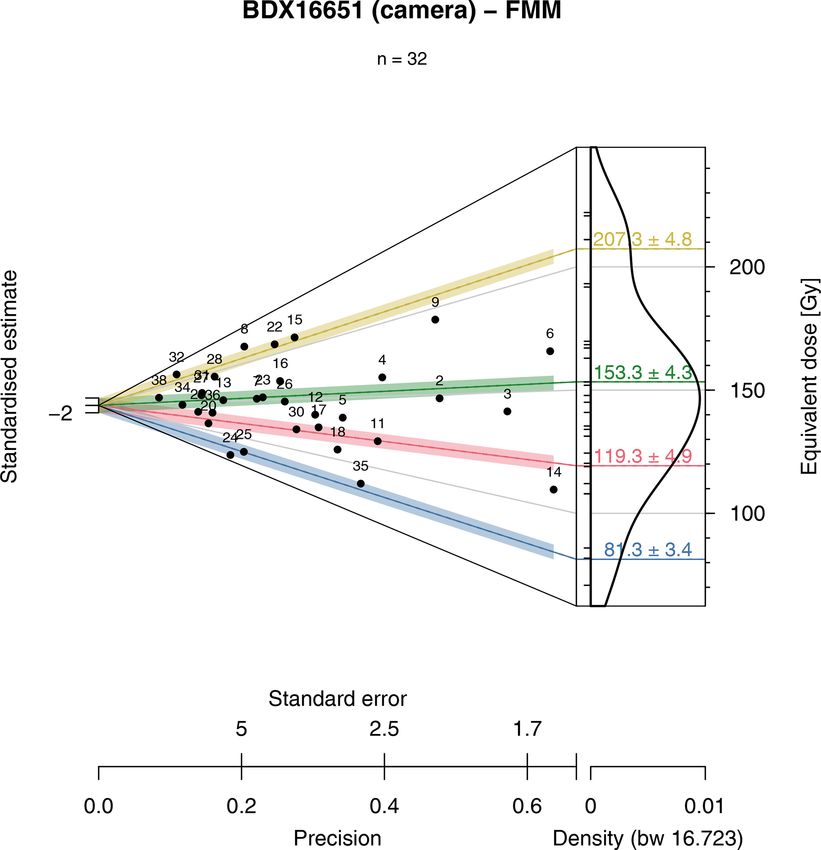
D. Mittelstraß and S. Kreutzer: Spatially resolved infrared radiofluorescence                                                 303

Figure 2. Screenshots of (a) the LexStudio 2 interface to parameterise the CCD camera and (b) the SR-RF ImageJ macro interface to
analyse IR-RF images.

Table 1. Applied IR-RF measurement sequence according to the RF70 protocol by Frouin et al. (2017).

           No.   Step                                 Treatment                                            Measurement
           1     Shallow trap depletion               Preheat at 70 ◦ C for 900 s                          –
           2     Natural dose IR-RF                   β irradiation at 70 ◦ C for       RFnat
           3     Signal resetting                     Bleaching with in-built solar simulator for 3 h      –
           4     Wait for phosphorescence to decay    Pause for 1 h                                        –
           5     Shallow trap depletion               Preheat at 70 ◦ C for 900 s                          –
           6     Regenerative dose IR-RF              β irradiation at 70 ◦ C for       RFreg

61 mW cm−2 , 525 nm: 53 mW cm−2 , 590 nm: 37 mW cm−2 ,               tings and data quality. Table 3 lists the camera settings we
623 nm: 112 mW cm−2 , 850 nm: 94 mW cm−2 . In our                    used in our experiments. For more in-depth insights into the
bleaching protocol, the UV power settings are doubled in             scientific CCD camera technology we may refer to Janesick
comparison to the recommendations by Frouin et al. (2015).           (2001) and the Andor Learning Centre (https://andor.oxinst.
This setting may lead to an unwanted temperature increase            com/learning/, last access: 28 March 2021; search for “Andor
in the sample. However, we carefully monitored the temper-           Academy”).
ature as recorded by the thermocouple in the reader’s sample
arm. We found the temperature stable at 70 ◦ C for all mea-          2.4.1   Set the CCD chip temperature low, but not too low
surements (data not shown), indicating that the temperature
in the samples was stable.                                           One primary source of image noise arises from the dark cur-
                                                                     rent of the CCD chip. The dark current is highly temperature-
                                                                     dependent; see Appendix A2 or Fig. S1 for the exact relation.
2.4   Camera settings
                                                                     The camera has a built-in thermoelectric cooling system to
While the enhanced LexStudio 2 version automates image               cool the CCD chip far below room temperature and thus ef-
acquisition, it does not free the user from parameterising the       fectively suppressing dark current related image noise. For
camera. In the following, we will advise on the most rele-           the camera we used, the lowest reachable CCD temperature
vant camera settings and their impact on image noise and             is in theory at about −75 ◦ C if no additional external cool-
signal sensitivity. We derive parts of our advice from signal-       ing is applied. For the user, it seems obvious to set the tar-
to-noise ratio (SNR) estimations summarised in Appendix A.           get CCD temperature as low as the cooling system allows.
Table 2 lists major correlations between CCD camera set-             However, we strongly recommend setting the target temper-

https://doi.org/10.5194/gchron-3-299-2021                                                      Geochronology, 3, 299–319, 2021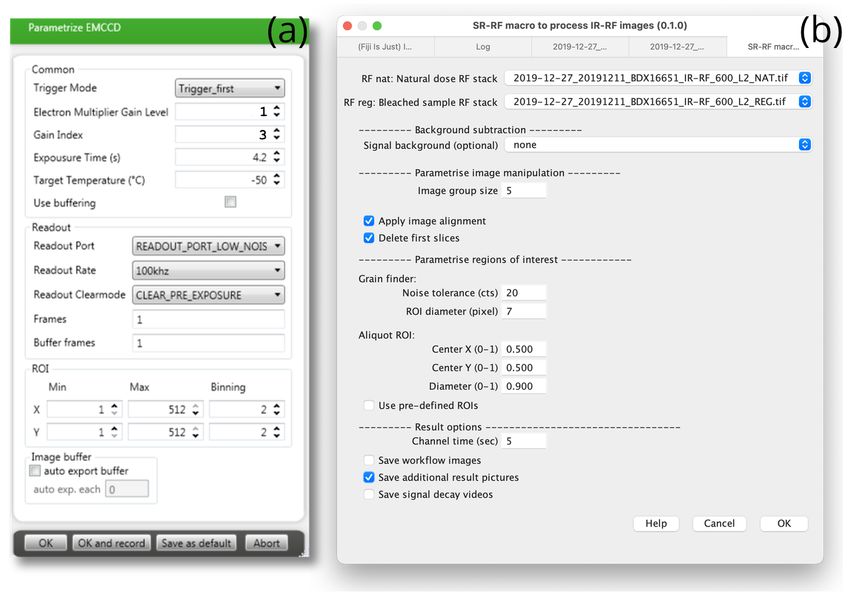
304                                                         D. Mittelstraß and S. Kreutzer: Spatially resolved infrared radiofluorescence

Table 2. Correlation between basic camera settings and data quality. Up arrows: increasing this parameter leads to an increase of, for example,
noise, time span and intensity. Down arrow: increasing this parameter leads to a decrease of the corresponding attribute. Right arrow: changed
parameter settings do not affect the attribute.

                      Camera setting                             Source of information loss                               Data quality
                                                 Readout noise                 Dark noise              Dead time        Signal per   SNR
                                               per ROI and image           per ROI and Image           per image∗         pixel
                      Exposure time                      ⇒                           ⇑                      ⇒              ⇑         ⇑
                      Readout rate                       ⇑                           ⇒                      ⇓              ⇒         ⇓
                      Pixel binning                      ⇓                           ⇒                      ⇓              ⇑         ⇑
                      CCD temperature                    ⇒                           ⇑                      ⇒              ⇒         ⇓
                   ∗ camera dead time occurs only if a sequential CCD chip readout mode is applied (full-frame mode).

Table 3. Recommended settings for a Princeton Instruments                             pendix A. However, all modern scientific CCD cameras, in-
ProEM512 camera employed in a Freiberg Instruments lexsyg re-                         cluding our ProEM camera, can read out the last image while
search system.                                                                        already gathering signal light for the next image. The camera
                                                                                      dead time is a setting particular to the LexStudio 2 software
      Camera setting     High SNR (default)           Full resolution                 solution we used. Later software iterations or more advanced
      Channel width      5s                           5s                              systems might set exposure time and channel width equal by
      Exposure time      4.15 s                       4.5 s                           default.
      Readout rate       100 kHz                      1 MHz
      Pixel binning      2×2                          off (1 × 1)
                                                                                      2.4.3     Do not use EM gain

                                                                                      EM-CCD cameras have an electron-multiplying (EM) reg-
ature between 10 and 15 K above the technical minimum.                                ister that amplifies the detected signals above readout noise
An RF measurement takes hours, enough time for the cam-                               if activated. The EM mode allows for highly sensitive high-
era electronics to warm up or for changes in the system tem-                          frame-rate imaging, but it comes at a cost: (1) it induces an
perature. The resulting fluctuations in the CCD temperature                           additional source of image noise (excess noise), (2) it reduces
induce changes in the background signal level during the RF                           the dynamic range and the linearity of the signal acquisition,
measurement. These background instabilities are hard to cor-                          (3) it amplifies dark current signals and thus dark noise, and
rect in the post-processing. Therefore, a stationary CCD tem-                         (4) it amplifies local pixel over-exposures leading to pixel-
perature level is mandatory and eased by leaving the cooling                          well overflows. Especially the last point is problematic for
system enough headroom for corrections.                                               RF imaging. If the speckle noise caused by bremsstrahlung
                                                                                      gets amplified by the EM mode, streaks with increased sig-
2.4.2   Select a slow readout rate, but not too slow                                  nal values appear on the image. These are hard to remove by
                                                                                      image-processing algorithms.
The CCD chip readout process induces another source of im-
age noise called read noise or readout noise (cf. standard text-
books for both notations). Longer exposure times lead to bet-                         2.4.4     Consider hardware pixel binning
ter SNR because more signal is gathered while the readout
noise remains constant.                                                               The most straightforward approach to improving the SNR
   Another way to reduce readout noise is to choose a slow                            and the signal sensitivity is pixel binning performed by the
CCD readout rate. In our system, the slowest available read-                          CCD camera image-processing software like ImageJ. This
out rate is 100 kHz. At this rate, a full-resolution (512 ×                           software pixel binning, however, is less effective than poten-
512 px) CCD readout takes 2.13 s. If the readout process lasts                        tial hardware binning by the camera. With applied hardware
longer than the RF measurement channel, either images are                             pixel binning, multiple pixels are considered as one pixel and
lost or the camera runs asynchronous to the measurement                               read out together. This feature reduces the readout noise per
sequence. In our systems, the readout process started after                           imaged area and reduces the readout time and therefore the
the preset time interval for the image exposure ended. The                            camera dead time (if applicable). As a side effect, the image
camera is then locked until the image data are transferred                            stacks’ file size is also reduced, positively impacting image
to the computer. Thus, the user has to incorporate a camera                           processing time. We applied 2 × 2 pixel binning as a default
dead time when parameterising channel width and exposure                              setting and deactivated it only if we had sufficiently bright
time in the camera’s sequence settings; see Table 3 and Ap-                           samples. On the downside, pixel binning lowers the camera

Geochronology, 3, 299–319, 2021                                                                             https://doi.org/10.5194/gchron-3-299-2021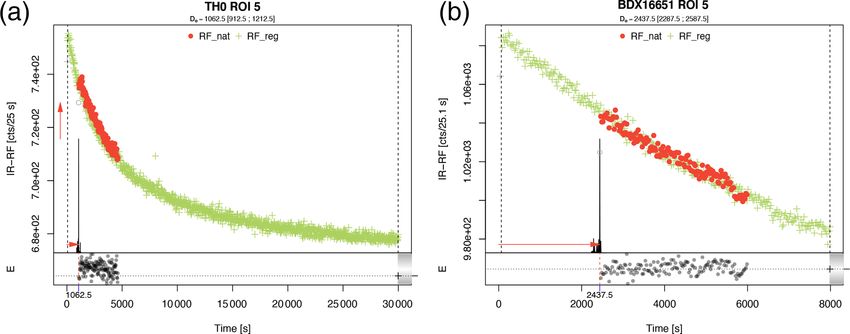
D. Mittelstraß and S. Kreutzer: Spatially resolved infrared radiofluorescence 305
resolution to 256 × 256 pixel, corresponding to a decreased the interpolation methods for sample TH0 (see below,
spatial resolution of 54 µm (before 27 µm). Sect. 3.4.1) and selected bicubic as a hidden preset value.
2.5 Image processing 2.5.3 Step 3: grain detection and ROI assignment
We obtain two image stacks (a series of images) per aliquot We used the ImageJ command Find Maxima (Ferreira and
from the RF70 protocol. (Table 1). Each image stack is saved Rasband, 2012) to identify individual mineral grains, as a ref-
as a *.tif file. Both image stacks are affected by speckle erence serves the arithmetic mean image of the two median
noise. Besides, the RFreg images might be displaced or ro- images from step 2 (Sect. 2.5.2). There, the Find maxima
tated compared to the RFnat images due to uncertainties in algorithm searches for local maxima in the pixel val-
the aliquot positioning (Kreutzer et al., 2017). ues. The user-defined parameter Noise tolerance con-
Both issues and the grain identification are addressed by trols the algorithm’s sensitivity, which defines how much
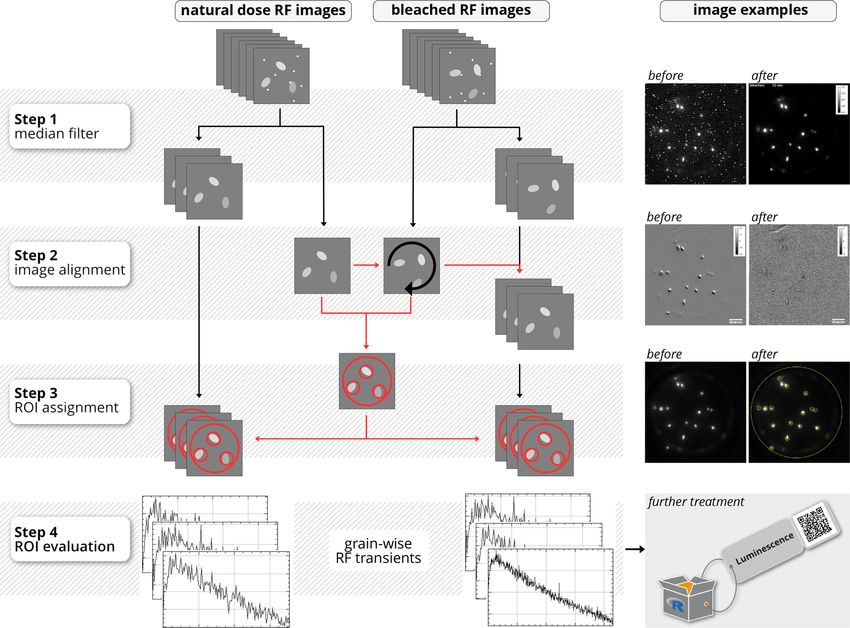
the SR-RF macro in ImageJ. The image processing has four higher than the surrounding area a pixel value must be. A
steps (Fig. 3): (1) speckle noise is removed, (2) both im- higher Noise tolerance value leads to higher robust-
age stacks are geometrically aligned, (3) individual grains ness against optical reflections and signal outliers but a lower
are identified, and (4) single-grain RF curves are extracted. grain detection likelihood. A circular ROI is assigned to each
Table 4 gives recommendations for the macro settings. For local maximum. The diameter of these circles is user-defined
more details on the macro settings and the detailed sequence through the ROI diameter parameter.
of ImageJ commands, we refer to our SR-RF macro docu-
mentation available at https://luminescence.de/ (last access: 2.5.4 Step 4: extract single RF curves
28 March 2021).
We used the ImageJ ROI manager to obtain the arithmetic
mean of the pixel values in each ROI for each image in the
2.5.1 Step 1: median filter RFnat stack and RFreg stack. Thus, the consecutive average
signal in one ROI forms the IR-RF curve of one sample
We used the ImageJ command Grouped Z Project
grain. These single-grain IR-RF measurements and the lat-
(Ferreira and Rasband, 2012) to erase bremsstrahlung’s
eral position of each ROI are saved into one ASCII text file
spots. The images of both image stacks are grouped
(table.rf) to be further analysed with other software than
in quantities according to the user-defined parameter
ImageJ.
Group Size. Each group’s images are combined to one
image by taking the median pixel value for each pixel loca-
tion. This process removes signal outliers while maintaining 2.6 Single-grain data analysis in R
the fundamental shape of the signal curve (Velleman, 1980). We analysed the single-grain IR-RF data the same way
Speckles caused by bremsstrahlung occur in random loca- that we would analyse conventional PMT IR-RF measure-
tions. Hence, it is unlikely that the same pixel is affected ments. A simple R script to analyse the table.rf file of
more than once during a time interval related to the measure- one aliquot reads as follows (R package Luminescence
ment of just a few images. The statistical likelihood of sur- ≥ v0.9.8 needed):
viving speckles increases with longer image exposure times
but decreases with larger group sizes. For the measurement #load R package 'Luminescence'
system we used, and with an exposure time of 5 s, a group library(Luminescence)
size of five is sufficient to eradicate speckle noise.
#import data
2.5.2 Step 2: image alignment
file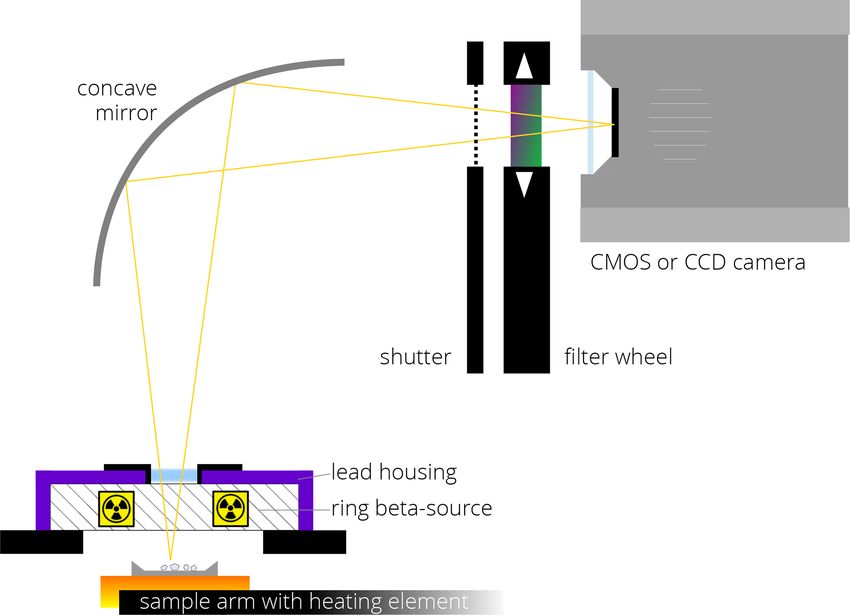
306                                                             D. Mittelstraß and S. Kreutzer: Spatially resolved infrared radiofluorescence

Figure 3. Image-processing workflow as performed by the ImageJ macro SR-RF.ijm. Note: the grey step 2 images show the signal value
differences between the median signal values of the natural dose RF images and the median signal values of the regenerated dose RF images.
A homogeneous colour means that the images are aligned.

Table 4. Recommended SR-RF macro settings for the first image-processing run, depending on the sample brightness and the grain size.
Parameter refinements depending on the system and the sample might be necessary. The two lower columns display the properties of the
resulting single-grain IR-RF curves. The sample area diameter values assume a lateral magnification of 0.6 and a pixel size of 16 µm.

        Macro parameter                                                   ∼ 50–80 µm grain size                ∼ 180–250 µm grain size
                                                                 Bright sample at    Dim sample at       Bright sample at   Dim sample at
                                                                 full resolution∗    high SNR setting∗   full resolution∗   high SNR setting∗
        Image group size                                         5                   5                   5                  5
        Noise tolerance                                          15                  10                  15                 10
        ROI diameter                                             5                   3                   12                 7
        Time resolution of single-grain IR-RF curve              25 s                25 s                25 s               25 s
        Diameter of sample area covered by ROI                   133 µm              160 µm              324 µm             371 µm
      ∗ refers to the recommended camera settings in Table 3.

#plot dose distribution                                                             (2018) in the function analyse_IRSAR.RF() (parameter
plot_AbanicoPlot(equivalent_doses)                                                  vslide_range). Vertical sliding can improve the equiva-
                                                                                    lent dose results’ accuracy but needs a significant curvature
   Here, the new function read_RF2R() converts the                                  in the IR-RF decay to work properly. Vertical sliding can
table.rf file into a list of RLum.Analysis objects.                                 be deactivated by setting vslide_range = NULL or re-
Each RLum.Analysis object contains the RFnat and RFreg                              moving the parameter. The function plot_ROI() displays
curves of one ROI. The equivalent dose of each ROI is cal-                          and returns the ROI locations and returns the Euclidean dis-
culated by analyse_IRSAR.RF(), which was already                                    tance between them. This information is useful to study the
introduced and used by Frouin et al. (2017). The result-                            impact of signal cross-talk.
ing dose distribution can be displayed and further eval-
uated by any of the various functions for dose statis-
tics the Luminescence package provides. In the exam-
ple above, we allowed vertical sliding after Murari et al.

Geochronology, 3, 299–319, 2021                                                                     https://doi.org/10.5194/gchron-3-299-2021
D. Mittelstraß and S. Kreutzer: Spatially resolved infrared radiofluorescence 307
2.7 Signal cross-talk 3 Part II: testing spatially resolved
radiofluorescence
An issue in OSL and TL imaging flagged by Gribenski et al.
(2015) and further discussed by Cunningham and Clark- 3.1 Samples
Balzan (2017) is signal cross-talk. Two independent effects
cause signal cross-talk: (1) signal light misdirected by opti- We selected two potassium-bearing (K-feldspar) samples to
cal aberrations and (2) signal light backscattered by the sil- apply and test our SR IR-RF tools and their settings. The first
icone fixation layers and the sample carrier’s surface. The sample (TH0, grain size: 125–250 µm) is a modern analogue
visual perceptions are blurry luminescence images and sig- sample of aeolian origin from Sebkha Tah in Morocco (cf.
nal halos around individual grains. These halos can extend Bouab, 2005). It is the same sample used by Frouin et al.
into the ROIs of other grains located nearby. This cross-talk (2017) to calibrate the 90 Sr / 90 Y source of the very same
effect blends the IR-RF curves and potentially narrows the reader used for our measurements here. The sample was ex-
De distribution. posed to a γ dose of 56.02 Gy (cv ∼ 2 %) in 2015 (Frouin
Gribenski et al. (2015) investigated the effects of signal- et al., 2017). The second K-feldspar sample (BDX16651,
cross talk in spatially resolved OSL measurements. They grain size: 100–200 µm) originates from a coastal dune in
found a substantial effect on the equivalent dose outcome and the Médoc area (south-western France). For this sample,
supposed optical aberrations as the primary signal cross-talk Kreutzer et al. (2018) estimated a palaeodose of 50.7±5.7 Gy
source. Like us, they used a lexsyg research device equipped for the quartz fraction (green OSL) and 96.2 ± 8.0 Gy (with
with a ProEM512B camera. However, they measured at IR-RF) for the K-feldspar fraction measured here. For de-
the OSL/TL sample position equipped with a custom-made tails on the sample preparation procedures, we refer to the
multi-purpose optic (Richter et al., 2013; Greilich et al., cited literature.
2015). The OSL/TL optic was designed with large opening
angles and high UV-to-NIR transmittance. This design deci-
sion enabled a maximum of signal yield for various applica- 3.2 Experiments
tions but counteracted the optical correction of spherical and
TH0 allowed us to calibrate the 90 Sr / 90 Y source with SR IR-
chromatic aberration and their secondary effects like astig-
RF and compare the results with the PMT’s calibration mea-
matism.
surements. For this experiment, the detector changed in al-
The optic of the RF position has a far smaller aperture
ternating turns; i.e. after measuring an aliquot with the PMT,
(NARF ≈ 0.2 vs. NAOSL/TL ≈ 0.5) and therefore less spheri-
another aliquot was measured using the EM-CCD camera,
cal aberration. In addition, we consider chromatic aberration
and then we measured an aliquot again with the PMT, and so
as negligible because we performed the focus calibration and
on. We tested whether both measurements estimate statisti-
all measurements at the same wavelength (865 nm). As Fig. 4
cally indistinguishable source dose rates.
shows, the effect of signal cross-talk appears to be weaker
The measurements of BDX16651 aimed at one main appli-
in our measurements as observed by Gribenski et al. (2015)
cation of single-grain measurements: differentiation between
and should be insignificant for inter-grain distances above
grain fractions with different bleaching history. Kreutzer
ca. 500 µm. We tried to maintain this distance by preparing
et al. (2018) reported an age of 37.0 ± 4.9 ka (arithmetic av-
our samples with a very low grain density.
erage ± standard deviation) for the feldspar fraction (mea-
Nevertheless, for samples with a high grain density or a
sured with IR-RF) and 26.1 ± 3.5 ka for the quartz fraction
high grain intensity inhomogeneity, signal cross-talk will be
(measured with green OSL). While both ages overlap within
an issue. We propose the following countermeasures to re-
2σ , Kreutzer et al. (2018) reported consistently older ages for
duce the effect; none of them applied in our experiments
the feldspar fraction compared to the quartz fraction for all
though:
samples from the site. Therefore, they argued that the natural
– Use special sample carriers (punched, black or polished) bleaching was likely insufficient to reset the IR-RF signal of
to minimise backscattered luminescence light. the feldspar grains. SR IR-RF should confirm the quartz re-
sult obtained by Kreutzer et al. (2018) and potentially enable
– Deploy improved optics (the lenses are exchangeable) us to identify those grains that received a full signal resetting
to further reduce spherical aberration. before the last burial.
For both samples, feldspar grains were dispersed randomly
– Apply mathematical correction methods (e.g. Cunning-
on stainless-steel cups aiming at a low grain density. The
ham and Clark-Balzan, 2017) to improve the grain sep-
sample cups were sprayed with a thin layer of silicon oil.
aration in the data.
However, no mask or other aid was used because this reflects
a more realistic aliquot preparation procedure in most labora-
tories. We aimed at 30 to 50 grains per aliquot. We prepared
at least three cups per sample. Irradiation times were equal
to values reported in Frouin et al. (2017) and Kreutzer et al.
https://doi.org/10.5194/gchron-3-299-2021 Geochronology, 3, 299–319, 2021308 D. Mittelstraß and S. Kreutzer: Spatially resolved infrared radiofluorescence
Figure 4. IR-RF cross-talk profile of one single grain. The inset shows the ImageJ image with the rectangle area selected for the profiling
over ca. 1800 Gy (along the all image slices of the image stack). The solid black lines show the IR-RF signal. For illustrative reasons, we
show only a few curves. The dashed blue line shows the approximated OSL cross-talk profile recorded by Gribenski et al. (2015) after a dose
of ca. 100 Gy. The violet shaded area approximates the grain (not in height but width). Please note that the data by Gribenski et al. (2015)
were only added to provide a rough qualitative comparison. Please note that the metric distances (sub-labels) refer to the chip surface.
(2018): 3600 s (RFnat ) and 30 000 s (RFreg ) for sample TH0; is flagged, the RFnat cannot match the RFreg within the mea-
3600 s and 10 000 s for sample BDX16651. sured range of RFreg – an observation usually made for very
Figure 5 shows typical IR-RF curves from one ROI (in our noisy, flat curves.
case one grain) for TH0 (Fig. 5a) and BDX16651 (Fig. 5b). The raw data of our measurements, along with the applied
To obtain the De s, we applied the vertical and horizontal R scripts and partially pre-processed examples, are available
sliding technique (Murari et al., 2018) to TH0. The verti- open-access (Kreutzer and Mittelstrass, 2020b).
cal sliding ensures that both curves (RFnat and RFreg ) match
best based on their shape. This approach was first used by
3.3 Technical camera issues
Kreutzer et al. (2017) to corrected for changed signal inten-
sities due to geometry issues. Still, it can also be used to While we measured at least three cups with grains per sam-
correct sensitivity changes (Murari et al., 2018). For sam- ple, the number of usable cups presentable here finally nar-
ple BDX16651, only horizontal sliding was used due to the rowed down to one cup each. A malfunction in the cool-
absence of visible curvature in the IR-RF curve. ing system of our camera stopped us from conducting more
As rejection criteria, we applied the default test crite- measurements. This cooling system degraded over the last 5
ria (cf. Frouin et al., 2017, their supplement) of the func- years, continually increasing the lowest reachable tempera-
tion analyse_IRSAR.RF(). Two of those criteria were ture from at least −70 ◦ C in 2015 to about −45 ◦ C in 2019.
of relevance for our contribution: curves_ratio and As we already mentioned above, the CCD chip tempera-
curves_bounds. The first calculates the ratio of RFnat ture’s spatial and temporal uniformity is necessary to ensure
over RFreg in the range of RFnat . If it exceeds a certain a stable and homogeneous signal background. We provide
threshold (here 1.001), it usually indicates that the RFnat best additional insights in Appendix A2 and Figs. S1 and S2 in
matched the RFnat while lying above the RFreg (addition- the Supplement. Unfortunately, our camera’s cooling system
ally confirmed by visual inspection), violating the assump- finally lost its ability to maintain stable chip temperatures
tion that the highest IR-RF signal is observed for the RFreg during our measurements meant for publication. Significant
after bleaching. If the second, curves_bounds, criterion variations in the IR-RF curves’ signal background required
Geochronology, 3, 299–319, 2021 https://doi.org/10.5194/gchron-3-299-2021D. Mittelstraß and S. Kreutzer: Spatially resolved infrared radiofluorescence 309
Figure 5. Typical IR-RF curves for the samples TH0 (a) and BDX16651 (b). Both curves were extracted from ROIs following the procedure
outlined in the first part of the article. For determining the De the sliding method was used. Due to the absence of any curvature in the
observed dose range, no vertical sliding was applied to sample BDX16651 measurements (b). Please note, for sample BDX16651 only the
first 8000 s of the RFreg are displayed in the figure due to a technical error. SR-RF macro settings as follows: image group size: 5, noise
tolerance: 20 (TH0), 30 (BDX16651), grain diameter: 7 px.
us to discard most of our measurements (see Fig. S4 for an our hypothesis that the calibration results obtained through
example). SR IR-RF and IR-RF PMT measurements are indistinguish-
Independently from this issue, we further discarded grains able. Furthermore, it gives some confidence that these mea-
located at the rim of the stainless-steel cup, where our analy- surements were not affected by the cooling-system malfunc-
sis indicated exceeded IR-RF curve boundaries for unknown tion of the camera.
reasons (i.e. no match between RFnat and RFreg ). We further tried to determine to what extent the results de-
pend on the chosen ROI size (here diameter 7 px) and the
3.4 Results interpolation method used to correct the image for transla-
tion and rotation (Sect. 2.5.2). As an interpolation method,
Figure 6 illustrates the final results for the two remain- we obtained the best results for the option bicubic (see
ing cups: one for TH0 (Fig. 6a, upper part) and one for Fig. S3), which is the default in the SR-RF ImageJ macro
BDX16651 (Fig. 6b, lower part). For each sample, we show SR-RF. The ROI diameter should mimic the approximated
an image taken with the camera (left-hand side) during the grain size or be a bit larger (see also Fig. S3). We observed a
measurements and an Abanico plot (Dietze et al., 2016) of plateau of results for ROI sizes between 5 and 10 px for sam-
the distribution of the results. ROI pixels (diameter 7 px; see ple TH0. Smaller values should not be selected because the
Table 4) taken for the De analysis are coloured green and ROI finding algorithm may not reliably select the grain cen-
numbered. The numbers are displayed again in the Abanico tre. For larger values, signal cross-talk effects likely become
plots (right-hand side). The results of TH0 display dose rates an issue, although the median appears to be rather robust for
in Gy s−1 and equivalent doses in Gy for BDX16651. We ap- all ROI sizes between 5 and 30 px for bicubic (Fig. S3).
plied the average dose model (Guérin et al., 2017) to both
distributions with an assumed intrinsic overdispersion (σm )
of 0.05. 3.4.2 BDX16651
We counted ca. 40 grains on the analysed cup, and 35 emit-
3.4.1 TH0
ted light and were analysed. We discarded three grains be-
SR RF-RF measurements of sample TH0 on 10 grains (ca. 20 cause the R analysis indicated a bad match of RFnat and
grains on the cup, 11 grains emitted sufficient light for the RFreg . The sample shows a large De scatter with an av-
analysis, 1 grain discarded) obtained a source-dose rate of erage De of 148.6 ± 6.7 Gy (average dose and associated
0.055 ± 0.004 Gy s−1 (date: 13 September 2019). This value standard error (SE)). This value is significantly larger than
is consistent with the source-dose rate calibration value ob- the mean De of ca. 96 Gy reported by Kreutzer et al.
tained through conventional IR-RF PMT measurements with (2018). However, in contrast to the study by Kreutzer et al.
the same sample (Fig. S5, measurement date: 13 Septem- (2018), the single-grain data allow further statistical treat-
ber 2019, n = 10, 0.056 ± 0.001 Gy s−1 ). Hence, it confirms ment of the results. We applied the finite mixture model
https://doi.org/10.5194/gchron-3-299-2021 Geochronology, 3, 299–319, 2021310 D. Mittelstraß and S. Kreutzer: Spatially resolved infrared radiofluorescence Figure 6. The figure shows the SR IR-RF measurement results for single grains from samples TH0 (a) and BDX16651 (b). For each sample, the image of one aliquot with the selected ROIs (green) is plotted on the left-hand side, and the resulting De distribution as Abanico plot (Dietze et al., 2016) on the righthand side. Numbers (white) in the plots identify individual ROIs. The distribution for TH0 shows dose rates and the distribution for BDX16651 equivalent doses. Note: the original images returned by the SR-RF macro have been cropped and reworked in R for this publication. (FMM, cf. Galbraith and Roberts, 2012) using the function lowest dose group (Fig. 7) corresponds to the best bleached calc_FiniteMixture() with an assumed sigmab grains (leaving aside possible layer disturbance and dose rate value of 0.05 (Fig. 7). The Bayesian information criterion heterogeneities) the De of 81.3 ± 3.4 Gy corresponds to an indicated the statistically significant number of components. IR-RF age of ca. 31 ± 5 ka, this is more consistent with the We found that four-dose components can best describe the quartz age of 26.1 ± 3.5 ka. However, the overall statistical De distribution. The lowest ca. 81 Gy (blue colour, Fig. 7) confidence in ages based on three grains might be doubted, contains only 10 % of all grains, the second component regardless of the statistically justified number of components. ca. 26 %, the third ca. 47 % and the highest dose component Simultaneously, it appears that dose groups with higher doses ca. 19 % of all grains. The number varies with sigmab (not than reported by Kreutzer et al. (2018) are dominant. Here shown), but the data set seems to consist of at least two dose more measurements would be needed to infer a statistically groups (around < 120 Gy and > 120 Gy). Assuming that the robust answer. Geochronology, 3, 299–319, 2021 https://doi.org/10.5194/gchron-3-299-2021
D. Mittelstraß and S. Kreutzer: Spatially resolved infrared radiofluorescence                                                   311

                                                                      Figure 8. Instrumental design proposal for a dedicated SR-RF
                                                                      reader based on a Freiberg Instruments lexsyg research.

                                                                      era. CMOS cameras have lower readout noise than traditional
                                                                      CCD cameras, although they do not support EM and hard-
Figure 7. Abanico plot for sample BDX16651 with coloured poly-        ware pixel binning.
gons indicating dose components as identified by the finite mixture      Concerning the software, one subject for future improve-
model. Further details see main text.                                 ments we did not implement is an advanced median filter
                                                                      in the image-processing macro. While the current algorithm
                                                                      proved itself powerful in sufficiently removing speckle noise,
4     Discussion                                                      it decreases the time resolution and deletes those pixel val-
                                                                      ues which are not identified as median values. More sophisti-
We showed that SR-RF is technically feasible and presented            cated algorithms deploy complex running median processes.
first results. However, some aspects deserve critical consid-         For example, the (53H, twice) algorithm described in Velle-
eration.                                                              man (1980) would mostly maintain time resolution while
                                                                      being still as potent in removing spikes. As another exam-
4.1    The technical dimension                                        ple, the (4253H, twice) algorithm of Velleman (1980) would
                                                                      maintain the shape of the underlying RF curve while smooth-
It would be wishful thinking to assume that the work is fin-          ing away signal spikes and much of the Gaussian noise.
ished. In comparison to PMT measurements, the number of                  Another subject of potential improvement is the ROI as-
control parameters exploded similarly to the amount of data.          signment algorithm. The current algorithm assigns the max-
We tried to reduce the complexity by recommending mean-               imum signal pixel of the grain as the centre of the ROI, no
ingful settings and limit the number of adjustable parameters         matter if this is the middle of the grain. We suggest a sub-
to a minimum. Still, other systems might have options we did          sequent algorithm which refines the ROI centre towards an
not consider in our contribution.                                     estimated grain centre. Consequently, the ROI size could be
   Besides the technical problem we encountered with the de-          reduced without losing signal, usually leading to higher inter-
tection chip’s cooling system, we also acknowledge that our           aliquot scatter. This would increase grain separation and de-
system is not perfect. A considerable improvement of image            crease any influence of signal cross-talk.
quality can be expected from a dedicated RF imaging sys-                 Finally, while the presented software toolchain is open-
tem. We outline a possible design for such a system in Fig. 8.        source, hence freely available and open to inspections and
A system of one or two concave mirrors would allow the re-            improvements, we acknowledge that the combination of
location of the camera and the filters further away from the β        three different software tools adds an additional layer of com-
source and thus minimise bremsstrahlung effects and poten-            plexity. However, in particular, the image processing through
tial filter degradation (cf. Gusarov et al., 2005). Such a mirror     ImageJ has the advantage that the data processing is transpar-
optic would also eliminate chromatic aberration and thus en-          ent and available on all platforms and independent of the par-
able the ability to take RF images at different wavelengths           ticular measurement system. Furthermore, users can tap into
without refocusing. A dedicated RF optic would also address           an extensive repository of available functions and plug-ins to
further optical aberrations and thus reduce signal cross-talk.        record their own macros and thus adjust the image analysis
As a camera, we propose a modern scientific CMOS cam-                 with ImageJ without a need for programming skills.

https://doi.org/10.5194/gchron-3-299-2021                                                        Geochronology, 3, 299–319, 2021
312 D. Mittelstraß and S. Kreutzer: Spatially resolved infrared radiofluorescence
4.2 The application dimension In the absence of such technical issues, given that our
method can be tested successfully at more extensive data
This section alludes to the scientific gain and the initially ex-
sets, the next logical step would be to link SR IR-RF with
pressed hypothesis that SR IR-RF can unravel the bleaching
spectral measurements. Trautmann et al. (2000) performed
history of single feldspar grains.
spectrally resolved radiofluorescence measurements of sin-
We showed for sample TH0 that obtained source dose-rate
gle feldspar grains. They demonstrated that the radiolumines-
results do not differ significantly from conventional IR-RF
cence emission spectra could significantly differ from grain
results using a PMT. This observation is reassuring because
to grain. They also showed that plagioclase grains might also
it shows that the presented workflow and analysis leads to
emit IR-RF signals and mentioned that the separation of K-
meaningful results. However, Fig. 6a also reveals a large scat-
feldspar grains from other feldspar grains could not be taken
ter between the individual feldspar grains ranging from 0.044
for granted. Nevertheless, Trautmann et al. (2000) concluded
to 0.076 Gy s−1 . Richter et al. (2012) reported a variation of
that “good” grains and “bad” grains might be distinguishable
the radiation field for our source type of only 2 %. Hence, the
by their spectral fingerprint. In the same year, Krbetschek
extreme values might result from microdosimetric effects (ir-
et al. (2000) showed that artificial irradiation could stimulate
radiation, cf. Mauz et al., 2020), which are related to IR-RF
an RF emission centred at 700 nm. This additional emission
characteristics of single feldspar grains or varying K concen-
may interfere with IR-RF measurements. However, for the
trations (e.g. Dütsch and Krbetschek, 1997).
sample BDX16651, we performed brief tests with a spec-
Kumar et al. (2020) reported zoning of feldspar grains
trometer and did not find any indication for a potential signal
linked to the geochemical composition. On some of our im-
interference (not shown, to be presented elsewhere).
ages (not shown), it appears that the light is not evenly dis-
Successive spatially resolved RF measurements at differ-
tributed over the grain surface. However, higher optical reso-
ent wavelengths are possible if the measurement device de-
lutions would be required to investigate this aspect further.
ploys an automated filter wheel. In principle, it is even pos-
Sample BDX16651 showed an even higher scatter in the
sible to rotate the filter wheel during one measurement and
equivalent doses, which is not surprising for a natural sedi-
take RF images of multiple wavelengths almost simultane-
ment sample. While environmental dose rate heterogeneities
ously. Nevertheless, this would require a significant software
might add to the observed scatter (Fig. 6b), the internal K
update. Still, the software framework presented in this paper
concentration of K-feldspar (cf. Huntley and Baril, 1997),
may provide the basis to analyse such measurements.
in our case contributing ca. 23 % to the environmental dose
Buylaert et al. (2018) unsuccessfully searched for a cor-
rate (cf. Kreutzer et al., 2018), weakens the effect. Grain-to-
relation between K concentration and the post-IR infrared
grain variations in the internal K concentrations would un-
stimulated luminescence (IRSL) De in single grains of K-
doubtedly broaden the De distribution. However, in our case,
feldspar. Recently, Kumar et al. (2020) reported a correla-
the K concentration was sufficiently constrained by energy
tion of the K concentration and the IR signal measured with
dispersive X-ray analysis (EDX) (Kreutzer et al., 2018, their
cathodoluminescence. Spatially resolved RF measurements
Fig. S16) at 11.4 ± 2.5 %3 . This value does not have enough
in combination with spatially resolved IRSL measurements
leverage to cause results, such as observed for our sample.
may help to link both observations.
More important is to keep in mind that IR-RF specifically
targets K-feldspar grains, which is amplified by selecting sin-
gle grains with the highest luminescence intensities and pre-
5 Conclusions
sumed relatively homogeneous K concentrations. Hence, it
is more likely that the distribution reflects different bleach-
For the first time, we outlined technique and workflow for
ing histories with a lower De component (Fig. 7) that gives a
spatially resolved infrared radiofluorescence (SR IR-RF). We
luminescence more consistently than the quartz age.
presented the first measurement results and a newly devel-
The small number of overall observations, however, does
oped open-source software toolchain, applicable independent
not yet support a more robust conclusion.
of manufacturer.
Unfortunately, the degraded camera cooling system
In contrast to routine PMT experiments, spatially resolved
stopped us from carrying out additional experiments. Does
measurements come with more degrees of freedom that need
this leave the question open of whether to expect hidden ma-
to be taken into account, making first steps foremost a tech-
lign effects in the results of samples TH0 and BDX16551?
nical challenge. Our contribution detailed relevant techni-
Our observations indicated that cooling system problems
cal parameters of the imaging system and provided applica-
were always clearly visible in the IR-RF curves, manifesting
tion guidelines. This will allow other laboratories to repeat
in vastly overestimated unrealistic results – an observation
our work and remove significant obstacles in applying this
we did not make for the presented results.
promising method.
3 This value was re-calculated for sample BDX16651 using the Tests on two K-feldspar samples showed results consis-
original data from Kreutzer et al. (2018) but excluding K concen- tent with IR-RF measurements with a photomultiplier tube
tration values ≥ 14 %. (PMT) for the sample TH0. However, our results also showed
Geochronology, 3, 299–319, 2021 https://doi.org/10.5194/gchron-3-299-2021You can also read