Uncertainties in the Emissions Database for Global Atmospheric Research (EDGAR) emission inventory of greenhouse gases - Recent
←
→
Page content transcription
If your browser does not render page correctly, please read the page content below
Atmos. Chem. Phys., 21, 5655–5683, 2021
https://doi.org/10.5194/acp-21-5655-2021
© Author(s) 2021. This work is distributed under
the Creative Commons Attribution 4.0 License.

Uncertainties in the Emissions Database for Global Atmospheric
Research (EDGAR) emission inventory of greenhouse gases
Efisio Solazzo1 , Monica Crippa1 , Diego Guizzardi1 , Marilena Muntean1 , Margarita Choulga2 , and
Greet Janssens-Maenhout1
1 European
        Commission, Joint Research Centre (JRC), Ispra (VA), 21027, Italy
2 Research
       Department, European Centre for Medium-Range Weather Forecasts
(ECMWF), Reading, RG2 9AX, United Kingdom

Correspondence: Efisio Solazzo (efisio.solazzo@ext.ec.europa.eu)

Received: 21 October 2020 – Discussion started: 5 November 2020
Revised: 19 February 2021 – Accepted: 27 February 2021 – Published: 14 April 2021

Abstract. The Emissions Database for Global Atmospheric             addressing the aggregation of uncertainties’ sectorial emis-
Research (EDGAR) estimates the human-induced emission               sions across GHGs and countries.
rates on Earth. EDGAR collaborates with atmospheric mod-               Globally, we find that the anthropogenic emissions cov-
elling activities and aids policy in the design of mitigation       ered by EDGAR for the combined three main GHGs for the
strategies and in evaluating their effectiveness. In these appli-   year 2015 are accurate within an interval of −15 % to +20 %
cations, the uncertainty estimate is an essential component,        (defining the 95 % confidence of a log-normal distribution).
as it quantifies the accuracy and qualifies the level of confi-     The most uncertain emissions are those related to N2 O from
dence in the emission.                                              waste and agriculture, while CO2 emissions, although re-
   This study complements the EDGAR emissions inventory             sponsible for 74 % of the total GHG emissions, account for
by providing an estimation of the structural uncertainty stem-      approximately 11 % of global uncertainty share. The sensi-
ming from its base components (activity data, AD, statis-           tivity to methodological choices is also discussed.
tics and emission factors, EFs) by (i) associating uncer-
tainty to each AD and EF characterizing the emissions of
the three main greenhouse gases (GHGs), namely carbon
                                                                    1   Introduction
dioxide (CO2 ), methane (CH4 ), and nitrous oxide (N2 O);
(ii) combining them; and (iii) making assumptions regard-           According to the latest release of the Emissions Database for
ing the cross-country uncertainty aggregation of source cate-       Global Atmospheric Research (EDGAR version 5; Crippa et
gories.                                                             al., 2019, 2020a), the global greenhouse gas (GHG) emis-
   It was deemed a natural choice to obtain the uncertainties       sions of carbon dioxide (CO2 ), methane (CH4 ), and ni-
in EFs and AD statistics from the Intergovernmental Panel           trous oxide (N2 O) due to anthropogenic activities summed to
on Climate Change (IPCC) guidelines issued in 2006 (with            48.1 Gt CO2 eq. 1 in the year 2015. In the same year, the share
a few exceptions), as the EF and AD sources and method-             of global CO2 eq. from non-CO2 GHG emissions (i.e. CH4
ological aspects used by EDGAR have been built over the             and N2 O) was approximately a quarter of this value. Mea-
years based on the IPCC recommendations, which assured              sures put in place to attenuate temperature rise and to mit-
consistency in time and comparability across countries. On          igate climate dynamics long-term changes have contributed
the one hand, the homogeneity of the method is one of the           to upholding the role of CH4 and N2 O. Their high warming
key strengths of EDGAR, on the other hand, it facilitates the
propagation of uncertainties when similar emission sources              1 CO
                                                                            2 eq. denotes CO2 equivalent emissions, which are com-
are aggregated. For this reason, this study aims primarily at       puted using the Global Warming Potential values from the Fourth
                                                                    Assessment Report (AR4) of the Intergovernmental Panel on Cli-
                                                                    mate Change (IPCC, 2007).

Published by Copernicus Publications on behalf of the European Geosciences Union.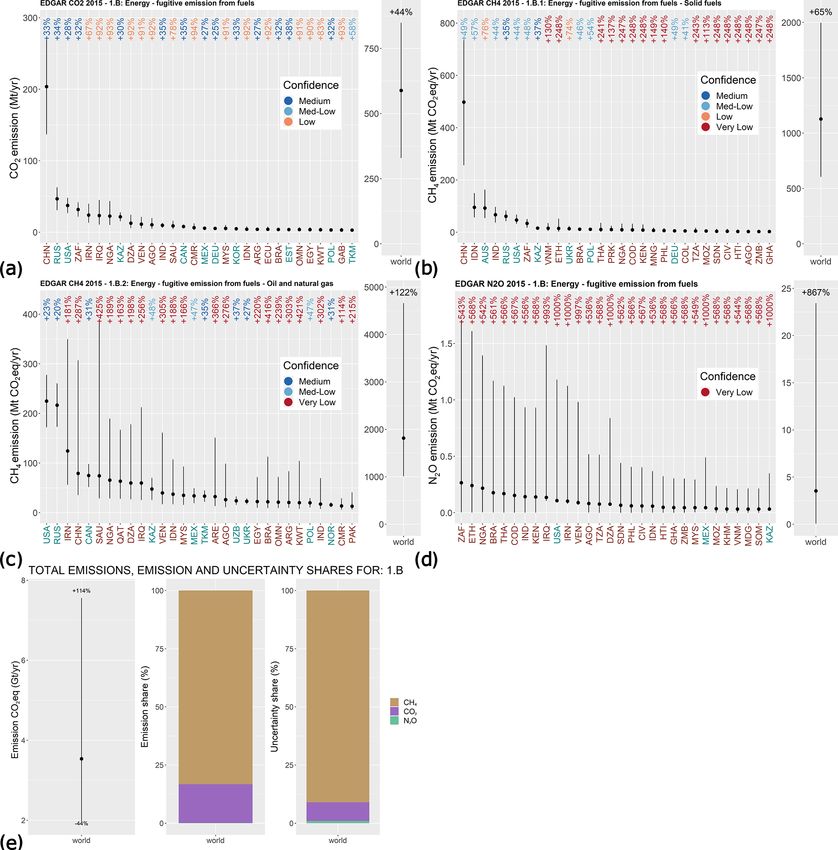
5656                                 E. Solazzo et al.: Uncertainties in the EDGAR emission inventory of greenhouse gases

potential compared with CO2 and their relatively shorter life-     (Muntean et al., 2021), trend analysis of global GHG emis-
time (on average CH4 persists in the atmosphere for approx-        sions, and communication with the policy makers and the
imately a decade, N2 O for over a century, and CO2 for more        public (Crippa et al., 2019, 2020a).
than 1000 years; NCR, 2010; Ciais et al., 2013) allow for
the shift from energy-related CO2 to other, more rapidly re-
sponsive, emission sources (Janssens-Maenhout et al., 2019;        2     Methodology
United Nations Environment Programme, 2019). At the same
time, while the uncertainty regarding fossil fuel CO2 emis-        EDGAR is a bottom-up model for estimating emissions, re-
sions is relatively small and, overall, well defined, the emis-    lying on a large spectrum of AD covering human activities
sion estimates for CH4 and N2 O are significantly more uncer-      with a high degree of detail. The AD are combined with EFs
tain. Hence, emission reduction measures issued by national        to yield the emission, per source, and country. For example,
plans highly depend on the degree of uncertainty of sectors        for combustion sources AD consist of fossil fuel consump-
that should contribute to reach a designed reduction target.       tion, whereas the EF is the amount of emission produced
As depicted in the example by Olivier (1998), a sector con-        per unit of activity. In this case, the emission is typically
tributing 10 % to the national reduction target may contribute     obtained simply by multiplying the AD by the EF, whereas
5 % or 15 % if that sector’s emission factor is ±50 % uncer-       other sources (e.g. waste) require more sophisticated models.
tain.                                                                 AD are primarily retrieved from international statistics,
   EDGAR aims to consolidate its position in supporting re-        complemented, when necessary, by information (e.g. trends)
search and new data/approach implementation in operational         from other sources, such as scientific literature and national
modelling as well as to become an independent tool that can        data. The quality, consistency, and comparability of AD
support policy makers with respect to monitoring and mitiga-       through time and space are the essential features defining the
tion strategies. Therefore, a reliable quantification of the un-   quality of an emission database.
certainties should have the same degree of importance as the          Default EFs compiled by IPCC Guidelines for National
consistency and comparability of the emissions. This study         Greenhouse Gas Inventories (IPCC, 2006a, b, hereafter re-
evolves in this direction by adding the uncertainty dimen-         ferred to as IPCC-06) are adopted by EDGAR for most
sion to the EDGAR database, thereby enhancing its value            sources and countries, supplemented with information from
with much needed information on reliability and promoting          scientific literature, and other references for specific pro-
its comparability with other datasets. Uncertainty reports are     cesses and/or countries. Janssens-Maenhout et al. (2019) pro-
relevant, among other applications, for the following:             duced a detailed description of data providers and method-
                                                                   ological choices for the GHG emissions of EDGAR. Further
  – scientific purposes, such as assessing the robustness of       information on the methodological aspects of data collection
    long-term emission trends, providing an a priori state         and sources are given by Crippa et al. (2020a).
    for comparison with independent top-down estimates                This study addresses the uncertainty of the anthropogenic
    (Bergamaschi et al., 2018), or aiding in network design        sources covered by EDGAR, which might not be exhaustive.
    (Super et al., 2020);                                          Therefore, nothing can be said about the uncertainty stem-
  – inter-comparison studies (Choulga et al., 2020; Petrescu       ming from source categories not currently encompassed by
    et al., 2020);                                                 the inventory (e.g. fugitive CO2 from low-temperature oxi-
                                                                   dation of coal mines, fugitive CH4 from managed wetlands,
  – assessing the feasible potential of mitigation strategies      and N2 O from crab ponds as part of aquaculture). Uncer-
    (e.g. Van Dingenen et al., 2018).                              tainty assessment of spatially distributed sources (emission
                                                                   grid maps) is outside the scope of this study.
   This study adds the uncertainty component to the EDGAR
data by devising methods to propagate the uncertainty intro-       2.1    Emissions and their uncertainties
duced by activity data (AD) and emission factors (EFs) to any
combination/aggregation of sources, countries, and GHGs.           The uncertainty in the AD (uAD ) collected by international
Methods, aggregation strategies, and dependencies are pre-         agencies or organizations (e.g. the Food and Agriculture Or-
sented and investigated. Analyses are conducted for the emis-      ganization, FAO, and the International Energy Agency, IEA)
sion year 2015 for CO2 , CH4 , and N2 O. The sensitivity           is of a statistical nature, stemming from incompleteness, rep-
to methodological choices is also discussed. The method-           resentativeness of sampling, the imputation of missing data,
ology presented here has already been applied to EDGAR             and extrapolation (e.g. projecting to future years; Rypdal and
and is discussed in the scientific literature in comparison to     Winiwarter, 2001; Olivier, 2002; IPCC-06). Other aspects to
other methods (Choulga et al., 2020) and to other invento-         take into consideration when compiling a global inventory
ries (Petrescu et al., 2020), with respect to an assessment        are the degree of wealth of a country as well as the year under
of the uncertainty of the EDGAR-FOOD inventory (Crippa             study. Less-developed countries and countries whose econ-
et al., 2021), and regarding application to specific sectors       omy has fully developed in recent years are more likely to

Atmos. Chem. Phys., 21, 5655–5683, 2021                                             https://doi.org/10.5194/acp-21-5655-2021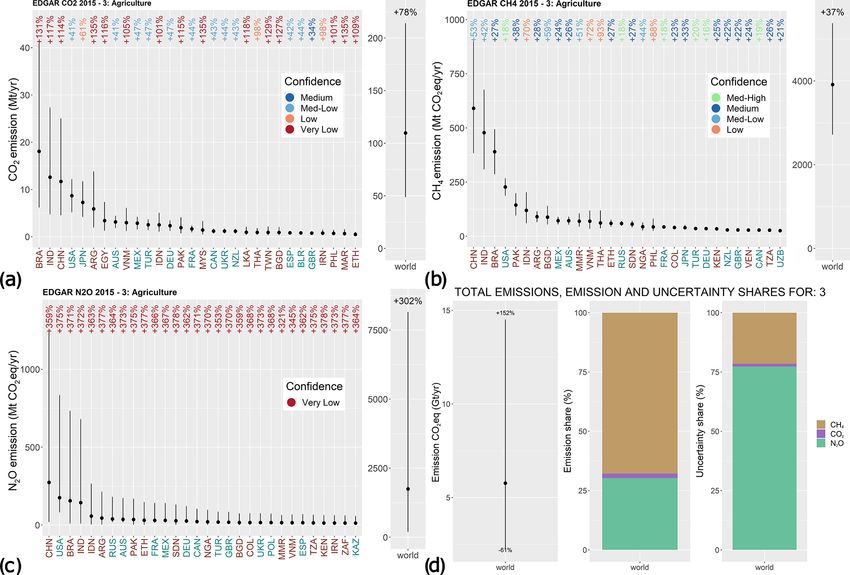
E. Solazzo et al.: Uncertainties in the EDGAR emission inventory of greenhouse gases                                         5657

have not yet developed a reliable statistical system. Similarly,   2.1.1   Uncertainty in activity data
the AD of countries with transitional economies are expected
to be more accurate for recent years (Janssens-Maenhout et         Table 1 summarizes the uncertainty for AD. When two values
al., 2019).                                                        are listed (e.g. ±5 %; ±10 %), the lower uncertainty value
   The uncertainty in the EF (uEF ) has many sources – for in-     (i.e. ±5 %) is assigned to countries with a developed econ-
stance, the degree of representativeness of the limited num-       omy, whereas the larger value (i.e. ±10 %) is assigned to
ber of observations underlying the EF (for the activity that is    countries with a less-developed economy or with an econ-
addressed), including the under-representativity of operating      omy in transition.
conditions, the inaccuracy of assumptions and/or of source            According to IPCC-06, uAD values for fuel combustion
aggregation (e.g. assumption of constancy in time), bias,          activities (mostly derived from IEA statistics) are estimated
variability, and/or random errors. Due to the non-statistical      with high confidence (5 % to 10 % uncertainty). The same
nature of uEF , its quantification eludes a general method-        uncertainty range is estimated for fugitive emissions (refer-
ological approach. The IPCC adopts a tiered approach for           ring to venting and flaring during oil and gas production).
estimating uncertainty, accounting for different levels of so-     uAD in the residential (10 % to 20 %) and in the aviation and
phistication (IPCC-06). Tier 1 uncertainties for default EFs       navigation (5 % to 25 %) sectors are assumed to be more con-
are based on expert judgement, which often offers a range          servative in order to account for the under-representativeness
of uncertainties for a given process, source, and/or fuel.         of the sample and for the difficulty in distinguishing between
Higher tiers (up to Tier 3) offer more elaborate estimates,        domestic and international fuel consumption (IPCC-06). For
based on localized measurements/ad hoc experiments on spe-         combustion processes using biofuels, the statistics are less
cific emission factors and for specific processes. Further, the    robust. Olivier (2002) suggests a uAD of 30 % for industrial-
model used to build emission inventories based on activity         ized countries and 80 % for less-developed countries (based
statistics may be too simplified (e.g. based on linearization      on IPCC-06 recommendations). Recent updates (Andreae,
and/or linear regression due to factors such as a poor under-      2019) confirm these estimates.
standing or lack of data), and it may not fully capture the           Uncertainty for some chemistry production processes and
complexity of a given emission process. These “model” er-          waste is calculated on the total emission rather than on the
rors are difficult to assess in isolation from other sources of    AD and EF separately, and this is discussed later. The waste
uncertainty and are generally attributed to uncertainties in       sector also utilizes a slightly more elaborate emission esti-
EFs (Rypdal and Winiwarter, 2001; Cullen and Frey, 1999).          mate model than the simple multiplication of AD and EF.
   This study reflects the methodological approach of              It assumes that emissions are not instantly released into the
EDGAR adopting default EFs – associated with Tier 1 un-            atmosphere, but are accumulated and continue to emit even
certainty estimates. The term “uncertainty”, in this study         several years after their disposal. The model for the waste
as in similar work (Rypdal and Winiwarter, 2001; Olivier,          sector depends on several parameters and assumptions (de-
2002; Janssens-Maenhout et al., 2019), is used in a rather         tailed in Sect. 3.1.5).
broad sense, lumping together all mentioned sources of er-
rors due to current limited knowledge with respect to dis-         2.1.2   Uncertainty of emissions factors
tinguishing among them. After IPCC introduced quantitative
                                                                   Tables 2 and 3 define the uncertainties of EFs for CO2 as
uncertainty in GHG inventories, the inventory uncertainty is
                                                                   well as for CH4 and N2 O respectively. The uncertainty of
usually expressed as two standard deviations, approximately
                                                                   EFs for CO2 is determined by the carbon content of the fuel
corresponding to 95 % confidence for a variable with a nor-
                                                                   and is relatively smaller and determined with a higher level
mal distribution (i.e. the uncertainty reflects the square root
                                                                   of accuracy than the uncertainty of EFs for CH4 and N2 O.
of the variance of the variable, multiplied by a coverage fac-
                                                                   Moreover, the uEF for CH4 and N2 O lumps several sources
tor of 2 to provide a confidence interval of 95 %).
                                                                   of uncertainties together, as mentioned earlier.
   Finally, the uncertainty tackled here shall not be confused
                                                                      As previously stated, uEF values are founded on Tier 1 esti-
with the variability stemming from a range (or ensemble) of
                                                                   mates from IPCC-06, which are based on expert judgements
estimates. The variability is used as proxy of structural un-
                                                                   and, as such, vary over wide ranges to account for a variety
certainty in the faith that a range of models using diverse un-
                                                                   of conditions. For instance, the uEF values for N2 O (agricul-
derlying assumptions would span the true uncertainty space.
                                                                   ture and energy sources in particular) clearly reflect the large
However, the estimates are seldom “diverse” as they stem
                                                                   temporal variability and spatial heterogeneity of these pro-
from same data/assumptions (sometimes different versions
                                                                   cesses.
of the same model are used), leading to overconfident esti-
mates (Solazzo et al., 2018).

https://doi.org/10.5194/acp-21-5655-2021                                            Atmos. Chem. Phys., 21, 5655–5683, 2021
5658                                  E. Solazzo et al.: Uncertainties in the EDGAR emission inventory of greenhouse gases

Table 1. Activity data (AD) statistical uncertainty (upper and lower limits define the 95 % confidence intervals of a normal distribution).
When two values are listed, the smaller range applies to industrialized countries, and the larger range applies to developing countries.

                            IPCC categories (IPCC, 2006b)                                   uAD (%)
                                                                                  Industrialized   Developing
                            1.A – Fuel combustion                                 ±5                      ±10
                            1.A.4 – Fuel combustion in residential sector         ±10                     ±20
                            1.A.3.a – Aviation (domestic)                         ±5                      ±100
                            1.A.3.a – Aviation (international)                    ±5                       ±5
                            1.A.3.d – Navigation                                  ±25                     ±25
                            1.A – Fuel combustion (biofuels)                      ±30                     ±80
                            1.B.1 – Fugitive emissions (solid fuel)               ±5                      ±10
                            1.B.2 – Fugitive emissions (gas and oil)              ±10                     ±20
                            2.B.5 – Carbide                                       ±5                       ±5
                            2.B.6 – Titanium dioxide
                            2.B.7 – Soda ash production
                            2.B.1 – Ammonia                                       ±2                       ±2
                            2.B.2 – Nitric acid
                            2.B.3 – Adipic acid
                            2.B.4 – Caprolactam, glyoxylic and glyoxylic acid
                            2.C.1 – Iron and steel                                ±10                     ±10
                            2.C.2 – Ferroalloy                                    ±10                     ±20
                            2.C.3 – Aluminium                                     ±2                       ±2
                            2.C.4 – Magnesium                                     ±5                       ±5
                            2.C.5 – Lead                                          ±10                     ±10
                            2.C.6 – Zinc                                          ±10                     ±10
                            2.A.1 – Cement                                              Included in uEF
                            2.A.2/2.A.4 – Lime/Limestone                          ±35                     ±35
                            2.A.3 – Glass                                         ±5                       ±5
                            2.D.2 – Non-energy use of fuels, lubricants/waxes     ±5                      ±15
                            3.A.1 – Enteric fermentation                          ±20                     ±20
                            3.A.2 – Manure management                             ±20                     ±20
                            3.C.1 – Biomass burning of crops                      ±50                     ±100
                            3.C.2 – CO2 emission from liming                      ±20                     ±20

2.2    Emission aggregation and uncertainty propagation                     – comparability, assuring that emissions are comparable
                                                                              across countries (e.g. source definitions, emission calcu-
The vast majority of EFs in EDGAR are based on IPCC                           lations, and emissions factors are the same across coun-
Tier 1 estimates (especially for combustion sources) in order                 tries).
to ensure the following:
                                                                        The adoption of comparable methods for source emissions
  – completeness, which is accomplished through the inclu-              and consistency implies that the uncertainties of the final
    sion of all relevant sources for a given year;                      emission estimates are interdependent, as they stem from the
                                                                        same methodology. When emissions are combined or aggre-
  – consistency, implying that the same methodology is ap-
                                                                        gated, this lack of independence cannot be neglected, and the
    plied through years for a given source;
                                                                        following assumptions are made:

Atmos. Chem. Phys., 21, 5655–5683, 2021                                                    https://doi.org/10.5194/acp-21-5655-2021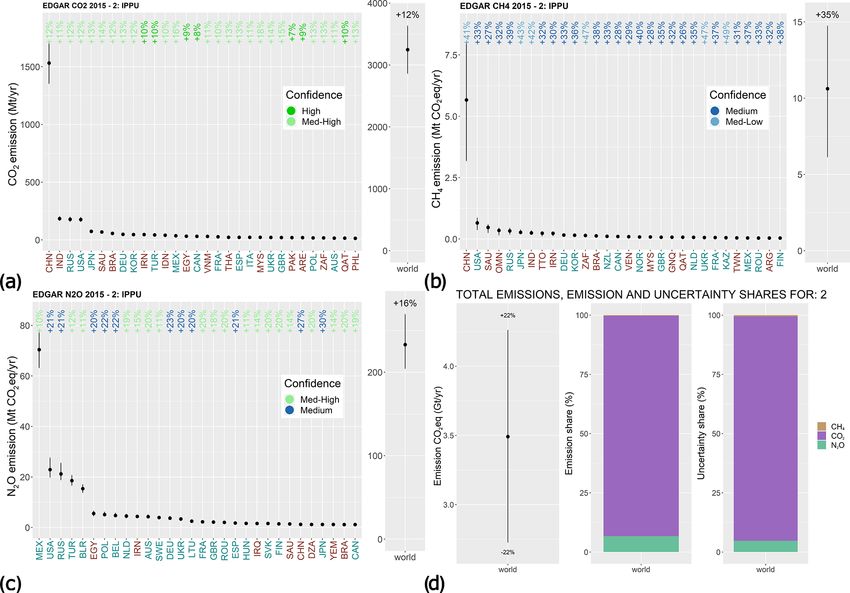
Table 1. Continued.
IPCC categories (IPCC, 2006b) uAD (%)
Industrialized Developing
3.C.3 – CO2 emission from urea fertilization ±20 ±20
3.C.4 – Synthetic fertilizers, animal manure applied to soils, crop residue, pasture ±20 ±20
3.C.5 – Indirect N2 O from managed soils [±50] [±50]
3.C.6 – Indirect N2 O from manure management [±50] [±50]
3.C.7 – Rice cultivation ±5 ±10
4.D.1 – Domestic wastewater For CH4
Population: ±5
https://doi.org/10.5194/acp-21-5655-2021
Per capita biochemical oxygen demand (BOD): ±30 %
Degree of utilization of treatment for income group: ±5; ±50
Income group: ±15
Correction factor for collected industrial BOD into sewers: ±20
For N2 O
Population: ±5
Annual per capita protein consumption: ±10
Fraction of nitrogen in protein: ±6
Utilization of large wastewater treatment plants: ±20
Adjustment for non-consumed protein: ±15
Adjustment for co-discharge of industrial nitrogen into sewers: ±20
4.D.2 – Industrial wastewater For CH4
Industrial production: ±25 %
The weight of degradable organics concentration per unit of product: −50 % to 100 %
For N2 O
As for domestic wastewater, ±34 %
E. Solazzo et al.: Uncertainties in the EDGAR emission inventory of greenhouse gases
4.C Solid waste Municipal solid waste
Country specific: ±30 %
Developed: ±10 %
Developing: −50 % to 100 %
Fraction of solid waste disposed
Country specific: ±10 %
Developed: ±30 %
Developing: −50 % to 100 %
5.A Indirect emission from NOx and NH3 ±20 ±20
5.B Other (includes burning among others) ±50 ±50
Source: IPCC (2000, 2006b) and elaborations by Olivier (2002). The values in square brackets are expert judgements (OJ).
Atmos. Chem. Phys., 21, 5655–5683, 2021
5659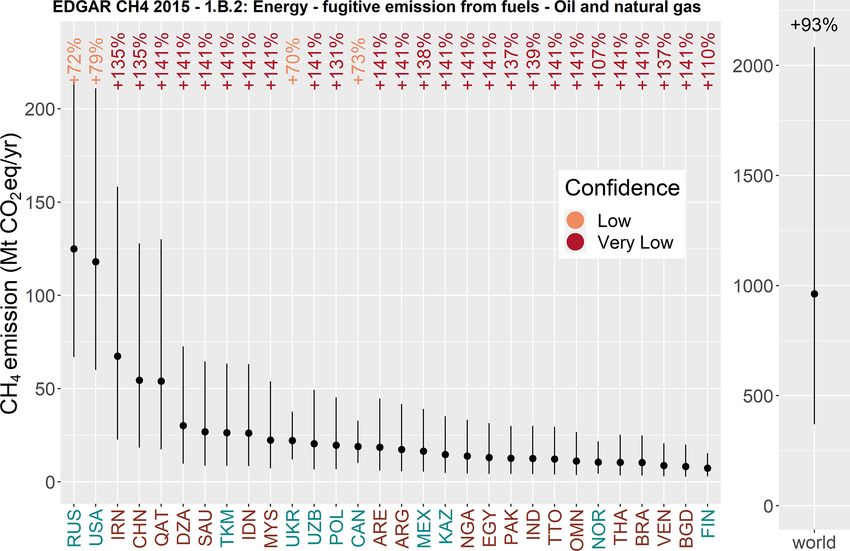
5660                                    E. Solazzo et al.: Uncertainties in the EDGAR emission inventory of greenhouse gases

Table 2. CO2 uncertainty in the emission factors (EFs) by fuel type (from Table 3.2.1 of IPCC, 2006b).

                  Fuel type                         Category    Description          Industrialized/         Developing
                                                                                    country specific     (Min; Max) [%]
                                                                                    (Min; Max) [%]
                  Combustion sectors
                  Motor gasoline                    1.A         Fuel combustion            −2.6; 5.3          −5.3; 5.3
                  Aviation gasoline                 1.A         Fuel combustion            −3.6; 4.3          −4.3; 4.3
                  Gas/diesel oil                    1.A         Fuel combustion           −2.0; 0.95          −2.0; 2.0
                  Liquefied petroleum gas (LPG)     1.A         Fuel combustion            −2.3; 4.0          −4.0; 4.0
                  Kerosene                          1.A         Fuel combustion            −2.0; 3.0              −3.0
                                                                                                                   3.0
                  Lubricants, naphta, white         1.A         Fuel combustion            −1.9; 2.6          −1.9; 2.6
                  spirit, non-specified             1.A         Fuel combustion            −1.5; 1.5          −1.5; 1.5
                  petroleum products, other         1.A         Fuel combustion               −3; 3              −3; 3
                  hydrocarbon, paraffin
                  waxes, refinery feedstocks’
                  soda
                  Natural gas                       1.A         Fuel combustion            −3.2; 3.9          −3.9; 3.9
                  Natural gas liquids               1.A         Fuel combustion            −9.2; 9.6          −9.2; 9.6
                  Anthracite                        1.A         Fuel combustion            −3.8; 2.7          −3.8; 2.7
                  Biodiesel and biogasoline         1.A         Fuel combustion         −15.5; 19.1         −15.5; 19.1
                  Blast furnace gas                 1.A         Fuel combustion         −15.8; 18.5         −15.8; 18.5
                  Additives/blending                1.A         Fuel combustion            −1.5; 1.5          −1.5; 1.5
                  components                        1.A         Fuel combustion            −3.0; 3.0          −3.0; 3.0
                  Crude oil                         1.A         Fuel combustion            −1.5; 1.5          −1.5; 1.5
                  Bitumen                           1.A         Fuel combustion         −15.5; 18.1         −15.5; 18.1
                  Sub-bituminous coal               1.A         Fuel combustion            −3.4; 4.0          −3.4; 4.0
                  Brown coal briquettes/            1.A         Fuel combustion           −14.5; 18           −14.5; 18
                  peat briquettes
                  Brown coal                        1.A         Fuel combustion             −10; 14             −10; 1
                  Other bituminous coal             1.A         Fuel combustion            −7.7; 6.8          −7.7; 6.8
                  Charcoal                          1.A         Fuel combustion             −25; 25            −25; 25
                  Ethane                            1.A         Fuel combustion           −8.3; 11.3         −8.3; 11.3
                  Biogas                            1.A         Fuel combustion             −50; 50            −50; 50
                  Gas coke                          1.A         Fuel combustion             −16; 17            −16; 17
                  Gas works gas                     1.A         Fuel combustion             −16; 22            −16; 22
                  Residual fuel oil                 1.A         Fuel combustion            −2.4; 1.8          −2.4; 1.8
                  Municipal waste (renew)           1.A         Fuel Combustion                −7; 7             −7; 7

                  Bagasse in pumped storage         1.A         Fuel Combustion                −7; 7             −7; 7
                  of electricity

Atmos. Chem. Phys., 21, 5655–5683, 2021                                                   https://doi.org/10.5194/acp-21-5655-2021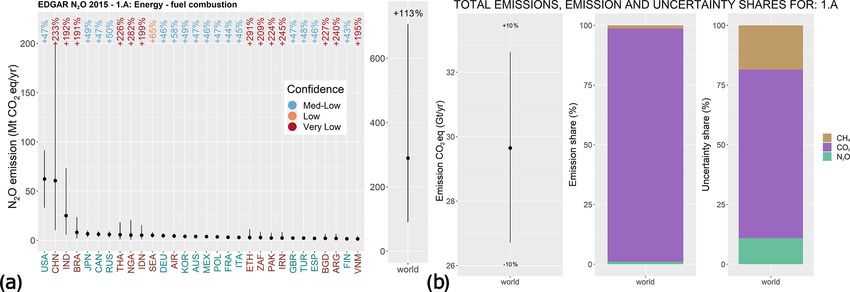
E. Solazzo et al.: Uncertainties in the EDGAR emission inventory of greenhouse gases                                             5661

Table 2. Continued.

        Fuel type/Process              Category     Description                               Industrialized/       Developing
                                                                                             country specific   (Min; Max) [%]
                                                                                             (Min; Max) [%]
        Heat output from non-          1.A          Fuel combustion                                    −7; 7            −7; 7
        specific manufacturing gases
        Primary solid biomass in       1.A          Fuel combustion                                 −16; 17           −16; 17
        fuel combustion
        petroleum
        Oil shale                      1.A          Fuel combustion                                 −16; 17           −16; 17
        Petroleum coke                 1.A          Fuel combustion                                 −15; 18           −15; 18
        Coke oven coke                 1.A          Fuel combustion                             −10.5; 11.2        −10.5; 11.2
        Coke oven gas                  1.A          Fuel combustion                                 −16; 22           −16; 22
        Coking and hard coal           1.A          Fuel combustion                                  −7.7; 7           −7.7; 7
        Coal tar                       1.A          Fuel combustion                             −0.14; 11.4        −0.14; 11.4
        Crude/natural gas liquids/     1.A          Fuel combustion                                    −3; 3            −3; 3
        refinery feedstocks
        Gasoline jet fuel              1.A          Fuel combustion                                −2.6; 4.3         −2.6; 4.3
        Kerosene jet fuel              1.A          Fuel combustion                                −2.5; 4.0         −2.5; 4.0
        Industrial waste               1.A          Fuel combustion                                 −20; 32           −20; 32
        Municipal waste                1.A          Fuel combustion                                 −20; 32           −20; 32
        Oxygen steel furnace gas       1.A          Fuel combustion                                 −15; 18           −15; 18
        Patent fuel                    1.A          Fuel combustion                                 −15; 18           −15; 18
        Peat                           1.A          Fuel combustion                                −5.7; 1.9         −5.7; 1.9
        Refinery gas                   1.A          Fuel combustion                               −16.3; 20          −16.3; 20
        Non-combustion sectors
        Fuel exploitation              1.B.2.a.ii   Venting and flaring during oil and gas          −50; 50           −75; 75
                                                    production, oil transmission,
                                                    transport by oil trucks
        Gasoline, diesel, LPG,         1.B.1.c      Fuel transformation coke ovens                  −50; 50           −50; 50
        naphta, white spirit,          1.B.2.b      Fuel transformation of gaseous fuels:         −100; 100         −100; 250
        natural gas, anthracite,                    non-specified transformation
        biodiesel, blast furnace       2.D.2        Other non-energy use of fuels in              −100; 100         −100; 100
        gas, crude oil, bitumen,                    industry
        brown coal briquettes/peat     2.C.1        Blast furnaces                                  −25; 25           −25; 25
        briquettes,other bituminous
        coal, ethane,gas coke, gas
        works gas,residual fuel oil,
        renewables wastes

https://doi.org/10.5194/acp-21-5655-2021                                                 Atmos. Chem. Phys., 21, 5655–5683, 2021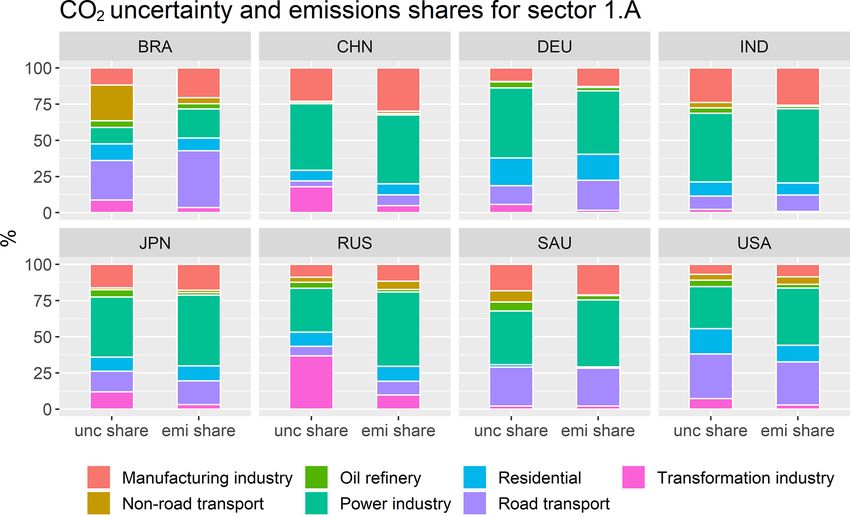
5662                                 E. Solazzo et al.: Uncertainties in the EDGAR emission inventory of greenhouse gases

Table 2. Continued.

         Fuel type/Process           Category       Description                                Industrialized/       Developing
                                                                                              country specific   (Min; Max) [%]
                                                                                              (Min; Max) [%]
         Industrial processes        2.A.1          Cement                                             −11; 11         −61; 61
                                     2.A.2          Lime                                                −2; 2           −2; 2
                                     2.A.4.d        Limestone                                           −3; 3           −3; 3
                                     2.B.1          Ammonia                                             −7; 7           −7; 7
                                     2.B.2          Titanium                                            −7; 7           −7; 7
                                     2.B.5          Silicon, calcium                                   −10; 10         −10; 10
                                     2.B.4          Ethylene, methanol                                 −30; 30         −30; 30
                                     2.B.4          Vinyl                                              −50; 20         −50; 20
                                     2.B.4          Carbon black, urea                                 −15; 15         −15; 15
                                     2.C.1, 2.C.2   Steel, ferroalloys                                 −25; 25         −25; 25
                                     2.C.3          Aluminium                                          −10; 10         −10; 10
                                     2.C.3          Magnesium                                          −50; 50         −50; 50
                                     2.C.5, 2.C.6   Lead, zinc                                         −50; 50         −50; 50
                                     2.A.3          Glass                                              −60; 60         −60; 60
         Non-energy use of           2.D.2          Petroleum jelly, paraffin waxes, and           −100; 100         −100; 100
         lubricants/waxes                           other waxes
         Solvents                    2.D.3          Solvents and other product use                     −25; 25         −25; 25
         CO2 from urea, dolomite,    3.C.2          C in urea fertilizer applied                       −50; 50       −100; 100
         and limestone application   3.C.3
         Oil/coal fires              5.B            Oil/coal fires                                 −100; 100         −100; 100
         Waste incineration          4.C.1          Waste incineration without energy               −40; 40           −40; 40
                                                    recovery

  a. the emission uncertainty (uEMI ) is the sum of the                     and the lower one is assigned to countries with a more
     squares of the uncertainty of AD (uAD ) and the uncer-                 robust statistical infrastructure.
     tainty of EF (uEF ), see Eq. (1);
                                                                      Conditions (a) and (b) match the suggestion of the uncer-
  b. uncertainties of different source categories are uncorre-        tainty chapter of the IPCC guidelines (IPCC-06, chap. 3),
     lated (e.g. waste and agriculture);                              whereas the latter two conditions are more cautious formu-
                                                                      lations of the error propagation to account for covariances.
  c. subsectors of a given emission category for CH4 and              More explicitly, the uncertainty of the emission, uEMI , due to
     N2 O are fully correlated, and the uncertainty of the sum        multiplying AD by EF is calculated as
     is, therefore, the sum of the uncertainties;                             q
                                                                      uEMI = u2EF + u2AD .

 d. when dealing with CO2 , full correlation is assumed for                                                                       (1)
    energy combustion sources sharing the same emission                  The uncertainty of the emission, uEMI , due to adding emis-
    factor (fuel dependent);                                          sions is calculated as
  e. aggregated emissions from same categories but differ-
                                                                               rP                    2
                                                                                     EMI, i · uEMI,i
     ent countries are assumed to be fully correlated, unless                      i
     the emission factor is country-specific, or derived from         uEMI =           P                   .                      (2)
                                                                                            |EMI, i|
     higher tiers (i.e. emissions are not derived from a default                        i
     EF defined by IPCC but are retrieved by other sources
     and are specific to that country or process);                    This basically equates to the squared sum of the uncertainty
                                                                      of each emission process normalized by the sum of emis-
  f. when uncertainty is provided as a range (e.g. for the            sions, which assumes that all emission sources are uncor-
     energy sector, IPCC-06 recommends that the CH4 EFs               related (IPCC-06). However, in general, the variance of the
     are treated with an uncertainty ranging from 50 % to             sum of any two terms x1 and x2 with variances of σ1 and σ2 is
     150 %), the upper bound of the range is assigned to                2 = σ 2 + σ 2 + 2cov(x , x ). As the covariance can be ex-
                                                                      σsum      1   2            1 2
     countries with a less-developed statistical infrastructure       pressed as 2cov(x1 , x2 ) = 2rσ1 σ2 , where r is the coefficient

Atmos. Chem. Phys., 21, 5655–5683, 2021                                                     https://doi.org/10.5194/acp-21-5655-2021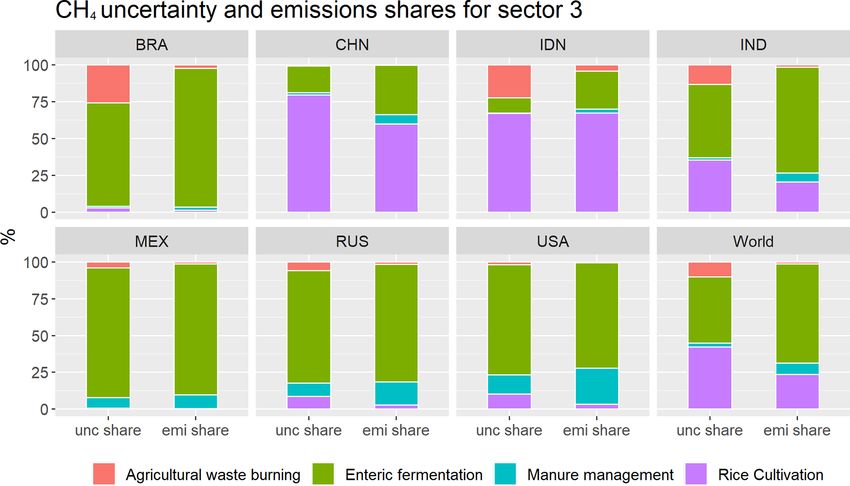
Table 3. Uncertainty in emission factors (EFs) for CH4 and N2 O defined by IPCC sectors and corresponding EDGAR sectors. OJ denotes expert judgement, Surf denotes surface, Und
                                           denotes underground, Abandon denotes abandoned, Prod denotes production, Trans denotes transmission, and MCF refers to the methane correction factor.

                                            IPCC (2006b)                            Uncertainty CH4 (%)                                  Uncertainty N2 O (%)
                                            1.A                                         ±50; ±150                         A −10 to 1000                OJ
                                            Aviation                                    −57 to 100                        uncertainty range from       ±50 (industrialized)
                                            Navigation                                    ±50                              1                           ±150 (developing)
                                                                                                                          10 of the mean
                                            Road transport                                ±40                             value to 10 times the        ±50 (country specific)
                                            Fuel combustion                             ±30; ±80                          mean value (IPCC, 2006b)
                                            (biofuels)
                                            1.B.1 – Fugitive       Surf          Und             Abandon
                                            emissions from solid   ±66.7         ±50             −50 to 100                                  −10 to 1000
                                                                   ±200          ±100

https://doi.org/10.5194/acp-21-5655-2021
                                            fuels                                                −66 to 200
                                                                   ±50           ±50             −50 to 50
                                            1.B.2.a – Fugitive     Prod          Trans           Tanker
                                            emissions from oil     ±75           ±100            ±50          OJ: ±100                       −10 to 1000
                                                                   −67 to 150    −50 to 200      −50 to 200
                                                                   ±50           ±100            ±50
                                            1.B.2.b – Fugitive               Prod                Trans
                                            emissions from                   ±25                 ±100                                        −10 to 1000
                                            natural gas                      ±75                 −40 to 500
                                                                             ±25                 ±100
                                            2. Nitric acid                                                                                       ±20
                                            Caprolactam                                                                                          ±40
                                            Glyoxylic                                      ±10                                                   ±10
                                            Anaesthesia/aerosol
                                            spray
                                            Carbide                                                                                              ±10
                                                                                                                                                                                                                             E. Solazzo et al.: Uncertainties in the EDGAR emission inventory of greenhouse gases

                                            Methanol                                 −80 % to +30 %
                                            Carbon black                                  ±85 %
                                            Ethylene oxide                                ±60 %
                                            Ethylene                                       ±10
                                            3.A.1 – Enteric                             ±30; ±50
                                            fermentation
                                            3.A.2 – Manure                                 ±30                                                ±50; ±100
                                            management

Atmos. Chem. Phys., 21, 5655–5683, 2021
                                                                                                                                                                                                                             5663
E. Solazzo et al.: Uncertainties in the EDGAR emission inventory of greenhouse gases
https://doi.org/10.5194/acp-21-5655-2021
Table 3. Continued.
IPCC (2006b) Uncertainty CH4 (%) Uncertainty N2 O (%)
3.C.7 – Rice cultivation A −40 to +70 uncertainty for default emission factors
in addition to uncertainty in water regimes:
−20 to +26 for irrigated areas;
0 % for upland areas;
−22 to +26 for rainfed and deep water
3.C.1 – Non-CO2 burning OJ: ±50; ±150 according to uncertainty in combustion sector OJ: ±50; ±150 according
cropland to uncertainty in
combustion sector
3.C.4 – Synthetic fertilizers;
animal manure applied ±70 (±65 for pasture);
to soils; crop residue; ±200
pasture
Indirect N2 O from managed soils ±70; ±200
3.C.6 – Indirect N2 O from ±50; ±150
manure management
4.C DOC and DOCf: 20 % (CS:10)
CH4 correction factor: ±30 N2 O emissions from incineration and composting. No
F: ±0.5 indications from IPCC. Same as for CH4
R: ±10; ±50
Half-life: ±50 (depends on type of waste and climate zone)
Atmos. Chem. Phys., 21, 5655–5683, 2021
4.D.1 – Domestic Bo and uncertainty in MCF technology (within the range 0–1): ±30 %
wastewater Latrines (BLA, ILA, LAT): ±50 %
Septic (SEP): 0 % ±90; ±4900
Lagoons: ±30 %
S2R, S2W: 30 %
4.D.2 – Industrial Bo and uncertainty in MCF technology (within the range 0–1): ±30 %
wastewater Untreated: 100 Same as 4.D.1
Treated: ±30
5.A – Indirect emission ±100
from NOx and NH3
5664E. Solazzo et al.: Uncertainties in the EDGAR emission inventory of greenhouse gases 5665
of correlation, when r = 1 (full correlation), the variance of ensure that the uncertainty of emitting sources sharing the
the sum becomes the linear sum of the two variances: same methodology for estimating the EF is propagated in the
q case of aggregation. If the same methodology is applied to
σsum = σ1 + σ2 ≥ σ12 + σ22 . (3) estimate the emission for a given category and for a group of
countries, the correlation is kept when calculating the total
| {z } | {z }
correlated r=1 uncorrelated r=0
emission of that group of countries for that category. Sim-
Therefore, for fully correlated variables, the uncertainty of ilar assumptions were adopted by studies such as Bond et
their sum is simply the sum of their uncertainties. al. (2004) and Bergamaschi et al. (2015), although for differ-
When uncertainties are larger than 100 %, Eq. (2) tends to ent inventories. This is a direct implication of the consistency
underestimate the uncertainty and a correction factor FC is and cross-country comparability of EDGAR, which adopts
recommended (IPCC-06), so that the uncertainty in the emis- Tier 1 EFs defined by IPCC-06 for most of the inventory. By
sion is contrast, if each country follows diverse methods to estimate
the EFs for a given source category, uEF stemming from that
uEMI,C = uEMI · FC methodology does not co-vary when calculating the total of
"
−0.72 + 1.0921uEMI − 1.63 × 10⁻³ u2EMI + 1.11 × 10⁻⁵ u3EMI
#2 that category – thus Eq. (2) holds. Some further considera-
FC = , (4) tions are as follows:
uEMI
where uEMI,C is the correction to be applied to the uncer- – The assumption of the source or country correlation is
tainty estimated from error propagation. Eq. (4) is used for the main difference between the uncertainty estimated
multiplicative or quotient terms in the range uEMI ∈ [100 %, in this study and the uncertainty reported by studies
230 %] (Eq. 3.3, IPCC-06, Vol. 1, chap. 3). The effect of FC such as Petrescu et al. (2020) for EU27+UK (the 27
is to return larger uncertainties (see e.g. Choulga et al., 2020). European countries and the UK), where no correlation
The use of FC is based on the work by Frey (2003) to account was assumed, although not all countries developed in-
for the error introduced in the approximation of the analyti- dependent methods to estimate EFs.
cal method compared with a fully numerical one (based on – The choice of assuming “full” correlation (i.e. a correla-
Monte Carlo analysis). The error in the approximation in- tion coefficient of one) is conservative in the sense that
creases with the uncertainty; thus, the correction factor FC is it returns the upper bound of uEMI ; this choice is mo-
needed when dealing with large uncertainties (Frey, 2003). tivated by the fact that it simplifies the calculation (see
The analysis presented in this study takes the correction fac- Eq. 3) and that there are no indications that there is a
tor FC into account (unless specifically indicated), and for better method for estimating r.
simplicity, the “C” is dropped in uEMI,C to yield uEMI .
This study assumes that uncertainties are normally dis- – EDGAR does include country-specific EFs for some
tributed, unless specifically indicated by IPCC-06. The distri- processes and countries. These are retrieved from the
bution is transformed to log-normal after the aggregation to scientific literature or derived from technical collabora-
avoid the emissions taking negative, unphysical values when tions and through the continuous updates over the last
uncertainty is large. Hence, the probability distribution func- 2 decades (e.g. EFs for cement production are com-
tion (PDF) is transformed to log-normal with the upper and puted including information on country-specific clinker
lower uncertainty range defined according to IPCC-06: fractions; EFs for landfills consider the country-specific
waste composition and recovery; EFs for the enteric fer-
1 mentation of cattle include country- or region-specific
uEMI = exp ln µg ± 1.96 ln σg − 1, (5)
EMI information on milk yield, carcass weight, and many
other parameters). These instances are flagged in our
where µg and σg are the respective geometric mean and geo-
methodology, and the uEF is not propagated when ag-
metric standard deviation about EMI, the mean emission.
gregating these sources.
According to IPCC-06, the contribution to variance (var
shares ) of a specific emission process (s) emitting (EMIs ), to
the uncertainty of the total emissions EMItot is calculated as 3 Uncertainty in emission sectors
u2EMI,s · EMI2s 3.1 Emissions from CO2 , CH4 , and N2 O
var shares = . (6)
EMI2tot
3.1.1 Power industry sector
2.2.1 Additional remarks
IPCC sector 1.A includes the EDGAR categories related
The assumption of correlation between subcategories (or fuel to combustion of fossil and biofuels for energy pro-
for energy sectors emitting CO2 ) and between countries for duction (ENE), manufacturing (IND), energy for build-
the same category (or fuel for energy CO2 ) is introduced to ings (RCO), oil refineries and the transformation indus-
https://doi.org/10.5194/acp-21-5655-2021 Atmos. Chem. Phys., 21, 5655–5683, 20215666 E. Solazzo et al.: Uncertainties in the EDGAR emission inventory of greenhouse gases
Table 4. Share of GHG emissions (derived from CO2 , CH4 , and Thus, the share of emissions for each subcategory (manufac-
N2 O expressed in CO2 eq. ) of developing and industrialized coun- turing, transformation and power industry, oil refinery, resi-
tries for sector 1.A based on EDGAR emissions for the year 2015. dential heating, and road and non-road transport) is mirrored
by the share each category contributes to the sector uncer-
Sector 1.A Developing Industrialized tainty (Fig. 2), although with some notable exceptions for
CO2 44.0 % 53.9 % non-road transport in Brazil (large share of highly uncertain
N2 O 0.4 % 0.3 % domestic aviation and inland water shipping) and the trans-
CH4 1.11 % 0.2 % formation industry in Russia (share of emission and uncer-
tainty of ∼ 10 % and ∼ 37 % respectively).
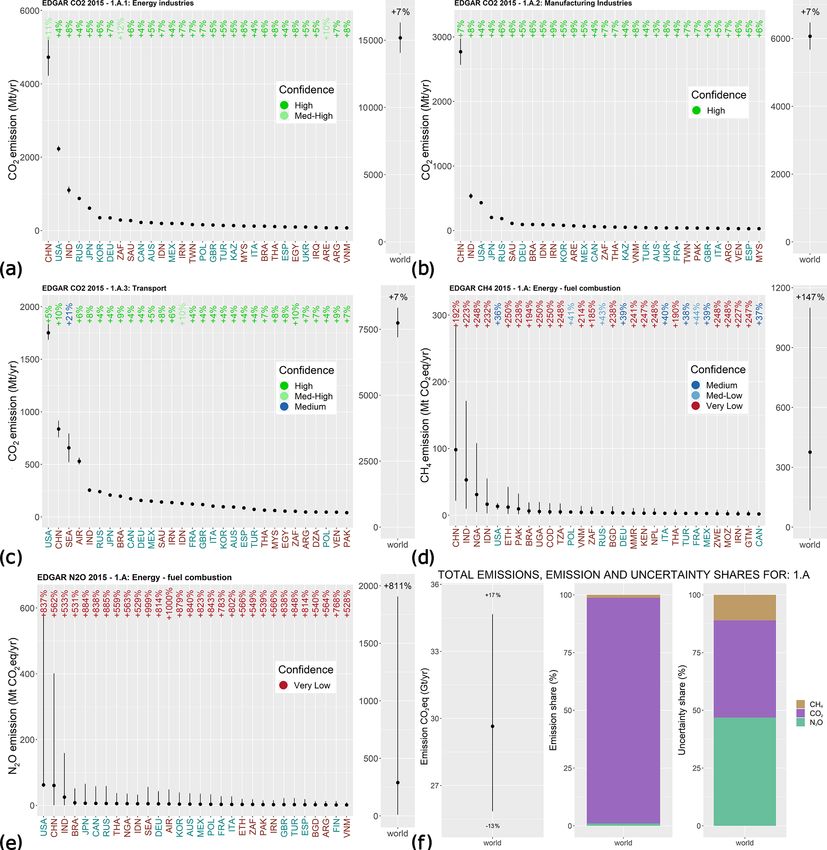
The very low confidence in N2 O emissions is responsi-
ble for almost 50 % of world’s total uncertainty (Fig. 1f), al-
try (REF and TRF respectively), aviation (TNR aviation), though N2 O only accounts for a minor portion of total emis-
shipping (TNR ship), and road transport (TRO). Emissions sions in this sector (less than 1 %). According to studies such
from biofuel burning (e.g. wood) in sector 1.A are considered as Lee et al. (2013), the suggested IPCC-06 uncertainty for
carbon neutral and are calculated for CH4 and N2 O only. power plant emission of N2 O might be too high (the authors
EDGAR adopts AD statistics of fossil fuel combustion report a range from −11.43 % to +12.86 % for a combined-
compiled by the IEA (IEA, 2017) for developed and develop- cycle power plant in Korea). An alternative uEF estimation
ing countries, integrated with data from the US EIA (2018) for N2 O in the fossil fuel combustion sector is set in the
for biofuels. range from ±50 % (developed countries) to ±150 % (coun-
The share of GHG emissions from industrialized and de- tries with an economy under development). This choice also
veloping countries is reported in Table 4 to aid later inter- reflects a previous uncertainty estimation by Olivier (2002).
pretation of the uncertainty shares. In fact, in countries with The N2 O emission uncertainty and the N2 O contribution
a developed economy (Table S1 in the Supplement) energy to uncertainty in sector 1.A are shown in Fig. 3.
statistics are considered to have lower uncertainty than in The uncertainty distribution (Fig. 3) and relative contri-
countries under development (Olivier 2002). IPCC suggests bution reflect the weight of the component GHGs, and the
a uAD for the power industry ranging between 5 % and 10 %. world’s total uncertainty (10 %) is only slightly larger than
We have assigned 5 % to industrialized countries and 10 % the uncertainty of CO2 (7 %; Fig. 1a–c). Adopting the uEF of
uncertainty to developing countries to account for less robust 50 %–150 % for N2 O in sector 1.A reflects the large uncer-
census capability. IPCC-06 provides fuel-dependent uEF val- tainty associated with this sector and allows comparability or
ues for CO2 (Table 2), which have been mapped to match aggregation with other gases (Fig. 3b).
the fuels in each EDGAR emission category. The uEF values
for CO2 are relatively small, as reflected by the (well-known) 3.1.2 Fugitive emissions from coal, oil, and natural gas
carbon content of the fuel.
For CH4 and N2 O, EFs are more uncertain than for CO2 . Fugitive emissions from solid fuels (mainly coal, 1.B.1) and
IPCC-06 suggests a wide range of uEF values for the whole from oil and natural gas (1.B.2) are covered by the REF, TRF,
energy sector, ranging between 50 % and 150 % for CH4 and and PRO (fuel exploitation) EDGAR categories. As pointed
1
between 10 and 10 times the mean emission value for N2 O. out in IPCC-06, uncertainty in the fugitive emissions sector
These estimates are provided by expert judgement based on arises from applying the same EF to all countries (Tier 1 ap-
the reliability of current estimates. The reasons for such high proach) and from uncertainty in the emission factors them-
uncertainty have been mentioned previously (i.e. lack of un- selves.
derstanding of emission processes and of relevant measure- The AD for coal statistics are a collection of the following
ments, the uncertainty in measurements, and poor represen- products (the full details are provided by Janssens-Maenhout
tativeness of the full range of operating conditions). EFs for et al., 2019, and references therein): the IEA (2017)
biofuel combustion are highly uncertain, with the uncertainty for the exploration of gas and oil; UNFCCC (2018)
estimated to range from 30 % (Andreae and Merlet, 2001) to and CIA (2016) for transmission and distribution; and
80 % (Olivier, 2002). Recently, Andreae (2019) reviewed uEF IEA (2017) for venting and flaring, complemented with data
to less than 20 % (6 %–18 % for CH4 from the major burning from GGFR/NOAA (2020) and Andres et al. (2014). Accord-
categories, savannah, forests, and biofuel). The uncertainty ing to Olivier (2002), the uAD for sector 1.B lies within the
of processes using biofuels is calculated separately and then range from ±5 % to ±10 %, which is aligned with the esti-
combined with the fossil fuel uncertainty, assuming no cor- mates provided by IPCC-06.
relation; see Eq. (2). Fugitive emissions from solid fuels (1.B.1) in EDGAR v4
Emissions of CO2 account for over 90 % of world’s to- and v5 are dealt with by considering emission factors from
tal GHG emissions from fuel combustion and are assessed IPCC-06, supplemented with the EEA (2013) guidebook for
with high degree of confidence (Fig. 1a–c) due to the accu- coal and UNFCCC (2018). For oil and natural gas (1.B.2), we
racy of uEF values reflecting the carbon content of the fuel. use information from the IPCC-06, supplemented with data
Atmos. Chem. Phys., 21, 5655–5683, 2021 https://doi.org/10.5194/acp-21-5655-2021E. Solazzo et al.: Uncertainties in the EDGAR emission inventory of greenhouse gases 5667 Figure 1. GHG emissions from top emitters and the world for sector 1.A (energy from fuel combustion): (a) CO2 from energy industries; (b) CO2 from manufacturing industries; (c) CO2 from transport; (d) CH4 from fuel combustion; (e) N2 O from fuel combustion; (f) the world total emission uncertainty and the world emission and uncertainty shares. The country names are colour-coded according to their classification (cyan denotes industrialized, and red denotes developing). Confidence levels are given in the following ranges: high (0 %, 10 %]; medium-high (10 %, 20 %]; medium (20 %, 40 %]; medium-low (40 %, 60 %]; low (60 %, 100 %]; and very low > 100 %. (Country codes are given in Table S1.) from UNFCCC (2014). While gas transmission through large for reporting countries (and the average value as default for pipelines is characterized by the relatively small country- all other countries) (Janssens-Maenhout et al., 2019). specific emission factors of Lelieveld et al. (2005), much IPCC-06 provides a detailed synthesis of the uncertainty larger and material-dependent leakage rates of IPCC-06 were associated with EFs for sectors 1.B.1 and 1.B.2, distin- assumed for gas distribution. For venting processes, the EFs guishing between developing and developed countries (Ta- for CH4 are based on country-specific UNFCCC (2014) data bles 4.2.4 and 4.2.5 of IPCC-06, chap. 4). The uEF is the https://doi.org/10.5194/acp-21-5655-2021 Atmos. Chem. Phys., 21, 5655–5683, 2021
5668                                  E. Solazzo et al.: Uncertainties in the EDGAR emission inventory of greenhouse gases

Figure 2. The CO2 uncertainty and emission shares for EDGAR emission sectors under IPCC category 1.A for Brazil, China, Germany,
India, Japan, Russia, Saudi Arabia, and the USA.

Figure 3. (a) The N2 O emissions from top emitters and the world for sector 1.A (energy from fuel combustion) when uncertainties are set
in the range from ±50 % (industrialized countries) to 150 % (developing countries). (b) The world total emission uncertainty and the world
emission and uncertainty shares. The country names are colour-coded according to their classification (cyan denotes industrialized, and red
denotes developing). Confidence levels are given in the following ranges: high (0 %, 10 %]; medium-high (10 %, 20 %]; medium (20 %,
40 %]; medium-low (40 %, 60 %]; low (60 %, 100 %]; and very low > 100 %. (Country codes are given in Table S1.)

same for CO2 and CH4 , whereas it is larger for N2 O. A sum-            various governmental agencies (e.g. the number of gas pro-
mary of the uncertainty ranges is provided in Table 3.                  duction wells, miles of pipelines, or the number of gas pro-
   Uncertainties in the 1.B.1 sector depend on the type of              cessing plants), other activity data (e.g. storage tank through-
mining activity: surface (Surf), underground (Und), or aban-            put, the number of various types of pneumatic controllers,
doned (Abandon). The uEF values for these sectors can be                and reciprocating engines) are more uncertain. As reported
rather large (> 100 %), as detailed in Table 3, according to            by the EPA (2017b), “petroleum and gas infrastructure con-
IPCC-06 and in line with Olivier (2002). For 1.B.2, the dis-            sist of millions of distinct emission sources, making mea-
tinction is made between leakage during production (Prod),              surement of emissions from every source and component
transmission and distribution (Trans), and venting/flaring              practically unfeasible”.
(Vent). The uncertainty is estimated to be as large as 3 times             The fugitive emission sector is dominated by CH4 emis-
the average emission value in some instances (Table 3) for              sions, and this is reflected in the contribution to the total un-
CH4 and CO2 and up to 1000 % for flaring N2 O emission. We              certainty of GHG emissions from sector 1.B (Fig. 4e). The
note that while some AD are known or retrievable through                upper world uncertainty estimate exceeds 110 %, almost en-

Atmos. Chem. Phys., 21, 5655–5683, 2021                                                    https://doi.org/10.5194/acp-21-5655-2021
E. Solazzo et al.: Uncertainties in the EDGAR emission inventory of greenhouse gases                                               5669

Table 5. Share of CH4 emissions in sector 1.B.2.b (fugitive emis-       a further large source of uncertainty, in particular in countries
sions from natural gas) for the five top emitting counties.             with old gas distribution city networks using steel pipes now
                                                                        distributing dry rather than wet gas, with potentially more
                            USA      Russia     Iran    Saudi   China   leakages (Janssens-Maenhout et al., 2019). Analysis based
                                                       Arabia
                                                                        on inversion modelling by Turner et al. (2015) found an error
 Natural gas production     50.3 %     47 %   84.7 %   97.5 %   76 %    variability of −43 % to 106 % for the North America region
 Natural gas transmission   30.3 %   21.5 %    5.7 %    2.5 %   15 %
 Natural gas distribution   19.4 %   31.5 %    9.6 %      0%     9%     (with respect to the prior estimate based on EDGAR v4.2)
                                                                        that was attributed to emissions from oil and gas. Hence, the
                                                                        uncertainty in Fig. 4c might be too low for industrialized
                                                                        countries. For completeness, we show an alternative appli-
tirely due to CH4 emissions. For the USA, the upper uncer-              cation of uncertainty ranges for sector 1.B.2 (oil and gas), as
tainty estimate for oil and natural gas (Fig. 4c) of 23 % is            suggest by Olivier (2002), assigning uAD = ±5 and ±15 %
slightly less than the EPA’s upper estimate of 30 % for the             (for industrialized and developing countries respectively) as
natural gas system (EPA, 2017b) and the 29 % estimated by               well as uEF = ±100 % to all countries and a uEF of 50 % to
Littlefield et al. (2017), whereas the EPA’s uncertainty for the        countries for which EFs are specifically estimated (Tier 3).
petroleum system is much larger (149 %), possibly due to a                 The resulting distribution (Fig. 5) reflects the comparable
higher uAD .                                                            uncertainty of these emissions across countries. The global
   The uncertainty of individual countries mirrors the dis-             uEMI is approximately 100 % and, thus, slightly less than the
tinction made between developed and developing countries,               uncertainty obtained by applying the IPCC-06 recommenda-
which is mostly visible for fugitive emissions from oil and             tions (122 %; Fig. 4e).
natural gas (Fig. 4c) but also in the detailed uEF provided by
IPCC-06 for the various emitting stages of extraction, distri-          3.1.3   Industrial processes and product use (IPPU)
bution, transport, and storage. The composition of emissions
for the five top emitters in sector 1.B.2.b can be used to illus-       IPCC category 2 covers non-combustion emissions from in-
trate this aspect.                                                      dustrial production of cement, iron and steel, lime, soda ash,
   The USA and Russia have country-specific EFs that are                carbides, ammonia, methanol, ethylene, adipic and nitric acid
defined for all stages of the fugitive emissions from natu-             and other chemicals, and the non-energy use of lubricants
ral gas; therefore, the accuracy is higher. Iran, Saudi Ara-            and waxes (Janssens-Maenhout et al., 2019). The EDGAR
bia, and China have a very large share of emissions due                 sectors CHE (production of chemicals), FOO (food produc-
to the production stage of natural gas (approximately 85 %,             tion), PAP (paper and pulp production), IRO (iron and steel),
97 %, 76 % respectively; Table 5), to which uEF = ±75 %                 non-energy use of fuels (NEU), non-ferrous metal produc-
applies, and a much lower share of emissions apportioned                tion (NFE), and non-metallic minerals production (NMM)
to the other stages (i.e. transmission and distribution), ap-           cover the industrial process emissions.
proximately 10 % due to gas distribution with an uncertainty               Activity statistics for industrial processes are retrieved
of −40 % to +500 % (including the correction factor from                from several reporting providers, as detailed by Janssens-
Eq. 4); this contributes to the very low confidence in the              Maenhout et al. (2019) and Crippa et al. (2019). For this class
emission estimates shown in Fig. 4e, compared with the                  of processes uAD values are higher than uEF values due to
medium confidence for USA and Russia, to which country-                 the deficiency in or incompleteness of country-specific data
specific uEF values are applied (±25 %) (Table 3). The high             and the reluctancy of companies to disclose production data.
uncertainty in the transmission and distribution sectors is the         CO2 emissions in EDGAR are based on the Tier 1 EF for
main cause for the difference in uncertainty apportionment.             clinker production, whereas cement clinker production is cal-
   The variability in bottom-up estimates of CH4 emissions              culated from cement production reported by USGS (2016).
from coal mining (−29 %, +43 %) and natural gas and oil                 The fraction of clinker is based on data reported to the
systems (−16 %, +15 %), as recently reported by Saunois                 United Nations Framework Convention on Climate Change
et al. (2020), stems from the methodologies and parame-                 (UNFCCC) for European countries, to the China Ce-
ters used, including emission factors, “which are country-              ment Research Institute (http://cdi.cnki.net/Titles/SingleNJ?
or even site-specific, and the few field measurements avail-            NJCode=N2011080334, last access: 12 April 2021) and the
able often combine oil and gas activities and remain largely            National Bureau of Statistics of China (for historic years)
unknown” (Saunois et al., 2020). The authors reported ex-               for China, and to “Getting the Numbers Right” for non-
amples of very large variability in EFs between inventories,            Annex I countries (https://gccassociation.org/gnr/, last ac-
which even reached 2 orders of magnitude for oil production             cess: 12 April 2021). According to IPCC-06, the uncertainty
and 1 order of magnitude for gas production. Moreover, large            for cement production stems prevalently from the uAD and, to
uncertainties in the emissions of CH4 from venting and flar-            a lesser extent, from the uEF for clinker (IPCC-06, chap. 2).
ing at oil and gas extraction facilities were reported by stud-         For Tier 1, the major uncertainty component is the clinker
ies such as Peischl et al. (2015). The gas distribution stage is        fraction of the cement(s) produced, and the uAD can be as

https://doi.org/10.5194/acp-21-5655-2021                                                 Atmos. Chem. Phys., 21, 5655–5683, 2021
5670 E. Solazzo et al.: Uncertainties in the EDGAR emission inventory of greenhouse gases Figure 4. GHG emissions from top emitters and the world for sector 1.B (energy – fugitive emissions): (a) CO2 from fugitive emissions from fuels; (b) CH4 from fugitive emissions from solid fuels; (c) CH4 from fugitive emissions from oil and natural gas; (d) N2 O from fugitive emissions from fuels; (e) the world total emission uncertainty and the world emission and uncertainty shares. The country names are colour-coded according to their classification (cyan denotes industrialized, and red denotes developing). Confidence levels are given in the following ranges: high (0 %, 10 %]; medium-high (10 %, 20 %]; medium (20 %, 40 %]; medium-low (40 %, 60 %]; low (60 %, 100 %]; and very low > 100 %. (Country codes are given in Table S1.) high as 35 %. We assume a uEMI from 11 % to 60 % depend- due to the variability in composition and is very low (∼ 1 % ing on the accuracy of clinker data. to 5 %), whereas the uAD can be much larger due to poor- As for cement, the uAD for lime outweighs the uEF due quality statistics and is assumed to be ±35 %. to the lack of country-specific data. We assume a uAD of The production of ammonia, nitric, and adipic acid as ±35 % and uEF = ±3 %. For glass, glass production data are well as caprolactam and glyoxylic and glyoxylic acid is typically measured accurately, as reflected by uAD = ±5 % known with high degree of accuracy and the uAD for these suggested by IPCC-06, whereas the suggested uEF for Tier 1 processes can be estimated as ±2 %. The corresponding is ±60 %. The uEF for other carbonates (e.g. limestone) is uEF is reported in Tables 2 and 3 and is derived from ex- Atmos. Chem. Phys., 21, 5655–5683, 2021 https://doi.org/10.5194/acp-21-5655-2021
E. Solazzo et al.: Uncertainties in the EDGAR emission inventory of greenhouse gases                                            5671

                                                                     to the lack of accurate information and owing to country-
                                                                     specific operating conditions.
                                                                        CO2 emissions in sector 2 are 1 and 2 orders of magnitude
                                                                     higher than N2 O and CH4 emissions respectively (Fig. 6).
                                                                     Nearly 50 % of CO2 emissions in this sector originate from
                                                                     cement production. The accuracy ranges from medium-high
                                                                     to high for all top emitters, and the global uncertainty is 12 %.
                                                                     For N2 O, the main source (∼ 85 %) is the production of ni-
                                                                     tric and adipic acid, which results in medium-high accuracy
                                                                     both country-wise and globally. Finally, the emission of CH4
                                                                     is more uncertain due to the large uEF of carbon black and
                                                                     methanol production, which account for ∼ 52 % of global
                                                                     CH4 emissions in the IPPU sector.

Figure 5. Methane emissions from the top emitters and the world      3.1.4   Agriculture
for sector 1.B.2 (energy – fugitive emissions from oil and natural
gas) with a revised uEF and uAD (see text). Colour codes are the     Agriculture-related activities in EDGAR partially cover the
same as in Fig. 4.                                                   IPCC category 3 (agriculture, forestry, and land use), includ-
                                                                     ing enteric fermentation (ENF, corresponding to 3.A.1), ma-
                                                                     nure management (MNM, corresponding to 3.A.2), waste
                                                                     burning of agricultural residues (AWB.CRP, corresponding
pert judgement and reported in IPCC-06 (uAmmonia     = ±7 %;         to 3.C.1.b – biomass burning of cropland), direct N2 O emis-
                                            EF
uNitric Acid = ±20 %; uCarbide = ±10 %). For petrochemical           sions from soil due to natural and synthetic fertilizer use (cor-
  EF                    EF
and carbon black production (methanol, ethylene, ethylene            responding to 3.C.4), indirect N2 O emissions from manure
dichloride, vinyl, acrylonitrile, and carbon black), IPCC-06         and soils (corresponding to 3.C.5 and 3.C.6 respectively),
provides reference values for the uEMI associated to these           urea and agricultural lime (AGS.LMN and AGS.URE, cor-
processes (IPCC-06, Vol. 3, chap. 3, Table 3.27), based on           responding to IPCC codes 3.C.2 and 3.C.3 respectively), and
expert judgements. The values are reported in Table 3, rang-         rice cultivation (AGS.RIC corresponding to 3.C.7). Forestry
ing from ±10 % for CH4 emission for ethylene production to           and land use are not covered. Data sources for AD cover-
±85 % for CH4 emission from carbon black production.                 ing the agriculture sector have been compiled by Janssens-
   As summarized in Table 1, the AD for iron and steel (in-          Maenhout et al. (2019).
cluding furnace technologies) production are considered very            For the ENF and MNM sectors, EDGAR follows IPCC-
accurate, with uAD = ±10 %; for ferroalloys, uAD is set to           06 for estimating emissions, with animal counting data from
±10 % for industrialized countries and uAD = ±20 % for               FAOSTAT (2018). For ENF, uncertainty in AD is due to
developing countries, based on expert judgement (IPCC-06             cattle numbers, feed intake, and feed composition, whereas
suggests uAD = ±5 %). The data for iron production are up-           the distribution of manure (volatile solids) in different ma-
dated monthly using data from the World Steel Association            nure management systems is also a source of uncertainty for
(WSA, 2019), whereas data for ferroalloys are extrapolated           MNM. The uAD for these sectors is estimated at ∼ ±20 % to
using trends from United States Geological Survey (USGS)             account for uncertainty in the manure management system
commodity statistics (USGS, 2016). uEF is equal to ±25 %.            usage and the lack of detailed characteristics on the livestock
   Production data for aluminium, magnesium, zinc, and lead          industry, information on how manure management is col-
are deemed accurate within 2 % to 10 % (Table 1). For alu-           lected, and the lack of homogeneity in the animal counting
minium, the reactions leading to CO2 emissions are well un-          systems (IPCC-06; Olivier, 2002). The estimate is slightly
derstood, the emissions are directly connected to the quantity       higher than the uAD from other US studies for ENF (EPA,
of aluminium produced (IPCC-06), and the uEF is assumed              2017a; Hristov et al., 2017), whereas the uAD of ±20 % for
to be within 10 %. The uEF associated with CO2 emitted               MNM might be underestimated according to studies such
from magnesium production is also well understood and is             as Hristov et al. (2017). EFs are calculated following the
assumed to be within 5 %. Lead and zinc production have a            IPCC-06 methodology, using country-specific data of milk
higher uEF (50 %) associated with default emission factors           yield and carcass weight integrated with trends from FAO-
(Tier 1), whereas they have a uEF of 15 % if country-specific        STAT (2018) for cattle and using regional EFs for livestock.
data are adopted (Tier 2). CO2 emissions for the non-energy          The Tier 1 uEF for ENF and MNM is estimated to be larger
use of lubricants and waxes (like petroleum jelly, paraffin          than ±50 % (with a minimum of 30 %) unless livestock char-
waxes, and other waxes, classified under IPCC sector 2.D.2           acterization is known with great accuracy, in which case
and corresponding to EDGAR sector NEU) are assumed to                Tier 2 uncertainty can be ∼ ±20 % (IPCC-06).
be highly uncertain (uEF of 100 %; uAD of 5 % to 15 %) due

https://doi.org/10.5194/acp-21-5655-2021                                              Atmos. Chem. Phys., 21, 5655–5683, 2021
You can also read