2019 ENERGY & CARBON SUMMARY - ExxonMobil
←
→
Page content transcription
If your browser does not render page correctly, please read the page content below

2019 ENERGY & CARBON SUMMARY
2019 ENERGY & CARBON SUMMARY
Table of Contents
1 Letter from the Chairman
2 Summary at-a-glance
3 Governance
6 Strategy
7 Highlights from the 2018 Outlook for Energy
8 Considering 2oC scenarios
10 Sensitivities
12 Signposts
13 Potential impact on reserves and resources
16 Positioning for a lower-carbon energy future
17 Developing scalable technology solutions
21 Engaging on climate-related policy
22 Providing products to help our customers reduce
their emissions
Statements of future events or conditions in this report, including projections, targets, expectations, estimates, future technologies, and 23 Mitigating emissions in our operations
business plans, are forward-looking statements. Actual future results or conditions, including: demand growth and energy source mix;
the impact of new technologies; production rates and reserve growth; efficiency gains and cost savings; emission reductions; and results 24 Metrics and targets
of investments, could differ materially due to, for example, changes in the supply and demand for crude oil, natural gas, and petroleum
and petrochemical products and resulting price impacts; the outcome of exploration and development projects; the outcome of research 31 Risk management
projects and ability to scale new technologies on a cost-effective basis; changes in law or government policy, including environmental
regulations and international treaties; the actions of competitors and customers; changes in the rates of population growth, economic 34 Disclosures
development, and migration patterns; trade patterns and the development of global, regional and national mandates; military build-ups
or conflicts; unexpected technological developments; general economic conditions, including the occurrence and duration of economic 35 Footnotes
recessions; unforeseen technical difficulties; and other factors discussed in this report and in Item 1A of ExxonMobil’s most recent Form
10-K. Third-party scenarios discussed in this report reflect the modeling assumptions and outputs of their respective authors, not
ExxonMobil, and their use or inclusion herein is not an endorsement by ExxonMobil of their likelihood or probability. References to
“resources,” “resource base,” and similar terms include quantities of oil and gas that are not yet classified as proved reserves under SEC
definitions but that are expected to be ultimately moved into the proved reserves category and produced in the future. For additional
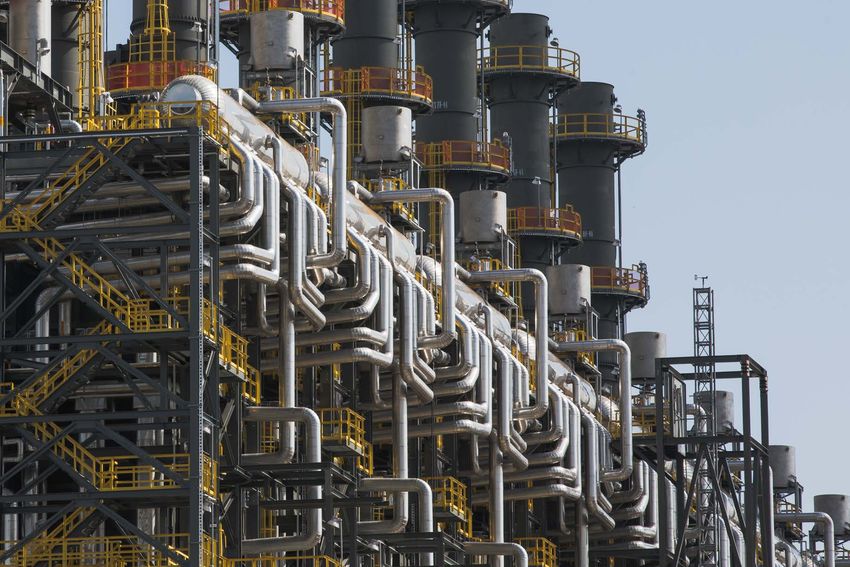
information, see the “Frequently Used Terms” on the Investors page of our website at exxonmobil.com. COVER PHOTO:
References to “oil” and “gas” include crude, natural gas liquids, bitumen, synthetic oil, and natural gas. LNG ship, Gaslog Savannah, delivers gas from the
Prior years’ data have been reclassified in certain cases to conform to the 2017 presentation basis. Gorgon project in Western Australia to customers in
The term “project” as used in this publication can refer to a variety of different activities and does not necessarily have the same meaning Asia. ExxonMobil has a 25 percent interest in the
as in any government payment transparency reports. Gorgon project.
2019 ENERGY & CARBON SUMMARY LETTER FROM THE CHAIRMAN

 There are few challenges more important than             We also actively engage in climate-related
 meeting the world’s growing demand for                   policy discussions. We understand that dealing
 energy while reducing environmental impacts              successfully with climate change risks will
 and the risks of climate change.                         require a coordinated effort involving
                                                          individuals, governments and industry leaders
 ExxonMobil is committed to doing our part to             around the world. ExxonMobil supports the
 help society meet this dual challenge.                   2015 Paris Agreement. In 2017 we became a
                                                          founding member of the Climate Leadership
 Energy underpins modern life. People around the
                                                          Council to help promote a revenue-neutral
 world rely on energy to cook their meals, heat
                                                          carbon tax. And last year we joined the Oil and
 their homes, fuel their cars, and power their
                                                          Gas Climate Initiative (OGCI), a voluntary
 hospitals, schools and businesses. Our industry
                                                          collaboration of leading companies in our
 plays a critical role in fulfilling society’s economic
                                                          industry aimed at reducing climate-related
 needs and providing the foundation for a
                                                          risks.
 healthier and more prosperous future.
                                                          Together with our Board of Directors and
 We also play an essential role in protecting the
                                                          senior management team, we regularly
 environment and addressing the risks of climate
                                                          review our efforts to address climate-related
 change. ExxonMobil is taking significant steps to
                                                          matters.
 minimize the greenhouse gas (GHG) emissions
 from our own operations. For example, we have            This year’s Energy & Carbon Summary details
 committed to reducing methane emissions from             some of these efforts. It is aligned with the core
 our operations by 15 percent and flaring by              elements of the framework developed by the
 25 percent by 2020*, as well as reducing the GHG         Financial Stability Board’s Task Force on
 intensity at our operated Canadian oil sands             Climate-related Financial Disclosures, designed
 facilities by 10 percent by 2023*.                       to encourage the informed conversation
                                                          society needs on these important issues.
 Since 2000, we have invested more than
                                                          Through our active participation in this
 $9 billion in our facilities and research to develop
                                                          conversation, and our ongoing actions to meet
 and deploy lower-emission energy solutions such
                                                          energy needs and environmental expectations,
 as cogeneration, algae biofuels, and carbon
                                                          ExxonMobil will continue to take a leadership
 capture and storage (CCS). We have partnered
                                                          role in meeting the world’s dual challenge.
 with more than 80 universities around the world
 to support emerging energy research.

 At the same time, we help our customers reduce
 their emissions through the use of our energy-
 saving technologies and sustainable products.
                                                          Darren Woods, Chairman and CEO

 *when compared to 2016

p.1   |   exxonmobil.com
2019 ENERGY & CARBON SUMMARY SUMMARY AT-A-GLANCE

          Our Company has a proven record of successfully responding to changes in society’s needs. With long-standing
          investments in technology, we are well-positioned to meet the demands of an evolving energy system.

 Our annual Outlook for Energy provides a view of energy demand and supply through                 • Production from our proved reserves and investment in our resources continue
 2040, incorporating important fundamentals including population growth, economic                    to be needed to meet global requirements and offset natural field decline
 conditions, policy developments and technology advances.
                                                                                                   Our businesses are well-positioned for the continuing evolution of the
 The 2018 Outlook for Energy anticipates global energy needs will rise about 25 percent            energy system.
 over the period to 2040, led by non-OECD(1) countries. While the mix shifts toward lower-
                                                                                                   Near-term actions, consistent with society’s energy requirements and environmental
 carbon-intensive fuels, the world will need to pursue all economic energy sources to meet
                                                                                                   objectives, include:
 this need.
                                                                                                   • Expanding the supply of cleaner-burning natural gas
 • Efficiency gains and growing use of less-carbon-intensive energy sources will contribute
   to a nearly 45 percent decline in the carbon intensity of global GDP                            • Transitioning our refining facilities to growing higher-value distillates, lubricants
                                                                                                     and chemical feedstocks
 • Worldwide electricity from solar and wind will increase about 400 percent
                                                                                                   • Mitigating emissions from our own facilities through energy efficiency, cogeneration
 • Natural gas will expand its role, led by growth in electricity generation and industrial
                                                                                                     and reduced flaring, venting and fugitive emissions, including GHG intensity
   output
                                                                                                     reduction in Imperial Oil Limited's (Imperial) operated oil sands facilities
 • Rising oil demand will be driven by commercial transportation and the chemical industry.
                                                                                                   • Supplying products that help others reduce their emissions, such as premium
   Road fuel demands for cars and heavy-duty vehicles reflect efficiency improvements and
                                                                                                     lubricants and fuels, lightweight materials, and special tire liners
   growth in alternative fuels
                                                                                                   • Engaging on policy to address the risks of climate change at the lowest cost
 • According to the International Energy Agency (IEA), cumulative investments in oil and
                                                                                                     to society
   natural gas supplies could approach $21 trillion from 2018 to 2040
                                                                                                   Importantly, on a longer-term horizon, we are pursuing technologies to enhance
 The Outlook includes sensitivities to illustrate how changes to base Outlook assumptions
                                                                                                   existing operations and develop alternative energy technologies with lower carbon
 might affect the energy landscape. In this report, we highlight sensitivities related to light-
                                                                                                   intensity, including:
 duty vehicle fuel economy gains and electric vehicle penetration, and also introduce new
 sensitivities tied to efficiency and alternative fuel use potentially affecting the heavy-duty    • Researching breakthroughs that make CCS technology more economic for power
 vehicle sector.                                                                                     generation, industrial applications and hydrogen production
 Relative to our Outlook, a theoretical 2°C pathway would generally lower demand for               • Developing technologies to reduce energy requirements of refining and chemical
 oil, natural gas and coal, and increase use of nuclear and renewables.                              manufacturing facilities
 • Signposts in the energy system provide indicators on the world's progress toward a 2°C
                                                                                                   • Progressing advanced biofuels for transportation and chemicals
   pathway

 • Even under a 2°C pathway, significant investments will be required in oil and natural gas
   capacity. In this scenario, according to the IEA, cumulative oil and natural gas
   investments could exceed $13 trillion by 2040
p.2   |    exxonmobil.com
GOVERNANCE

ExxonMobil’s Board of Directors and Management Committee
work together to oversee and address risks associated with our
business, including risks related to climate change. Structured risk
management is interwoven into ExxonMobil’s corporate
governance framework to ensure risks are appropriately identified
and addressed.

2019 ENERGY & CARBON SUMMARY GOVERNANCE

Climate change risk oversight                                                               HIGHLIGHT:
 ExxonMobil’s Board of Directors provides oversight of Company risks, including climate     Integrating risk management into executive compensation
 change risks. These risks have the potential to manifest in a variety of ways, including
 through strategic, financial, operational, reputational and legal compliance matters.      ExxonMobil’s compensation of senior executives is determined by the Board Compensation
 Effectively managing these risks is essential to the long-term success of the Company.     Committee, which is comprised entirely of independent directors. The compensation
                                                                                            program is specifically designed to incentivize effective management of all operating and
 Board committees conduct deeper reviews and provide additional insight on                  financial risks associated with ExxonMobil’s business, including climate change risks.
 important topics. For example, the ExxonMobil Board Audit Committee assesses
 ExxonMobil’s overall risk management approach and structure to confirm that                Features of the program include the long-term vesting of performance shares and the
 enterprise-level risks are being appropriately considered by the Board. The Public         linkage of compensation to overall company performance, including all aspects of risk
 Issues and Contributions Committee (PICC) regularly reviews ExxonMobil's safety,           management. Executive remuneration is designed to support sustainability of our
 health and environmental performance, including actions taken to address climate           operations and management of climate-related risks. Performance in managing climate
 change risks (see page 5).                                                                 change risks is further emphasized under Strategic Objectives and Operations Integrity
                                                                                            performance metrics. ExxonMobil’s executive compensation program requires that these
 The potential for changes in demand for ExxonMobil’s products for any reason,              longer-term risks be considered carefully at all levels of the organization, ensuring that the
 including climate change, technology or economic conditions, is considered a key           stewardship does not stop at the Board or executive level, but is required for success
 strategic risk. The full Board annually considers this risk as part of its review of the   throughout the Company. Further details on compensation can be found in our annual
 Outlook for Energy, the Company’s long-term supply and demand forecast, in addition        Proxy Statement and the 2018 Executive Compensation Overview.
 to the Board’s regular reviews and discussions of the Company’s strategies and
 business plans.

 ExxonMobil’s corporate and environmental strategy, and performance, are reviewed
 and discussed by the Board at multiple points throughout the year. The Board provides
 oversight of ExxonMobil’s strategy to research, develop and implement technology to
 address GHG emissions by reviewing the Company’s technology portfolio, including
 ExxonMobil's low-emissions technologies, and long-range research and development
 programs.

 To learn about and discuss the latest developments in climate science and policy, the
 Board engages with subject matter experts, and holds briefings and discussions on the
 Company’s public policy positions and advocacy.

 Risk management starts at the top, with oversight from the Board of Directors, and
 leadership from the CEO and the rest of the ExxonMobil management team. However,
 management does not act alone. Risk management occurs at multiple levels of the
 business as part of ExxonMobil’s risk management framework (see page 32). This
 framework provides a structured approach to managing risk while ensuring the
 Company is able to provide reliable and affordable energy to meet rising global energy
 demand. This framework ensures that key risks, including climate change risks, are
 incorporated and considered at all levels of the business.

p.4   |   exxonmobil.com
2019 ENERGY & CARBON SUMMARY GOVERNANCE

             UP CLOSE:
             Public Issues and Contributions Committee (PICC)

      The Board appoints committees to help carry out its duties. In
      particular, Board committees work on key issues in greater detail
      than would be possible at full Board meetings. The PICC’s primary
      duties are to review and provide advice, as the committee deems
      appropriate, regarding the Corporation’s policies, programs and
      practices on public issues of significance, including their effects on
      safety, health and the environment; and to review and provide
      advice on the Corporation's overall objectives, policies and
      programs.

      To accomplish this, the PICC regularly reviews ExxonMobil’s safety,
      health and environmental performance, including actions taken to
      identify and manage climate change risks and opportunities. The
      PICC is comprised of four independent directors who are appointed
      by the Board. A broad range of backgrounds and areas of expertise
      for individual PICC members ensures that the PICC is able to
      effectively evaluate and inform the Board on dynamic and complex
      issues such as climate change risks that span a range of disciplines.

      In addition, the PICC, along with other members of the Board of
      Directors, makes annual site visits to ExxonMobil operations to
      observe and provide input on current operating practices and
      external engagement. In 2018, the PICC traveled to ExxonMobil’s
      Permian operations near Carlsbad, New Mexico. The visit included a
      tour of a well site where directional drilling and hydraulic fracturing
      technologies are being employed, as well as a production site where
      oil and gas are separated and stabilized prior to transport and use.
      Through these field visits, the PICC is able to see first-hand and
      validate that the risk management process and operations integrity        The Board of Directors, Chairman and senior executives toured XTO operations near Carlsbad, N.M., in September 2018 as part of the
      management system (OIMS) are effective at protecting the                  annual PICC trip.
      Corporation's employees, the community and the environment. The
      PICC utilizes this information, along with reports on the safety and
      environmental activities of the operating functions throughout the
      year, to provide recommendations to the full Board.

p.5   |   exxonmobil.com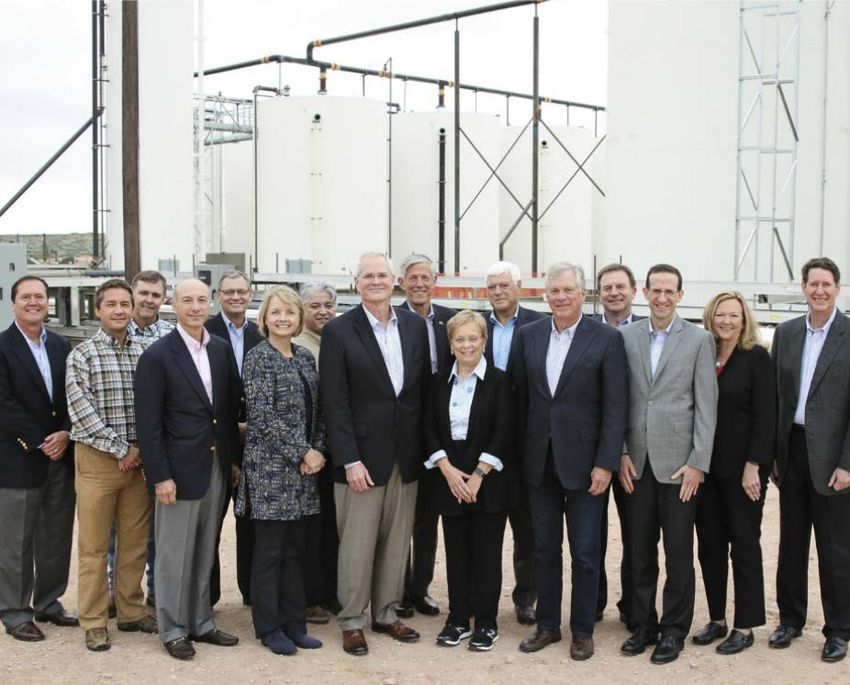
Our business strategies are underpinned by a
                                                                        deep understanding of global energy system
                                                                        fundamentals. These fundamentals include the
                                                                        scale and variety of energy needs worldwide;
  Our business strategies are underpinned by a deep understanding ofcapability,      practicality
                                                                         energy system            and affordability
                                                                                           fundamentals.    These of
  fundamentals include the scale and variety of energy needs worldwide; energy   alternatives;
                                                                            capability,         carbon
                                                                                        practicality andemissions;   and
                                                                                                          affordability of
                                                                        government
  energy alternatives; carbon emissions; and government policy. We consider      these policy. We consider
                                                                                        fundamentals           these
                                                                                                        in conjunction
  with our Outlook to help inform our long-term business strategies and fundamentals     in conjunction
                                                                            investment plans.             with our Outlook
                                                                                                 We are committed      to
  providing affordable energy to support human progress while advancing to help   informsolutions
                                                                              effective   our long-term    business
                                                                                                   to address   the risks of
                                                                        strategies
  climate change. Our actions, which are prioritized under the four pillars          and investment
                                                                             below, position           plans.toWe
                                                                                              ExxonMobil           arethe
                                                                                                                meet
  demands of an evolving energy system.                                 committed to providing affordable energy to
                                                                        support human progress while advancing
                                                                        effective solutions. Our actions to address the
                                                                        risks of climate change, which are prioritized
                                                                        under the four pillars below, position
                                                                        ExxonMobil to meet the demands of an
      DEVELOPING SCALABLE       ENGAGING ON CLIMATE         PROVIDING PRODUCTS TO               MITIGATING EMISSIONS
                                                                        evolving energy system.
                                                             HELP OUR CUSTOMERS
     TECHNOLOGY SOLUTIONS           CHANGE POLICY                                                               IN OUR OPERATIONS
                                                                 REDUCE THEIR EMISSIONS

                                                                                  DEVELOPING SCALABLE                   ENGAGING ON CLIMATE-
                                                                                 TECHNOLOGY SOLUTIONS                      RELATED POLICY

STRATEGY
STRATEGY
                                                                                 PROVIDING PRODUCTS TO
                                                                                  HELP OUR CUSTOMERS
                                                                                 REDUCE THEIR EMISSIONS
                                                                                                                           MITIGATING EMISSIONS
                                                                                                                            IN OUR OPERATIONS

                                                         Attorney client privileged and confidential - prepared by and under supervision of counsel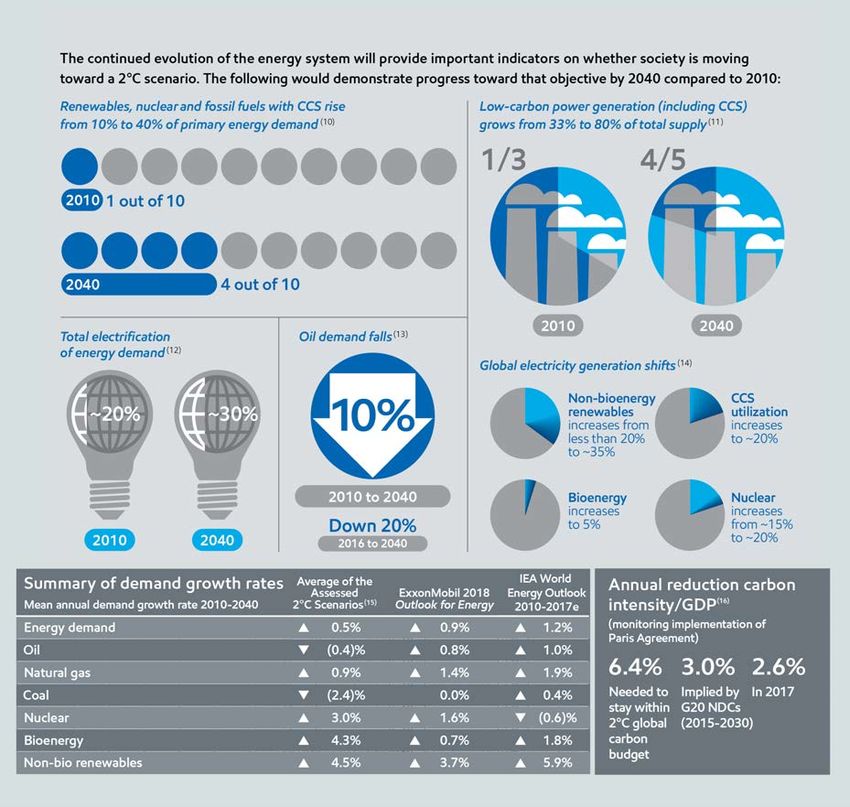
2019 ENERGY & CARBON SUMMARY STRATEGY

 Highlights from the 2018 Outlook for Energy
 The Outlook is ExxonMobil’s global view of energy demand and supply through 2040.                          Meeting growing demand for reliable, affordable energy to support prosperity and
 ExxonMobil uses a data-driven, bottom-up approach to help produce a comprehensive view                     enhanced living standards is coupled with the need to do so in ways that reduce potential
 of future energy demand and supply that recognizes the dual challenge of providing                         impacts on the environment, including those relating to air quality and the risks of climate
 affordable energy to support prosperity while reducing environmental impacts.                              change. Accordingly, the Outlook anticipates significant changes through 2040 to
                                                                                                            reshape the use of energy through efficiency gains and a shift in the energy mix. In this
 Energy supports rising prosperity                                                                          regard, nationally determined contributions (NDCs)(2) related to the Paris Agreement
 Access to modern technologies and abundant energy – including oil and natural gas –                        provide important signals on government intentions related to the general direction and
 continues to enable substantial gains in living standards. Over the period to 2040, the world              pace of policy initiatives to address climate change risks.
 population is expected to reach 9.2 billion people, while global GDP likely will double.
 Billions of people are expected to join the middle class. Energy demand is likely to rise about            Electrification and a gradual shift to lower-carbon energy sources are expected to be
 25 percent over the period to 2040, while efficiency gains and a shift in the energy mix –                 significant global trends. Renewables and nuclear energy see strong growth, contributing
 including rising penetration of wind and solar – are likely to enable nearly a 45 percent fall in          nearly 40 percent of incremental energy supplies to meet demand growth through 2040.
 the carbon intensity of global GDP.                                                                        Natural gas grows the most of any energy type, reaching a quarter of all demand. Oil will
                                                                                                            continue to play an important role in the world’s energy mix, as commercial
 While overall energy demand is likely to be fairly stable in OECD nations, demand in non-                  transportation (e.g., trucking, aviation, marine) and chemical sectors lead to demand
 OECD nations will likely grow about 40 percent, led by expanding economies in the Asia                     growth. Coal’s share will fall as the world shifts to lower-emission energy sources, helping
 Pacific region, such as China and India.                                                                   enable a peak in global energy-related CO2 emissions by 2040.

 Global fundamentals impact Outlook for Energy                    Growth led by natural gas & non-fossil energy sources                             Energy demand & CO2 emissions led by non-OECD
 (Percent change)                                                 (Quadrillion BTUs)                                                                (Share)
                                                                                                                                                              Quadrillion BTUs   Billion tonnes
                                                                                                                                                               552       681      33        36
  100%                                                             250                                                                               100%
                                            GDP
                                                                                         Average annual growth
                                                                             0.7%        rate from 2016 to 2040
      75%
                                                                   200                                                                                80%
                                                                            2016       1.3%
      50%                                                                                                                                                                                         non-OECD
                                                                                                            Total energy: 0.9%
                                                                   150                        -0.1%                                                   60%
                                            Energy demand
      25%
                                            Population

                                            CO2 emissions          100                                                                                40%
      0%
                                                                                                        0.2%
                                                                    50                                            2.3%                                20%
  -25%                                                                                                                                                                                            OECD
                                                                                                                          6.3%    1.4%
                                            CO2 intensity                                                                                  2.5%
  -50%                                                                0                                                                                0%
            2016                     2040                                                                                Wind/   Hydro/                       2016     2040      2016    2040
                                                                             Oil       Gas    Coal    Biomass Nuclear                     Biofuel
                                                                                                                         Solar   Geo
                                                                                                                                                              Energy demand       CO2 emissions

p.7    |    exxonmobil.com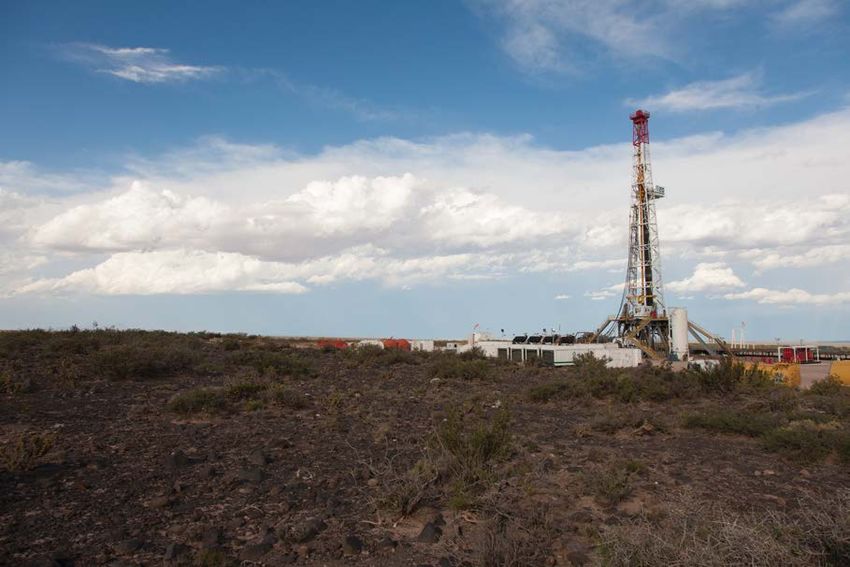
2019 ENERGY & CARBON SUMMARY STRATEGY
Global energy-related CO2 emissions(6)
(Billion tonnes)
125
Considering 2°C scenarios
According to the IEA, a “well below” 2°C pathway implies “comprehensive, systematic, 100
immediate and ubiquitous implementation of strict energy and material efficiency measures.”(3) Assessed
baseline
Given a wide range of uncertainties, no single pathway can be reasonably predicted. A key scenarios
unknown relates to advances in technology that may influence the cost and potential 75
availability of certain pathways toward a 2°C scenario. Scenarios that employ a full
complement of technology options are likely to provide the most economically efficient
50
pathways.
2018 Outlook for Energy
Considerable work has been done in the scientific community to explore potential energy 25
pathways. A comprehensive multi-model study coordinated by the Energy Modeling Forum 27
(EMF27)(4) at Stanford University brought together many energy-economic models to assess
possible technology and policy pathways associated with various climate stabilization targets 0
Assessed
(e.g., 450, 550 ppm CO2 equivalent or CO2e), partially in support of the Fifth Assessment 2°C scenarios
Report of the Intergovernmental Panel on Climate Change (IPCC).
-25
2005 2020 2040 2060 2080 2100
The chart (top right) illustrates potential global CO2 emission trajectories under EMF27 full-
technology scenarios(5) targeting a 2°C pathway relative to our 2018 Outlook, and baseline
pathways with essentially no policy evolution beyond those that existed in 2010.
2040 global demand by energy type by model in the EMF27
The chart (lower right) illustrates potential global energy demand in 2040 under the assessed assessed 2oC scenarios and the IEA SDS
2°C scenarios. As the chart illustrates, the scenarios suggest that predicting absolute 2040 (Exajoules)
energy demand levels in total and by energy type carries some uncertainty, with particular 800 EMF27 Scenarios
scenarios likely heavily influenced by technology and policy assumptions.
For comparison purposes, the chart (lower right) also includes energy demand projections in 600 Non-bio renewables
2040 based on the IEA’s Sustainable Development Scenario (SDS), which is designed to meet
Bioenergy
certain outcomes. The IEA specifically notes that its SDS projects global energy-related CO2
Bioenergy w/ CCS
emissions that are “fully in line with the trajectory required to meet the objectives of the Paris 400
Nuclear
Coal
Agreement on climate change.” In fact, the SDS projects global energy-related CO2 emissions Coal w/ CCS
in 2040 at a level 50 percent lower than the IEA’s New Policies Scenario (NPS), which projects Natural gas
emissions generally in line with the aggregation of national commitments under the Paris
200 Natural gas w/ CCS
Agreement. As recognized by the United Nations Framework Convention on Climate Change,
the estimated aggregate annual global emissions levels resulting from the implementation of
Oil
intended NDCs do not fall within least-cost 2°C scenarios.(7) Differences in these scenarios
Oil w/ CCS
help put in perspective the uncertainty in the pace and breadth of changes in the global energy 0
S
M
nk T
GC s
IM AM
M
M E
ES E
Ph E
PO ix
RE S
W D
CH
AM
e
SD
V- BE
AG
G
M RG
LE
n
IN
AI
LI
ag
oe
SA
IT
landscape.
TI
AC
M
E
IM
A
IE
Li
EN
IEA WEO 2018 SDS includes CCS but breakdown by energy type is not readily identifiable
p.8 | exxonmobil.com2019 ENERGY & CARBON SUMMARY STRATEGY
Considering 2°C scenarios, continued World energy-related CO2 emissions relative to energy intensity and
CO2 emissions intensity
The assessed 2°C scenarios produce a variety of views on the potential impacts on global
energy demand in total and by specific types of energy. The scenarios also show a range of (kBTU of energy used per
dollar of global GDP)
possible growth rates for each type of energy. We have taken the average of the scenarios’
12
growth rates in order to consider potential impacts on energy demand for this report.(8) 2018 Outlook for Energy
Improving energy efficiency across economy
performance pathway
Based on this analysis, primary energy demand on a worldwide basis is projected to 10 1980 18 billion tonnes CO2
2040 hypothetical 2oC
increase about 0.5 percent per year on average from 2010 to 2040. Expected demand in performance levels(9)
2040 varies by model and energy type (see 2°C chart on prior page): 8
2015 33 billion tonnes CO2
• Oil demand is projected on average to decline by about 0.4 percent per year
6
• Natural gas demand is expected on average to increase about 0.9 percent per year
2040 36 billion tonnes CO2
4
• The outlook for coal is the most negative, with diverse projections showing an average
decline of about 2.4 percent per year, or about a 50 percent decline by 2040
Level exceeded
2
• The projected growth rates for renewable energies and nuclear are generally quite
strong, averaging between 4 and 4.5 percent per year for non-bioenergy (e.g., hydro, 0
wind, solar) and bioenergy respectively, and about 3 percent per year for nuclear 0 20 40 60 80
All energy sources remain important across all the assessed 2°C scenarios, though the mix (Tonne CO2 per billion BTU of global energy)
of energy and technology shifts over time. Oil and natural gas remain important sources, Reducing CO2 emissions intensity of energy use
even in models with the lowest level of energy demand. Oil demand is projected to decline
modestly on average, and much more slowly than its natural rate of decline from existing
producing fields. Natural gas demand grows on average due to its many advantages, This chart shows global energy intensity (left axis) and CO2 emissions intensity (bottom axis).
including lower GHG emissions. As a result, new investments are required in both oil and
natural gas capacity to meet demand, even under the assessed 2°C scenarios. From 1980 to 2015, there have been large gains in efficiency, though energy-related CO2
emissions rose from 18 billion to 33 billion tonnes. The blue circle shown for 2040 indicates
Low-side energy growth rates for the above scenarios were also considered. The low-side these emissions are projected to be about 36 billion tonnes even with significant gains in
by energy source sees oil dropping 1.7 percent per year, natural gas dropping 0.8 percent efficiency and CO2 emissions intensity.
per year, and coal dropping 10.2 percent per year through 2040. This is compared with
high-side growth rates for bioenergy, nuclear and non-bio renewables of 14.1, 4.8 and 6.3 To be on a 450 ppm, or hypothetical 2°C pathway, the performance in 2040 likely needs to
percent per year, respectively. Even under these extremes, significant investments in oil and be significantly closer to the purple line, implying faster gains in efficiency and/or faster
natural gas capacity are required to offset natural field decline. reductions in CO2 emissions per unit of energy. This would increase the chance of reaching a
2°C pathway, with further gains required between 2040 and 2100.
Technology advances are expected to play a major role in accelerating progress toward a
2°C pathway. However, the International Energy Agency in 2018 estimated in its Tracking
Clean Energy Progress analysis that only four of 37 technologies are on track to help enable
reaching the Paris Agreement climate goals.
p.9 | exxonmobil.com2019 ENERGY & CARBON SUMMARY STRATEGY
Sensitivities included in our Outlook projections
Light-duty sensitivities
We use sensitivity analyses to provide greater perspective on how changes to our base Outlook assumptions could affect the energy landscape. The charts below depict potential
impacts to demand related to fuel economy and electric vehicle (EV) penetration (sensitivity #1), as well as a potential impact on demand assuming full EV penetration in light-duty
vehicles (sensitivity #2) along with an associated possible impact on electricity generation requirements. Further discussion on sensitivities can be found in the Outlook.
LIGHT-DUTY SENSITIVITY #1 LIGHT-DUTY SENSITIVITY #2
Liquids demand Liquids demand by sector Electricity demand Demand increase
(Million oil-equivalent barrels per day) (Million oil-equivalent barrels per day) (World – thousand TWh) (World – thousand TWh)
125 50 10
125
100% EV sensitivity Light-duty
liquids demand transportation
40 100% EV
t
100
100 Total liquids demand sensitivity
Outlook
75 Commercial 30
75 transportation
5 Other
renewables
50 20 Wind/Solar
50 Average new car fuel economy
of ~45 MPG in 2040 Chemicals Nuclear
(~50 MPG base assumption)
Light-duty liquids Gas
t
25 demand 25 10
Other industrial
t
Coal
~500 million electric vehicles
Power generation /
(~160 million base assumption)
Residential / Commercial
0 0 0 0 Oil
2000 2010 2020 2030 2040 2000 2010 2020 2030 2040 2000 2010 2020 2030 2040
• Shaded ranges are indicative of potential shifts • Sensitivity assumes the global light-duty vehicle fleet • Electricity to power an all-electric light-duty vehicle
in global demand relative to base Outlook is 100 percent electric by 2040, requiring all new light- fleet could increase electricity demand by about
duty vehicle sales to be electric by 2025 15 percent in 2040 relative to the base Outlook
• Liquids demand could fall about 1.2 million
barrels per day for every additional 100 million • Battery manufacturing capacity for electric cars would • About 25 percent of the additional electricity would
electric vehicles on the road in 2040 need to increase by more than 50 times from recent be sourced by natural gas assuming a fuel mix for
levels by 2025 electricity generation consistent with the Outlook
• Trends in fuel economy gains lower than the
Outlook basis could add more than 2 million • Total liquids demand in 2040 could be in line with • Under a 100 percent light-duty EV sensitivity, total
barrels per day of liquids demand by 2040 levels seen in 2013 energy-related CO2 emissions in 2040 could be
reduced by about 5 percent
p.10 | exxonmobil.com2019 ENERGY & CARBON SUMMARY STRATEGY
Outlook projections and potential sensitivities
Heavy-duty sensitivities
As a sensitivity analysis to our base Outlook, the left chart below depicts potential impacts to heavy-duty vehicle liquid demand related to changes in efficiency assumptions as well as
changes in the pace of alternative fuels penetration (sensitivity #1). The middle and right charts below depict a much deeper penetration of alternative fuels (sensitivity #2). Note that because
light-duty and heavy-duty fuels are produced from different segments within a barrel of oil, the impacts of light-duty and heavy-duty sensitivities on total liquids demand are independent and
not necessarily additive.
HEAVY-DUTY SENSITIVITY #1 HEAVY-DUTY SENSITIVITY #2
Liquids demand Heavy-duty fuels demand Liquids demand by sector
(Million oil-equivalent barrels per day) (Million oil-equivalent barrels per day) (Million oil-equivalent barrels per day)
125 30 125
Base Outlook
Liquids demand
Total liquids demand Efficiency gains sensitivity #2 Heavy-duty
25
100 100 transportation
t
Electric/Hydrogen
20 Light-duty
75 Natural gas 75 transportation
Biofuels
15 Air / Marine / Rail
transportation
50 Historical rate of efficiency improvements 50
(~2x historical base assumptions) 10
Oil Liquids Chemicals
t
25 Heavy-duty liquids demand 25
5 Other industrial
t
2x penetration of alternative fuels vs base in 2040 Power generation /
(~12% penetration in base) Residential / Commercial
0 0 0
2000 2010 2020 2030 2040 2000 2020 2040 2000 2020 2040
• Shaded ranges are indicative of potential shifts in • Hypothetical sensitivity to explore deep penetration of • Under sensitivity #2, total oil demand in the heavy-
global demand relative to the base Outlook, which alternative fuels; transition of the global vehicle fleet and duty sector could peak prior to 2025, declining by
includes faster energy intensity gains versus recent infrastructure build-out would need to accelerate 2040 to levels observed in the mid-2000s
global average significantly in the early 2020s
• Total liquids demand could peak by 2040 if this
• Liquids demand (including biofuels) in 2040 could fall • Sensitivity assumes 2040 share of alternative fuels such as penetration of alternative fuels in the heavy-duty
about 0.5 million barrels per day for every percent of electricity, biofuels, gas and hydrogen about three times the sector were realized
alternative fuels level in 2040 compared with the base Outlook at ~12%
• Increased electrification would likely drive increased
• Slower than expected efficiency improvements could • Transition assumes nearly 100% electrification of light demand for natural gas for both electricity and
add about 7 million barrels per day of liquids demand commercial vehicles, about 70% alternative fuels in medium hydrogen production
versus the base Outlook in 2040 commercial vehicles, and about 20% penetration of
alternative fuels in heavy-duty commercial vehicles
p.11 | exxonmobil.com2019 ENERGY & CARBON SUMMARY STRATEGY
Signposts for the evolving
energy landscape UP CLOSE:
Indicators for a 2°C pathway
Changes in the relative cost of new technology when compared
against existing or alternative energy sources may further increase
shifts in the global energy mix. Utilizing Company and external
sources, we monitor a variety of indicators that may serve as
signposts for potential acceleration in shifts to the energy
landscape, such as:
• New NDCs and significant policy initiatives broadly implemented,
such as carbon pricing
• Increasing electrification of energy systems
• Increasing penetration of renewables with technology
developments that reduce costs and increase reliability of energy
storage
• Development of scalable alternative energy technologies such as
advanced biofuels, leading to displacement of gasoline and
distillate in the fuels market
• Advances in CCS technology to lower cost
• Advances in significant new capacity expansions of multiple
technologies, as well as the associated financing that support
these expansions
• Energy efficiency gains exceeding historical trends
• Change in consumer preferences and growth in acceptance
of alternative energy technologies - including potentially
higher costs
Further details and discussion of assessed 2°C scenarios can be
found in the special section of the 2018 Outlook for Energy –
Pursuing a 2°C pathway.
p.12 | exxonmobil.com2019 ENERGY & CARBON SUMMARY STRATEGY
UP CLOSE:
Potential impact on proved reserves and
Significant investment still needed in 2°C scenarios
resources considering 2°C scenarios
Over the coming decades, oil and natural gas will continue to play a
critical role in meeting the world’s energy demand, even considering Considering the 2°C scenarios average, global liquids demand is projected to decline from 95 million barrels
the 2°C scenarios assessed in the previous section. The following per day in 2016 to about 78 million barrels per day in 2040. Using the lowest liquids demand growth rate
analysis is intended to address the potential impacts to the among the assessed 2°C scenarios, liquids demand would still be 53 million barrels per day in 2040, as seen
Company’s proved reserves(17) and resources(18) through 2040 and in the left chart below.(21) However, absent future investment, world liquids production to meet demand
beyond, considering the average of the assessed 2°C scenarios’ oil would be expected to decrease from 95 million barrels per day in 2016 to about 17 million barrels per day in
and natural gas growth rates (2°C scenarios average).(19) 2040. This decrease results from natural field decline, and the associated decline rate is expected to greatly
exceed the potential decline rate in global oil demand even under the lowest 2oC demand scenarios
At the end of 2017, ExxonMobil’s proved reserves totaled about
assessed. Natural gas natural field decline rates are generally similar to liquids.
21 billion oil-equivalent barrels, of which 57 percent were oil and
43 percent were natural gas. These proved reserves are assessed With the potential 2040 imbalance (absent future investment), the substantial majority of our proved reserves
annually and reported in our annual report on Form 10-K in that are projected to be produced by 2040 are clearly supported by ample demand, and therefore face little
accordance with the U.S. SEC rules. Proved reserves are the main risk related to the 2°C scenarios average.
driver of intrinsic value of an integrated oil and gas company’s
upstream operations.(20) Based on currently anticipated production Natural gas reserves face even less risk, as demand in 2040 is expected to increase under the 2°C scenarios
schedules, we estimate that by 2040 a substantial majority of our average versus 2016 demand levels.
year-end 2017 proved reserves will have been produced. Since the
Considering the IEA’s Sustainable Development Scenario (a 2°C scenario), the IEA estimates that more than
2°C scenarios average implies significant use of oil and natural gas
$13 trillion of investment will be needed for oil and natural gas supply for 2018-2040.(22)
through the middle of the century, we believe these reserves face little
risk from declining demand.
Global liquids supply estimates Global natural gas supply estimates
(Million oil-equivalent barrels per day) (Billion cubic feet per day)
For the remaining year-end 2017 proved reserves that are projected
to be produced beyond 2040, the reserves are generally associated 120 700
t Outlook demand
with assets where the majority of development costs are incurred t High 2oC scenario
Existing o
before 2040. While these proved reserves may be subject to more 100 supplies t High 2 C scenario 600 demand
demand
stringent climate-related policies in the future, targeted investments 95
500 t Outlook demand
could mitigate production-related emissions and associated costs. In 80 t Additional liquids to t Additional natural gas to
78 meet average estimated Existing 445
Estimated meet average estimated
addition, these assets have generally lower risk given the technical natural demand based on 400 supplies
demand based on
60 decline in assessed 2oC scenarios assessed 2oC scenarios
knowledge that accumulates over many decades of production. the
370
Estimated
absence of t Low 2oC scenario 300 natural
Accordingly, the production of these reserves will likely remain further demand decline in
40 investment the t Low 2oC scenario
economic even under the 2°C scenarios average. 200 absence of demand
further
investment
20
For producing assets that do not currently meet the SEC’s definition 100
of proved reserves, we expect to continue producing these assets
0 add gas decline
0 rate
through the end of their economic lives. We continue to enhance the
2016 2040 2016 2040
long-term viability of these assets through increased efficiency, cost
Excludes biofuels
reductions, and the deployment of new technologies and processes. Source: IEA, EM analyses Source: IHS, EM analyses
p.13 | exxonmobil.com2019 ENERGY & CARBON SUMMARY STRATEGY
UP CLOSE:
Potential impact on proved reserves and
resources considering 2°C scenarios, continued Reducing costs using technology to compete
Resources
At the end of 2017, ExxonMobil’s non-proved resources totaled about 76 billion oil-
Trillions of dollars of investment in oil and natural gas will be needed, even
equivalent barrels. The size and diversity of this undeveloped resource base provide us
considering a 2°C scenario. By leveraging high-impact technologies from our
with considerable flexibility to profitably develop new supplies to meet future energy
research organization, we can reduce costs and environmental impacts. This
demand and replenish our proved reserves. We also continue to enhance the quality of
positions our portfolio to continue to compete successfully.
our resources through successful exploration drilling, acquisitions, divestments, and
ongoing development planning and appraisal activities. Examples of technology-enabled cost and environmental footprint reductions:
The underlying economics of commercializing and producing resources are dependent on • Record-setting extended-reach wells in Sakhalin to significantly reduce drilling
a number of factors that are assessed using a dynamic resource development process, as costs and environmental footprints
highlighted further in the box on the following page. We seek to advance the best
resource opportunities and monetize or exit lower potential assets. As noted before, the • Full-physics modeling and next-generation completion designs for
world will continue to require significant investment in both liquids and natural gas, even unconventional developments to reduce drilling and improve recovery
under the assessed 2°C scenarios. Under the 2°C scenarios average, ExxonMobil still
• Combination of horizontal drilling with hydraulic fracturing to significantly
would need to replenish approximately 35 billion oil-equivalent barrels of proved reserves
reduce land surface footprint and cost
by 2040, assuming the Company retains its current share of global production over that
time period.(23)
Drilling and completion cost reduction
In light of the multiple factors that will influence decisions to commercialize undeveloped
resources, it is not possible to identify which specific assets ultimately will be operated Midland Basin horizontal wells
commercialized and produced. As we consider the implied oil and natural gas demand to ($/Oil-equivalent barrel)
2040 under the 2°C scenarios average, it is possible that some higher-cost assets, which
could be impacted by many factors including future climate-related policy, may not be 30
developed. We are confident, however, that the size, diversity and continued upgrading of
our undeveloped resources, along with technology developments, will enable the
ongoing replenishment of our proved reserves for decades to come under a range of
potential future demand scenarios.
20
73%
Reduction in development cost
We test our investments over a wide range of commodity price assumptions and market
conditions. Notably, the IEA’s estimates of future prices under its 2°C pathway fall within 10
the range we use to test our investments.(24) Additionally, over our long history we have
successfully competed in periods where supply exceeds demand. In such a business
environment, the lowest cost of supply will be advantaged. ExxonMobil’s long-standing 0
focus on efficiency and continuous improvement will position us to compete successfully. 2014 2015 2016 2017
p.14 | exxonmobil.com2019 ENERGY & CARBON SUMMARY STRATEGY
Potential impact on proved reserves and UP CLOSE:
resources considering 2°C scenarios, continued Dynamic resource development planning
Lastly, a portion of our non-proved resources represent unconventional
liquids assets in the United States. These assets have shorter This process considers a wide range of variables over time, including as appropriate: the extent and
development cycles than other capital-intensive resources, which we quality of the resource, development concepts, fiscal terms, regulatory requirements, proximity to
believe make this class of assets resilient under the 2°C scenarios existing infrastructure, market conditions, enabling technologies, and policy developments, including
average. Natural gas assets form another portion of our non-proved climate-related policy.
resources. The 2°C scenarios average anticipates demand growth of this
cleaner-burning fuel in the future, making these assets resilient under the We optimize our resource development plans in line with these variables and prioritize developments
2°C scenarios average. Our remaining undeveloped liquids resources, in that are competitively advantaged in delivering long-term shareholder value. Decisions can range from
some cases, may not be attractive investments under the 2°C scenarios developing the resource (which eventually moves to proved reserves), monetizing the resource by
average, assuming no advances in technology, processes or designs. selling it to others, or exiting the acreage.
However, the carrying value of these undeveloped liquids resources is
less than 5 percent of ExxonMobil’s total net book value of property, With a very large resource base, this process can take decades as technologies are developed, market
plant and equipment as of September 30, 2018.(25) conditions change and competition evolves. Two examples illustrate this:
Hebron Scarborough
The Hebron field in Eastern Canada was In contrast, we monetized Scarborough through sale of
originally discovered in 1980. Continuous the asset, which was originally discovered in 1979. After
reoptimization of the development an evaluation of our portfolio, we sold it in 2018 to
concept over multiple decades allowed enable ExxonMobil to focus on more profitable LNG
this field to be brought on line in 2017. opportunities.
Dynamic resource development planning to
maximize value Monetize
Development Development
Resource Develop
planning decision
Reoptimize Exit acreage
Resource definition Fiscal terms Environmental Market
impact analysis development
Development concept Regulatory Infrastructure Enabling
and cost requirements availability technology
p.15 | exxonmobil.com2019 ENERGY & CARBON SUMMARY STRATEGY
Positioning for a lower-carbon energy future
Strengthened by integration across our businesses, we are well-positioned to capture value across the entire ExxonMobil Downstream product shift
supply chain, from well to customer, and throughout the commodity price cycle. Our proven business strategy, (2025 vs. 2017)
underpinned by leading-edge technology, has allowed ExxonMobil to transition our products over time to
%
meet demand while maintaining our competitiveness as a low cost supplier and efficient operator. Our 50
success is predicated on relentlessly operating safely and responsibly, taking care of people and the
environment, while addressing the risks of climate change.
Upstream
Even in the assessed 2°C scenarios, oil and natural gas remain important energy types over time. By 2040, oil
demand is projected to decline modestly, while natural gas demand is projected to grow. Upstream's focus on
2017
leading-edge technologies, coupled with industry-leading financial capacity, has enabled ExxonMobil to Prices 0
capture our best investment portfolio in decades. Our growth opportunities are geographically diverse and $47/bbl $64/bbl $88/bbl $65/bbl $98/bbl
are expected to yield attractive returns, even in a low-price environment. As one of the largest natural gas
producers in the United States, and a significant producer of liquefied natural gas around the world, we are
well-positioned for the demand shift from coal to natural gas for power generation and industrial use.
Fuels & Lubricants
Decrease in demand for certain products may result in capacity rationalization, which our industry has -50
experienced for decades. For example, over the past 20 years the global refining sector has continued to add Fuel oil Gasoline Chemical Diesel/Jet Lube
new large, highly efficient capacity, leading to shutdown of smaller, less-efficient capacity. During this period, feedstock basestock
we have strengthened our refining business by divesting less competitive facilities (we divested 22 of 43
refinery sites since 2000) and redeploying resources and capital to more efficient sites that are integrated with 2017 prices source: Platts, Argus and IHS
chemical and lubricant manufacturing facilities. ExxonMobil refining is a leader in energy efficiency.(26) In
addition, we continue to deploy technologies in our refineries to improve the mix of products consistent with ExxonMobil Chemical average earnings(27)
demand trends (see top right chart). This continuous high-grading of our portfolio has positioned our Fuels & (Billion USD)
Lubricants business to remain competitive across a wider range of potential future scenarios. 4
Chemical
ExxonMobil Chemical Company's annual earnings have grown from less than $1 billion USD in 1987 to more
than $4 billion USD in 2017. Demand for our products has doubled since 2000, outpacing GDP growth in
many regions. Over the next few decades, we expect this demand to continue to grow at about 4 percent
annually. Investment in technology and new capacity enables us to support the growing demand for chemical
products worldwide. We have a strong market position in every business line we operate, particularly in high-
performance products such as advanced materials that make cars lighter and more fuel efficient, and
materials for packaging that reduces the energy needed to ship goods around the world. And we are
0
committed to helping our customers reduce their GHG emissions while meeting the growing demand for
Decade ending 1987 1997 2007 2017
these products.
p.16 | exxonmobil.com2019 ENERGY & CARBON SUMMARY STRATEGY
Developing scalable
technology solutions
ExxonMobil has been at the forefront of many technologies that have enabled energy to be employees working in our R&D organizations around the world to potentially accelerate
produced and delivered in a safe, affordable and sustainable manner. Our ability to reliably the delivery of new technologies.
provide for society's energy needs today were unimaginable when the industry first emerged.
Over the past century, we have seen firsthand how technology has enabled us to respond to We are advancing fundamental science and applying technologies in a number of areas
the ever-changing energy landscape (see our innovation timeline below, noting significant that could lead to breakthroughs, redefining our manufacturing processes and products.
innovation by our scientists and engineers). As the world demands more energy and fewer We have ongoing work in advanced biofuels, catalysts, materials and manufacturing
emissions, we are well-positioned to develop scalable, high-impact solutions to reduce processes. Successful developments here could change our future and our impact on the
emissions in power generation, industry and transportation. Our work with university energy environment. We are excited about the promise of this portfolio and have devoted the
centers enables us to extend the technical capabilities of our 2,200 scientists and 5,000 next few pages to elaborate on each program's criticality in addressing the Paris
Agreement goals.
ExxonMobil: A history of innovation
High octane Mobil 1™ synthetic 3D Advanced Extended- Process Advanced
gasoline lubricant seismic metallurgy reach drilling intensification biofuels
Tire Synthetic Lithium Ultra-deepwater Ultra-low Mobil 1™ Improved Next generation
rubber catalyst batteries development sulfur diesel annual resource carbon capture
protection capture and storage
p.17 | exxonmobil.com2019 ENERGY & CARBON SUMMARY STRATEGY
Carbon Capture & Storage (CCS)
Since 1970, ExxonMobil has cumulatively captured more CO2 than any other company -
Cumulative CO2 capture volume since 1970
accounting for more than 40 percent of cumulative CO2 captured.(28) We have a working
(Million tonnes)
interest in more than one-fifth of the world’s carbon capture capacity, capturing nearly
7 million tonnes of CO2 in 2017. While a leader in CCS, we are looking to expand our capacity
and are evaluating multiple opportunities that have the potential to be commercially viable
through the convergence of advantaged technologies and a supportive policy environment.
Company A
ExxonMobil is working to develop new CO2 capture technologies with a goal of reducing
Company B
costs, complexity of operation and need for large initial capital investments. For example,
ExxonMobil and FuelCell Energy, Inc. have partnered to develop CO2 capture technologies
Company C
using carbonate fuel cells. This novel approach has the potential to be less costly and easier to
operate than existing technologies, while being deployable in a modular fashion with Company D
applicability to multiple industry settings.
Sum of remaining 39 companies
ExxonMobil is also researching subsurface CO2 storage capability by leveraging decades of
experience in the exploration, development and production of hydrocarbon resources. This
expertise is key to permanently storing CO2 deep underground safely and securely. For
example, we are collaborating with leading universities around the world to better characterize
subsurface storage capacity and develop improved CO2 monitoring technologies and
techniques.
Advancing scalable technologies is only one part of achieving large-scale deployment of CCS.
Equal policy treatment of CCS, relative to other low-carbon energy solutions, is also needed.
While policies will need to create financial drivers, measures to create favorable regulatory and
legal environments are also needed. These measures will need to address a wide range of
issues, such as potential legal uncertainty of storage space ownership, and reasonable
measurement, reporting and verification standards for injected CO2. ExxonMobil actively
advocates for appropriate policy measures to encourage the large-scale deployment of CCS.
“Without CCUS as part of the solution, reaching our
climate goals is almost impossible.”
— Fatih Birol, Executive Director of IEA, Twitter on November 26, 2018
The Shute Creek Gas Plant in Wyoming. CCS will be an important long-term
technology to reduce emissions.
p.18 | exxonmobil.com2019 ENERGY & CARBON SUMMARY STRATEGY
Advanced biofuels ExxonMobil advanced biofuels program
ExxonMobil continues to progress research on advanced biofuels to produce fuels from algae
and cellulosic biomass with the potential to reduce GHG emissions by 50 percent or more
Modified Photosynthetic Oil
compared to today's transportation fuels. Our advanced biofuels research portfolio includes algae growth accumulation
joint research collaborations focused on algae-based biofuels with Synthetic Genomics, Inc.
(SGI), Colorado School of Mines and Michigan State University. Our partnership with
Renewable Energy Group (REG) has demonstrated the ability to convert sugars from a variety Oil
of non-edible biomass sources into biodiesel by utilizing REG's patented bio-conversion CO2
technology. ExxonMobil and REG signed a joint research agreement with Clariant to evaluate Sunlight
Water
the potential to combine Clariant’s and REG’s processes into an integrated cellulosic biomass- Nutrients
to-biodiesel technology. These programs on advanced biofuels will lead to a better
understanding of new technologies with the transformative potential to increase supplies of
high-quality, low-carbon diesel while reducing GHG emissions.
Biomass Conversion Bio-conversion
Targeting technical capability to produce 10 KBD by 2025 growth to sugars to fuel
ExxonMobil and SGI have been working together to turn algae into a low-emission
transportation fuel for almost a decade. We are applying our fundamental understanding to
develop strains of algae that convert CO2 into a large amount of energy-rich fat, which can
then be processed (similar to crude oil) into renewable diesel. It is an ambitious project that
HIGHLIGHT: Conceptual comparison of land usage required
has already achieved important breakthroughs. The research now also involves an outdoor
field study in California. There, researchers are growing algae at a much larger scale than the Significant to produce biofuels
sample-size quantities used in our labs. ExxonMobil is targeting technical capability to productivity
produce 10 KBD of algae biofuels by 2025. from algae
Fuel of the future
In the future, algae
Currently in the United States, the average corn ethanol plant capacity is 5 KBD(29) and the should require
average yield is 400 gallons per acre.(30) This compares to 650 gallons per acre for palm oil and significantly less
only 50 gallons per acre for soybean oil.(31) Biofuel yields from algae are potentially much land usage to
higher – currently 2,000 gallons or more per acre,(32)(33) or more than five times the yield of produce the same
amount of biofuels
corn ethanol and 40 times the yield of soybean oil. This level of productivity for algae has
compared to
been demonstrated outdoors on a small-scale pilot (< 0.25 acres),(34) indicating that, for a traditional biofuels
given quantity of biofuel, algae should require much less land area than traditional biofuels. today.
Therefore, we are working to improve algae productivity, which could result in even less land
usage than technically achievable today (see right chart). Algae can also be grown on
marginal lands and in brackish water, thus reducing the overall environmental footprint,
making algae an attractive, viable low-emissions biofuel. Researchers are working to
understand fundamental engineering parameters, including pond design and mixing, as well
as strain performance. The algae field study will lead to an improved understanding of how to
globally scale the technology.
p.19 | exxonmobil.comYou can also read